Embed Size (px)
Citation preview
http://www.iaeme.com/IJCIET/index.asp 878 [email protected]
International Journal of Civil Engineering and Technology (IJCIET)
Volume 9, Issue 3, March 2018, pp. 878–886, Article ID: IJCIET_09_03_087
Available online at http://www.iaeme.com/ijciet/issues.asp?JType=IJCIET&VType=9&IType=3
ISSN Print: 0976-6308 and ISSN Online: 0976-6316
© IAEME Publication Scopus Indexed
SEISMIC PERFORMANCE OF HIGH-RISE
BUILDING
Somil Khattar
Student, School of Mechanical and Building Sciences, VIT University,
Tamilnadu, Chennai, India
Muthumani K
Professor, School of Mechanical and Building Sciences, VIT University,
Tamilnadu, Chennai, India
ABSTRACT
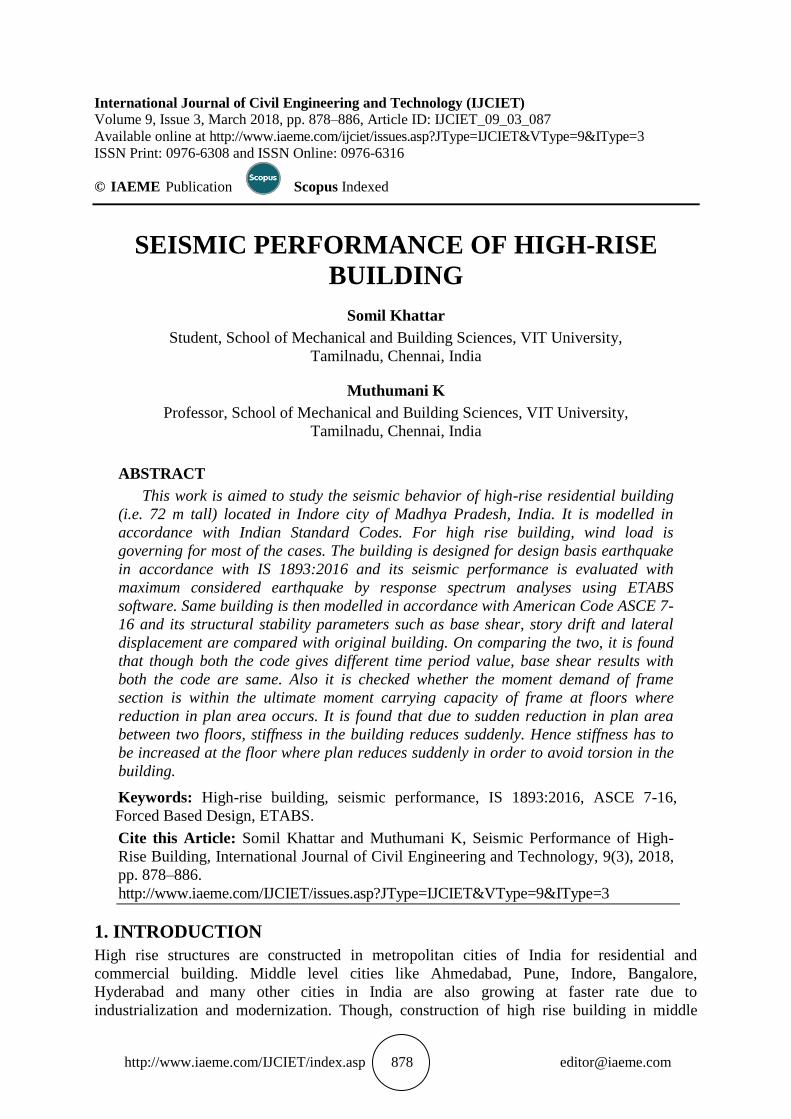
This work is aimed to study the seismic behavior of high-rise residential building
(i.e. 72 m tall) located in Indore city of Madhya Pradesh, India. It is modelled in
accordance with Indian Standard Codes. For high rise building, wind load is
governing for most of the cases. The building is designed for design basis earthquake
in accordance with IS 1893:2016 and its seismic performance is evaluated with
maximum considered earthquake by response spectrum analyses using ETABS
software. Same building is then modelled in accordance with American Code ASCE 7-
16 and its structural stability parameters such as base shear, story drift and lateral
displacement are compared with original building. On comparing the two, it is found
that though both the code gives different time period value, base shear results with
both the code are same. Also it is checked whether the moment demand of frame
section is within the ultimate moment carrying capacity of frame at floors where
reduction in plan area occurs. It is found that due to sudden reduction in plan area
between two floors, stiffness in the building reduces suddenly. Hence stiffness has to
be increased at the floor where plan reduces suddenly in order to avoid torsion in the
building.
Keywords: High-rise building, seismic performance, IS 1893:2016, ASCE 7-16,
Forced Based Design, ETABS.
Cite this Article: Somil Khattar and Muthumani K, Seismic Performance of High-
Rise Building, International Journal of Civil Engineering and Technology, 9(3), 2018,
pp. 878–886.
http://www.iaeme.com/IJCIET/issues.asp?JType=IJCIET&VType=9&IType=3
1. INTRODUCTION
High rise structures are constructed in metropolitan cities of India for residential and
commercial building. Middle level cities like Ahmedabad, Pune, Indore, Bangalore,
Hyderabad and many other cities in India are also growing at faster rate due to
industrialization and modernization. Though, construction of high rise building in middle
Somil Khattar and Muthumani K
http://www.iaeme.com/IJCIET/index.asp 879 [email protected]
level cities will be same as that of metropolitan cities but to carry out as a mass scale; faster
construction technique, innovative design, economical construction material and some better
construction management technique needs to be evolved in view of environmental protection.
Compared to gravity loads, earthquake load effects (i.e. forces and moment in column) are
variable and it increases with increase in height. Earthquake resistant design of structure is a
function of height and location of the structure, total mass and soil characteristics. It has been
observed that structure can carry most of the earthquake load due to infill walls present in the
structure. As the height of structure increases, then the requirement for adequate stability (i.e.
resistance to overturning moment) and rigidity (i.e. resistance to lateral deflection) becomes
important. There are two ways to overcome these requirements in a structure. One is to
increase the size of the member beyond the strength requirement. However this approach is
not feasible, as it becomes impractical and uneconomical to increase the size of member
beyond its limit. Whereas, the second one is to change the form of the structure into more stiff
and stable to increase stability and to overcome the deflection. For safety purpose, the design
and analysis of buildings is very important. The forces and displacements are calculated for
various load combination conforming to Indian Standard Design Code and each structural
element will be designed for the critical one. Lateral forces due to earthquake loads increases
rapidly for high-rise buildings. Shear wall is one of the best lateral load resisting structural
systems, which is stiff as well as stable for building while designing for lateral loads.
2. BUILDING CONFIGURATION AND LOADING PARAMETERS
Residential building located in Indore district of Madhya Pradesh, India is considered for the
study. It consists of 3 basements, Ground Floor and 24 stories. It is located at Indore which lie
in seismic zone III according to IS 1893:2016 (Part 1). From geotechnical report, medium soil
is considered for designing purpose. Total height of the building (Ground floor plan to
Terrace slab) is 72 m. Plan dimension in X and Y direction is 34.17 and 26.80 m respectively.
Three basements are used for parking and service plant room. Ground Floor (GF), First
Floor (FF), Second Floor (SF) and Third Floor (TF) Slab Level are used for parking purpose.
Fourth floor slab is used for health club and swimming pool and above 20 stories are used for
residential purpose. Floor height for two lower basement and upper basement is 3.3 m and 3.8
m, respectively. All floor above Ground floor level are 3 m in height.
Conventional Flat slab with drop is provided at all the basement. At all typical level,
conventional beam-slab with core walls and shear wall is provided to resist lateral loads
imposed on the building. ETABS software is used for modelling of the building.
2.1. Materials Used
The concrete strength adopted varies depending on element and floor level. Grade of concrete
used for beams and slabs up to ground floor slab level is M35 and above ground floor slab, it
is M25. Grade of concrete used for columns and core wall varies as:
Up to 4th
floor roof slab level – M50
Above 4th
floor slab up to 8th
floor roof slab level – M45
Above 8th
floor slab up to 13th
floor roof slab level – M40
Above 13th
floor slab up to 17th
floor roof slab level – M35
Above 17th
floor roof slab level – M30

Seismic Performance of High-Rise Building
http://www.iaeme.com/IJCIET/index.asp 880 [email protected]
2.2. Loading Parameters
2.2.1. Dead Load and Live Load
Dead Load and Live Load are applied in the building as per IS 875(Part-1): (1987) and IS
875(Part-2) : 1987 [11]
, respectively.
2.2.2. Wind Load
Wind Load is applied as per IS 875(Part-3): 1987 [11]
. Basic wind speed (Vb) for Indore = 39
m/s. Design wind speed (Vz) = Vb x K1 x K2 x K3
Where,
K1 = Risk factor = 1
K2 = Terrain and height factor (Category 4 and Building Class B)
K3 = Topography factor = 1
Figure 1 Residential plan and 3D view of the building
3. ANALYSIS OF BUILDING AS PER IS 1893:2016 [9]
Building is designed as ductile shear wall with Ordinary moment resisting frame. As per IS
1893:2016 (Part 1), response reduction factor „R‟ is taken as 4.5. Time period is considered as
per IS 1893:2016, considering infill time period formula: Ta = 0.09 x h / √ d - (1)
Time period for x and y direction is found as 1.108 and 1.25 sec, respectively.
3.1. Linear Static Analysis
Static Analysis is carried out considering Infill Time period and only Earthquake force are
considered for this analysis. Result for Static Analysis are as shown below.
Somil Khattar and Muthumani K
http://www.iaeme.com/IJCIET/index.asp 881 [email protected]
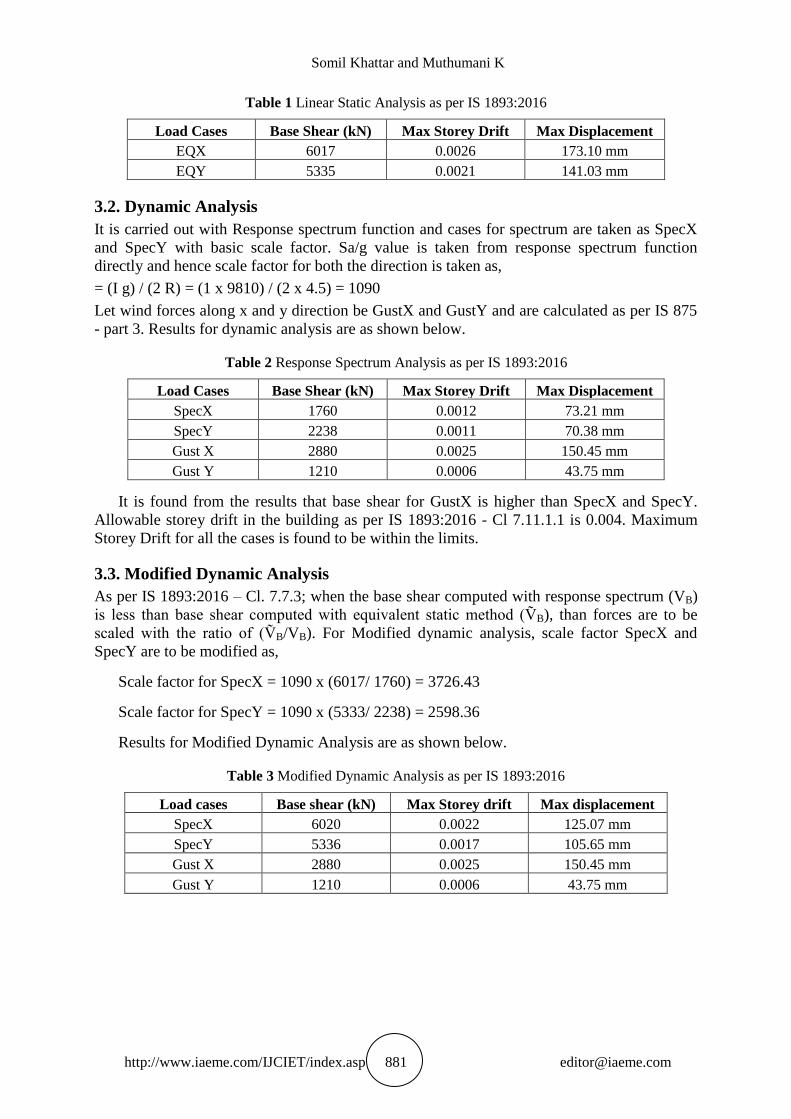
Table 1 Linear Static Analysis as per IS 1893:2016
Load Cases Base Shear (kN) Max Storey Drift Max Displacement
EQX 6017 0.0026 173.10 mm
EQY 5335 0.0021 141.03 mm
3.2. Dynamic Analysis
It is carried out with Response spectrum function and cases for spectrum are taken as SpecX
and SpecY with basic scale factor. Sa/g value is taken from response spectrum function
directly and hence scale factor for both the direction is taken as,
= (I g) / (2 R) = (1 x 9810) / (2 x 4.5) = 1090
Let wind forces along x and y direction be GustX and GustY and are calculated as per IS 875
- part 3. Results for dynamic analysis are as shown below.
Table 2 Response Spectrum Analysis as per IS 1893:2016
Load Cases Base Shear (kN) Max Storey Drift Max Displacement
SpecX 1760 0.0012 73.21 mm
SpecY 2238 0.0011 70.38 mm
Gust X 2880 0.0025 150.45 mm
Gust Y 1210 0.0006 43.75 mm
It is found from the results that base shear for GustX is higher than SpecX and SpecY.
Allowable storey drift in the building as per IS 1893:2016 - Cl 7.11.1.1 is 0.004. Maximum
Storey Drift for all the cases is found to be within the limits.
3.3. Modified Dynamic Analysis
As per IS 1893:2016 – Cl. 7.7.3; when the base shear computed with response spectrum (VB)
is less than base shear computed with equivalent static method (ṼB), than forces are to be
scaled with the ratio of (ṼB/VB). For Modified dynamic analysis, scale factor SpecX and
SpecY are to be modified as,
Scale factor for SpecX = 1090 x (6017/ 1760) = 3726.43
Scale factor for SpecY = 1090 x (5333/ 2238) = 2598.36
Results for Modified Dynamic Analysis are as shown below.
Table 3 Modified Dynamic Analysis as per IS 1893:2016
Load cases Base shear (kN) Max Storey drift Max displacement
SpecX 6020 0.0022 125.07 mm
SpecY 5336 0.0017 105.65 mm
Gust X 2880 0.0025 150.45 mm
Gust Y 1210 0.0006 43.75 mm
Seismic Performance of High-Rise Building
http://www.iaeme.com/IJCIET/index.asp 882 [email protected]
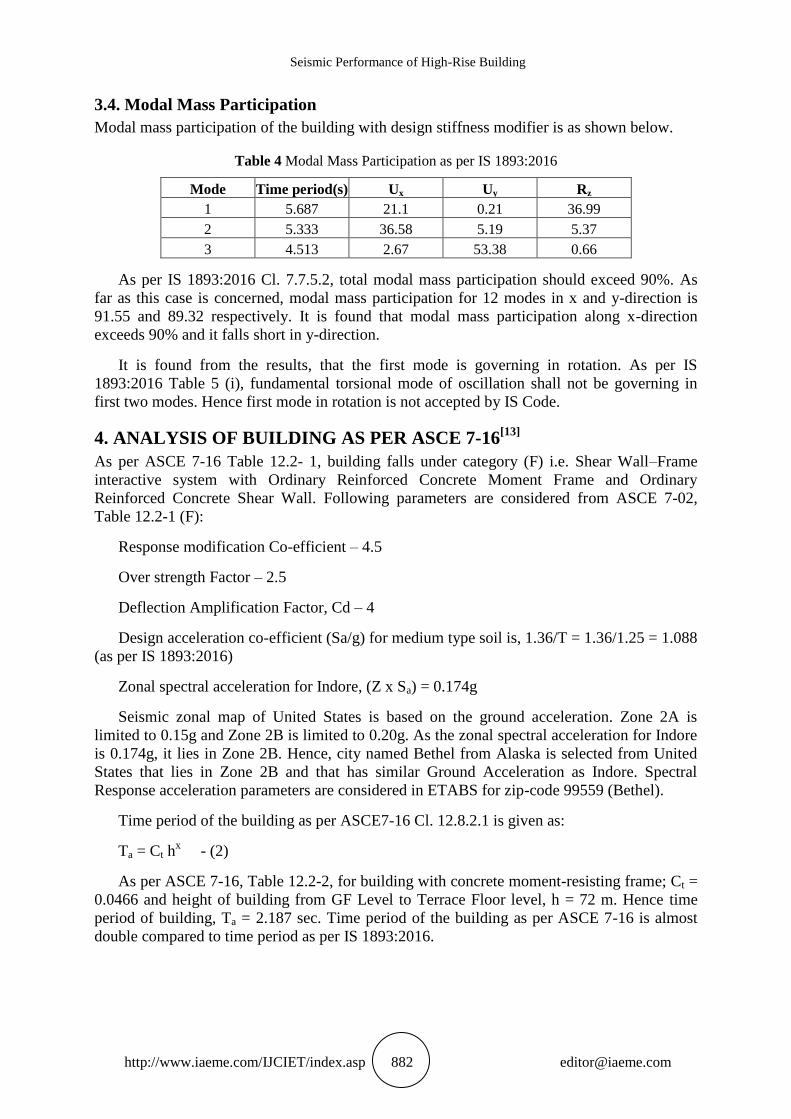
3.4. Modal Mass Participation
Modal mass participation of the building with design stiffness modifier is as shown below.
Table 4 Modal Mass Participation as per IS 1893:2016
Mode Time period(s) Ux Uy Rz
1 5.687 21.1 0.21 36.99
2 5.333 36.58 5.19 5.37
3 4.513 2.67 53.38 0.66
As per IS 1893:2016 Cl. 7.7.5.2, total modal mass participation should exceed 90%. As
far as this case is concerned, modal mass participation for 12 modes in x and y-direction is
91.55 and 89.32 respectively. It is found that modal mass participation along x-direction
exceeds 90% and it falls short in y-direction.
It is found from the results, that the first mode is governing in rotation. As per IS
1893:2016 Table 5 (i), fundamental torsional mode of oscillation shall not be governing in
first two modes. Hence first mode in rotation is not accepted by IS Code.
4. ANALYSIS OF BUILDING AS PER ASCE 7-16[13]
As per ASCE 7-16 Table 12.2- 1, building falls under category (F) i.e. Shear Wall–Frame
interactive system with Ordinary Reinforced Concrete Moment Frame and Ordinary
Reinforced Concrete Shear Wall. Following parameters are considered from ASCE 7-02,
Table 12.2-1 (F):
Response modification Co-efficient – 4.5
Over strength Factor – 2.5
Deflection Amplification Factor, Cd – 4
Design acceleration co-efficient (Sa/g) for medium type soil is, 1.36/T = 1.36/1.25 = 1.088
(as per IS 1893:2016)
Zonal spectral acceleration for Indore, (Z x Sa) = 0.174g
Seismic zonal map of United States is based on the ground acceleration. Zone 2A is
limited to 0.15g and Zone 2B is limited to 0.20g. As the zonal spectral acceleration for Indore
is 0.174g, it lies in Zone 2B. Hence, city named Bethel from Alaska is selected from United
States that lies in Zone 2B and that has similar Ground Acceleration as Indore. Spectral
Response acceleration parameters are considered in ETABS for zip-code 99559 (Bethel).
Time period of the building as per ASCE7-16 Cl. 12.8.2.1 is given as:
Ta = Ct hx - (2)
As per ASCE 7-16, Table 12.2-2, for building with concrete moment-resisting frame; Ct =
0.0466 and height of building from GF Level to Terrace Floor level, h = 72 m. Hence time
period of building, Ta = 2.187 sec. Time period of the building as per ASCE 7-16 is almost
double compared to time period as per IS 1893:2016.
Somil Khattar and Muthumani K
http://www.iaeme.com/IJCIET/index.asp 883 [email protected]
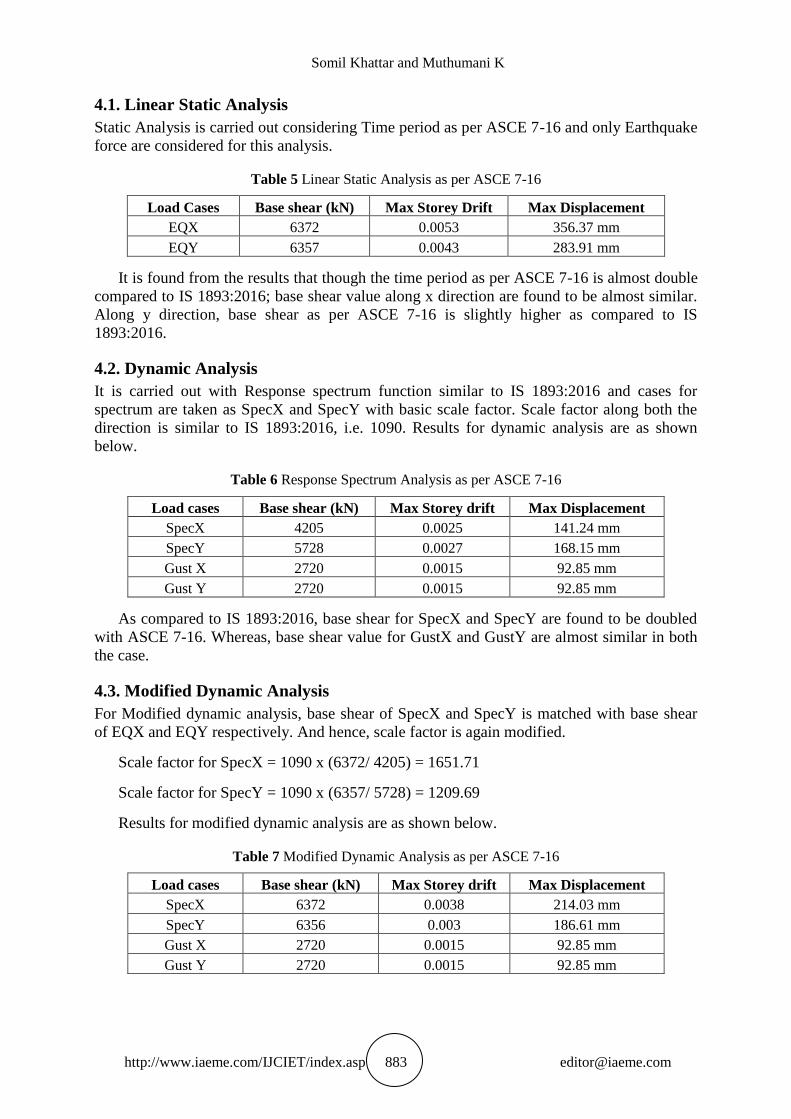
4.1. Linear Static Analysis
Static Analysis is carried out considering Time period as per ASCE 7-16 and only Earthquake
force are considered for this analysis.
Table 5 Linear Static Analysis as per ASCE 7-16
Load Cases Base shear (kN) Max Storey Drift Max Displacement
EQX 6372 0.0053 356.37 mm
EQY 6357 0.0043 283.91 mm
It is found from the results that though the time period as per ASCE 7-16 is almost double
compared to IS 1893:2016; base shear value along x direction are found to be almost similar.
Along y direction, base shear as per ASCE 7-16 is slightly higher as compared to IS
1893:2016.
4.2. Dynamic Analysis
It is carried out with Response spectrum function similar to IS 1893:2016 and cases for
spectrum are taken as SpecX and SpecY with basic scale factor. Scale factor along both the
direction is similar to IS 1893:2016, i.e. 1090. Results for dynamic analysis are as shown
below.
Table 6 Response Spectrum Analysis as per ASCE 7-16
Load cases Base shear (kN) Max Storey drift Max Displacement
SpecX 4205 0.0025 141.24 mm
SpecY 5728 0.0027 168.15 mm
Gust X 2720 0.0015 92.85 mm
Gust Y 2720 0.0015 92.85 mm
As compared to IS 1893:2016, base shear for SpecX and SpecY are found to be doubled
with ASCE 7-16. Whereas, base shear value for GustX and GustY are almost similar in both
the case.
4.3. Modified Dynamic Analysis
For Modified dynamic analysis, base shear of SpecX and SpecY is matched with base shear
of EQX and EQY respectively. And hence, scale factor is again modified.
Scale factor for SpecX = 1090 x (6372/ 4205) = 1651.71
Scale factor for SpecY = 1090 x (6357/ 5728) = 1209.69
Results for modified dynamic analysis are as shown below.
Table 7 Modified Dynamic Analysis as per ASCE 7-16
Load cases Base shear (kN) Max Storey drift Max Displacement
SpecX 6372 0.0038 214.03 mm
SpecY 6356 0.003 186.61 mm
Gust X 2720 0.0015 92.85 mm
Gust Y 2720 0.0015 92.85 mm
Seismic Performance of High-Rise Building
http://www.iaeme.com/IJCIET/index.asp 884 [email protected]
5. RESULTS AND DISCUSSION
5.1. Comparison of Results between IS 1893:2016 AND ASCE 7-16
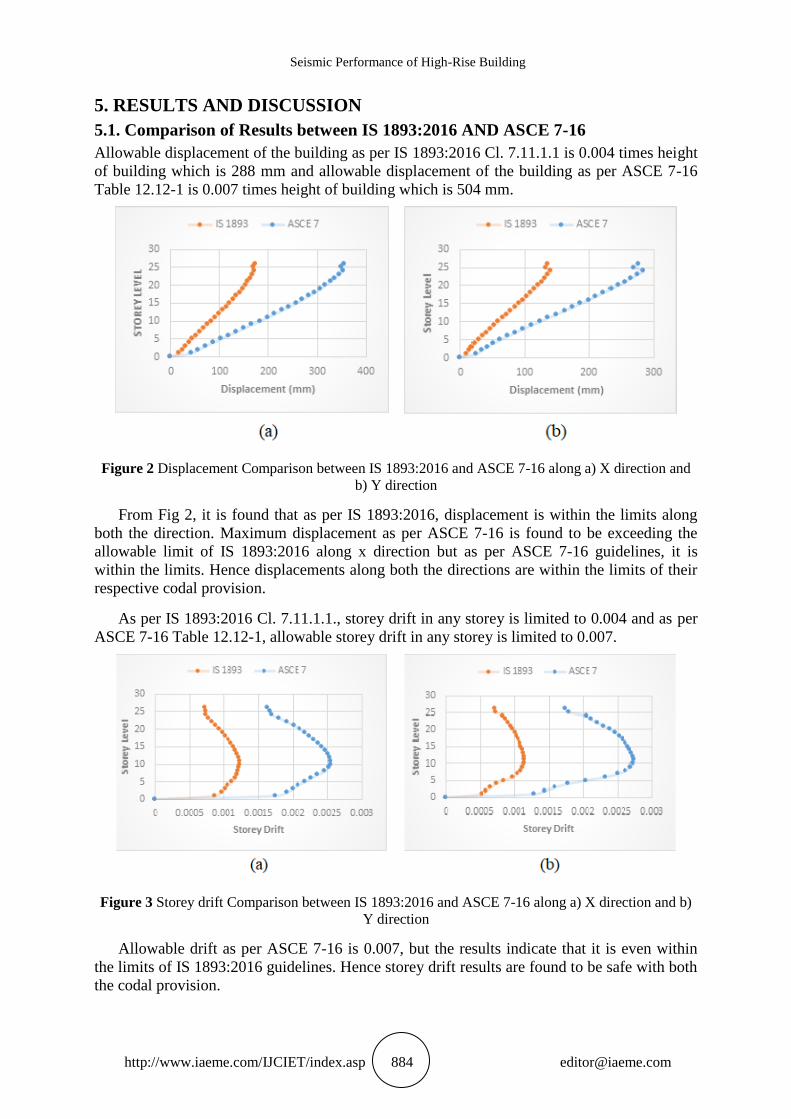
Allowable displacement of the building as per IS 1893:2016 Cl. 7.11.1.1 is 0.004 times height
of building which is 288 mm and allowable displacement of the building as per ASCE 7-16
Table 12.12-1 is 0.007 times height of building which is 504 mm.
Figure 2 Displacement Comparison between IS 1893:2016 and ASCE 7-16 along a) X direction and
b) Y direction
From Fig 2, it is found that as per IS 1893:2016, displacement is within the limits along
both the direction. Maximum displacement as per ASCE 7-16 is found to be exceeding the
allowable limit of IS 1893:2016 along x direction but as per ASCE 7-16 guidelines, it is
within the limits. Hence displacements along both the directions are within the limits of their
respective codal provision.
As per IS 1893:2016 Cl. 7.11.1.1., storey drift in any storey is limited to 0.004 and as per
ASCE 7-16 Table 12.12-1, allowable storey drift in any storey is limited to 0.007.
Figure 3 Storey drift Comparison between IS 1893:2016 and ASCE 7-16 along a) X direction and b)
Y direction
Allowable drift as per ASCE 7-16 is 0.007, but the results indicate that it is even within
the limits of IS 1893:2016 guidelines. Hence storey drift results are found to be safe with both
the codal provision.
Somil Khattar and Muthumani K
http://www.iaeme.com/IJCIET/index.asp 885 [email protected]
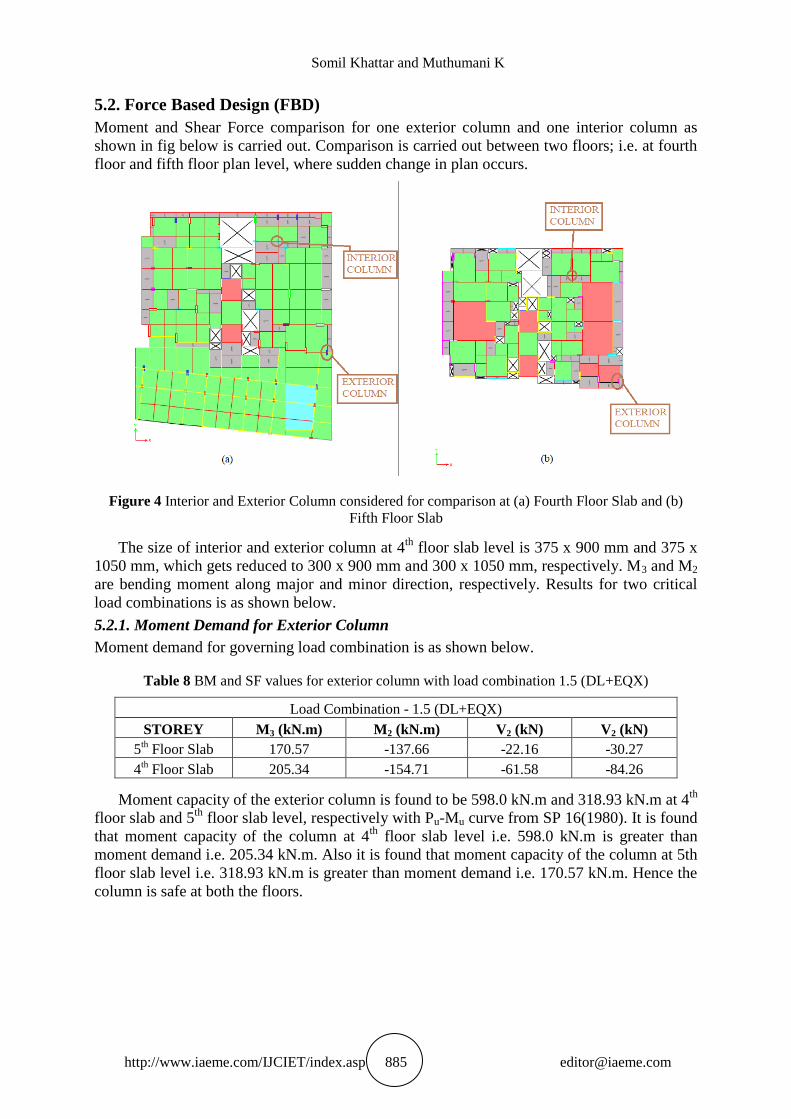
5.2. Force Based Design (FBD)
Moment and Shear Force comparison for one exterior column and one interior column as
shown in fig below is carried out. Comparison is carried out between two floors; i.e. at fourth
floor and fifth floor plan level, where sudden change in plan occurs.
Figure 4 Interior and Exterior Column considered for comparison at (a) Fourth Floor Slab and (b)
Fifth Floor Slab
The size of interior and exterior column at 4th
floor slab level is 375 x 900 mm and 375 x
1050 mm, which gets reduced to 300 x 900 mm and 300 x 1050 mm, respectively. M3 and M2
are bending moment along major and minor direction, respectively. Results for two critical
load combinations is as shown below.
5.2.1. Moment Demand for Exterior Column
Moment demand for governing load combination is as shown below.
Table 8 BM and SF values for exterior column with load combination 1.5 (DL+EQX)
Load Combination - 1.5 (DL+EQX)
STOREY M3 (kN.m) M2 (kN.m) V2 (kN) V2 (kN)
5th Floor Slab 170.57 -137.66 -22.16 -30.27
4th Floor Slab 205.34 -154.71 -61.58 -84.26
Moment capacity of the exterior column is found to be 598.0 kN.m and 318.93 kN.m at 4th
floor slab and 5th
floor slab level, respectively with Pu-Mu curve from SP 16(1980). It is found
that moment capacity of the column at 4th
floor slab level i.e. 598.0 kN.m is greater than
moment demand i.e. 205.34 kN.m. Also it is found that moment capacity of the column at 5th
floor slab level i.e. 318.93 kN.m is greater than moment demand i.e. 170.57 kN.m. Hence the
column is safe at both the floors.
Seismic Performance of High-Rise Building
http://www.iaeme.com/IJCIET/index.asp 886 [email protected]
5.2.2. Moment Demand for Interior Column
Moment demand for governing load combination is as shown below:
Table 9 BM and SF values for interior column with load combination 1.5 (DL+EQX)
Load Combination - 1.5 (DL+EQX)
STOREY M3 (kN.m) M2 (kN.m) V2 (kN) V2 (kN)
5th Floor Slab -194.67 48.80 -98.27 -17.94
4th Floor Slab -260.17 126.18 -142.88 -83.32
Moment capacity of the exterior column is found to be 569.53 kN.m and 236.93 kN.m at
4th
floor slab and 5th
floor slab level, respectively with Pu-Mu curve from SP 16(1980) [10]
.
It is found that moment capacity of the column at 4th floor slab level. i.e. 569.53 kN.m is
greater than moment demand i.e. 260.17 kN.m. Also it is found that moment capacity of the
column at 5th floor slab level i.e. 236.93 kN.m is greater than moment demand i.e. 194.67
kN.m. Hence interior column is safe at both the floors.
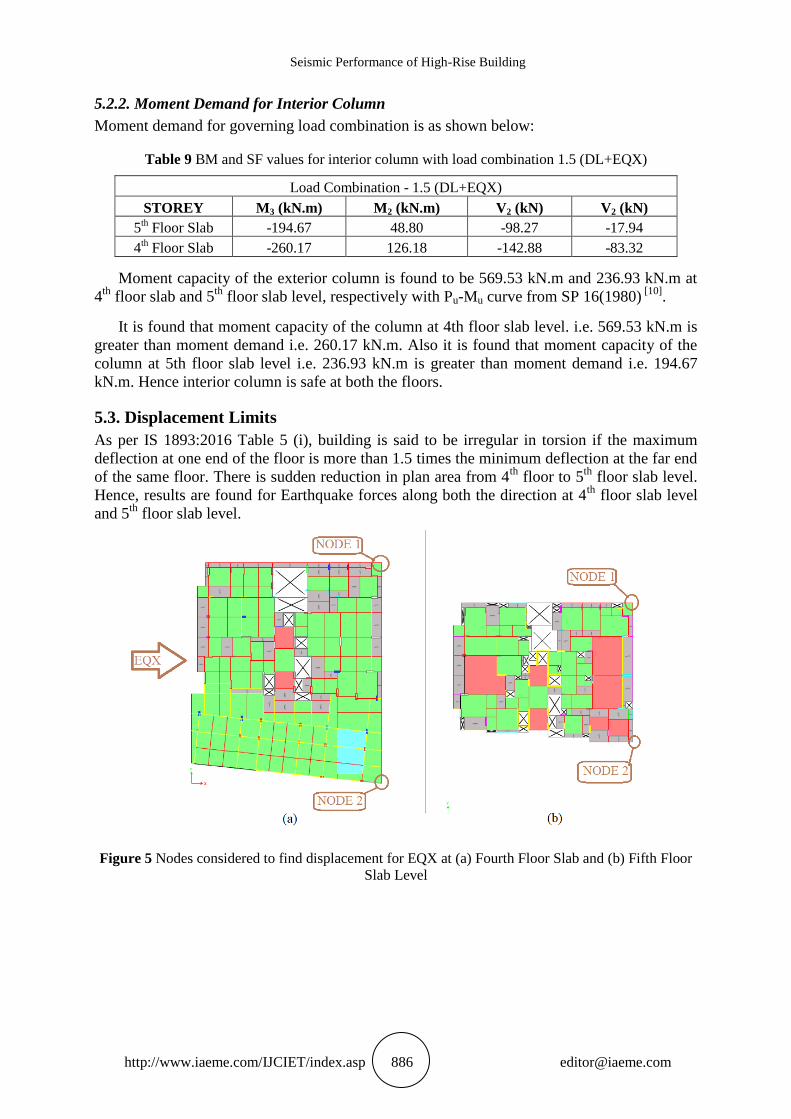
5.3. Displacement Limits
As per IS 1893:2016 Table 5 (i), building is said to be irregular in torsion if the maximum
deflection at one end of the floor is more than 1.5 times the minimum deflection at the far end
of the same floor. There is sudden reduction in plan area from 4th
floor to 5th
floor slab level.
Hence, results are found for Earthquake forces along both the direction at 4th
floor slab level
and 5th
floor slab level.
Figure 5 Nodes considered to find displacement for EQX at (a) Fourth Floor Slab and (b) Fifth Floor
Slab Level
Somil Khattar and Muthumani K
http://www.iaeme.com/IJCIET/index.asp 887 [email protected]
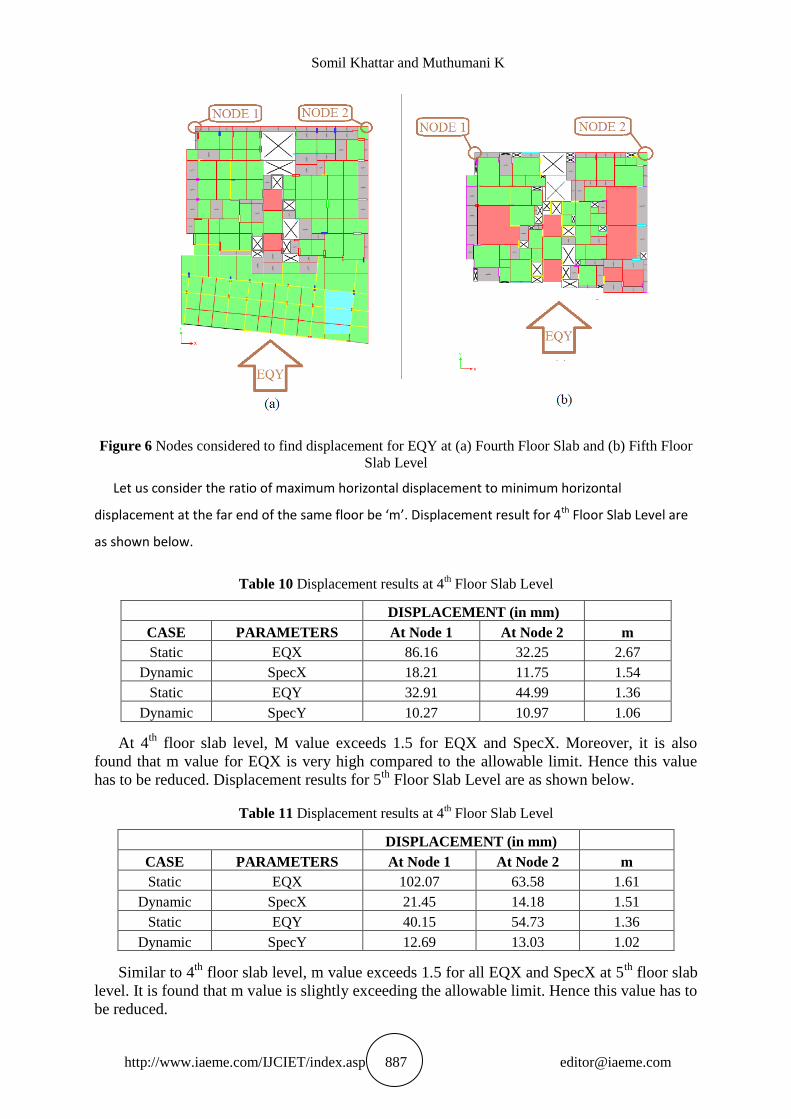
Figure 6 Nodes considered to find displacement for EQY at (a) Fourth Floor Slab and (b) Fifth Floor
Slab Level
Let us consider the ratio of maximum horizontal displacement to minimum horizontal
displacement at the far end of the same floor be ‘m’. Displacement result for 4th Floor Slab Level are
as shown below.
Table 10 Displacement results at 4th Floor Slab Level
DISPLACEMENT (in mm)
CASE PARAMETERS At Node 1 At Node 2 m
Static EQX 86.16 32.25 2.67
Dynamic SpecX 18.21 11.75 1.54
Static EQY 32.91 44.99 1.36
Dynamic SpecY 10.27 10.97 1.06
At 4th
floor slab level, M value exceeds 1.5 for EQX and SpecX. Moreover, it is also
found that m value for EQX is very high compared to the allowable limit. Hence this value
has to be reduced. Displacement results for 5th
Floor Slab Level are as shown below.
Table 11 Displacement results at 4th Floor Slab Level
DISPLACEMENT (in mm)
CASE PARAMETERS At Node 1 At Node 2 m
Static EQX 102.07 63.58 1.61
Dynamic SpecX 21.45 14.18 1.51
Static EQY 40.15 54.73 1.36
Dynamic SpecY 12.69 13.03 1.02
Similar to 4th
floor slab level, m value exceeds 1.5 for all EQX and SpecX at 5th
floor slab
level. It is found that m value is slightly exceeding the allowable limit. Hence this value has to
be reduced.
Seismic Performance of High-Rise Building
http://www.iaeme.com/IJCIET/index.asp 888 [email protected]
6. CONCLUSIONS
It can be concluded that though the time period value as per ASCE 7-16 is almost double
compared to IS 1893:2016, forces are found to be almost similar for both the cases. The
building was found safe as per Forced Based Design but due to irregularity in the plan and
sudden reduction of plan area between two floors, ratio of maximum displacement at one end
to the minimum displacement at the farther end exceeded the ratio of 1.5 which violates the
codal provision as per IS 1893(Part-1):2016 – Table 5 (i). Also torsion was found to be
prevalent in the first mode.
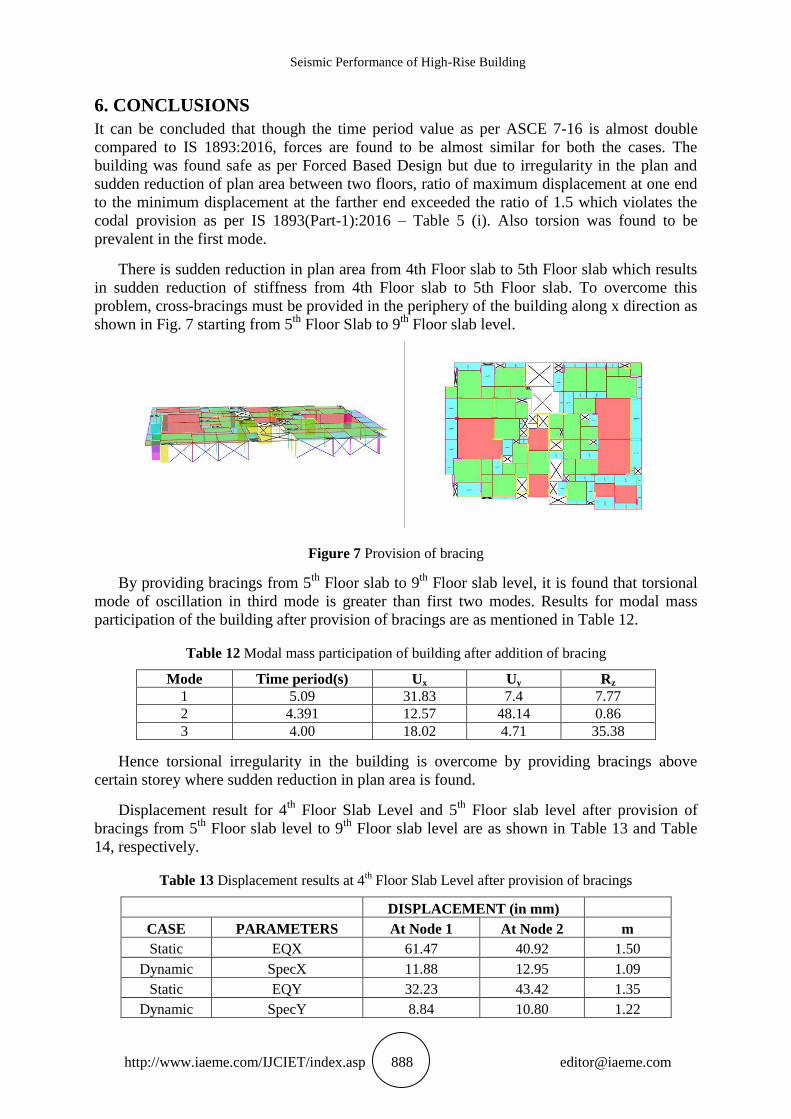
There is sudden reduction in plan area from 4th Floor slab to 5th Floor slab which results
in sudden reduction of stiffness from 4th Floor slab to 5th Floor slab. To overcome this
problem, cross-bracings must be provided in the periphery of the building along x direction as
shown in Fig. 7 starting from 5th
Floor Slab to 9th
Floor slab level.
Figure 7 Provision of bracing
By providing bracings from 5th
Floor slab to 9th
Floor slab level, it is found that torsional
mode of oscillation in third mode is greater than first two modes. Results for modal mass
participation of the building after provision of bracings are as mentioned in Table 12.
Table 12 Modal mass participation of building after addition of bracing
Mode Time period(s) Ux Uy Rz
1 5.09 31.83 7.4 7.77
2 4.391 12.57 48.14 0.86
3 4.00 18.02 4.71 35.38
Hence torsional irregularity in the building is overcome by providing bracings above
certain storey where sudden reduction in plan area is found.
Displacement result for 4th
Floor Slab Level and 5th
Floor slab level after provision of
bracings from 5th
Floor slab level to 9th
Floor slab level are as shown in Table 13 and Table
14, respectively.
Table 13 Displacement results at 4th Floor Slab Level after provision of bracings
DISPLACEMENT (in mm)
CASE PARAMETERS At Node 1 At Node 2 m
Static EQX 61.47 40.92 1.50
Dynamic SpecX 11.88 12.95 1.09
Static EQY 32.23 43.42 1.35
Dynamic SpecY 8.84 10.80 1.22
Somil Khattar and Muthumani K
http://www.iaeme.com/IJCIET/index.asp 889 [email protected]
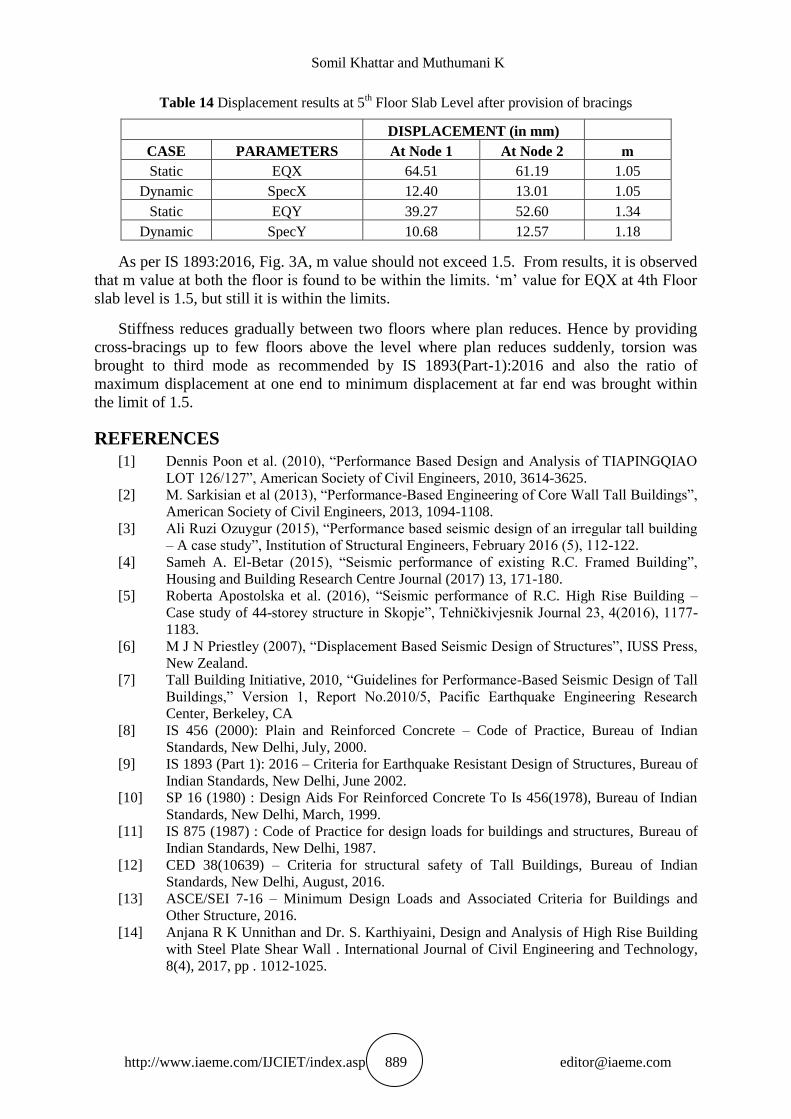
Table 14 Displacement results at 5th Floor Slab Level after provision of bracings
DISPLACEMENT (in mm)
CASE PARAMETERS At Node 1 At Node 2 m
Static EQX 64.51 61.19 1.05
Dynamic SpecX 12.40 13.01 1.05
Static EQY 39.27 52.60 1.34
Dynamic SpecY 10.68 12.57 1.18
As per IS 1893:2016, Fig. 3A, m value should not exceed 1.5. From results, it is observed
that m value at both the floor is found to be within the limits. „m‟ value for EQX at 4th Floor
slab level is 1.5, but still it is within the limits.
Stiffness reduces gradually between two floors where plan reduces. Hence by providing
cross-bracings up to few floors above the level where plan reduces suddenly, torsion was
brought to third mode as recommended by IS 1893(Part-1):2016 and also the ratio of
maximum displacement at one end to minimum displacement at far end was brought within
the limit of 1.5.
REFERENCES
[1] Dennis Poon et al. (2010), “Performance Based Design and Analysis of TIAPINGQIAO
LOT 126/127”, American Society of Civil Engineers, 2010, 3614-3625.
[2] M. Sarkisian et al (2013), “Performance-Based Engineering of Core Wall Tall Buildings”,
American Society of Civil Engineers, 2013, 1094-1108.
[3] Ali Ruzi Ozuygur (2015), “Performance based seismic design of an irregular tall building
– A case study”, Institution of Structural Engineers, February 2016 (5), 112-122.
[4] Sameh A. El-Betar (2015), “Seismic performance of existing R.C. Framed Building”,
Housing and Building Research Centre Journal (2017) 13, 171-180.
[5] Roberta Apostolska et al. (2016), “Seismic performance of R.C. High Rise Building –
Case study of 44-storey structure in Skopje”, Tehničkivjesnik Journal 23, 4(2016), 1177-
1183.
[6] M J N Priestley (2007), “Displacement Based Seismic Design of Structures”, IUSS Press,
New Zealand.
[7] Tall Building Initiative, 2010, “Guidelines for Performance-Based Seismic Design of Tall
Buildings,” Version 1, Report No.2010/5, Pacific Earthquake Engineering Research
Center, Berkeley, CA
[8] IS 456 (2000): Plain and Reinforced Concrete – Code of Practice, Bureau of Indian
Standards, New Delhi, July, 2000.
[9] IS 1893 (Part 1): 2016 – Criteria for Earthquake Resistant Design of Structures, Bureau of
Indian Standards, New Delhi, June 2002.
[10] SP 16 (1980) : Design Aids For Reinforced Concrete To Is 456(1978), Bureau of Indian
Standards, New Delhi, March, 1999.
[11] IS 875 (1987) : Code of Practice for design loads for buildings and structures, Bureau of
Indian Standards, New Delhi, 1987.
[12] CED 38(10639) – Criteria for structural safety of Tall Buildings, Bureau of Indian
Standards, New Delhi, August, 2016.
[13] ASCE/SEI 7-16 – Minimum Design Loads and Associated Criteria for Buildings and
Other Structure, 2016.
[14] Anjana R K Unnithan and Dr. S. Karthiyaini, Design and Analysis of High Rise Building
with Steel Plate Shear Wall . International Journal of Civil Engineering and Technology,
8(4), 2017, pp . 1012-1025.