Embed Size (px)
Citation preview
International Journal of Engineering Trends and Technology Volume 69 Issue 10, 168-177, October, 2021
ISSN: 2231 – 5381 /doi:10.14445/22315381/IJETT-V69I10P221 ©2021 Seventh Sense Research Group®
This is an open access article under the CC BY-NC-ND license (http://creativecommons.org/licenses/by-nc-nd/4.0/)
Seismic Performance Limit States Assessment of
Bridge Piers by Numerical Analysis and
Experimental Damage Observations Mohamed Saad Abbadi1, Nouzha Lamdouar2
1Civil Engineering Laboratory, Mohammadia School of Engineers, Mohammed V University in Rabat, Morocco
[email protected], 2 [email protected]
Abstract. - A numerical model of the bridge piers is
achieved through the OpenSees program in order to
predict the nonlinear global and local responses,
expressed as displacements, forces and strains. The model
is first evaluated by comparing the numerical force-
displacement response with the corresponding
experimental force-displacement response for different
degrees of damages. Also, the limit states are compared to
see how accurately the model predicts the local behavior
as well. Experimental results of 39 columns tested under
cyclic loading by several authors are used. These columns
cover the main parameters of interest for typical bridge
piers, such as geometry, longitudinal and transverse
reinforcement ratio, and axial loading ratio. The results of
this comparison have led to the conclusion that the
numerical model can accurately predict the observed
damage sequence and, therefore, the limit states that will
be used to achieve the performance objectives. Safety
coefficients are proposed to cover the error between the
numerical model and experimental responses.
Keywords — Performance objectives, OpenSees,
Pushover analysis.
I. INTRODUCTION
Performance-based seismic design is based on the
approach that guarantees criteria for the functionality and
durability of existing structures. These criteria, called
performance limit states, are usually defined qualitatively
in terms of the damage state of the structure. However, the
quantitative definition of these qualitative damage limit
states must be made in relation to reference values that
accurately reflect the qualitative states such as strain,
displacement, and curvature. Material strain values, such
as the compressive strain of concrete and tensile strain of
steel, are inherent material properties that can be related to
the limit states and have been commonly used in the
literature.
Several authors have addressed the issue of qualitatively
defining the performance limit states of bridge piers. For
example, the Oregon Department has identified two limit
states that are strain-based and accordingly provided
concrete tensile strain values for these two levels of limit
states. In addition, Goodnight and Kowalsky (2015)
experimentally evaluated the deformation limits of
reinforced concrete column performance through 30
specimens. As a result, they propose relative strain values
for the concrete and reinforcing steel for limit states. These
values are in agreement with the results provided by
Kowalsky (2000). Hose & Seible (1999) suggest five
levels of performance and propose quantitative values
corresponding to them. These values are based primarily
on observations of damage to the tested pier specimens
during the damage sequence from minor deformation and
early cracking to reinforcement buckling. Transportation
Research Board also provides reinforcement and concrete
deformation values for five limit states.
Kowalsky et al. 1996 carried out a series of three tests
on columns subjected to hysteretic stresses. The
observation was made on the appearance of cracks in the
cover concrete subjected to compressive stresses. The
compressive strains at the extreme fiber level are 0.0025,
0.003, and 0.0036, respectively. Kunnath et al. 1997
developed an experimental program to illustrate the
progressive damage of bridge columns and identify criteria
to describe this damage sequence, and correlate visual
observations to damage limit states. For this purpose, 12
specimens were recommended and subjected to different
types of loading (monotonic, hysteretic, accelerograms,...).
The initiation of cracking is observed from a tensile strain
of 0.002 to 0.004 for the test n°1. For the other tests, the
magnitude of the seismic load does not allow the
identification of light damage. Lehman et al. 1998
conducted an experimental campaign and identified 4 limit
states. Each limit state is associated with a degree of
observed damage. These observations are cracking,
plasticization of the longitudinal reinforcement, spalling of
the cover concrete, and failure of the transverse
reinforcement.
This study focused on defining a link between the
qualitative criteria expressed in terms of observed damage
and the reference values that characterize them. For this
purpose, the results of several experimental campaigns
carried out on columns have been used to calibrate and
validate the numerical modeling of these columns.
II. MATERIALS AND METHODS
This section describes first the damage sequence
observed on cyclic tests and proposes strain limits that suit
the most to these damage states. Then, an overview of the
numerical modeling strategy is presented, with the
description of the necessary steps to obtain the best
number of fibers, integration points, and material
properties.
Mohamed Saad Abbadi & Nouzha Lamdouar / IJETT, 69(10), 168-177, 2021
169
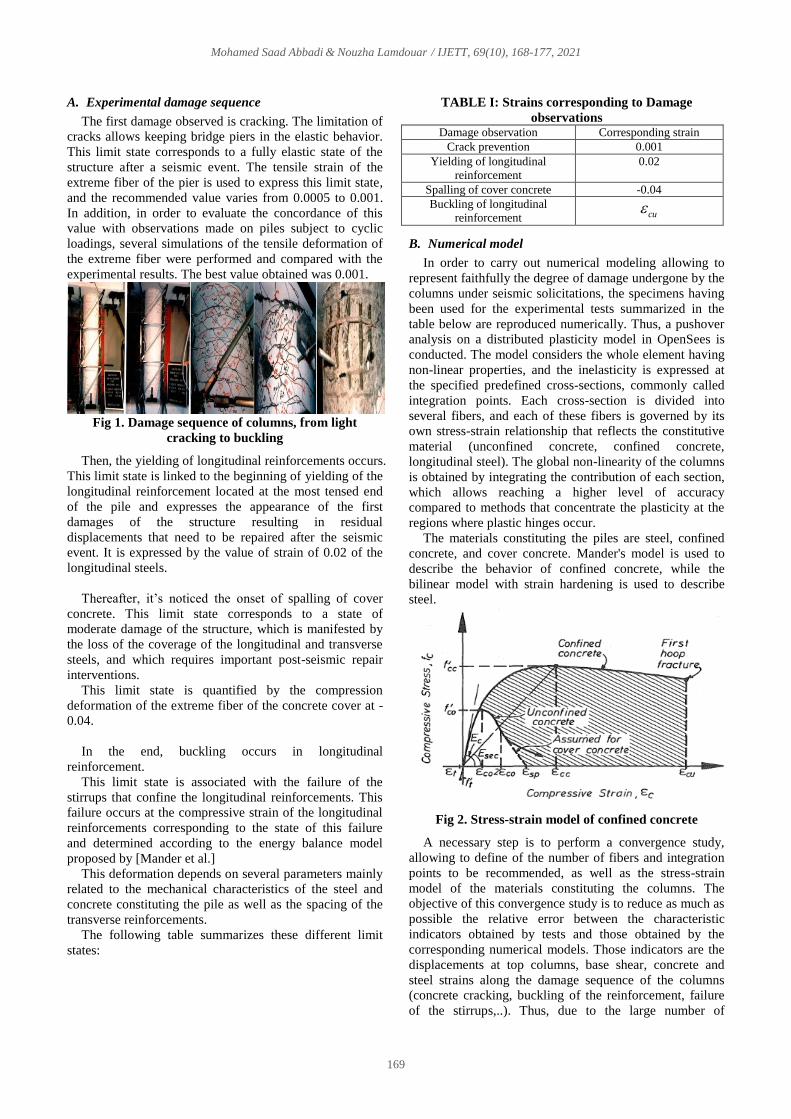
A. Experimental damage sequence
The first damage observed is cracking. The limitation of
cracks allows keeping bridge piers in the elastic behavior.
This limit state corresponds to a fully elastic state of the
structure after a seismic event. The tensile strain of the
extreme fiber of the pier is used to express this limit state,
and the recommended value varies from 0.0005 to 0.001.
In addition, in order to evaluate the concordance of this
value with observations made on piles subject to cyclic
loadings, several simulations of the tensile deformation of
the extreme fiber were performed and compared with the
experimental results. The best value obtained was 0.001.
Fig 1. Damage sequence of columns, from light
cracking to buckling
Then, the yielding of longitudinal reinforcements occurs.
This limit state is linked to the beginning of yielding of the
longitudinal reinforcement located at the most tensed end
of the pile and expresses the appearance of the first
damages of the structure resulting in residual
displacements that need to be repaired after the seismic
event. It is expressed by the value of strain of 0.02 of the
longitudinal steels.
Thereafter, it’s noticed the onset of spalling of cover
concrete. This limit state corresponds to a state of
moderate damage of the structure, which is manifested by
the loss of the coverage of the longitudinal and transverse
steels, and which requires important post-seismic repair
interventions.
This limit state is quantified by the compression
deformation of the extreme fiber of the concrete cover at -
0.04.
In the end, buckling occurs in longitudinal
reinforcement.
This limit state is associated with the failure of the
stirrups that confine the longitudinal reinforcements. This
failure occurs at the compressive strain of the longitudinal
reinforcements corresponding to the state of this failure
and determined according to the energy balance model
proposed by [Mander et al.]
This deformation depends on several parameters mainly
related to the mechanical characteristics of the steel and
concrete constituting the pile as well as the spacing of the
transverse reinforcements.
The following table summarizes these different limit
states:
TABLE I: Strains corresponding to Damage
observations Damage observation Corresponding strain
Crack prevention 0.001
Yielding of longitudinal
reinforcement
0.02
Spalling of cover concrete -0.04
Buckling of longitudinal
reinforcement cu
B. Numerical model
In order to carry out numerical modeling allowing to
represent faithfully the degree of damage undergone by the
columns under seismic solicitations, the specimens having
been used for the experimental tests summarized in the
table below are reproduced numerically. Thus, a pushover
analysis on a distributed plasticity model in OpenSees is
conducted. The model considers the whole element having
non-linear properties, and the inelasticity is expressed at
the specified predefined cross-sections, commonly called
integration points. Each cross-section is divided into
several fibers, and each of these fibers is governed by its
own stress-strain relationship that reflects the constitutive
material (unconfined concrete, confined concrete,
longitudinal steel). The global non-linearity of the columns
is obtained by integrating the contribution of each section,
which allows reaching a higher level of accuracy
compared to methods that concentrate the plasticity at the
regions where plastic hinges occur.
The materials constituting the piles are steel, confined
concrete, and cover concrete. Mander's model is used to
describe the behavior of confined concrete, while the
bilinear model with strain hardening is used to describe
steel.
Fig 2. Stress-strain model of confined concrete
A necessary step is to perform a convergence study,
allowing to define of the number of fibers and integration
points to be recommended, as well as the stress-strain
model of the materials constituting the columns. The
objective of this convergence study is to reduce as much as
possible the relative error between the characteristic
indicators obtained by tests and those obtained by the
corresponding numerical models. Those indicators are the
displacements at top columns, base shear, concrete and
steel strains along the damage sequence of the columns
(concrete cracking, buckling of the reinforcement, failure
of the stirrups,..). Thus, due to the large number of
Mohamed Saad Abbadi & Nouzha Lamdouar / IJETT, 69(10), 168-177, 2021
170
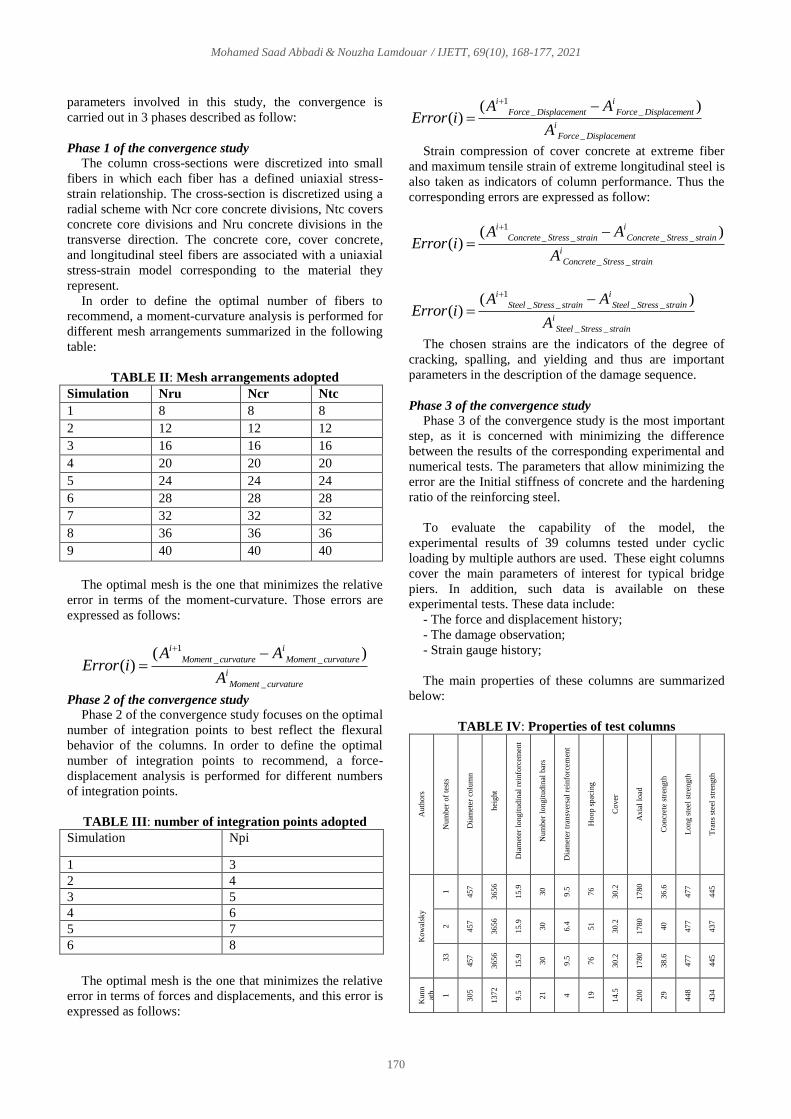
parameters involved in this study, the convergence is
carried out in 3 phases described as follow:
Phase 1 of the convergence study
The column cross-sections were discretized into small
fibers in which each fiber has a defined uniaxial stress-
strain relationship. The cross-section is discretized using a
radial scheme with Ncr core concrete divisions, Ntc covers
concrete core divisions and Nru concrete divisions in the
transverse direction. The concrete core, cover concrete,
and longitudinal steel fibers are associated with a uniaxial
stress-strain model corresponding to the material they
represent.
In order to define the optimal number of fibers to
recommend, a moment-curvature analysis is performed for
different mesh arrangements summarized in the following
table:
TABLE II: Mesh arrangements adopted
Simulation Nru Ncr Ntc
1 8 8 8
2 12 12 12
3 16 16 16
4 20 20 20
5 24 24 24
6 28 28 28
7 32 32 32
8 36 36 36
9 40 40 40
The optimal mesh is the one that minimizes the relative
error in terms of the moment-curvature. Those errors are
expressed as follows:
1
_ _
_
( )( )
i i
Moment curvature Moment curvature
i
Moment curvature
A AError i
A
Phase 2 of the convergence study
Phase 2 of the convergence study focuses on the optimal
number of integration points to best reflect the flexural
behavior of the columns. In order to define the optimal
number of integration points to recommend, a force-
displacement analysis is performed for different numbers
of integration points.
TABLE III: number of integration points adopted
Simulation Npi
1 3
2 4
3 5
4 6
5 7
6 8
The optimal mesh is the one that minimizes the relative
error in terms of forces and displacements, and this error is
expressed as follows:
1
_ _
_
( )( )
i i
Force Displacement Force Displacement
i
Force Displacement
A AError i
A
Strain compression of cover concrete at extreme fiber
and maximum tensile strain of extreme longitudinal steel is
also taken as indicators of column performance. Thus the
corresponding errors are expressed as follow:
1
_ _ _ _
_ _
( )( )
i i
Concrete Stress strain Concrete Stress strain
i
Concrete Stress strain
A AError i
A
1
_ _ _ _
_ _
( )( )
i i
Steel Stress strain Steel Stress strain
i
Steel Stress strain
A AError i
A
The chosen strains are the indicators of the degree of
cracking, spalling, and yielding and thus are important
parameters in the description of the damage sequence.
Phase 3 of the convergence study
Phase 3 of the convergence study is the most important
step, as it is concerned with minimizing the difference
between the results of the corresponding experimental and
numerical tests. The parameters that allow minimizing the
error are the Initial stiffness of concrete and the hardening
ratio of the reinforcing steel.
To evaluate the capability of the model, the
experimental results of 39 columns tested under cyclic
loading by multiple authors are used. These eight columns
cover the main parameters of interest for typical bridge
piers. In addition, such data is available on these
experimental tests. These data include:
- The force and displacement history;
- The damage observation;
- Strain gauge history;
The main properties of these columns are summarized
below:
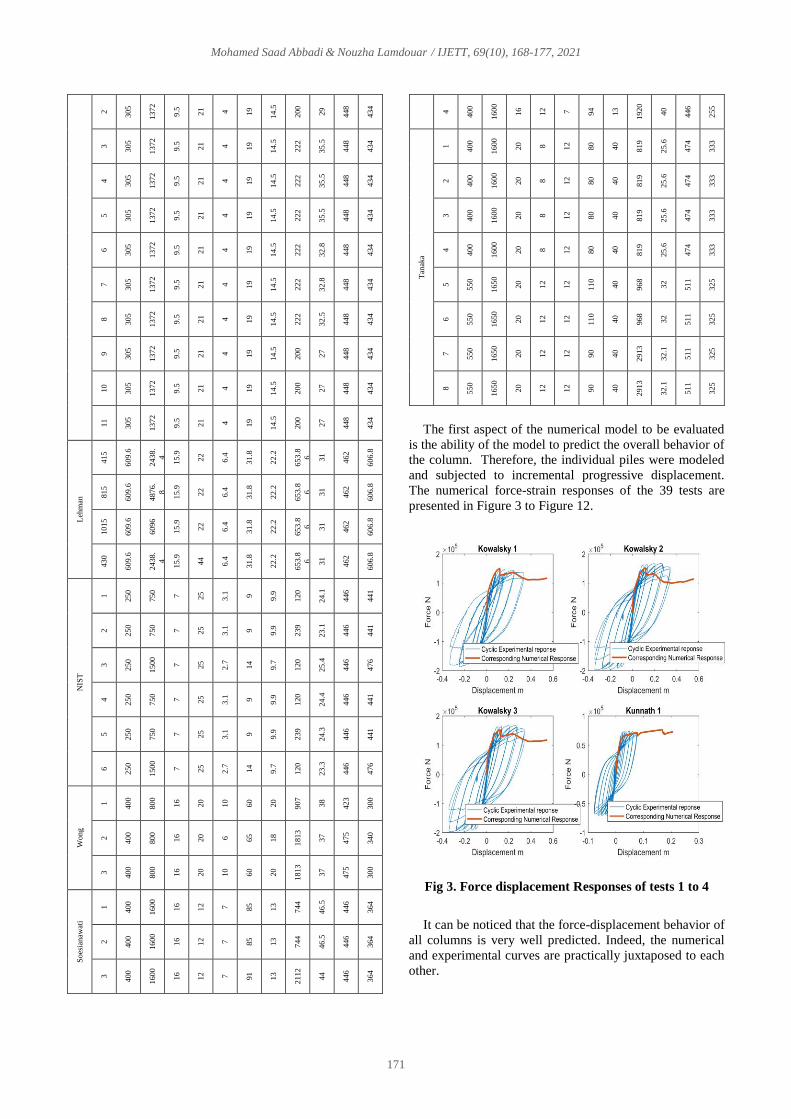
TABLE IV: Properties of test columns
Auth
ors
Num
ber
of
test
s
Dia
met
er c
olu
mn
hei
ght
Dia
met
er l
ongit
udin
al r
einfo
rcem
ent
Num
ber
longit
udin
al b
ars
Dia
met
er t
ransv
ersa
l re
info
rcem
ent
Hoop s
pac
ing
Cover
Axia
l lo
ad
Concr
ete
stre
ngth
Long s
teel
str
ength
Tra
ns
stee
l st
rength
Kow
alsk
y
1
457
3656
15.9
30
9.5
76
30.2
1780
36.6
477
445
2
457
3656
15.9
30
6.4
51
30.2
1780
40
477
437
33
457
3656
15.9
30
9.5
76
30.2
1780
38.6
477
445
Kunn
ath
1
305
1372
9.5
21
4
19
14.5
200
29
448
434
Mohamed Saad Abbadi & Nouzha Lamdouar / IJETT, 69(10), 168-177, 2021
171
2
305
1372
9.5
21
4
19
14.5
200
29
448
434
3
305
1372
9.5
21
4
19
14.5
222
35.5
448
434
4
305
1372
9.5
21
4
19
14.5
222
35.5
448
434
5
305
1372
9.5
21
4
19
14.5
222
35.5
448
434
6
305
1372
9.5
21
4
19
14.5
222
32.8
448
434
7
305
1372
9.5
21
4
19
14.5
222
32.8
448
434
8
305
1372
9.5
21
4
19
14.5
222
32.5
448
434
9
305
1372
9.5
21
4
19
14.5
200
27
448
434
10
305
1372
9.5
21
4
19
14.5
200
27
448
434
11
305
1372
9.5
21
4
19
14.5
200
27
448
434
Leh
man
415
609.6
2438.
4
15.9
22
6.4
31.8
22.2
653.8
6
31
462
606.8
815
609.6
4876.
8
15.9
22
6.4
31.8
22.2
653.8
6
31
462
606.8
1015
609.6
6096
15.9
22
6.4
31.8
22.2
653.8
6
31
462
606.8
430
609.6
2438.
4
15.9
44
6.4
31.8
22.2
653.8
6
31
462
606.8
NIS
T
1
250
750
7
25
3.1
9
9.9
120
24.1
446
441
2
250
750
7
25
3.1
9
9.9
239
23.1
446
441
3
250
1500
7
25
2.7
14
9.7
120
25.4
446
476
4
250
750
7
25
3.1
9
9.9
120
24.4
446
441
5
250
750
7
25
3.1
9
9.9
239
24.3
446
441
6
250
1500
7
25
2.7
14
9.7
120
23.3
446
476
Wong
1
400
800
16
20
10
60
20
907
38
423
300
2
400
800
16
20
6
65
18
1813
37
475
340
3
400
800
16
20
10
60
20
1813
37
475
300
Soes
ianaw
ati
1
400
1600
16
12
7
85
13
744
46.5
446
364
2
400
1600
16
12
7
85
13
744
46.5
446
364
3
400
1600
16
12
7
91
13
2112
44
446
364
4
400
1600
16
12
7
94
13
1920
40
446
255
Tan
aka
1
400
1600
20
8
12
80
40
819
25.6
474
333
2
400
1600
20
8
12
80
40
819
25.6
474
333
3
400
1600
20
8
12
80
40
819
25.6
474
333
4
400
1600
20
8
12
80
40
819
25.6
474
333
5
550
1650
20
12
12
110
40
968
32
511
325
6
550
1650
20
12
12
110
40
968
32
511
325
7
550
1650
20
12
12
90
40
2913
32.1
511
325
8
550
1650
20
12
12
90
40
2913
32.1
511
325
The first aspect of the numerical model to be evaluated
is the ability of the model to predict the overall behavior of
the column. Therefore, the individual piles were modeled
and subjected to incremental progressive displacement.
The numerical force-strain responses of the 39 tests are
presented in Figure 3 to Figure 12.
Fig 3. Force displacement Responses of tests 1 to 4
It can be noticed that the force-displacement behavior of
all columns is very well predicted. Indeed, the numerical
and experimental curves are practically juxtaposed to each
other.
Mohamed Saad Abbadi & Nouzha Lamdouar / IJETT, 69(10), 168-177, 2021
172
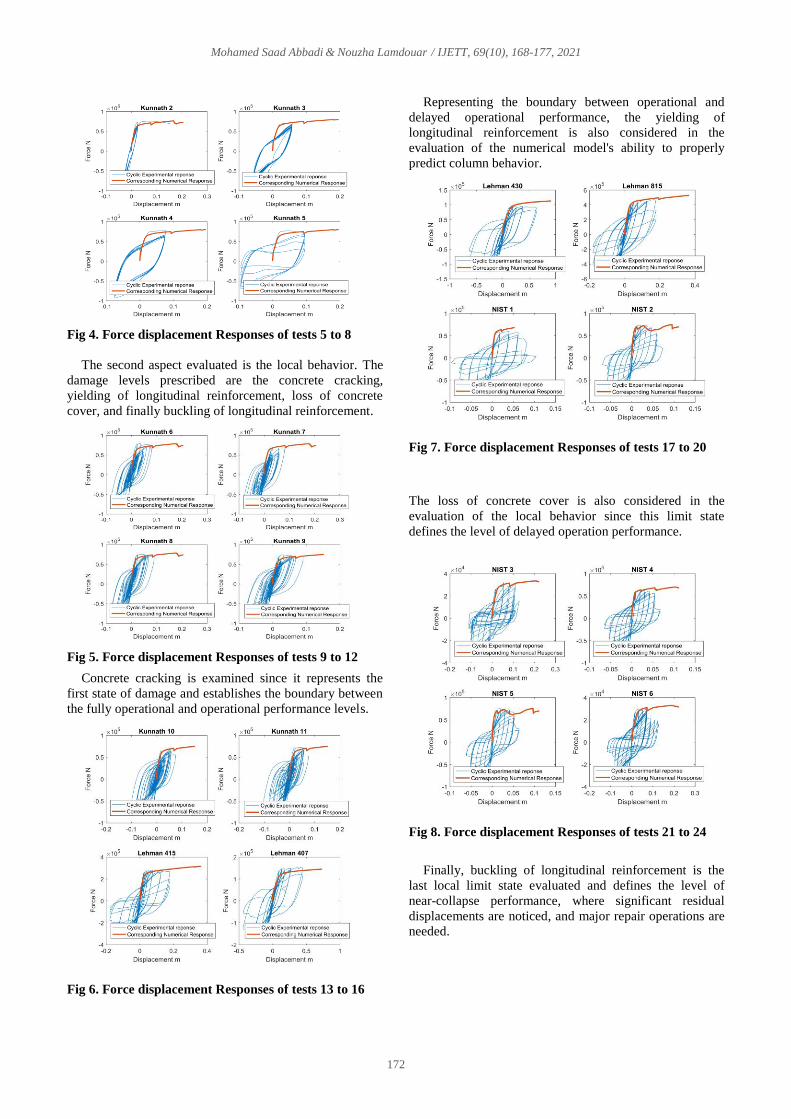
Fig 4. Force displacement Responses of tests 5 to 8
The second aspect evaluated is the local behavior. The
damage levels prescribed are the concrete cracking,
yielding of longitudinal reinforcement, loss of concrete
cover, and finally buckling of longitudinal reinforcement.
Fig 5. Force displacement Responses of tests 9 to 12
Concrete cracking is examined since it represents the
first state of damage and establishes the boundary between
the fully operational and operational performance levels.
Fig 6. Force displacement Responses of tests 13 to 16
Representing the boundary between operational and
delayed operational performance, the yielding of
longitudinal reinforcement is also considered in the
evaluation of the numerical model's ability to properly
predict column behavior.
Fig 7. Force displacement Responses of tests 17 to 20
The loss of concrete cover is also considered in the
evaluation of the local behavior since this limit state
defines the level of delayed operation performance.
Fig 8. Force displacement Responses of tests 21 to 24
Finally, buckling of longitudinal reinforcement is the
last local limit state evaluated and defines the level of
near-collapse performance, where significant residual
displacements are noticed, and major repair operations are
needed.
Mohamed Saad Abbadi & Nouzha Lamdouar / IJETT, 69(10), 168-177, 2021
173
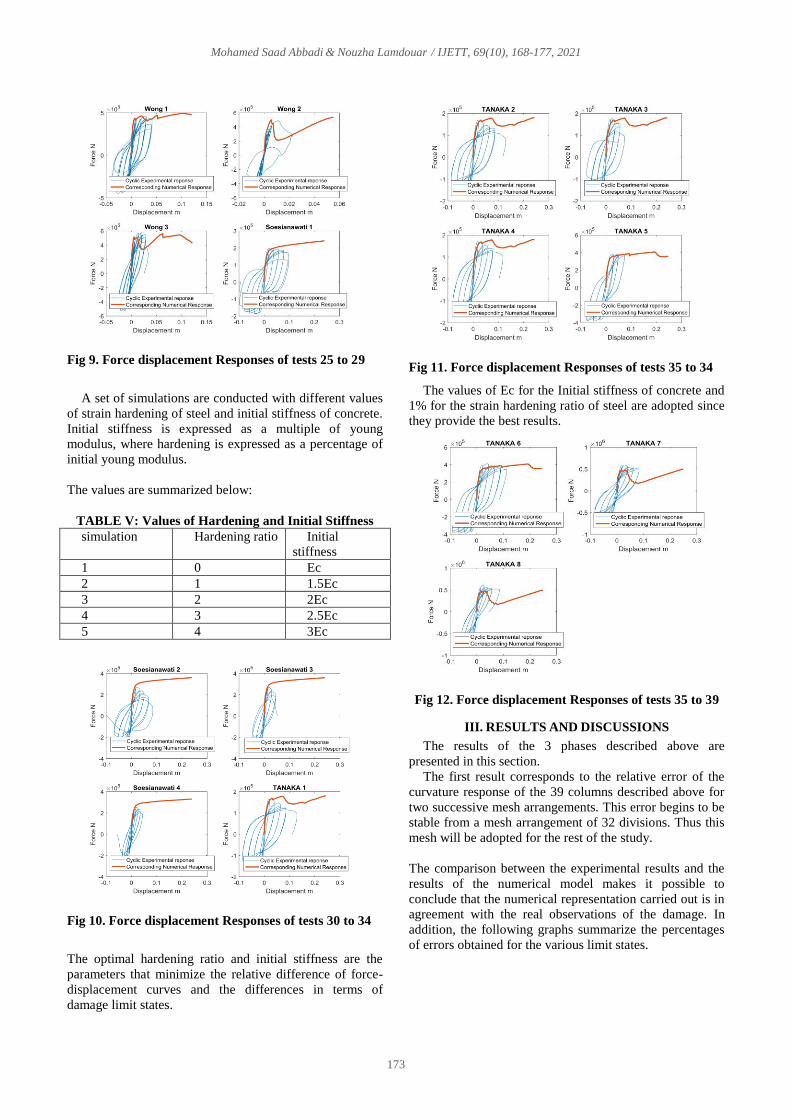
Fig 9. Force displacement Responses of tests 25 to 29
A set of simulations are conducted with different values
of strain hardening of steel and initial stiffness of concrete.
Initial stiffness is expressed as a multiple of young
modulus, where hardening is expressed as a percentage of
initial young modulus.
The values are summarized below:
TABLE V: Values of Hardening and Initial Stiffness
simulation Hardening ratio Initial
stiffness
1 0 Ec
2 1 1.5Ec
3 2 2Ec
4 3 2.5Ec
5 4 3Ec
Fig 10. Force displacement Responses of tests 30 to 34
The optimal hardening ratio and initial stiffness are the
parameters that minimize the relative difference of force-
displacement curves and the differences in terms of
damage limit states.
Fig 11. Force displacement Responses of tests 35 to 34
The values of Ec for the Initial stiffness of concrete and
1% for the strain hardening ratio of steel are adopted since
they provide the best results.
Fig 12. Force displacement Responses of tests 35 to 39
III. RESULTS AND DISCUSSIONS
The results of the 3 phases described above are
presented in this section.
The first result corresponds to the relative error of the
curvature response of the 39 columns described above for
two successive mesh arrangements. This error begins to be
stable from a mesh arrangement of 32 divisions. Thus this
mesh will be adopted for the rest of the study.
The comparison between the experimental results and the
results of the numerical model makes it possible to
conclude that the numerical representation carried out is in
agreement with the real observations of the damage. In
addition, the following graphs summarize the percentages
of errors obtained for the various limit states.
Mohamed Saad Abbadi & Nouzha Lamdouar / IJETT, 69(10), 168-177, 2021
174
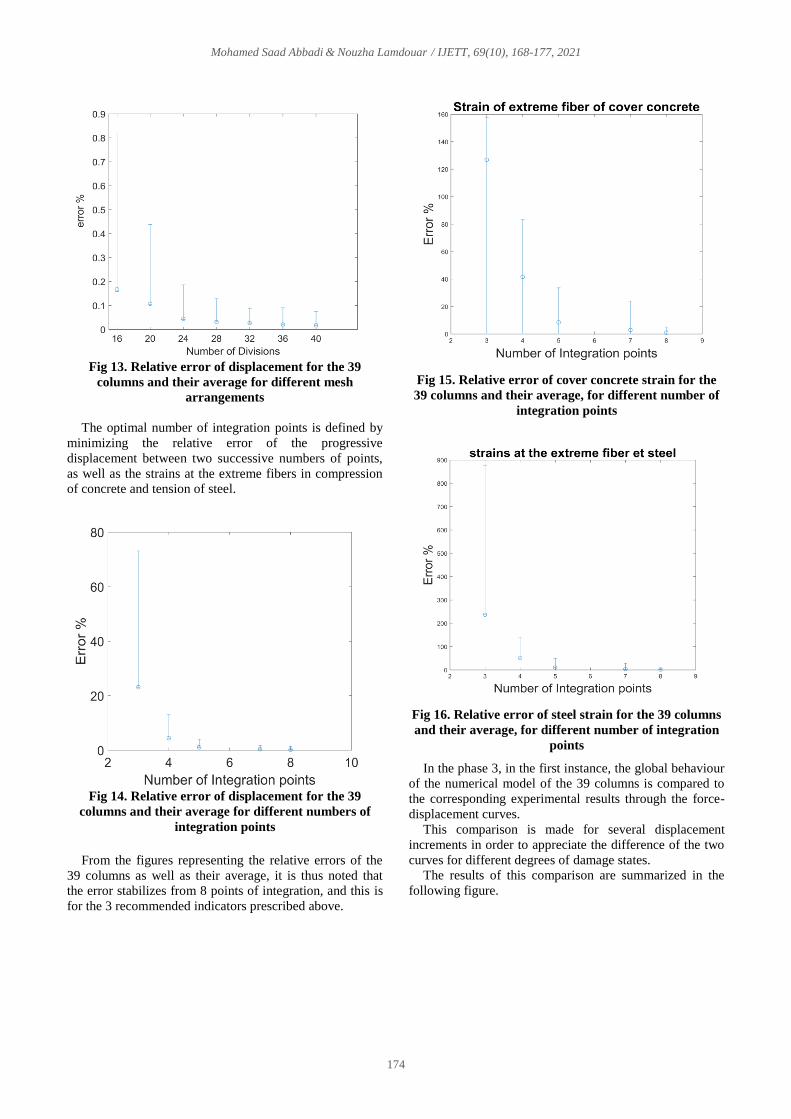
Fig 13. Relative error of displacement for the 39
columns and their average for different mesh
arrangements
The optimal number of integration points is defined by
minimizing the relative error of the progressive
displacement between two successive numbers of points,
as well as the strains at the extreme fibers in compression
of concrete and tension of steel.
Fig 14. Relative error of displacement for the 39
columns and their average for different numbers of
integration points
From the figures representing the relative errors of the
39 columns as well as their average, it is thus noted that
the error stabilizes from 8 points of integration, and this is
for the 3 recommended indicators prescribed above.
Fig 15. Relative error of cover concrete strain for the
39 columns and their average, for different number of
integration points
Fig 16. Relative error of steel strain for the 39 columns
and their average, for different number of integration
points
In the phase 3, in the first instance, the global behaviour
of the numerical model of the 39 columns is compared to
the corresponding experimental results through the force-
displacement curves.
This comparison is made for several displacement
increments in order to appreciate the difference of the two
curves for different degrees of damage states.
The results of this comparison are summarized in the
following figure.
Mohamed Saad Abbadi & Nouzha Lamdouar / IJETT, 69(10), 168-177, 2021
175
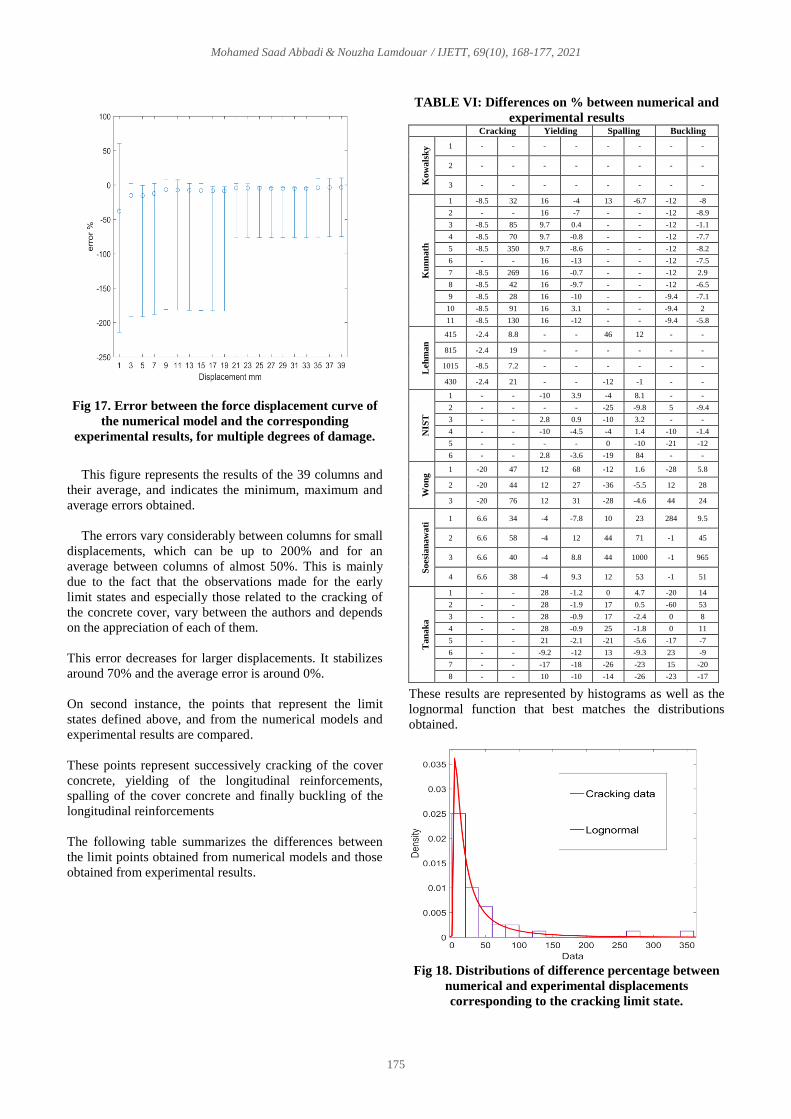
Fig 17. Error between the force displacement curve of
the numerical model and the corresponding
experimental results, for multiple degrees of damage.
This figure represents the results of the 39 columns and
their average, and indicates the minimum, maximum and
average errors obtained.
The errors vary considerably between columns for small
displacements, which can be up to 200% and for an
average between columns of almost 50%. This is mainly
due to the fact that the observations made for the early
limit states and especially those related to the cracking of
the concrete cover, vary between the authors and depends
on the appreciation of each of them.
This error decreases for larger displacements. It stabilizes
around 70% and the average error is around 0%.
On second instance, the points that represent the limit
states defined above, and from the numerical models and
experimental results are compared.
These points represent successively cracking of the cover
concrete, yielding of the longitudinal reinforcements,
spalling of the cover concrete and finally buckling of the
longitudinal reinforcements
The following table summarizes the differences between
the limit points obtained from numerical models and those
obtained from experimental results.
TABLE VI: Differences on % between numerical and
experimental results Cracking Yielding Spalling Buckling
Kow
als
ky
1 - - - - - - - -
2 - - - - - - - -
3 - - - - - - - -
Ku
nn
ath
1 -8.5 32 16 -4 13 -6.7 -12 -8
2 - - 16 -7 - - -12 -8.9
3 -8.5 85 9.7 0.4 - - -12 -1.1
4 -8.5 70 9.7 -0.8 - - -12 -7.7
5 -8.5 350 9.7 -8.6 - - -12 -8.2
6 - - 16 -13 - - -12 -7.5
7 -8.5 269 16 -0.7 - - -12 2.9
8 -8.5 42 16 -9.7 - - -12 -6.5
9 -8.5 28 16 -10 - - -9.4 -7.1
10 -8.5 91 16 3.1 - - -9.4 2
11 -8.5 130 16 -12 - - -9.4 -5.8
Leh
man
415 -2.4 8.8 - - 46 12 - -
815 -2.4 19 - - - - - -
1015 -8.5 7.2 - - - - - -
430 -2.4 21 - - -12 -1 - -
NIS
T
1 - - -10 3.9 -4 8.1 - -
2 - - - - -25 -9.8 5 -9.4
3 - - 2.8 0.9 -10 3.2 - -
4 - - -10 -4.5 -4 1.4 -10 -1.4
5 - - - - 0 -10 -21 -12
6 - - 2.8 -3.6 -19 84 - -
Wo
ng
1 -20 47 12 68 -12 1.6 -28 5.8
2 -20 44 12 27 -36 -5.5 12 28
3 -20 76 12 31 -28 -4.6 44 24
So
esi
an
aw
ati
1 6.6 34 -4 -7.8 10 23 284 9.5
2 6.6 58 -4 12 44 71 -1 45
3 6.6 40 -4 8.8 44 1000 -1 965
4 6.6 38 -4 9.3 12 53 -1 51
Ta
na
ka
1 - - 28 -1.2 0 4.7 -20 14
2 - - 28 -1.9 17 0.5 -60 53
3 - - 28 -0.9 17 -2.4 0 8
4 - - 28 -0.9 25 -1.8 0 11
5 - - 21 -2.1 -21 -5.6 -17 -7
6 - - -9.2 -12 13 -9.3 23 -9
7 - - -17 -18 -26 -23 15 -20
8 - - 10 -10 -14 -26 -23 -17
These results are represented by histograms as well as the
lognormal function that best matches the distributions
obtained.
Fig 18. Distributions of difference percentage between
numerical and experimental displacements
corresponding to the cracking limit state.
Mohamed Saad Abbadi & Nouzha Lamdouar / IJETT, 69(10), 168-177, 2021
176
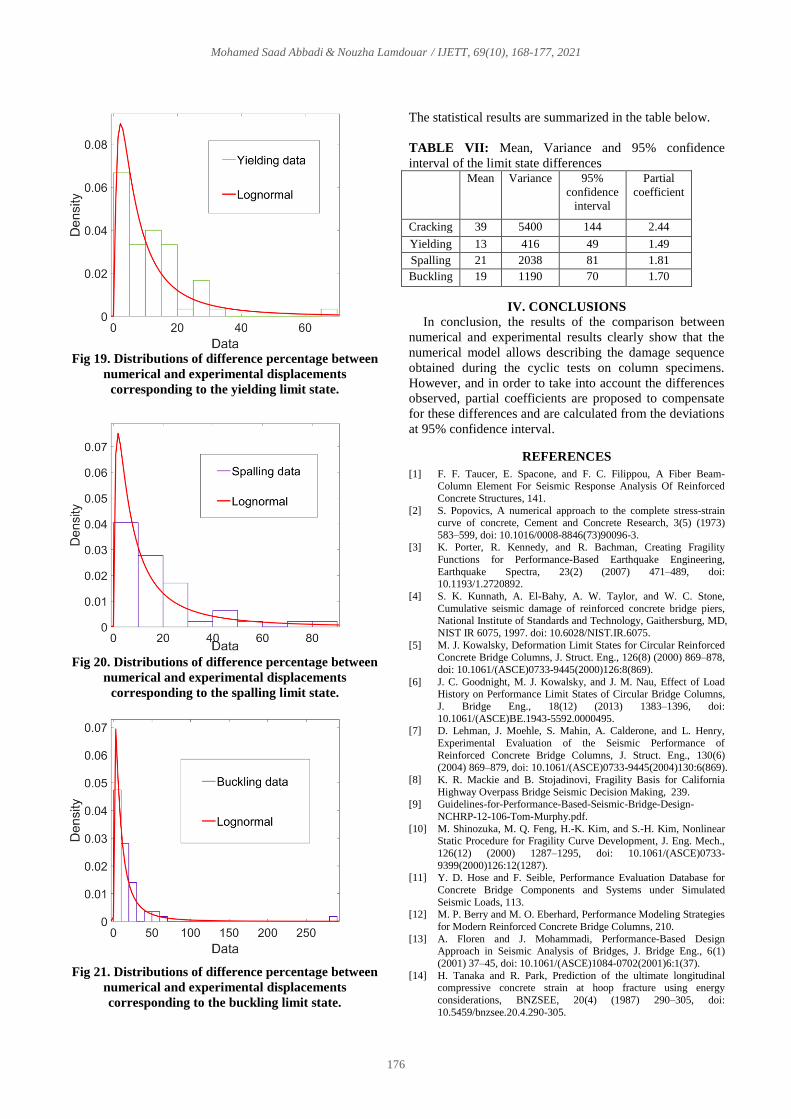
Fig 19. Distributions of difference percentage between
numerical and experimental displacements
corresponding to the yielding limit state.
Fig 20. Distributions of difference percentage between
numerical and experimental displacements
corresponding to the spalling limit state.
Fig 21. Distributions of difference percentage between
numerical and experimental displacements
corresponding to the buckling limit state.
The statistical results are summarized in the table below.
TABLE VII: Mean, Variance and 95% confidence
interval of the limit state differences Mean Variance 95%
confidence
interval
Partial
coefficient
Cracking 39 5400 144 2.44
Yielding 13 416 49 1.49
Spalling 21 2038 81 1.81
Buckling 19 1190 70 1.70
IV. CONCLUSIONS
In conclusion, the results of the comparison between
numerical and experimental results clearly show that the
numerical model allows describing the damage sequence
obtained during the cyclic tests on column specimens.
However, and in order to take into account the differences
observed, partial coefficients are proposed to compensate
for these differences and are calculated from the deviations
at 95% confidence interval.
REFERENCES
[1] F. F. Taucer, E. Spacone, and F. C. Filippou, A Fiber Beam-Column Element For Seismic Response Analysis Of Reinforced
Concrete Structures, 141.
[2] S. Popovics, A numerical approach to the complete stress-strain curve of concrete, Cement and Concrete Research, 3(5) (1973)
583–599, doi: 10.1016/0008-8846(73)90096-3. [3] K. Porter, R. Kennedy, and R. Bachman, Creating Fragility
Functions for Performance-Based Earthquake Engineering,
Earthquake Spectra, 23(2) (2007) 471–489, doi:
10.1193/1.2720892.
[4] S. K. Kunnath, A. El-Bahy, A. W. Taylor, and W. C. Stone,
Cumulative seismic damage of reinforced concrete bridge piers, National Institute of Standards and Technology, Gaithersburg, MD,
NIST IR 6075, 1997. doi: 10.6028/NIST.IR.6075.
[5] M. J. Kowalsky, Deformation Limit States for Circular Reinforced Concrete Bridge Columns, J. Struct. Eng., 126(8) (2000) 869–878,
doi: 10.1061/(ASCE)0733-9445(2000)126:8(869).
[6] J. C. Goodnight, M. J. Kowalsky, and J. M. Nau, Effect of Load History on Performance Limit States of Circular Bridge Columns,
J. Bridge Eng., 18(12) (2013) 1383–1396, doi:
10.1061/(ASCE)BE.1943-5592.0000495. [7] D. Lehman, J. Moehle, S. Mahin, A. Calderone, and L. Henry,
Experimental Evaluation of the Seismic Performance of
Reinforced Concrete Bridge Columns, J. Struct. Eng., 130(6) (2004) 869–879, doi: 10.1061/(ASCE)0733-9445(2004)130:6(869).
[8] K. R. Mackie and B. Stojadinovi, Fragility Basis for California
Highway Overpass Bridge Seismic Decision Making, 239. [9] Guidelines-for-Performance-Based-Seismic-Bridge-Design-
NCHRP-12-106-Tom-Murphy.pdf.
[10] M. Shinozuka, M. Q. Feng, H.-K. Kim, and S.-H. Kim, Nonlinear Static Procedure for Fragility Curve Development, J. Eng. Mech.,
126(12) (2000) 1287–1295, doi: 10.1061/(ASCE)0733-
9399(2000)126:12(1287). [11] Y. D. Hose and F. Seible, Performance Evaluation Database for
Concrete Bridge Components and Systems under Simulated
Seismic Loads, 113. [12] M. P. Berry and M. O. Eberhard, Performance Modeling Strategies
for Modern Reinforced Concrete Bridge Columns, 210.
[13] A. Floren and J. Mohammadi, Performance-Based Design Approach in Seismic Analysis of Bridges, J. Bridge Eng., 6(1)
(2001) 37–45, doi: 10.1061/(ASCE)1084-0702(2001)6:1(37).
[14] H. Tanaka and R. Park, Prediction of the ultimate longitudinal compressive concrete strain at hoop fracture using energy
considerations, BNZSEE, 20(4) (1987) 290–305, doi:
10.5459/bnzsee.20.4.290-305.

Mohamed Saad Abbadi & Nouzha Lamdouar / IJETT, 69(10), 168-177, 2021
177
[15] M. N. Sheikh and F. Legeron, Seismic performance-based design
of bridges with quantitative local performance criteria, 11.
[16] Shear and Flexural Behavior of Lightweight Concrete Bridge
Columns in Seismic Regions, SJ, 96(1) (1999), doi: 10.14359/605.
[17] Y. L. Wong, Squat circular bridge piers under multi-directional
seismic attack, 277.
[18] J. C. Goodnight, M. J. Kowalsky, and J. M. Nau, Strain Limit
States for Circular RC Bridge Columns, Earthquake Spectra, 32(3) (2016) 1627–1652, doi: 10.1193/030315EQS036M.