Embed Size (px)
Citation preview

SEISMIC HAZARD ZONE REPORT 066
SEISMIC HAZARD ZONE REPORT FOR THE SATICOY 7.5-MINUTE QUADRANGLE,
VENTURA COUNTY, CALIFORNIA
2003
DEPARTMENT OF CONSERVATION California Geological Survey
STATE OF CALIFORNIA
GRAY DAVIS GOVERNOR
THE RESOURCES AGENCY MARY D. NICHOLS
SECRETARY FOR RESOURCES
DEPARTMENT OF CONSERVATION DARRYL YOUNG
DIRECTOR

CALIFORNIA GEOLOGICAL SURVEY
JAMES F. DAVIS, STATE GEOLOGIST
Copyright © 2003 by the California Department of Conservation. All rights reserved. No part of this publication may be reproduced without written consent of the Department of Conservation.
“The Department of Conservation makes no warrantees as to the suitability of this product for any particular purpose.”
SEISMIC HAZARD ZONE REPORT 066
SEISMIC HAZARD ZONE REPORT FOR THE SATICOY 7.5-MINUTE QUADRANGLE,
VENTURA COUNTY, CALIFORNIA
CALIFORNIA GEOLOGICAL SURVEY'S PUBLICATION SALES OFFICES:
Southern California Regional Office 888 South Figueroa Street, Suite 475 Los Angeles, CA 90017 (213) 239-0878
Publications and Information Office 801 K Street, MS 14-31 Sacramento, CA 95814-3531 (916) 445-5716
Bay Area Regional Office 345 Middlefield Road, MS 520 Menlo Park, CA 94025 (650) 688-6327

List of Revisions – Saticoy SHZR 066
6/1/05 BPS address correction, web link updates
1/17/06 Bay Area Regional Office and Southern California Regional Office addresses updated


CONTENTS
EXECUTIVE SUMMARY .............................................................................................................v
INTRODUCTION ...........................................................................................................................1
SECTION 1 LIQUEFACTION EVALUATION REPORT Liquefaction Zones in the Saticoy 7.5-Minute Quadrangle, Ventura County, California .........................................................3
PURPOSE....................................................................................................................................3
BACKGROUND .....................................................................................................................4
METHODS SUMMARY.........................................................................................................4
SCOPE AND LIMITATIONS.................................................................................................5
PART I .........................................................................................................................................5
PHYSIOGRAPHY...................................................................................................................5
GEOLOGY ..............................................................................................................................6
ENGINEERING GEOLOGY ..................................................................................................8
GROUND WATER ...............................................................................................................10
PART II......................................................................................................................................12
LIQUEFACTION POTENTIAL ...........................................................................................12
LIQUEFACTION SUSCEPTIBILITY..................................................................................12
LIQUEFACTION OPPORTUNITY .....................................................................................14
LIQUEFACTION ZONES ....................................................................................................15
ACKNOWLEDGMENTS .........................................................................................................17
REFERENCES ..........................................................................................................................17
SECTION 2 EARTHQUAKE-INDUCED LANDSLIDE EVALUATION REPORT Earthquake-Induced Landslide Zones in the Saticoy 7.5-Minute Quadrangle, Ventura County, California...21
iii

PURPOSE..................................................................................................................................21
BACKGROUND ...................................................................................................................22
METHODS SUMMARY.......................................................................................................22
SCOPE AND LIMITATIONS...............................................................................................23
PART I .......................................................................................................................................24
PHYSIOGRAPHY.................................................................................................................24
GEOLOGY ............................................................................................................................25
ENGINEERING GEOLOGY ................................................................................................27
PART II......................................................................................................................................30
EARTHQUAKE-INDUCED LANDSLIDE HAZARD POTENTIAL.................................30
EARTHQUAKE-INDUCED LANDSLIDE HAZARD ZONE ............................................33
ACKNOWLEDGMENTS .........................................................................................................35
REFERENCES ..........................................................................................................................35
AIR PHOTOS ............................................................................................................................37
APPENDIX A Source of Rock Strength Data...........................................................................38
SECTION 3 GROUND SHAKING EVALUATION REPORT Potential Ground Shaking in the Saticoy 7.5-Minute Quadrangle, Ventura County, California .......................................................39
PURPOSE..................................................................................................................................39
EARTHQUAKE HAZARD MODEL .......................................................................................40
APPLICATIONS FOR LIQUEFACTION AND LANDSLIDE HAZARD ASSESSMENTS 44
USE AND LIMITATIONS........................................................................................................47
REFERENCES ..........................................................................................................................48
iv
ILLUSTRATIONS
Figure 1.1. Distribution of Penetration-Test Results (N1)60 from Silt and Sand Deposits in the Saticoy Quadrangle. ..............................................................................................................11
Figure 2.1. Yield Acceleration vs. Newmark Displacement for the Corralitos Record...............32
Figure 3.1. Saticoy 7.5-Minute Quadrangle and portions of adjacent quadrangles, 10% exceedance in 50 years peak ground acceleration (g)—Firm rock conditions. .....................41
Figure 3.2. Saticoy 7.5-Minute Quadrangle and portions of adjacent quadrangles, 10% exceedance in 50 years peak ground acceleration (g)—Soft rock conditions. ......................42
Figure 3.3. Saticoy 7.5-Minute Quadrangle and portions of adjacent quadrangles, 10% exceedance in 50 years peak ground acceleration (g)—Alluvium conditions.......................43
Figure 3.4. Saticoy 7.5-Minute Quadrangle and portions of adjacent quadrangles, 10% exceedance in 50 years peak ground acceleration—Predominant earthquake. .....................45
Figure 3.5. Saticoy 7.5-Minute Quadrangle and portions of adjacent quadrangles, 10% exceedance in 50 years magnitude-weighted pseudo-peak acceleration for alluvium - Liquefaction opportunity .......................................................................................................46
Table 1.1. Summary of Lithologic Composition of Boreholes Logged in the Saticoy Quadrangle and Statistical Results of Penetration Tests Performed. ........................................................10
Table 1.2. General Geotechnical Characteristics and Liquefaction Susceptibility of Quaternary Sedimentary Units..................................................................................................................13
Table 2.1. Summary of the Shear Strength Statistics for the Saticoy Quadrangle. .....................30
Table 2.2. Summary of Shear Strength Groups for the Saticoy Quadrangle. ..............................30
Table 2.3. Hazard Potential Matrix for Earthquake-Induced Landslides in the Saticoy Quadrangle.. ...........................................................................................................................33
Plate 1.1. Quaternary geologic map of the Saticoy 7.5-Minute Quadrangle. ...............................50
Plate 1.2. Historically shallowest ground-water depths and borehole locations in alluviated valley areas of the Saticoy 7.5-Minute Quadrangle...............................................................51
Plate 2.1. Landslide inventory and shear test sample locations, Saticoy 7.5-Minute Quadrangle.52
v


EXECUTIVE SUMMARY
This report summarizes the methods and sources of information used to prepare the Seismic Hazard Zone Map for the Saticoy 7.5-Minute Quadrangle, Ventura County, California. The map displays the boundaries of Zones of Required Investigation for liquefaction and earthquake-induced landslides over an area of approximately 62 square miles at a scale of 1 inch = 2,000 feet.
The Saticoy Quadrangle in western Ventura County includes the eastern part of the City of San Buenaventura (commonly referred to as the City of Ventura, which includes the community of Montalvo), and the unincorporated community of Saticoy. The rugged southern slope of Sulphur Mountain dominates the terrain in the northern two-thirds quadrangle. Southward from the base of the mountain a series of coalescing alluvial fans forms a piedmont pediment that extends to the Santa Clara River, which is the major drainage in the quadrangle. South-flowing tributary streams that exit from canyons on Sulphur Mountain have eroded steep-sided gullies called barrancas where they cross the pediment. U.S. Highway 101 and State Highway 126 provide access to the southern part of the quadrangle. Residential development is replacing citrus and avocado groves on the piedmont near Montalvo and Saticoy. Either the County of Ventura or the City of Ventura administers land use within the quadrangle
The map is prepared by employing geographic information system (GIS) technology, which allows the manipulation of three-dimensional data. Information considered includes topography, surface and subsurface geology, borehole data, historical ground-water levels, existing landslide features, slope gradient, rock-strength measurements, geologic structure, and probabilistic earthquake shaking estimates. The shaking inputs are based upon probabilistic seismic hazard maps that depict peak ground acceleration, mode magnitude, and mode distance with a 10% probability of exceedance in 50 years.
In the Saticoy Quadrangle the liquefaction zone primarily coincides with the Santa Clara River floodplain in the southeastern corner, part of the alluvial fans west of Arundel Barranca near the western boundary, and the bottoms of several of the major creek canyons. The combination of deeply dissected mountainous terrain and weak sedimentary rocks has produced widespread and abundant landslides. These conditions contribute to an earthquake-induced landslide zone that covers about 49 percent of the Saticoy Quadrangle.
vii

How to view or obtain the map
Seismic Hazard Zone Maps, Seismic Hazard Zone Reports and additional information on seismic hazard zone mapping in California are available on the California Geological Survey's Internet page: http://www.conservation.ca.gov/CGS/index.htm
Paper copies of Official Seismic Hazard Zone Maps, released by CGS, which depict zones of required investigation for liquefaction and/or earthquake-induced landslides, are available for purchase from:
BPS Reprographic Services 945 Bryant Street San Francisco, California 94105 (415) 512-6550
Seismic Hazard Zone Reports (SHZR) summarize the development of the hazard zone map for each area and contain background documentation for use by site investigators and local government reviewers. These reports are available for reference at CGS offices in Sacramento, San Francisco, and Los Angeles. NOTE: The reports are not available through BPS Reprographic Services.

INTRODUCTION
The Seismic Hazards Mapping Act (the Act) of 1990 (Public Resources Code, Chapter 7.8, Division 2) directs the California Department of Conservation (DOC), Division of Mines and Geology (DMG) [now called California Geological Survey (CGS)] to delineate seismic hazard zones. The purpose of the Act is to reduce the threat to public health and safety and to minimize the loss of life and property by identifying and mitigating seismic hazards. Cities, counties, and state agencies are directed to use the seismic hazard zone maps in their land-use planning and permitting processes. They must withhold development permits for a site within a zone until the geologic and soil conditions of the project site are investigated and appropriate mitigation measures, if any, are incorporated into development plans. The Act also requires sellers (and their agents) of real property within a mapped hazard zone to disclose at the time of sale that the property lies within such a zone. Evaluation and mitigation of seismic hazards are to be conducted under guidelines established by the California State Mining and Geology Board (DOC, 1997; also available on the Internet at http://gmw.consrv.ca.gov/shmp/webdocs/sp117.pdf
The Act also directs SMGB to appoint and consult with the Seismic Hazards Mapping Act Advisory Committee (SHMAAC) in developing criteria for the preparation of the seismic hazard zone maps. SHMAAC consists of geologists, seismologists, civil and structural engineers, representatives of city and county governments, the state insurance commissioner and the insurance industry. In 1991 SMGB adopted initial criteria for delineating seismic hazard zones to promote uniform and effective statewide implementation of the Act. These initial criteria provide detailed standards for mapping regional liquefaction hazards. They also directed CGS to develop a set of probabilistic seismic maps for California and to research methods that might be appropriate for mapping earthquake-induced landslide hazards.
In 1996, working groups established by SHMAAC reviewed the prototype maps and the techniques used to create them. The reviews resulted in recommendations that 1) the process for zoning liquefaction hazards remain unchanged and 2) earthquake-induced landslide zones be delineated using a modified Newmark analysis.
This Seismic Hazard Zone Report summarizes the development of the hazard zone map. The process of zoning for liquefaction uses a combination of Quaternary geologic mapping, historical ground-water information, and subsurface geotechnical data. The process for zoning earthquake-induced landslides incorporates earthquake loading, existing landslide features, slope gradient, rock strength, and geologic structure. Probabilistic seismic hazard maps, which are the underpinning for delineating seismic hazard zones, have been prepared for peak ground acceleration, mode magnitude, and mode distance with a 10% probability of exceedance in 50 years (Petersen and others, 1996) in accordance with the mapping criteria.
1

This report summarizes seismic hazard zone mapping for potentially liquefiable soils and earthquake-induced landslides in the Saticoy 7.5-Minute Quadrangle.

SECTION 1 LIQUEFACTION EVALUATION REPORT
Liquefaction Zones in the Saticoy 7.5-Minute Quadrangle,
Ventura County, California
By Ralph C. Loyd
California Department of Conservation
California Geological Survey
PURPOSE
The Seismic Hazards Mapping Act (the Act) of 1990 (Public Resources Code, Chapter 7.8, Division 2) directs the California Department of Conservation (DOC), Division of Mines and Geology (DMG) [now called California Geological Survey (CGS)] to delineate Seismic Hazard Zones. The purpose of the Act is to reduce the threat to public health and safety and to minimize the loss of life and property by identifying and mitigating seismic hazards. Cities, counties, and state agencies are directed to use seismic hazard zone maps developed by CGS in their land-use planning and permitting processes. The Act requires that site-specific geotechnical investigations be performed prior to permitting most urban development projects within seismic hazard zones. Evaluation and mitigation of seismic hazards are to be conducted under guidelines adopted by the California State Mining and Geology Board (SMGB) (DOC, 1997). The text of this report is on the Internet at http://gmw.consrv.ca.gov/shmp/webdocs/sp117.pdf
Following the release of DMG Special Publication 117 (DOC, 1997), agencies in the Los Angeles metropolitan region sought more definitive guidance in the review of geotechnical investigations addressing liquefaction hazards. The agencies made their request through the Geotechnical Engineering Group of the Los Angeles Section of the American Society of Civil Engineers (ASCE). This group convened an implementation committee under the auspices of the Southern California Earthquake Center (SCEC).
3

CALIFORNIA GEOLOGICAL SURVEY SHZR 066 4
The committee, which consisted of practicing geotechnical engineers and engineering geologists, released an overview of the practice of liquefaction analysis, evaluation, and mitigation techniques (SCEC, 1999). This text is also on the Internet at: http://gmw.consrv.ca.gov/shmp/webdocs/sp117.pdf
This section of the evaluation report summarizes seismic hazard zone mapping for potentially liquefiable soils in the Saticoy 7.5-Minute Quadrangle. Section 2 (addressing earthquake-induced landslides) and Section 3 (addressing potential ground shaking) complete the report, which is one of a series that summarizes production of similar seismic hazard zone maps within the state (Smith, 1996). Additional information on seismic hazards zone mapping in California is on CGS’s Internet web page: http://www.conservation.ca.gov/CGS/index.htm
BACKGROUND
Liquefaction-induced ground failure historically has been a major cause of earthquake damage in southern California. During the 1971 San Fernando and 1994 Northridge earthquakes, significant damage to roads, utility pipelines, buildings, and other structures in the Los Angeles area was caused by liquefaction-induced ground displacement.
Localities most susceptible to liquefaction-induced damage are underlain by loose, water-saturated, granular sediment within 40 feet of the ground surface. These geological and ground-water conditions exist in parts of southern, most notably in some densely populated valley regions and alluviated floodplains. In addition, the potential for strong earthquake ground shaking is high because of the many nearby active faults. The combination of these factors constitutes a significant seismic hazard in the southern California region in general, including areas in the Saticoy Quadrangle.
METHODS SUMMARY
Characterization of liquefaction hazard presented in this report requires preparation of maps that delineate areas underlain by potentially liquefiable sediment. The following were collected or generated for this evaluation:
• Existing geologic maps were used to provide an accurate representation of the spatial distribution of Quaternary deposits in the study area. Geologic units that generally are susceptible to liquefaction include late Quaternary alluvial and fluvial sedimentary deposits and artificial fill
• Construction of shallow ground-water maps showing the historically highest known ground-water levels
• Quantitative analysis of geotechnical data to evaluate liquefaction potential of deposits

2003 SEISMIC HAZARD ZONE REPORT FOR THE SATICOY QUADRANGLE 5
• Information on potential ground shaking intensity based on CGS probabilistic shaking maps
The data collected for this evaluation were processed into a series of geographic information system (GIS) layers using commercially available software. The liquefaction zone map was derived from a synthesis of these data and according to criteria adopted by the SMGB (DOC, 2000).
SCOPE AND LIMITATIONS
Evaluation for potentially liquefiable soils generally is confined to areas covered by Quaternary (less than about 1.6 million years) sedimentary deposits. Such areas within the Saticoy Quadrangle consist mainly of alluviated valleys, floodplains, and canyons. CGS’s liquefaction hazard evaluations are based on information on earthquake ground shaking, surface and subsurface lithology, geotechnical soil properties, and ground-water depth, which is gathered from various sources. Although selection of data used in this evaluation was rigorous, the quality of the data used varies. The State of California and the Department of Conservation make no representations or warranties regarding the accuracy of the data obtained from outside sources.
Liquefaction zone maps are intended to prompt more detailed, site-specific geotechnical investigations, as required by the Act. As such, liquefaction zone maps identify areas where the potential for liquefaction is relatively high. They do not predict the amount or direction of liquefaction-related ground displacements, or the amount of damage to facilities that may result from liquefaction. Factors that control liquefaction-induced ground failure are the extent, depth, density, and thickness of liquefiable materials, depth to ground water, rate of drainage, slope gradient, proximity to free faces, and intensity and duration of ground shaking. These factors must be evaluated on a site-specific basis to assess the potential for ground failure at any given project site.
Information developed in the study is presented in two parts: physiographic, geologic, and hydrologic conditions in PART I, and liquefaction and zoning evaluations in PART II.
PART I
PHYSIOGRAPHY
Study Area Location and Physiography
The Saticoy 7.5-Minute Quadrangle covers approximately 62 square miles in western Ventura County. The quadrangle includes the eastern part of the City of San Buenaventura (commonly referred to as the City of Ventura, which includes the community of Montalvo), and the unincorporated community of Saticoy. The rugged
CALIFORNIA GEOLOGICAL SURVEY SHZR 066 6
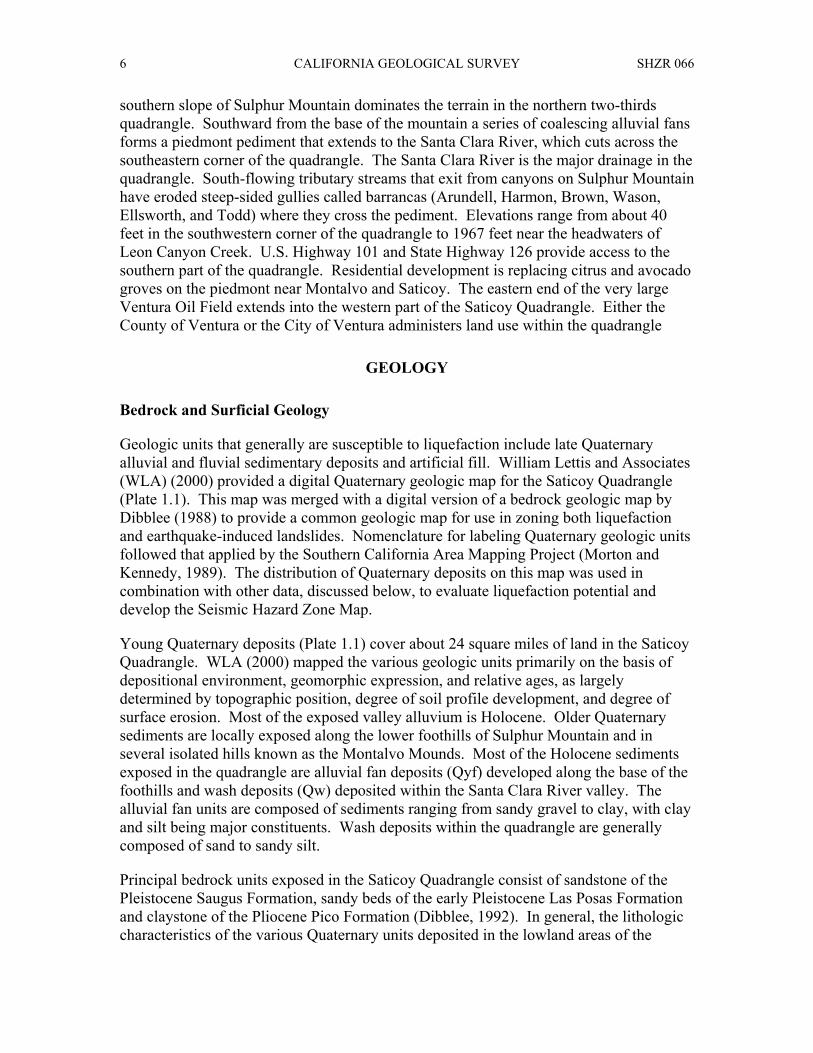
southern slope of Sulphur Mountain dominates the terrain in the northern two-thirds quadrangle. Southward from the base of the mountain a series of coalescing alluvial fans forms a piedmont pediment that extends to the Santa Clara River, which cuts across the southeastern corner of the quadrangle. The Santa Clara River is the major drainage in the quadrangle. South-flowing tributary streams that exit from canyons on Sulphur Mountain have eroded steep-sided gullies called barrancas (Arundell, Harmon, Brown, Wason, Ellsworth, and Todd) where they cross the pediment. Elevations range from about 40 feet in the southwestern corner of the quadrangle to 1967 feet near the headwaters of Leon Canyon Creek. U.S. Highway 101 and State Highway 126 provide access to the southern part of the quadrangle. Residential development is replacing citrus and avocado groves on the piedmont near Montalvo and Saticoy. The eastern end of the very large Ventura Oil Field extends into the western part of the Saticoy Quadrangle. Either the County of Ventura or the City of Ventura administers land use within the quadrangle
GEOLOGY
Bedrock and Surficial Geology
Geologic units that generally are susceptible to liquefaction include late Quaternary alluvial and fluvial sedimentary deposits and artificial fill. William Lettis and Associates (WLA) (2000) provided a digital Quaternary geologic map for the Saticoy Quadrangle (Plate 1.1). This map was merged with a digital version of a bedrock geologic map by Dibblee (1988) to provide a common geologic map for use in zoning both liquefaction and earthquake-induced landslides. Nomenclature for labeling Quaternary geologic units followed that applied by the Southern California Area Mapping Project (Morton and Kennedy, 1989). The distribution of Quaternary deposits on this map was used in combination with other data, discussed below, to evaluate liquefaction potential and develop the Seismic Hazard Zone Map.
Young Quaternary deposits (Plate 1.1) cover about 24 square miles of land in the Saticoy Quadrangle. WLA (2000) mapped the various geologic units primarily on the basis of depositional environment, geomorphic expression, and relative ages, as largely determined by topographic position, degree of soil profile development, and degree of surface erosion. Most of the exposed valley alluvium is Holocene. Older Quaternary sediments are locally exposed along the lower foothills of Sulphur Mountain and in several isolated hills known as the Montalvo Mounds. Most of the Holocene sediments exposed in the quadrangle are alluvial fan deposits (Qyf) developed along the base of the foothills and wash deposits (Qw) deposited within the Santa Clara River valley. The alluvial fan units are composed of sediments ranging from sandy gravel to clay, with clay and silt being major constituents. Wash deposits within the quadrangle are generally composed of sand to sandy silt.
Principal bedrock units exposed in the Saticoy Quadrangle consist of sandstone of the Pleistocene Saugus Formation, sandy beds of the early Pleistocene Las Posas Formation and claystone of the Pliocene Pico Formation (Dibblee, 1992). In general, the lithologic characteristics of the various Quaternary units deposited in the lowland areas of the

2003 SEISMIC HAZARD ZONE REPORT FOR THE SATICOY QUADRANGLE 7
Saticoy Quadrangle reflect the source-area bedrock units in the adjacent highland regions. For example, if a basin is situated adjacent to highlands where exposed bedrock units are primarily composed of claystone, then alluvial deposits filling that basin will contain abundant clay. Conversely, if sandstone is exposed over much of the drainage area, alluvial deposits will contain abundant sand. However, if various rock types are exposed in the drainage area, alluvial deposits tend to alternate between fine- and coarser-grained materials depending on fluctuations in stream energy, changes in active stream channels, and variations of erosion rates within the drainage basin due to localized landsliding, fires, and other natural processes. Conditions governing deposition of alluvial fans in the Saticoy Quadrangle appear to relate closely with variations in erosion rates. Refer to the earthquake-induced landslide portion (Section 2) of this report for further details on the bedrock units exposed in the Saticoy Quadrangle.
CGS conducted a subsurface investigation of Quaternary sedimentary deposits in the Saticoy Quadrangle using 124 geotechnical borehole logs collected from the files of the Ventura County Water Resources and Engineering Department, Ventura County Hazardous Substances Control Program, and the California Department of Transportation (CalTrans). Locations of the exploratory boreholes considered in this investigation are shown on Plate 1.2. Staff entered the data from the geotechnical logs into CGS's GIS in order to create a database that would allow effective examination of subsurface geology through construction of computer-generated cross sections and evaluation of liquefaction potential of sedimentary deposits through the performance of computer-based quantitative analysis (see Engineering Geology section).
Construction of cross sections using data entered into the GIS database enabled staff to examine the nature and distribution of various depositional units in the subsurface, to correlate soil types from one borehole to another, extrapolate geotechnical data into outlying areas containing similar soils, and evaluate historic groundwater depths. Cross-sections generated in the Saticoy Quadrangle show distinct lithologic signatures related to various local geologic environments. For example, the alluvial fans developed along the base of the foothills are composed of alternating and mixed beds of clay, silt, and sand, with clay and silt being the most abundant constituents. On the other hand, subsurface beds deposited within the bed and flood plain of the Santa Clara River in the southeastern part of the quadrangle are composed predominantly of sand.
Structural Geology
The Saticoy Quadrangle lies within the Transverse Ranges geomorphic province, which is characterized by west-trending folds, thrust faults, and fault-bounded valleys. The structural framework of the region is generally considered the result of regional compression caused by right-lateral, strike-slip movement on the "Big Bend" segment of the San Andreas Fault. Folded and faulted Pliocene to Quaternary sedimentary rocks mark the structure of the Saticoy Quadrangle. Major faults in the region are west trending. One of these is the Ventura Fault (Plate 1.1) whose inferred trace extends along the base of the hills generally coincident with Foothill Road and continues westward into the Ventura Quadrangle (Dibblee, 1988; 1992). This fault is identified as an Official Earthquake Fault Zone by CGS (DOC, 1978).

CALIFORNIA GEOLOGICAL SURVEY SHZR 066 8
In addition, an inferred part of the southwesterly-trending Oak Ridge Fault lies within the Saticoy Quadrangle (Plate 1.1). Although this fault does not meet the criteria required for inclusion in the Official Earthquake Fault Zone (it is not a well-defined fault), it is considered to be a potential seismic source (Cramer and Petersen, 1996; Petersen and others, 1996). Rupture along either of these local faults, or shaking produced by large to great earthquakes in the general region, could trigger liquefaction, locally, within alluviated areas of the Saticoy Quadrangle.
ENGINEERING GEOLOGY
In addition to the borehole log data mentioned above, 55 of the 124 borehole logs collected in this study record Standard Penetration Test (SPT) results or normalized SPT results that provide information on the density, or compactness, of Quaternary sedimentary layers penetrated by a borehole. This test, along with the results of other engineering tests (dry density, moisture content, sieve analysis, etc.) are used in the Seed-Idriss Simplified Procedure (Seed and Idriss (1971) to evaluate liquefaction potential of a site (see Part II of this section - Quantitative Liquefaction Analysis). The SPT involves recording the number of blows required to drive a 1.4-inch inside diameter split-spoon sampler one foot into the soil using a 140-pound hammer-weight dropped 30 inches. The test is conducted in compliance with American Society for Testing and Materials (ASTM) D1586 (ASTM, 1999). Recorded blow counts for non-SPT geotechnical sampling, where the sampler diameter, hammer weight or drop distance differ within accepted limits, are converted to SPT-equivalent blow count values and entered into the CGS GIS. It must be noted that the reliability of the SPT-equivalent values varies. Therefore, they are weighted and some are used in a more qualitative manner. Few borehole logs, however, include all of the information (e.g. soil density, moisture content, sieve analysis, etc.) required for an ideal Seed-Idriss Simplified Procedure. For boreholes having acceptable penetration tests, liquefaction analysis is performed either using recorded density, moisture, and sieve test values or using averaged test values of similar materials. The actual and converted SPT blow counts are normalized to a common reference effective overburden pressure of one atmosphere (approximately one ton per square foot) and a hammer efficiency of 60% using a method described by Seed and Idriss (1982) and Seed and others (1985). This normalized blow count is referred to as (N1)60.
It is important to note that the Seed-Idriss Simplified Procedure was developed primarily for clean sand and silty sand and results depend greatly on accurate measurement of in-situ soil density. However, the cross sections generated in this study show that some of the young Quaternary alluvial deposits contain a significant amount of gravel. In the past, gravelly soils were considered not to be susceptible to liquefaction because the high permeability of these soils presumably would allow the dissipation of pore pressures before liquefaction could occur. However, liquefaction in gravelly soils has been observed during earthquakes, and recent laboratory studies have shown that gravelly soils are susceptible to liquefaction (Ishihara, 1985; Harder and Seed, 1986; Budiman and Mohammadi, 1995; Evans and Zhou, 1995; and Sy and others, 1995). SPT-derived density measurements in gravelly soils are unreliable and generally too high. They are

2003 SEISMIC HAZARD ZONE REPORT FOR THE SATICOY QUADRANGLE 9
likely to lead to overestimation of the density of the soil and, therefore, result in an underestimation of the liquefaction susceptibility. To identify potentially liquefiable units where the N values appear to have been affected by gravel content, correlations are made with boreholes in the same unit where the N (blow count) values do not appear to be affected by gravel content.
In the Saticoy Quadrangle, more than 5400 linear feet of Quaternary sediments were penetrated by the 124 boreholes whose logs were collected during this project. The percentages of major soil types and statistical information regarding the number and results of penetration tests performed in each soil type are summarized in Table 1.1. Most of the boreholes penetrate clay- and silt-rich sediments that make up the alluvial fan deposits that accumulated along the base of the mountain front north of the Santa Clara River. Sand is the dominant material in the approximately ten boreholes that penetrated wash (Qw) and valley alluvial deposits (Qya) within and adjacent to the Santa Clara River. SPT and SPT-normalized blow-count values indicate that the majority of sandy and silty layers deposited in the upper 40 feet of valley surfaces, regardless of environment or relative Holocene age of deposition (Qyf1, Qyf2, Qya, Qw, etc), are composed of loose (5-15 blows) to moderately dense (25-30 blows) material (Figure 1.1 and Table 1.1). Those sample intervals having high blow counts (>60 blows) commonly reflect gravel clasts in a matrix of sand, silt, or clay as indicated in the lithologic descriptions given in the logs. The penetration test results indicate that the upper 40 feet of valley alluvium deposits throughout the Saticoy Quadrangle are composed of loose to moderately dense younger Quaternary material. Dry density test values and lithologic comments support this conclusion. As a result, liquefaction potential in the Saticoy Quadrangle is governed principally by depth to ground water and the proportions of clay, silt, and sand in deposits within 40 feet of the surface.

CALIFORNIA GEOLOGICAL SURVEY SHZR 066 10
Lithology % of Total Sediment
Drilled/Logged
Number of Penetration
Test Samples *
Blow Count Range
(<60 Blows)
Blow Count Mean
Blow Count
Median
Coefficient of Variation
CL, CH, MH 25 103/116 2-56 17 14 0.65
ML 40 186/203 1-58 14.7 11 0.81
SP 6 11/25 1-59 34.2 39 0.46
SW 8 4/7 9-57 28.7 25 0.57
SM 13 34/41 2-58 17.1 15 0.76
SC 2 8/11 3-34 15.7 10 0.69
GC, GM, GW,GP 5 5/18 14-60 38.5 40 0.38
* Number of penetration tests with SPT or SPT equivalent blow counts (N1(60)) less than 30 / total number of penetration tests performed.
Table 1.1. Summary of Lithologic Composition of Boreholes Logged in the Saticoy Quadrangle and Statistical Results of Penetration Tests Performed.
GROUND WATER
Liquefaction hazard may exist in areas where depth to ground water is 40 feet or less. This is because saturated conditions in near-surface sediments reduce the effective normal stress thereby increasing the likelihood of earthquake-induced liquefaction (Youd, 1973). CGS liquefaction evaluations incorporate the historically highest known ground-water levels since depth to ground water during an earthquake cannot be anticipated because of the unpredictable fluctuations

2003 SEISMIC HAZARD ZONE REPORT FOR THE SATICOY QUADRANGLE 11
Silt (ML)
0
1
2
3
4
5
6
7
8
9
10
11
12
13
14
15
16
0 5 10 15 20 25 30 35 40 45 50 55 60N1(60)
Freq
uenc
y
Silty Sand (SM)
0
1
2
3
4
5
0 5 10 15 20 25 30 35 40 45 50 55 60
N1(60)
Freq
uenc
y
Poorly-Graded Sand (SP)
0
1
2
3
4
5
0 5 10 15 20 25 30 35 40 45 50 55 60
N1(60)
Freq
uenc
y
Figure 1.1. Distribution of Penetration-Test Results (N1)60 from Silt and Sand Deposits in the Saticoy Quadrangle. Not shown are the few tests performed in clayey sand and well-graded sand (statistically invalid).
caused by natural processes and human activities. Thus, CGS develops a hypothetical ground-water table map within alluviated areas based on the estimated shallowest depths that have occurred during historic time. This map differs from conventional ground-
CALIFORNIA GEOLOGICAL SURVEY SHZR 066 12
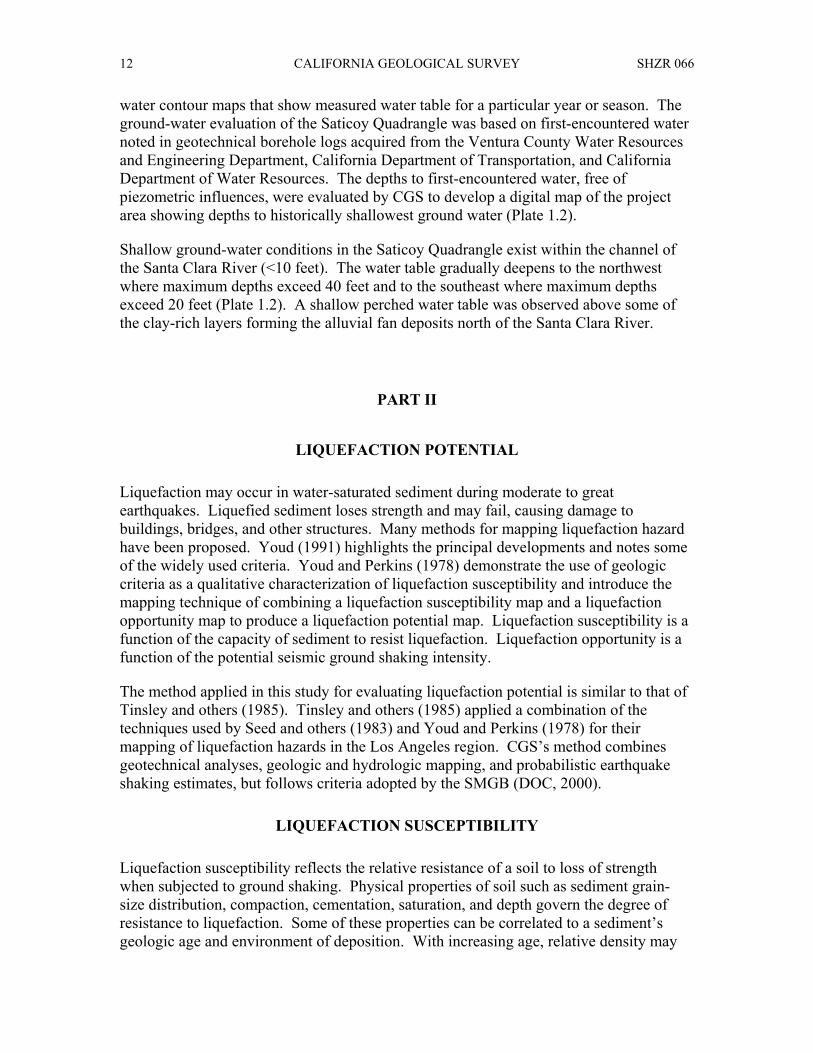
water contour maps that show measured water table for a particular year or season. The ground-water evaluation of the Saticoy Quadrangle was based on first-encountered water noted in geotechnical borehole logs acquired from the Ventura County Water Resources and Engineering Department, California Department of Transportation, and California Department of Water Resources. The depths to first-encountered water, free of piezometric influences, were evaluated by CGS to develop a digital map of the project area showing depths to historically shallowest ground water (Plate 1.2).
Shallow ground-water conditions in the Saticoy Quadrangle exist within the channel of the Santa Clara River (<10 feet). The water table gradually deepens to the northwest where maximum depths exceed 40 feet and to the southeast where maximum depths exceed 20 feet (Plate 1.2). A shallow perched water table was observed above some of the clay-rich layers forming the alluvial fan deposits north of the Santa Clara River.
PART II
LIQUEFACTION POTENTIAL
Liquefaction may occur in water-saturated sediment during moderate to great earthquakes. Liquefied sediment loses strength and may fail, causing damage to buildings, bridges, and other structures. Many methods for mapping liquefaction hazard have been proposed. Youd (1991) highlights the principal developments and notes some of the widely used criteria. Youd and Perkins (1978) demonstrate the use of geologic criteria as a qualitative characterization of liquefaction susceptibility and introduce the mapping technique of combining a liquefaction susceptibility map and a liquefaction opportunity map to produce a liquefaction potential map. Liquefaction susceptibility is a function of the capacity of sediment to resist liquefaction. Liquefaction opportunity is a function of the potential seismic ground shaking intensity.
The method applied in this study for evaluating liquefaction potential is similar to that of Tinsley and others (1985). Tinsley and others (1985) applied a combination of the techniques used by Seed and others (1983) and Youd and Perkins (1978) for their mapping of liquefaction hazards in the Los Angeles region. CGS’s method combines geotechnical analyses, geologic and hydrologic mapping, and probabilistic earthquake shaking estimates, but follows criteria adopted by the SMGB (DOC, 2000).
LIQUEFACTION SUSCEPTIBILITY
Liquefaction susceptibility reflects the relative resistance of a soil to loss of strength when subjected to ground shaking. Physical properties of soil such as sediment grain-size distribution, compaction, cementation, saturation, and depth govern the degree of resistance to liquefaction. Some of these properties can be correlated to a sediment’s geologic age and environment of deposition. With increasing age, relative density may

2003 SEISMIC HAZARD ZONE REPORT FOR THE SATICOY QUADRANGLE 13
increase through cementation of the particles or compaction caused by the weight of the overlying sediment. Grain-size characteristics of a soil also influence susceptibility to liquefaction. Sand is more susceptible than silt or gravel, although silt of low plasticity is treated as liquefiable in this investigation. Cohesive soils generally are not considered susceptible to liquefaction. Such soils may be vulnerable to strength loss with remolding and represent a hazard that is not addressed in this investigation. Soil characteristics and processes that result in higher measured penetration resistances generally indicate lower liquefaction susceptibility. Thus, blow count and cone penetrometer values are useful indicators of liquefaction susceptibility.
Saturation is required for liquefaction, and the liquefaction susceptibility of a soil varies with the depth to ground water. Very shallow ground water increases the susceptibility to liquefaction (soil is more likely to liquefy). Soils that lack resistance (susceptible soils) typically are saturated, loose and sandy. Soils resistant to liquefaction include all soil types that are dry, cohesive, or sufficiently dense. CGS’s map inventory of areas containing soils susceptible to liquefaction begins with evaluation of geologic maps and historical occurrences, cross-sections, geotechnical test data, geomorphology, and ground-water hydrology. Soil properties and soil conditions such as type, age, texture, color, and consistency, along with historical depths to ground water are used to identify, characterize, and correlate susceptible soils. Because Quaternary geologic mapping is based on similar soil observations, liquefaction susceptibility maps typically are similar to Quaternary geologic maps. CGS’s qualitative relations between general liquefaction susceptibility and geologic map units are summarized in Table 1.2.
Geologic Map Unit Sediment Type Environment of
Deposition Consistency Susceptible to
Liquefaction?* Qw, Qw2, Qw1 Gravel, sand, silt Stream channels Loose Yes
Qf Sand, silt, clay Active alluvial fans
Loose Yes**
Qyf1, Qyf2 Sand, silt, clay Young alluvial fan and valley deposits
Loose to moderately dense
Yes**
Qoa, Qof Clay, silt, sand, and gravel deposits.
Older alluvial deposits
Dense to very dense
Not likely
* When saturated. ** Not likely if all clay or sand and silt layers are clayey.
Table 1. 2. General Geotechnical Characteristics and Liquefaction Susceptibility of Quaternary Sedimentary Units.

CALIFORNIA GEOLOGICAL SURVEY SHZR 066 14
LIQUEFACTION OPPORTUNITY
Liquefaction opportunity is a measure, expressed in probabilistic terms, of the potential for strong ground shaking. Analyses of in-situ liquefaction resistance require assessment of liquefaction opportunity. The minimum level of seismic excitation to be used for such purposes is the level of peak ground acceleration (PGA) with a 10% probability of exceedance over a 50-year period (DOC, 2000). The earthquake magnitude used in CGS’s analysis is the magnitude that contributes most to the calculated PGA for an area.
For the Saticoy Quadrangle, PGAs of 0.61g to 0.72g resulting from an earthquake of magnitude 6.9 were used for liquefaction analyses. The PGA and magnitude values were based on de-aggregation of the probabilistic hazard at the 10% in 50-year hazard level (Petersen and others, 1996; Cramer and Petersen, 1996). See the ground motion section (3) of this report for further details.
Quantitative Liquefaction Analysis
CGS performs quantitative analysis of geotechnical data to evaluate liquefaction potential using the Seed-Idriss Simplified Procedure (Seed and Idriss, 1971; Seed and others, 1983; National Research Council, 1985; Seed and others, 1985; Seed and Harder, 1990; Youd and Idriss, 1997; Youd and others, 2001). Using the Seed-Idriss Simplified Procedure one can calculate soil resistance to liquefaction, expressed in terms of cyclic resistance ratio (CRR), based on SPT results, ground-water level, soil density, moisture content, soil type, and sample depth. CRR values are then compared to calculated earthquake-generated shear stresses expressed in terms of cyclic stress ratio (CSR). The Seed-Idriss Simplified Procedure requires normalizing earthquake loading relative to a M7.5 event for the liquefaction analysis. To accomplish this, CGS’s analysis uses the Idriss magnitude-scaling factor (MSF) (Youd and Idriss, 1997). It is convenient to think in terms of a factor of safety (FS) relative to liquefaction, where: FS = (CRR / CSR) * MSF. FS, therefore, is a quantitative measure of liquefaction potential. CGS uses a factor of safety of 1.0 or less, where CSR equals or exceeds CRR, to indicate the presence of potentially liquefiable soil. While an FS of 1.0 is considered the “trigger” for liquefaction, for a site specific analysis an FS of as much as 1.5 may be appropriate depending on the vulnerability of the site and related structures.
The CGS liquefaction analysis program calculates an FS for each geotechnical sample where blow counts were collected. Typically, multiple samples are collected for each borehole. The program then independently calculates an FS for each non-clay layer that includes at least one penetration test using the minimum (N1)60 value for that layer. The minimum FS value of the layers penetrated by the borehole is used to determine the liquefaction potential for each borehole location. The reliability of FS values varies according to the quality of the geotechnical data. FS, as well as other considerations such as slope, presence of free faces, and thickness and depth of potentially liquefiable soil, are evaluated in order to construct liquefaction potential maps, which are then used to make a map showing zones of required investigation.

2003 SEISMIC HAZARD ZONE REPORT FOR THE SATICOY QUADRANGLE 15
LIQUEFACTION ZONES
Criteria for Zoning
Areas underlain by materials susceptible to liquefaction during an earthquake were included in liquefaction zones using criteria developed by the Seismic Hazards Mapping Act Advisory Committee and adopted by the SMGB (DOC, 2000). Under those guideline criteria, liquefaction zones are areas meeting one or more of the following:
1. Areas known to have experienced liquefaction during historical earthquakes
2. All areas of uncompacted artificial fill containing liquefaction-susceptible material that are saturated, nearly saturated, or may be expected to become saturated
3. Areas where sufficient existing geotechnical data and analyses indicate that the soils are potentially liquefiable
4. Areas where existing geotechnical data are insufficient
In areas of limited or no geotechnical data, susceptibility zones may be identified by geologic criteria as follows:
a) Areas containing soil deposits of late Holocene age (current river channels and their historic floodplains, marshes and estuaries), where the M7.5-weighted peak acceleration that has a 10% probability of being exceeded in 50 years is greater than or equal to 0.10 g and the water table is less than 40 feet below the ground surface; or
b) Areas containing soil deposits of Holocene age (less than 11,000 years), where the M7.5-weighted peak acceleration that has a 10% probability of being exceeded in 50 years is greater than or equal to 0.20 g and the historical high water table is less than or equal to 30 feet below the ground surface; or
c) Areas containing soil deposits of latest Pleistocene age (11,000 to 15,000 years), where the M7.5-weighted peak acceleration that has a 10% probability of being exceeded in 50 years is greater than or equal to 0.30 g and the historical high water table is less than or equal to 20 feet below the ground surface.
Application of SMGB criteria to liquefaction zoning in the Saticoy Quadrangle is summarized below.
Areas of Past Liquefaction
Evidence of historical liquefaction in the Saticoy Quadrangle has been reported for two earthquake events. First, excerpts from an 1858 topographic survey report describe ground lurch cracks in the bed of the Santa Clara River just south of San Buenaventura immediately after the great 1857 Fort Tejon earthquake on the San Andreas Fault (California Division of Mines and Geology, 1976). The 1976 CGS report also describes observations made of additional sand boil and ground lurching features in the channel of

CALIFORNIA GEOLOGICAL SURVEY SHZR 066 16
the Santa Clara River following the Point Mugu earthquake of February 21, 1973 (Plate 1.2).
Artificial Fills
In the Saticoy Quadrangle, artificial fill areas large enough to show at the scale of mapping consist of engineered fill for river levees and elevated freeways. Since these fills are considered to be properly engineered, zoning for liquefaction in such areas depends on soil conditions in underlying strata. Non-engineered fills are commonly loose and uncompacted, and the material varies in size and type.
Areas with Sufficient Existing Geotechnical Data
In general, sufficient geotechnical data to adequately evaluate potential for liquefaction exists over most of the alluviated lowland areas of the Saticoy Quadrangle. The following areas are included in zones of further investigation based on evaluation of borehole logs and quantitative analysis of soil test data:
The upper part of the alluvial fans deposits developed along the base of the foothills between Arundell Barranca and the western border of the quadrangle contain loose sand and silt layers interbedded with clay-rich deposits. Depth to ground water in this area is less than 40 feet.
The general area between and to the east of the two major hills known as the Montalvo Mounds (along Freeway 101) contain silt and isolated sand layers interbedded with clay-rich deposits. The sandy deposits probably originated in part from the coarse-grained older alluvium exposed on the uplifted Montalvo Mounds (pressure ridges of the Oak Ridge Fault). Historical depth to ground water in this area is between 10 and 15 feet.
The Santa Clara River and the Oxnard Plain contain sand-rich stream channel (Qw) and valley alluvial (Qya) that dominate the upper 40 feet of the subsurface. Depth to historical ground water over most of this area is less than 20 feet.
Logs of boreholes drilled in the adjacent Santa Paula Quadrangle indicate that the alluvial fan deposits developed east of Saticoy contain considerably higher sand content than do those developed to the west. This abrupt change in sand content appears to coincide with the coalescing fans developed by the creeks draining Peppertree, Aliso, and Wheeler canyons. Fans developed to the east in the Santa Paula Quadrangle are of similar lithology.
Areas with Insufficient Existing Geotechnical Data
SMGB criteria for zoning areas with insufficient existing geotechnical data is applied to canyon floors and creek channels that are assumed to contain young Quaternary sandy soils.

2003 SEISMIC HAZARD ZONE REPORT FOR THE SATICOY QUADRANGLE 17
ACKNOWLEDGMENTS
Thanks to Christopher Hitchcock of William Lettis and Associates for providing original mapping of Quaternary geology of the Saticoy Quadrangle. Appreciation is also extended to managers and staff of Ventura County Department of Water Resources and Engineering, Ventura County Hazardous Substances Program, and California Department of Transportation (CalTrans) for providing geotechnical data that were critical to the successful completion of this study.
REFERENCES
American Society for Testing and Materials, 1999, Standard test method for penetration test and split-barrel sampling of soils, Test Method D1586-99, in Annual Book of ASTM Standards, v. 4.08.
Budiman, J.S. and Mohammadi, Jamshid, 1995, Effect of large inclusions on liquefaction of sands, in Evans, M.D. and Fragaszy, R.J., editors, Static and Dynamic properties of Gravelly Soils: American Society of Civil Engineers Geotechnical Special Publication no. 56, p. 48-63.
California Department of Conservation, Division of Mines and Geology, 1978, Official Map of Earthquake Fault Zones, Saticoy Quadrangle, scale 1:24,000.
California Department of Conservation, Division of Mines and Geology, 1997, Guidelines for evaluating and mitigating seismic hazards in California, Special Publication 117, 74 p.
California Department of Conservation, Division of Mines and Geology, 2000, Recommended criteria for delineating seismic hazard zones in California, Special Publication 118, 12 p.
California Division of Mines and Geology, 1976, Seismic hazards study of Ventura County, California: Open File Report 76-5 LA, 396 p., map scale 1:48000.
Cramer, C.H. and Petersen, M.D., 1996, Predominant seismic source distance and magnitude maps for Los Angeles, Orange, and Ventura counties, California: Bulletin of Seismological Society of America, v. 86, no. 5, p. 1,645-1,649.
Dibblee, T.W., Jr., 1988, Geologic map of the Ventura and Pitas Point quadrangles, Ventura County, California: Dibblee Geological Foundation Map DF-21, scale 1:24000.
Dibblee, T.W., Jr., 1992, Geologic map of the Saticoy Quadrangle, Ventura County, California: Dibblee Geological Foundation Map DF-42, scale 1:24000.

CALIFORNIA GEOLOGICAL SURVEY SHZR 066 18
Evans, M.D. and Zhou, Shengping, 1995, Liquefaction behaviour of sand-gravel composites: American Society of Civil Engineers, Journal of Geotechnical Engineering, v. 121, no. 3, p. 287-298.
Harder, L.F. and Seed, H.B., 1986, Determination of penetration resistance for coarse-grained soils using the Becker hammer drill: University of California at Berkeley, College of Engineering, Earthquake Engineering Research Center, report no. UCB/EERC-86/06, 126 p.
Ishihara, Kenji, 1985, Stability of natural deposits during earthquakes, in Proceedings of the Eleventh International Conference on Soil Mechanics and Foundation Engineering, San Francisco, v. 1, p. 321-376.
Morton, D.M. and Kennedy, M.P., 1989, A southern California digital 1:100,000-scale geologic map series: The Santa Ana Quadrangle, The first release: Geological Society of America Abstracts with Programs v. 21, no. 6, p. A107-A108.
National Research Council, 1985, Liquefaction of soils during earthquakes: National Research Council Special Publication, Committee on Earthquake Engineering, National Academy Press, Washington, D.C., 240 p.
Petersen, M.D., Bryant, W.A., Cramer, C.H., Cao, Tianqing, Reichle, M.S., Frankel, A.D., Lienkaemper, J.J., McCrory, P.A. and Schwartz, D.P., 1996, Probabilistic seismic hazard assessment for the State of California: California Department of Conservation, Division of Mines and Geology, Open File Report 96-08; U.S. Geological Survey Open File Report 96-706, 33 p.
Seed, H.B. and Idriss, I.M., 1971, Simplified procedure for evaluating soil liquefaction potential: Journal of the Soil Mechanics and Foundations Division of ASCE, v. 97: SM9, p. 1,249-1,273.
Seed, H.B. and Idriss, I.M., 1982, Ground motions and soil liquefaction during earthquakes: Monograph Series, Earthquake Engineering Research Institute, Berkeley, California, 134 p.
Seed, H.B., Idriss, I.M. and Arango, Ignacio, 1983, Evaluation of liquefaction potential using field performance data: Journal of Geotechnical Engineering, v. 109, no. 3, p. 458-482.
Seed, H.B., Tokimatsu, Kohji, Harder, L.F., and Chung, R.M., 1985, Influence of SPT procedures in soil liquefaction resistance evaluations: Journal of Geotechnical Engineering, ASCE, v. 111, no. 12, p. 1,425-1,445.
Seed, R.B. and Harder, L.F., 1990, SPT-based analysis of cyclic pore pressure generation and undrained residual strength: Proceedings of the H. Bolton Seed Memorial Symposium, v. 2, p. 351-376.
2003 SEISMIC HAZARD ZONE REPORT FOR THE SATICOY QUADRANGLE 19
Smith, T.C., 1996, Preliminary maps of seismic hazard zones and draft guidelines for evaluating and mitigating seismic hazards: California Geology, v. 49, no. 6, p. 147-150.
Southern California Earthquake Center, 1999, Recommended procedures for implementation of DMG Special Publication 117 guidelines for analyzing and mitigating liquefaction in California: Southern California Earthquake Center, University of Southern California, 63 p.
Sy, Alex, Campanella, R.G. and Stewart, R.A., 1995, BPT-SPT correlations for evaluations of liquefaction resistance in gravelly soils, in Evans, M.D. and Fragaszy, R.J., editors, Static and Dynamic Properties of Gravelly Soils: American Society of Civil Engineers Geotechnical Special Publication no. 56, p. 1-19.
Tinsley, J.C., Youd, T.L., Perkins, D.M. and Chen, A.T.F., 1985, Evaluating liquefaction potential, in Ziony, J.I., editor, Evaluating earthquake hazards in the Los Angeles region — An earth science perspective: U.S. Geological Survey Professional Paper 1360, p. 263-316.
William Lettis and Associates, 2000, Digital Quaternary geologic map of the Saticoy 7.5-Minute Quadrangle: digitized at scale 1:24000.
Youd, T.L., 1973, Liquefaction, flow and associated ground failure: U.S. Geological Survey Circular 688, 12 p.
Youd, T.L., 1991, Mapping of earthquake-induced liquefaction for seismic zonation: Earthquake Engineering Research Institute, Proceedings, Fourth International Conference on Seismic Zonation, v. 1, p. 111-138.
Youd, T.L. and Idriss, I.M., 1997, editors, Proceedings of the NCEER workshop on evaluation of liquefaction resistance of soils: National Center for Earthquake Engineering Research Technical Report NCEER-97-0022, 276 p.
Youd, T.L., Idriss, I.M., Andrus, R.D., Arango, I., Castro, G., Christian, J.T., Dobry, R., Finn, W.D.L., Harder, L.F. Jr., Hynes, M.E., Ishihara, K., Koester, J.P., Liao, S.S.C., Marcusson, W.F., Martin, G.R., Mitchell, J.K., Moriwaki, Y., Power, M.S., Robertson, P.K., Seed, R.B. and Stokoe, K.H., 2001, Liquefaction resistance of soils; Summary report from the 1996 NCEER/NSF workshops on evaluation of liquefaction resistance of soils: Journal of Geotechnical and Geoenvironmental Engineering, October 2001, p. 817-833.
Youd, T.L. and Perkins, D.M., 1978, Mapping liquefaction-induced ground failure potential: Journal of Geotechnical Engineering, v. 104, p. 433-446.

2003 SEISMIC HAZARD ZONE REPORT FOR THE SATICOY QUADRANGLE 21
SECTION 2 EARTHQUAKE-INDUCED LANDSLIDE
EVALUATION REPORT
Earthquake-Induced Landslide Zones in the Saticoy 7.5-Minute Quadrangle, Ventura
County, California
By Don F. Hoirup, Jr., Anne Rosinski, and Pamela J. Irvine
California Department of Conservation
California Geological Survey
PURPOSE
The Seismic Hazards Mapping Act (the Act) of 1990 (Public Resources Code, Chapter 7.8, Division 2) directs the California Department of Conservation (DOC), Division of Mines and Geology (DMG) [now called California Geological Survey (CGS)] to delineate Seismic Hazard Zones. The purpose of the Act is to reduce the threat to public health and safety and to minimize the loss of life and property by identifying and mitigating seismic hazards. Cities, counties, and state agencies are directed to use seismic hazard zone maps prepared by CGS in their land-use planning and permitting processes. The Act requires that site-specific geotechnical investigations be performed prior to permitting most urban development projects within the hazard zones. Evaluation and mitigation of seismic hazards are to be conducted under guidelines established by the California State Mining and Geology Board (DOC, 1997). The text of this report is on the Internet at http://gmw.consrv.ca.gov/shmp/webdocs/sp117.pdf

CALIFORNIA GEOLOGICAL SURVEY SHZR 066 22
Following the release of DMG Special Publication 117 (DOC, 1997), agencies in the Los Angeles metropolitan region sought more definitive guidance in the review of geotechnical investigations addressing landslide hazards. The agencies made their request through the Geotechnical Engineering Group of the Los Angeles Section of the American Society of Civil Engineers (ASCE). This group convened an implementation committee in 1998 under the auspices of the Southern California Earthquake Center (SCEC). The committee, which consisted of practicing geotechnical engineers and engineering geologists, released an overview of the practice of landslide analysis, evaluation, and mitigation techniques (SCEC, 2002). This text is also on the Internet at: http://www.scec.org/
This section of the evaluation report summarizes seismic hazard zone mapping for earthquake-induced landslides in the Saticoy 7.5-Minute Quadrangle. Section 1 (addressing liquefaction) and Section 3 (addressing earthquake shaking) complete the report, which is one of a series that summarizes the preparation of seismic hazard zone maps within the state (Smith, 1996). Additional information on seismic hazard zone mapping in California can be accessed on CGS’s Internet web page: http://www.conservation.ca.gov/CGS/index.htm
BACKGROUND
Landslides triggered by earthquakes historically have been a significant cause of earthquake damage. In California, large earthquakes such as the 1971 San Fernando, 1989 Loma Prieta, and 1994 Northridge earthquakes triggered landslides that were responsible for destroying or damaging numerous structures, blocking major transportation corridors, and damaging life-line infrastructure. Areas that are most susceptible to earthquake-induced landslides are steep slopes in poorly cemented or highly fractured rocks, areas underlain by loose, weak soils, and areas on or adjacent to existing landslide deposits. These geologic and terrain conditions exist in many parts of California, including numerous hillside areas that have already been developed or are likely to be developed in the future. The opportunity for strong earthquake ground shaking is high in many parts of California because of the presence of numerous active faults. The combination of these factors constitutes a significant seismic hazard throughout much of California, including the hillside areas of the Saticoy Quadrangle.
METHODS SUMMARY
The mapping of earthquake-induced landslide hazard zones presented in this report is based on the best available terrain, geologic, geotechnical, and seismological data. If unavailable or significantly outdated, new forms of these data were compiled or generated specifically for this project. The following were collected or generated for this evaluation:
• Digital terrain data were used to provide an up-to-date representation of slope gradient and slope aspect in the study area

2003 SEISMIC HAZARD ZONE REPORT FOR THE SATICOY QUADRANGLE 23
• Geologic mapping was used to provide an accurate representation of the spatial distribution of geologic materials in the study area. In addition, a map of existing landslides, whether triggered by earthquakes or not, was prepared
• Geotechnical laboratory test data were collected and statistically analyzed to quantitatively characterize the strength properties and dynamic slope stability of geologic materials in the study area
• Seismological data in the form of CGS probabilistic shaking maps and catalogs of strong-motion records were used to characterize future earthquake shaking within the mapped area
The data collected for this evaluation were processed into a series of GIS layers using commercially available software. A slope stability analysis was performed using the Newmark method of analysis (Newmark, 1965), resulting in a map of landslide hazard potential. The earthquake-induced landslide hazard zone was derived from the landslide hazard potential map according to criteria developed in a CGS pilot study (McCrink and Real, 1996; McCrink, 2001) and adopted by the State Mining and Geology Board (DOC, 2000).
SCOPE AND LIMITATIONS
The methodology used to make this map is based on earthquake ground-shaking estimates, geologic material-strength characteristics and slope gradient. These data are gathered from a variety of outside sources. Although the selection of data used in this evaluation was rigorous, the quality of the data is variable. The State of California and the Department of Conservation make no representations or warranties regarding the accuracy of the data gathered from outside sources.
Earthquake-induced landslide zone maps are intended to prompt more detailed, site-specific geotechnical investigations as required by the Act. As such, these zone maps identify areas where the potential for earthquake-induced landslides is relatively high. Due to limitations in methodology, it should be noted that these zone maps do not necessarily capture all potential earthquake-induced landslide hazards. Earthquake-induced ground failures that are not addressed by this map include those associated with ridge-top spreading and shattered ridges. It should also be noted that no attempt has been made to map potential run-out areas of triggered landslides. It is possible that such run-out areas may extend beyond the zone boundaries. The potential for ground failure resulting from liquefaction-induced lateral spreading of alluvial materials, considered by some to be a form of landsliding, is not specifically addressed by the earthquake-induced landslide zone or this report. See Section 1, Liquefaction Evaluation Report for the Saticoy Quadrangle, for more information on the delineation of liquefaction zones.
The remainder of this report describes in more detail the mapping data and processes used to prepare the earthquake-induced landslide zone map for the Saticoy Quadrangle. The information is presented in two parts. Part I covers physiographic, geologic and

CALIFORNIA GEOLOGICAL SURVEY SHZR 066 24
engineering geologic conditions in the study area. Part II covers the preparation of landslide hazard potential and landslide zone maps.
PART I
PHYSIOGRAPHY
Study Area Location and Physiography
The Saticoy 7.5-Minute Quadrangle covers approximately 62 square miles in Ventura County. The southern third of the quadrangle includes the eastern part of the City of San Buenaventura (commonly referred to as the City of Ventura, which includes the community of Montalvo), and the unincorporated community of Saticoy. Much of the northern two-thirds consists of a combination of privately owned oil and gas fields, and ranch and farmland. Residential development is replacing citrus and avocado groves on the piedmont near Montalvo and Saticoy. The County of Ventura and the City of Ventura administer land use within the quadrangle. U.S. Highway 101 and State Highway 126 provide access to the southern part of the quadrangle.
Elevations range from about 40 feet in the southwestern corner of the quadrangle to 1967 feet near the headwaters of Leon Canyon Creek. The Santa Clara River is the largest drainage in the quadrangle. It flows southwestward along the base of several large, coalescing, alluvial fans that gently slope southward and form a piedmont. Foothills of the rugged southern slope of Sulphur Mountain occupy the northern two-thirds of the quadrangle. North of Foothill Road, which runs roughly northeast-southwest through the quadrangle, nine major canyons (Barlow, Sexton, Lake, Harmon, Long, Peppertree, Aliso, Hampton, and Wheeler) and several smaller, unnamed, north to northwest-trending canyons, with moderate to steep slopes, cut through portions of the hills. Barlow, Sexton and Lake canyons are drained by unnamed south-flowing tributary streams that merge beyond the limits of the canyons and have eroded a steep-sided gully called Arundel Barranca. Harmon, Long, Peppertree, Aliso and Wheeler canyons are each drained by small, unnamed tributary streams. The barrancas formed by these streams are Harmon, Brown, Wason, Ellsworth, and Todd, respectively. In the northwestern corner of the quadrangle, five smaller canyons (Sulphur, Seca, Leon, Hammond and Coche) are drained by unnamed tributary streams that flow into Canada Larga.
Digital Terrain Data
The calculation of slope gradient is an essential part of the evaluation of slope stability under earthquake conditions. An accurate slope gradient calculation begins with an up-to-date map representation of the earth’s surface in the form of a digital topographic map. Within the Saticoy Quadrangle, a Level 2 digital elevation model (DEM) was obtained from the USGS (U.S. Geological Survey, 1993). This DEM, prepared from the 7.5-minute quadrangle topographic contours based on 1951 aerial photography, has a 10-meter horizontal resolution and a 7.5-meter vertical accuracy.

2003 SEISMIC HAZARD ZONE REPORT FOR THE SATICOY QUADRANGLE 25
Areas that have undergone large-scale grading since 1951 in the hilly portions of the quadrangle were updated to reflect the new topography. A DEM reflecting this recent grading was obtained from an airborne interferometric platform flown in1998, with an estimated vertical accuracy of approximately 2 m (Intermap Corporation, 2002). An interferometric radar DEM is prone to creating false topography where tall buildings, metal structures, or trees are present. Due to the low-lying chaparral vegetation and relatively small-structure/residential construction types present, this type of DEM is appropriate for use in the Saticoy Quadrangle. Nevertheless, the final hazard zone map was checked for potential errors of this sort and corrected. Graded areas where the radar DEM was applied are shown on Plate 2.1.
A slope map was made from both DEMs using a third-order, finite difference, center-weighted algorithm (Horn, 1981). The USGS DEM was also used to make a slope aspect map. The manner in which the slope and aspect maps were used to prepare the zone map will be described in subsequent sections of this report.
GEOLOGY
Bedrock and Surficial Geology
The bedrock geology for the Saticoy Quadrangle was mapped by Dibblee (1992) and digitized for this study. Landslide deposits were deleted from the map so that the distribution of bedrock formations and the landslide inventory would exist on separate layers for the hazard analysis. The surficial Quaternary geology was mapped and digitized by William Lettis and Associates (WLA) (2000). CGS geologists merged the bedrock and surficial geologic maps and databases and made adjustments to contacts between bedrock and surficial units to resolve differences. Geologic reconnaissance was performed to assist in adjusting contacts, to review the geologic unit lithology and geologic structure. In the field, observations were made of exposures, aspects of weathering, and general surface expression of the geologic units. In addition, the relation of the various geologic units to the development and abundance of slope failures was noted.
Bedrock in the Saticoy Quadrangle consists of three Pliocene to Pleistocene formations. From oldest to youngest they are Pico Formation, Las Posas Sand and Saugus Formation (Dibblee, 1992). Stratigraphic nomenclature of Plio-Pleistocene rock units varies among geologists working in the Ventura Basin (Irvine, 1995). In the Saticoy Quadrangle, Yerkes and others (1987) use the name Santa Barbara Formation for uppermost Pico Formation strata (Mudpit Claystone Member of Dibblee, 1992) and include both the Las Posas Sand and Saugus Formation in the San Pedro Formation. For this report, the terminology of Dibblee (1992) was adopted.
The marine clastic Pico Formation includes two members of mostly Pliocene age, consisting of mostly vaguely bedded soft gray claystone with minor thin sandstone (Tp) and light gray to tan friable, bedded sandstone with minor thin interbeds of gray silty claystone (Tps). The Pico Formation also includes a possibly late Pliocene to early

CALIFORNIA GEOLOGICAL SURVEY SHZR 066 26
Pleistocene member. This member consists of claystone composed of massive to vaguely bedded soft gray claystone and mudstone (QTpm). QTpm is subdivided further on the geologic map. It includes a light gray conglomerate of pebbles and cobbles of hard sandstone and of white siliceous shale in a sandy matrix (QTpmc), and sandstone (QTpms) similar to Tps but locally pebbly (Dibblee, 1992). The Pico Formation is widely exposed throughout the Saticoy Quadrangle in the foothills approximately one-half to two miles north of Foothill Road.
The shallow marine regressive Pleistocene Las Posas Sand conformably overlies the Pico Formation. The Las Posas Sand consists of weakly indurated, soft, tan to yellowish-brown, fossiliferous sand (QTlp), and includes pebbly sand strata with pebbles of siliceous shale and of hard sandstone conglomerate (QTlpc), similar to QTpmc (Dibblee 1992). Exposures of the Las Posas Formation are confined to the southern one-third of the quadrangle, typically within one mile north of Foothill Road.
The nonmarine fluviatile early (?) Pleistocene Saugus Formation (QTs) conformably overlies the Las Posas Sand. The Saugus Formation consists of weakly consolidated alluvial deposits; gray to tan boulder-cobble-pebble gravel of mostly sandstone and some siliceous shale detritus in a light brown sandy matrix (Dibblee, 1992). Exposures of the Saugus Formation are confined to the southern one-third of the Saticoy Quadrangle, along the north side of Foothill Road.
Young Quaternary deposits cover about 24 square miles of land in the Saticoy Quadrangle. WLA (2000) mapped the various geologic units primarily on the basis of depositional environment, geomorphic expression, and relative ages, as largely determined by topographic position, degree of soil profile development, and degree of surface erosion. Most of the exposed valley alluvium is Holocene. Older Quaternary sediments locally are exposed along the lower foothills of Sulphur Mountain and in several isolated hills known as the Montalvo Mounds. Most of the Holocene sediment exposed in the quadrangle are alluvial fan deposits (Qyf) developed along the base of the foothills and wash deposits (Qw) deposited within the Santa Clara River Valley. The alluvial fan units are composed of sediment ranging from sandy gravel to clay, with clay and silt being major constituents. Wash deposits within the quadrangle are generally composed of sand to sandy silt.
Structural Geology
The Saticoy Quadrangle lies within the Transverse Ranges geomorphic province, which is characterized by west-trending folds, thrust faults, and fault-bounded valleys. The structural framework of the region is considered the result of regional compression caused by right-lateral, strike-slip movement on the "Big Bend" segment of the San Andreas Fault. Folded and faulted Pliocene to Quaternary sedimentary rocks define the structure of the Saticoy Quadrangle. Major faults in the region are west trending. One of these is the Ventura Fault whose inferred trace extends along the base of the hills generally coincident with Foothill Road and continues westward into the Ventura Quadrangle (Dibblee, 1988; 1992). This fault is identified as an Official Earthquake Fault Zone by CGS (DOC, 1978).

2003 SEISMIC HAZARD ZONE REPORT FOR THE SATICOY QUADRANGLE 27
An inferred segment of the southwesterly-trending Oak Ridge Fault lies within the Saticoy Quadrangle. Although this fault does not meet the criteria required for inclusion in the Official Earthquake Fault Zone (it is not a well-defined fault), it is considered to be a potential seismic source (Cramer and Petersen, 1996; Petersen and others, 1996). Rupture along either of these local faults, or shaking produced by large to great earthquakes in the general region, could trigger liquefaction within alluviated areas and/or sliding in hilly areas of the Saticoy Quadrangle.
The Canada Larga Syncline and Ventura Avenue Anticline, folds related to the faulting in the area, control the orientation of bedding in the Pico, Las Posas and Saugus formations. Bedding on the fold limbs generally strikes southwest-northeast.
Landslide Inventory
As a part of the geologic data compilation, an inventory of existing landslides in the Saticoy Quadrangle was prepared by field reconnaissance, analysis of stereo-paired aerial photographs and a review of previously published and unpublished mapping, including Dibblee (1992) and Morton (1973). Landslides were mapped at a scale of 1:24,000. For each landslide included on the map a number of characteristics (attributes) were compiled. These characteristics include the confidence of interpretation (definite, probable and questionable) and other properties, such as activity, thickness, and associated geologic unit(s). Landslides rated as definite and probable were carried into the slope stability analysis. Landslides rated as questionable were not carried into the slope stability analysis due to the uncertainty of their existence. The completed landslide map was scanned, digitized, and the attributes were compiled in a database. A version of this landslide inventory is included with Plate 2.1.
Landslides are distributed throughout the northern two-thirds of the Saticoy Quadrangle, on slopes underlain by the Saugus Formation (QTs), Las Posas Sand (QTlp), or the Pico Formation (QTpm, Tp). The largest concentration of landslides occurs on slopes on the hinge and southern limb of the Ventura Avenue Anticline. The majority of mapped landslides involve the Pico Formation. Landslides in the Saticoy Quadrangle range in age and depth from historic to old, and from shallow to deep. Landslides fail by a variety of modes including rock slides, debris flows and slides, and earth flows and slides. In addition to landslides, shallow soil failures and soil creep also are common.
ENGINEERING GEOLOGY
Geologic Material Strength
To evaluate the stability of geologic materials under earthquake conditions, the geologic map units described above were ranked and grouped on the basis of their shear strength. Generally, the primary source for shear-strength measurements is geotechnical reports prepared by consultants on file with local government permitting departments. Shear-strength data for the units identified on the Saticoy Quadrangle geologic map were obtained from County of Ventura- Public Works Agency, Earth Systems Southern California, and California Geological Survey Environmental Review Documents (see

CALIFORNIA GEOLOGICAL SURVEY SHZR 066 28
Appendix A). The locations of rock and soil samples collected within the Saticoy Quadrangle for shear-strength testing are shown on Plate 2.1. Shear tests from adjoining and near by quadrangles were used to augment data for geologic formations for which little or no shear test information was available within the Saticoy Quadrangle.
Shear strength data gathered from the above sources were compiled for each geologic map unit. Geologic units were grouped on the basis of average angle of internal friction (average phi) and lithologic character. Average (mean or median) phi values for each geologic map unit and corresponding strength group are summarized in Table 2.1. Within the Saticoy Quadrangle, no shear strength test data were available for the following geologic deposits: Qoa, Qc, Qyf1, Qf, Qof, Qg, Qoat2, Qw, Qw1, Qw2, Qya1, Qya2, Qyat1, and Qyat2. Individual deposits with similar lithologic characteristics were grouped together for analysis (see Table 2.1 footnote). In addition, no shear strength test data were available for the following unique members within the Saticoy Quadrangle: QTlpc, QTpmc, QTpms, and Tps. Shear strength test data from Santa Paula Peak and Santa Paula quadrangles were used to designate a geologic strength group value for Tp. The remaining geologic members were evaluated and then placed in their appropriate geologic strength group based on lithologic characteristics. Typically, members were grouped with their respective formations. However, QTpmc is grouped in a higher rock strength category due to its resistant ridge-forming nature and lithologic description as being “hard.”
For the geologic strength groups in the map area, a single, average shear strength value was assigned and used in our slope stability analysis. A geologic material strength map was made based on the groupings presented in Tables 2.1 and 2.2, and this map provides a spatial representation of material strength for use in the slope stability analysis
Adverse Bedding Conditions
Adverse bedding conditions are an important consideration in slope stability analyses. Adverse bedding conditions occur where the dip direction of bedded sedimentary rocks is roughly the same as the slope aspect, and where the dip magnitude is less than the slope gradient. Under these conditions, landslides can slip along bedding surfaces due to a lack of lateral support.
To account for adverse bedding in our slope stability evaluation, we used geologic structural data in combination with digital terrain data to identify areas with potentially adverse bedding, using methods similar to those of Brabb (1983). The structural data, derived from the geologic map database, was used to categorize areas of common bedding dip direction and magnitude. The dip direction was then compared to the slope aspect and, if the same, the dip magnitude and slope gradient categories were compared. If the dip magnitude category was less than or equal to the slope gradient category, but greater than 25% (4:1 slope), the area was marked as a potential adverse bedding area.
The Saugus Formation, which contains interbedded sandstone and shale, was subdivided based on shear strength differences between coarse-grained (higher strength) and fine-grained (lower strength) lithologies. Shear strength values for the fine- and coarse-

2003 SEISMIC HAZARD ZONE REPORT FOR THE SATICOY QUADRANGLE 29
grained lithologies were then applied to areas of favorable and adverse bedding orientation, which were determined from structural and terrain data as discussed above. We assume that coarse-grained material strength dominates where bedding dips into a slope (favorable bedding) while fine-grained material strength dominates where bedding dips out of a slope (adverse bedding). The geologic material strength map was modified by assigning the lower, fine-grained shear strength values to areas where potential adverse bedding conditions were identified. The favorable and adverse bedding shear strength parameters for the Saugus Formation are included in Table 2.1.
Existing Landslides
As will be discussed later in this report, the landslide zone mapping criteria states that all mappable landslides are to be included in the landslide zone of required investigation. Therefore, an evaluation of shear strength parameters for existing landslides is not necessary for the preparation of the zone map. However, in the interest of completeness for the material-strength map, to provide relevant material-strength information to project plan reviewers, and to allow for possible future improvements to our zone mapping procedures, we have collected and compiled shear strength data considered representative of existing landslides within the quadrangle.
The strength characteristics of existing landslides (Qls) must be based on tests of the materials along the landslide slip surface. Ideally, shear tests of slip surfaces formed in each mapped geologic unit would be used. However, this amount of information is rarely available, and for the preparation of the earthquake-induced landslide zone map it has been assumed that all landslides within the quadrangle have the same slip surface strength parameters. We collect and use primarily “residual” strength parameters from laboratory tests of slip surface materials tested in direct shear or ring shear test equipment. Back-calculated strength parameters, if the calculations appear to have been performed appropriately, have also been used. Within the Saticoy Quadrangle, no shear strength test data were available for landslide slip surfaces. However, a shear strength phi value of 15° was assigned to the slip surface material based on data collected from the adjacent Santa Paula and Ojai quadrangles.

CALIFORNIA GEOLOGICAL SURVEY SHZR 066 30
SATICOY QUADRANGLE SHEAR STRENGTH GROUPS
Formation/ Member
Name
Number Tests
Median/ Mean Phi
(deg)
Mean/Median Group Phi
(deg)
Mean/Median Group C
(psf)
No Data: Similar
Lithology
Phi Values Used in Stability Analyses
GROUP 1 QTs(fbc) QTlp
20 6
34/33 34/33 34/34 185/155 QTlpc*
QTpmc* 34
GROUP 2 QTs(abc) Qog Qa
39 32 20
28/28 29/28 27/26
28/27 330/250
QTpms* QTpm
Tp***, Tps*
28
GROUP 3 Qls 15** Geologic deposits combined in analysis Qog=Qg, Qw, Qw2, Qw1, Qa=Qya, Qya1, Qya2, Qoa, Qya1-2, Qf, Qof, Qyf1, Qyf2 * = indicates members specifically found within the Saticoy Quadrangle. ** = indicates that the shear strength value is based on data from adjacent quadrangles. ***= indicates formation whose group designation is based on data from adjacent quadrangles. abc = adverse bedding condition, fine-grained material strength fbc = favorable bedding condition, coarse-grained material strength
Table 2.1. Summary of the Shear Strength Statistics for the Saticoy Quadrangle.
SHEAR STRENGTH GROUPS FOR THE SATICOY 7.5-MINUTE QUADRANGLE
GROUP 1 GROUP 2 GROUP 3
QTs(fbc), QTlp, QTlpc, QTpmc QTs(abc), Qog, Qa, QTpms, QTpm, Tp, Tps
Qls
Table 2.2. Summary of Shear Strength Groups for the Saticoy Quadrangle.
PART II
EARTHQUAKE-INDUCED LANDSLIDE HAZARD POTENTIAL
Design Strong-Motion Record
To evaluate earthquake-induced landslide hazard potential in the study area, a method of dynamic slope stability analysis developed by Newmark (1965) was used. The Newmark method analyzes dynamic slope stability by calculating the cumulative down-slope displacement for a given earthquake strong-motion time history. As implemented for the preparation of earthquake-induced landslide zones, the Newmark method necessitates the selection of a design earthquake strong-motion record to provide the “ground shaking opportunity.” For the Saticoy Quadrangle, selection of a strong motion record was based on an estimation of probabilistic ground motion parameters for modal magnitude, modal distance, and peak ground acceleration (PGA). The parameters were estimated from

2003 SEISMIC HAZARD ZONE REPORT FOR THE SATICOY QUADRANGLE 31
maps prepared by CGS for a 10% probability of being exceeded in 50 years (Petersen and others, 1996). The parameters used in the record selection are:
Modal Magnitude: 6.8 to 7.1
Modal Distance: 4.0 to 7.5 km
PGA: 0.64 to 0.81 g
The strong-motion record selected for the slope stability analysis in the Saticoy Quadrangle is the Corralitos Record, generated from the magnitude 6.9 (Mw) Loma Prieta earthquake of October 17, 1989 (Shakal and others, 1989). This record had a source to recording site distance of 5.1 km (epicentral distance) and a peak ground acceleration (PGA) of 0.64g. The selected strong-motion record was not scaled or otherwise modified prior to its use in the analysis.
Displacement Calculation
The design strong-motion record was used to develop a relationship between landslide displacement and yield acceleration (ay), defined as the earthquake horizontal ground acceleration above which landslide displacements take place. This relationship was prepared by integrating the design strong-motion record twice for a given acceleration value to find the corresponding displacement, and the process was repeated for a range of acceleration values (Jibson, 1993). The resulting curve in Figure 2.1 represents the full spectrum of displacements that can be expected for the design strong-motion record. This curve provides the required link between anticipated earthquake shaking and estimates of displacement for different combinations of geologic materials and slope gradient, as described in the Slope Stability Analysis section below.
The amount of displacement predicted by the Newmark analysis provides an indication of the relative amount of damage that could be caused by earthquake-induced landsliding. Displacements of 30, 15 and 5 cm were used as criteria for rating levels of earthquake-induced landslide hazard potential based on the work of Youd (1980), Wilson and Keefer (1983), and a CGS pilot study for earthquake-induced landslides (McCrink and Real, 1996; McCrink, 2001). Applied to the curve in Figure 2.1, these displacements correspond to yield accelerations of 0.234, 0.133 and 0.086g. Because these yield acceleration values are derived from the design strong-motion record, they represent the ground shaking opportunity thresholds that are significant in the Saticoy Quadrangle.

CALIFORNIA GEOLOGICAL SURVEY SHZR 066 32
0.10
1.00
10.00
100.00
1000.00
Dis
plac
emen
t (cm
)
0.01 0.1 1 Yield Acceleration (g)
Yield Acceleration vsNewmark Displacement
SMIP Corralitos Record - North Component
5 cm
15 cm
30 cm
0.234 g0.086g 0.133g
Figure 2.1. Yield Acceleration vs. Newmark Displacement for the Corralitos Record.
Slope Stability Analysis
A slope stability analysis was performed for each geologic material strength group at slope increments of 1 degree. An infinite-slope failure model under unsaturated slope conditions was assumed. A factor of safety was calculated first, followed by the calculation of yield acceleration from Newmark’s equation:
ay = ( FS - 1 )g sin α
where FS is the Factor of Safety, g is the acceleration due to gravity, and α is the direction of movement of the slide mass, in degrees measured from the horizontal, when displacement is initiated (Newmark, 1965). For an infinite slope failure α is the same as the slope angle.
The yield accelerations resulting from Newmark’s equations represent the susceptibility to earthquake-induced failure of each geologic material strength group for a range of slope gradients. Based on the relationship between yield acceleration and Newmark displacement shown in Figure 2.1, hazard potentials were assigned as follows:
1. If the calculated yield acceleration was less than 0.086g, Newmark displacement greater than 30 cm is indicated, and a HIGH hazard potential was assigned (H on Table 2.3)
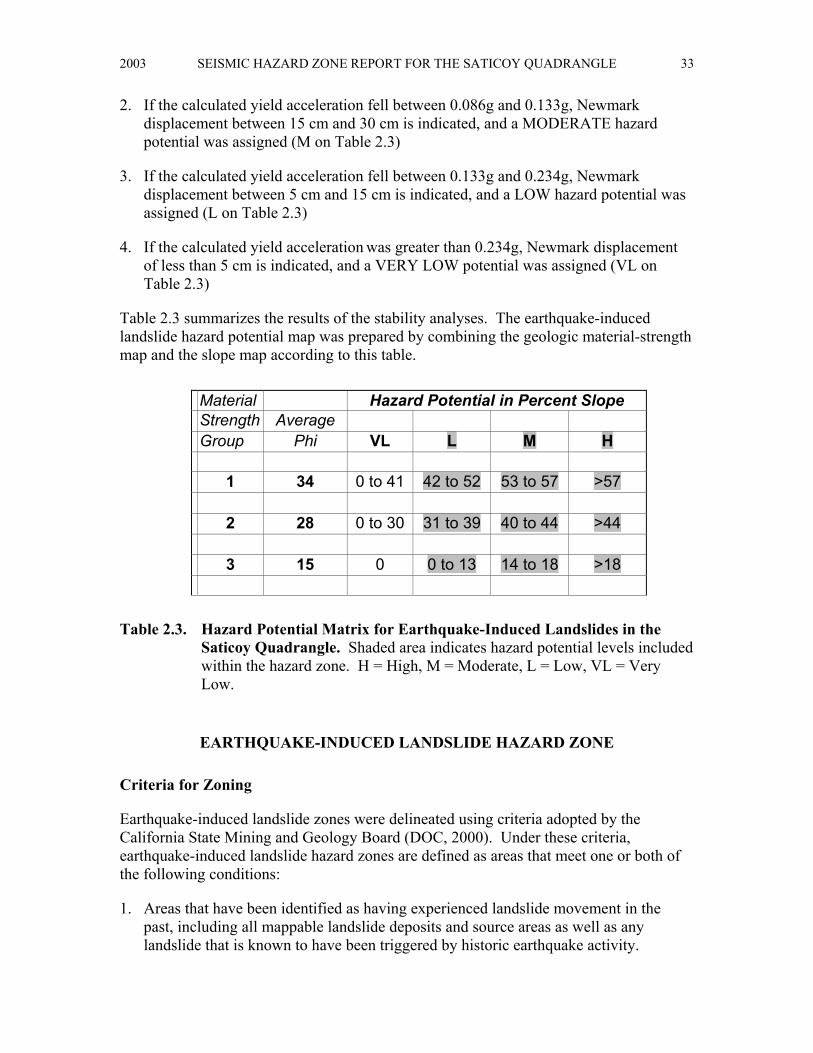
2003 SEISMIC HAZARD ZONE REPORT FOR THE SATICOY QUADRANGLE 33
2. If the calculated yield acceleration fell between 0.086g and 0.133g, Newmark displacement between 15 cm and 30 cm is indicated, and a MODERATE hazard potential was assigned (M on Table 2.3)
3. If the calculated yield acceleration fell between 0.133g and 0.234g, Newmark displacement between 5 cm and 15 cm is indicated, and a LOW hazard potential was assigned (L on Table 2.3)
4. If the calculated yield acceleration was greater than 0.234g, Newmark displacement of less than 5 cm is indicated, and a VERY LOW potential was assigned (VL on Table 2.3)
Table 2.3 summarizes the results of the stability analyses. The earthquake-induced landslide hazard potential map was prepared by combining the geologic material-strength map and the slope map according to this table.
Material Hazard Potential in Percent Slope Strength Average Group Phi VL L M H 1 34 0 to 41 42 to 52 53 to 57 >57 2 28 0 to 30 31 to 39 40 to 44 >44 3 15 0 0 to 13 14 to 18 >18
Table 2.3. Hazard Potential Matrix for Earthquake-Induced Landslides in the Saticoy Quadrangle. Shaded area indicates hazard potential levels included within the hazard zone. H = High, M = Moderate, L = Low, VL = Very Low.
EARTHQUAKE-INDUCED LANDSLIDE HAZARD ZONE
Criteria for Zoning
Earthquake-induced landslide zones were delineated using criteria adopted by the California State Mining and Geology Board (DOC, 2000). Under these criteria, earthquake-induced landslide hazard zones are defined as areas that meet one or both of the following conditions:
1. Areas that have been identified as having experienced landslide movement in the past, including all mappable landslide deposits and source areas as well as any landslide that is known to have been triggered by historic earthquake activity.
CALIFORNIA GEOLOGICAL SURVEY SHZR 066 34
2. Areas where the geologic and geotechnical data and analyses indicate that the earth materials may be susceptible to earthquake-induced slope failure.
These conditions are discussed in further detail in the following sections.
Existing Landslides
Existing landslides typically consist of disrupted soils and rock materials that are generally weaker than adjacent undisturbed rock and soil materials. Previous studies indicate that existing landslides can be reactivated by earthquake movements (Keefer, 1984). Earthquake-triggered movement of existing landslides is most pronounced in steep head scarp areas and at the toe of existing landslide deposits. Although reactivation of deep-seated landslide deposits is less common (Keefer, 1984), a significant number of deep-seated landslide movements have occurred during, or soon after, several recent earthquakes. Based on these observations and the adopted mapping criteria all existing landslides with a definite or probable confidence rating are included within the earthquake-induced landslide hazard zone.
Geologic and Geotechnical Analysis
Based on the conclusions of a pilot study performed by CGS (McCrink and Real, 1996;McCrink, 2001), it has been concluded that earthquake-induced landslide hazard zones should encompass all areas that have a High, Moderate or Low level of hazard potential (see Table 2.3). This would include all areas where the analyses indicate earthquake displacements of 5 centimeters or greater. Areas with a Very Low hazard potential, indicating less than 5 centimeters displacement, are excluded from the zone.
As summarized in Table 2.3, all areas characterized by the following geologic strength group and slope gradient conditions are included in the earthquake-induced landslide hazard zone:
1. Geologic Strength Group 3 consisting only of existing landslides is included for all slope gradient categories.
2. Geologic Strength Group 2 is included for all slopes greater than, or equal to, 31 percent.
3. Geologic Strength Group 1 is included for all slopes greater than, or equal to, 41 percent.
This results in approximately 49 percent of the Saticoy Quadrangle lying within the earthquake-induced landslide hazard zone.

2003 SEISMIC HAZARD ZONE REPORT FOR THE SATICOY QUADRANGLE 35
ACKNOWLEDGMENTS
The authors would like to thank the following individuals and organizations for their assistance in obtaining the data necessary to complete this project. Steve Mulqueen with the California Division of Oil, Gas, and Geothermal Resources provided assistance in arranging access and logistical support during the field review of the landslide inventory. James O’Toussa, consultant for the County of Ventura, Al Echarren and Larry Cardoza with the County of Ventura- Public Works Agency for allowing us easy access to geotechnical data files. At CGS, Terilee McGuire, Lee Wallinder, Bob Moscovitz provided GIS support. Barbara Wanish and Ross Martin prepared the final landslide hazard zone maps and the graphic displays for this report. Rick Wilson, Mike Silva, and Barbara Wanish greatly assisted in the preparation of the landslide zone map. Ian Penny and Brian Caldwell compiled extensive geotechnical data for shear test analysis.
REFERENCES
Brabb, E.E., 1983, Map showing direction and amount of bedding dip of sedimentary rocks in San Mateo County, California: U.S. Geological Survey Miscellaneous Investigations Series Map I-1257C, 1 sheet, scale 1:62,500.
California Department of Conservation, 1973, Geology and Mineral Resources of Southern Ventura County, California: California Department of Conservation, Division of Mines and Geology, Preliminary Report 14, 102 p.
California Department of Conservation, Division of Mines and Geology, 1978, Official Map of Earthquake Fault Zones, Saticoy Quadrangle, scale 1:24,000.
California Department of Conservation, Division of Mines and Geology, 1997, Guidelines for evaluating and mitigating seismic hazards in California: California Department of Conservation, Division of Mines and Geology, Special Publication 117, 74 p.
California Department of Conservation, Division of Mines and Geology, 2000, Recommended criteria for delineating seismic hazard zones: California Department of Conservation, Division of Mines and Geology, Special Publication 118, 12 p.
Cramer, C.H. and Petersen, M.D., 1996, Predominant seismic source distance and magnitude maps for Los Angeles, Orange, and Ventura counties, California: Bulletin of Seismological Society of America, v. 86, no. 5, p. 1,645-1,649.
Dibblee, T.W., Jr., 1988, Geologic map of the Ventura and Pitas Point quadrangles, Ventura County, California: Dibblee Geological Foundation Map DF-21, scale 1:24,000.
Dibblee, T.W, Jr., 1992, Geologic Map of the Saticoy Quadrangle, Ventura County, California: Dibblee Foundation Map DF-42, scale 1:24,000.

CALIFORNIA GEOLOGICAL SURVEY SHZR 066 36
Horn, B.K.P., 1981, Hill shading and the reflectance map: Proceedings of the IEEE, v. 69, no. 1, p.14-47.
Intermap Corporation, 2002, Global Terrain product handbook and quick start guide: http://www.intermap.com/images/papers/asprs2001_Intermap_E.pdf
Irvine, P. J., 1995, Landslide hazards in the Moorpark and Santa Paula quadrangles, Ventura County, California: California Division of Mines and Geology Open-File Report 95-07, 22 p., 5 plates, map scale 1: 24,000. [geologic map digitized by Southern California Areal Mapping Project].
Jibson, R.W., 1993, Predicting earthquake-induced landslide displacements using Newmark’s sliding block analysis: Transportation Research Board, National Research Council, Transportation Research Record 1411, 17 p.
Keefer, D.K., 1984, Landslides caused by earthquakes: Geological Society of America Bulletin, v. 95, no. 4, p. 406-421.
McCrink, T.P., 2001, Mapping earthquake-induced landslide hazards in Santa Cruz County in Ferriz, H. and Anderson, R., editors, Engineering geology practice in northern California: California Geological Survey Bulletin 210 / Association of Engineering Geologists Special Publication 12, p.77-94.
McCrink, T.P. and Real, C.R., 1996, Evaluation of the Newmark method for mapping earthquake-induced landslide hazards in the Laurel 7-1/2 Minute Quadrangle, Santa Cruz County, California: California Division of Mines and Geology Final Technical Report for U.S. Geological Survey Contract 143-93-G-2334, U.S. Geological Survey, Reston, Virginia, 31 p.
Morton, D. M., 1973, Maps to accompany text of Geology and Mineral Resources Study of Southern Ventura County, California - Reconnaissance Photo-Interpretation Map of Major Landslides, Southern Ventura County, California: California Division of Mines and Geology Preliminary Report 14.
Newmark, N.M., 1965, Effects of earthquakes on dams and embankments: Geotechnique, v. 15, no. 2, p. 139-160.
Petersen, M.D., Bryant, W.A., Cramer, C.H., Cao. T., Reichle, M.S., Frankel, A.D., Lienkaemper, J.J., McCrory, P.A. and Schwartz, D.P., 1996, Probabilistic seismic hazard assessment for the State of California: California Department of Conservation, Division of Mines and Geology, Open-File Report 96-08; also U.S. Geological Survey Open-File Report 96-706, 33 p.
Shakal, A., Huang, M., Reichle, M., Ventura, C., Cao, T., Sherburne, R., Savage, M., Darragh, R. and Peterson, C., 1989, CSMIP strong-motion records from the Santa Cruz Mountains (Loma Prieta), California earthquake of 17 October 1989: California Department of Conservation, Division of Mines and Geology, Office of Strong Motion Studies Report OSMS 89-06, 196 p.

2003 SEISMIC HAZARD ZONE REPORT FOR THE SATICOY QUADRANGLE 37
Smith, T.C., 1996, Preliminary maps of seismic hazard zones and draft guidelines for evaluating and mitigating seismic hazards: California Geology, v. 49, no. 6, p. 147-150.
Southern California Earthquake Center, 2002, Recommended procedures for implementation of DMG Special Publication 117 guidelines for analyzing and mitigating landslide hazards in California: T.F. Blake, R.A. Hollingsworth, and J.P. Stewart, editors, Southern California Earthquake Center, University of Southern California, 108 p.
William Lettis and Associates, 2000, Unpublished digital Quaternary geologic map of the Saticoy 7.5-Minute Quadrangle: digitized at scale 1:24000.
Wilson, R.C. and Keefer, D.K., 1983, Dynamic analysis of a slope failure from the 1979 Coyote Lake, California, earthquake: Bulletin of the Seismological Society of America, v. 73, p. 863-877.
Yerkes, R.F., Sarna-Wojcicki, A.M. and Lajoie, K.R., 1987, Geology and Quaternary deformation of the Ventura area, in Recent reverse faulting in the Transverse Ranges, California; U.S. Geological Survey Professional Paper 1339, p.169-178.
Youd, T.L., 1980, Ground failure displacement and earthquake damage to buildings: American Society of Civil Engineers Conference on Civil Engineering and Nuclear Power, 2d, Knoxville, Tennessee, 1980, v. 2, p. 7-6-2 to 7-6-26.
AIR PHOTOS
I.K. Curtis Services, Inc., Ventura County Photos, April 2, 2000, Frames 576-579, 720-723, and 735-738; Color, Vertical, scale 1: 42,000.
Pacific Western Aerial Surveys, dated 11-16-88, Frames PW VEN 6-177 through 6-180.
Pacific Western Aerial Surveys, dated 11-16-88, Frames PW VEN 6-181 through 6-184.
Pacific Western Aerial Surveys, dated 9-29-88, Frames PW VEN 6-145 through 6-149.
Pacific Western Aerial Surveys, dated 2-15-89, Frames PW VEN 6-110 through 6-115.
United States Department of Agriculture (U.S.D.A.), dated 1-5-53, Frames AXI-4K-13 through 21.
United States Department of Agriculture (U.S.D.A.), dated 10-7-53, Frames AXI-9K-83 through 90.
United States Department of Agriculture (U.S.D.A.), dated 10-7-53, Frames AXI-9K-117 through 122.

CALIFORNIA GEOLOGICAL SURVEY SHZR 066 38
United States Geological Survey (U.S.G.S.), dated 2-27-98, Frames 1A3-1A7.
United States Geological Survey (U.S.G.S.), dated 2-27-98, Frames 1B4-1B8.
APPENDIX A SOURCE OF ROCK STRENGTH DATA
SOURCE NUMBER OF TESTS SELECTED Earth Systems Southern California 34
County of Ventura- PWA 79 CGS Environmental Review Documents 4
Total Number of Shear Tests 117

2003 SEISMIC HAZARD ZONE REPORT FOR THE SATICOY QUADRANGLE 39
SECTION 3 GROUND SHAKING EVALUATION REPORT
Potential Ground Shaking in the Saticoy 7.5-Minute Quadrangle,
Ventura County, California
By
Mark D. Petersen*, Chris H. Cramer*, Geoffrey A. Faneros, Charles R. Real, and Michael S. Reichle
California Department of Conservation
California Geological Survey *Formerly with CGS, now with U.S. Geological Survey
PURPOSE
The Seismic Hazards Mapping Act (the Act) of 1990 (Public Resources Code, Chapter 7.8, Division 2) directs the California Department of Conservation (DOC), Division of Mines and Geology (DMG) [now called California Geological Survey (CGS)] to delineate Seismic Hazard Zones. The purpose of the Act is to reduce the threat to public health and safety and to minimize the loss of life and property by identifying and mitigating seismic hazards. Cities, counties, and state agencies are directed to use the Seismic Hazard Zone Maps in their land-use planning and permitting processes. The Act requires that site-specific geotechnical investigations be performed prior to permitting most urban development projects within the hazard zones. Evaluation and mitigation of seismic hazards are to be conducted under guidelines established by the California State Mining and Geology Board (DOC, 1997); also available on the Internet at http://gmw.consrv.ca.gov/shmp/webdocs/sp117.pdf
This section of the evaluation report summarizes the ground motions used to evaluate liquefaction and earthquake-induced landslide potential for zoning purposes. Included are ground motion and related maps, a brief overview on how these maps were prepared, precautionary notes concerning their use, and related references. The maps provided

CALIFORNIA GEOLOGICAL SURVEY SHZR 066 40
herein are presented at a scale of approximately 1:150,000 (scale bar provided on maps), and show the full 7.5-minute quadrangle and portions of the adjacent eight quadrangles. They can be used to assist in the specification of earthquake loading conditions for the analysis of ground failure according to the “Simple Prescribed Parameter Value” method (SPPV) described in the site investigation guidelines (DOC, 1997). Alternatively, they can be used as a basis for comparing levels of ground motion determined by other methods with the statewide standard.
This section and Sections 1 and 2 (addressing liquefaction and earthquake-induced landslide hazards) constitute a report series that summarizes development of seismic hazard zone maps in the state. Additional information on seismic hazard zone mapping in California can be accessed on CGS’s Internet homepage: http://www.conservation.ca.gov/CGS/index.htm
EARTHQUAKE HAZARD MODEL
The estimated ground shaking is derived from the statewide probabilistic seismic hazard evaluation released cooperatively by the California Department of Conservation, Division of Mines and Geology [California Geological Survey], and the U.S. Geological Survey (Petersen and others, 1996). That report documents an extensive 3-year effort to obtain consensus within the scientific community regarding fault parameters that characterize the seismic hazard in California. Fault sources included in the model were evaluated for long-term slip rate, maximum earthquake magnitude, and rupture geometry. These fault parameters, along with historical seismicity, were used to estimate return times of moderate to large earthquakes that contribute to the hazard.
The ground shaking levels are estimated for each of the sources included in the seismic source model using attenuation relations that relate earthquake shaking with magnitude, distance from the earthquake, and type of fault rupture (strike-slip, reverse, normal, or subduction). The published hazard evaluation of Petersen and others (1996) only considers uniform firm-rock site conditions. In this report, however, we extend the hazard analysis to include the hazard of exceeding peak horizontal ground acceleration (PGA) at 10% probability of exceedance in 50 years on spatially uniform conditions of rock, soft rock, and alluvium. These soil and rock conditions approximately correspond to site categories defined in Chapter 16 of the Uniform Building Code (ICBO, 1997), which are commonly found in California. We use the attenuation relations of Boore and others (1997), Campbell (1997), Sadigh and others (1997), and Youngs and others (1997) to calculate the ground motions.
The seismic hazard maps for ground shaking are produced by calculating the hazard at sites separated by about 5 km. Figures 3.1 through 3.3 show the hazard for PGA at 10% probability of exceedance in 50 years assuming the entire map area is firm rock, soft rock, or alluvial site conditions respectively. The sites where the hazard is calculated are represented as dots and ground motion contours as shaded regions. The quadrangle of interest is outlined by bold lines and centered on the map. Portions of the eight adjacent

���������������������������������������������������������������������� ������������������������������������������������� ������������������������������������������������� ������������������������������������������������� �������������������������������������������������
������������������������������������������������� ������������������������������������������������� ������������������������������������������������� ������������������������������������������������� ������������������������������������������������� ���������������������
������������������������������������������������� ������������������������������������������������� ������������������������������������������������� ������������������������������������������������� ������������������������������������������������� ���������������������
������������������������������������������������� ������������������������������������������������� ������������������������������������������������� ������������������������������������������������� ������������������������������������������������� ���������������������
���������������������������������������������������������������������� ������������������������������������������������� ������������������������������������������������� ������������������������������������������������� �������������������������������������������������
0.470.470.470.470.470.470.470.470.47 0.490.490.490.490.490.490.490.490.49 0.530.530.530.530.530.530.530.530.53 0.550.550.550.550.550.550.550.550.55 0.530.530.530.530.530.530.530.530.53
0.500.500.500.500.500.500.500.500.50 0.550.550.550.550.550.550.550.550.55 0.620.620.620.620.620.620.620.620.62 0.670.670.670.670.670.670.670.670.67 0.630.630.630.630.630.630.630.630.63
0.560.560.560.560.560.560.560.560.56 0.570.570.570.570.570.570.570.570.57 0.620.620.620.620.620.620.620.620.62 0.690.690.690.690.690.690.690.690.69 0.80.80.80.80.80.80.80.80.8
0.600.600.600.600.600.600.600.600.60 0.560.560.560.560.560.560.560.560.56 0.580.580.580.580.580.580.580.580.58 0.650.650.650.650.650.650.650.650.65 0.750.750.750.750.750.750.750.750.75
0.570.570.570.570.570.570.570.570.57 0.570.570.570.570.570.570.570.570.57 0.610.610.610.610.610.610.610.610.61 0.680.680.680.680.680.680.680.680.68 0.790.790.790.790.790.790.790.790.79
SATICOY 7.5 MINUTE QUADRANGLE AND PORTIONS OFADJACENT QUADRANGLES
10% EXCEEDANCE IN 50 YEARS PEAK GROUND ACCELERATION (g)1998
FIRM ROCK CONDITIONS
Department of ConservationCalifornia Geological Survey
Figure 3.1
0 1.5
Miles
3
Base map from GDT
SEISMIC HAZARD EVALUATION OF THE SATICOY QUADRANGLE SHZR 06641

�������������������������������������������������������������������������������������������������� ������������������������������������������������� ������������������������������������������������� ������������������������������������������������� ���������������������
���������������������������������������������������������������������� ������������������������������������������������� ������������������������������������������������� ������������������������������������������������� �������������������������������������������������
������������������������������������������������� ������������������������������������������������� ������������������������������������������������� ������������������������������������������������� ������������������������������������������������� ���������������������
������������������������������������������������� ������������������������������������������������� ������������������������������������������������� ������������������������������������������������� ������������������������������������������������� ���������������������
������������������������������������������������� ������������������������������������������������� ������������������������������������������������� ������������������������������������������������� ������������������������������������������������� ���������������������
0.520.520.520.520.520.520.520.520.52 0.550.550.550.550.550.550.550.550.55 0.590.590.590.590.590.590.590.590.59 0.610.610.610.610.610.610.610.610.61 0.590.590.590.590.590.590.590.590.59
0.550.550.550.550.550.550.550.550.55 0.600.600.600.600.600.600.600.600.60 0.670.670.670.670.670.670.670.670.67 0.730.730.730.730.730.730.730.730.73 0.690.690.690.690.690.690.690.690.69
0.620.620.620.620.620.620.620.620.62 0.630.630.630.630.630.630.630.630.63 0.680.680.680.680.680.680.680.680.68 0.750.750.750.750.750.750.750.750.75 0.850.850.850.850.850.850.850.850.85
0.660.660.660.660.660.660.660.660.66 0.610.610.610.610.610.610.610.610.61 0.630.630.630.630.630.630.630.630.63 0.710.710.710.710.710.710.710.710.71 0.810.810.810.810.810.810.810.810.81
0.620.620.620.620.620.620.620.620.62 0.630.630.630.630.630.630.630.630.63 0.670.670.670.670.670.670.670.670.67 0.740.740.740.740.740.740.740.740.74 0.850.850.850.850.850.850.850.850.85
SATICOY 7.5 MINUTE QUADRANGLE AND PORTIONS OFADJACENT QUADRANGLES
10% EXCEEDANCE IN 50 YEARS PEAK GROUND ACCELERATION (g)
1998SOFT ROCK CONDITIONS
Department of ConservationCalifornia Geological Survey
Figure 3.2
0 1.5
Miles
3
Base map from GDT
CALIFORNIA GEOLOGICAL SURVEY2003 42

������������������������������������������������� ������������������������������������������������� ������������������������������������������������� ������������������������������������������������� �������������������������������������������������
������������������������������������������������� ������������������������������������������������� ������������������������������������������������� ������������������������������������������������� �������������������������������������������������
������������������������������������������������� ������������������������������������������������� ������������������������������������������������� ������������������������������������������������� �������������������������������������������������
������������������������������������������������� ������������������������������������������������� ������������������������������������������������� ������������������������������������������������� �������������������������������������������������
������������������������������������������������� ������������������������������������������������� ������������������������������������������������� ������������������������������������������������� �������������������������������������������������
0.560.560.560.560.560.560.560.560.56 0.590.590.590.590.590.590.590.590.59 0.620.620.620.620.620.620.620.620.62 0.650.650.650.650.650.650.650.650.65 0.630.630.630.630.630.630.630.630.63
0.580.580.580.580.580.580.580.580.58 0.620.620.620.620.620.620.620.620.62 0.670.670.670.670.670.670.670.670.67 0.710.710.710.710.710.710.710.710.71 0.690.690.690.690.690.690.690.690.69
0.620.620.620.620.620.620.620.620.62 0.640.640.640.640.640.640.640.640.64 0.670.670.670.670.670.670.670.670.67 0.720.720.720.720.720.720.720.720.72 0.780.780.780.780.780.780.780.780.78
0.670.670.670.670.670.670.670.670.67 0.620.620.620.620.620.620.620.620.62 0.640.640.640.640.640.640.640.640.64 0.700.700.700.700.700.700.700.700.70 0.770.770.770.770.770.770.770.770.77
0.620.620.620.620.620.620.620.620.62 0.630.630.630.630.630.630.630.630.63 0.670.670.670.670.670.670.670.670.67 0.720.720.720.720.720.720.720.720.72 0.800.800.800.800.800.800.800.800.80
SATICOY 7.5 MINUTE QUADRANGLE AND PORTIONS OFADJACENT QUADRANGLES
10% EXCEEDANCE IN 50 YEARS PEAK GROUND ACCELERATION (g)1998
ALLUVIUM CONDITIONS
Department of ConservationCalifornia Geological Survey
Figure 3.30 2.5
Kilometers
5
Base map from GDT
SEISMIC HAZARD EVALUATION OF THE QUADNAME QUADRANGLE43 SHZR 066

CALIFORNIA GEOLOGICAL SURVEY SHZR 066 44
quadrangles are also shown so that the trends in the ground motion may be more apparent. We recommend estimating ground motion values by selecting the map that matches the actual site conditions, and interpolating from the calculated values of PGA rather than the contours, since the points are more accurate.
APPLICATIONS FOR LIQUEFACTION AND LANDSLIDE HAZARD ASSESSMENTS
Deaggregation of the seismic hazard identifies the contribution of each of the earthquakes (various magnitudes and distances) in the model to the ground motion hazard for a particular exposure period (see Cramer and Petersen, 1996). The map in Figure 3.4 identifies the magnitude and the distance (value in parentheses) of the earthquake that contributes most to the hazard at 10% probability of exceedance in 50 years on alluvial site conditions (predominant earthquake). This information gives a rationale for selecting a seismic record or ground motion level in evaluating ground failure. However, it is important to keep in mind that more than one earthquake may contribute significantly to the hazard at a site, and those events can have markedly different magnitudes and distances. For liquefaction hazard the predominant earthquake magnitude from Figure 3.4 and PGA from Figure 3.3 (alluvium conditions) can be used with the Youd and Idriss (1997) approach to estimate cyclic stress ratio demand. For landslide hazard the predominant earthquake magnitude and distance can be used to select a seismic record that is consistent with the hazard for calculating the Newmark displacement (Wilson and Keefer, 1983). When selecting the predominant earthquake magnitude and distance, it is advisable to consider the range of values in the vicinity of the site and perform the ground failure analysis accordingly. This would yield a range in ground failure hazard from which recommendations appropriate to the specific project can be made. Grid values for predominant earthquake magnitude and distance should not be interpolated at the site location, because these parameters are not continuous functions.
A preferred method of using the probabilistic seismic hazard model and the “simplified Seed-Idriss method” of assessing liquefaction hazard is to apply magnitude scaling probabilistically while calculating peak ground acceleration for alluvium. The result is a “magnitude-weighted” ground motion (liquefaction opportunity) map that can be used directly in the calculation of the cyclic stress ratio threshold for liquefaction and for estimating the factor of safety against liquefaction (Youd and Idriss, 1997). This can provide a better estimate of liquefaction hazard than use of predominate magnitude described above, because all magnitudes contributing to the estimate are used to weight the probabilistic calculation of peak ground acceleration (Real and others, 2000). Thus, large distant earthquakes that occur less frequently but contribute more to the liquefaction hazard are appropriately accounted for.
Figure 3.5 shows the magnitude-weighted alluvial PGA based on Idriss’ weighting function (Youd and Idriss, 1997). It is important to note that the values obtained from this map are pseudo-accelerations and should be used in the formula for factor of safety without any magnitude-scaling (a factor of 1) applied.

�������������������������������������������������������������������������������������������������� ������������������������������������������������� ������������������������������������������������� ������������������������������������������������� �������������������������������������������������
������������������������������������������������� ������������������������������������������������� ������������������������������������������������� ������������������������������������������������� ������������������������������������������������� �������������������������������������������������
������������������������������������������������� ������������������������������������������������� ������������������������������������������������� ������������������������������������������������� ������������������������������������������������� �������������������������������������������������
������������������������������������������������� ������������������������������������������������� ������������������������������������������������� ������������������������������������������������� ������������������������������������������������� �������������������������������������������������
������������������������������������������������� ������������������������������������������������� ������������������������������������������������� ������������������������������������������������� ������������������������������������������������� �������������������������������������������������
7.37.37.37.37.37.37.37.37.3 7.37.37.37.37.37.37.37.37.3 6.96.96.96.96.96.96.96.96.9 6.96.96.96.96.96.96.96.96.9 7.37.37.37.37.37.37.37.37.3
6.86.86.86.86.86.86.86.86.8 6.96.96.96.96.96.96.96.96.9 6.96.96.96.96.96.96.96.96.9 6.96.96.96.96.96.96.96.96.9 6.96.96.96.96.96.96.96.96.9
6.86.86.86.86.86.86.86.86.8 6.96.96.96.96.96.96.96.96.9 6.96.96.96.96.96.96.96.96.9 6.96.96.96.96.96.96.96.96.9 6.96.96.96.96.96.96.96.96.9
6.86.86.86.86.86.86.86.86.8 6.96.96.96.96.96.96.96.96.9 6.96.96.96.96.96.96.96.96.9 6.96.96.96.96.96.96.96.96.9 6.96.96.96.96.96.96.96.96.9
6.86.86.86.86.86.86.86.86.8 6.86.86.86.86.86.86.86.86.8 6.86.86.86.86.86.86.86.86.8 6.86.86.86.86.86.86.86.86.8 6.86.86.86.86.86.86.86.86.8
(7)(7)(7)(7)(7)(7)(7)(7)(7) (7)(7)(7)(7)(7)(7)(7)(7)(7) (7)(7)(7)(7)(7)(7)(7)(7)(7) (7)(7)(7)(7)(7)(7)(7)(7)(7) (7)(7)(7)(7)(7)(7)(7)(7)(7)
(2)(2)(2)(2)(2)(2)(2)(2)(2) (7)(7)(7)(7)(7)(7)(7)(7)(7) (2)(2)(2)(2)(2)(2)(2)(2)(2) (2)(2)(2)(2)(2)(2)(2)(2)(2) (7)(7)(7)(7)(7)(7)(7)(7)(7)
(2)(2)(2)(2)(2)(2)(2)(2)(2) (7)(7)(7)(7)(7)(7)(7)(7)(7) (2)(2)(2)(2)(2)(2)(2)(2)(2) (2)(2)(2)(2)(2)(2)(2)(2)(2) (2)(2)(2)(2)(2)(2)(2)(2)(2)
(2)(2)(2)(2)(2)(2)(2)(2)(2) (7)(7)(7)(7)(7)(7)(7)(7)(7) (2)(2)(2)(2)(2)(2)(2)(2)(2) (2)(2)(2)(2)(2)(2)(2)(2)(2) (2)(2)(2)(2)(2)(2)(2)(2)(2)
(2)(2)(2)(2)(2)(2)(2)(2)(2) (12)(12)(12)(12)(12)(12)(12)(12)(12) (7)(7)(7)(7)(7)(7)(7)(7)(7) (7)(7)(7)(7)(7)(7)(7)(7)(7) (2)(2)(2)(2)(2)(2)(2)(2)(2)
SATICOY 7.5 MINUTE QUADRANGLE AND PORTIONS OFADJACENT QUADRANGLES
10% EXCEEDANCE IN 50 YEARS PEAK GROUND ACCELERATION1998
PREDOMINANT EARTHQUAKE Magnitude (Mw) (Distance (km))
Department of ConservationCalifornia Geological Survey0 1.5
Miles
3
Figure 3.4
Base map from GDT
SEISMIC HAZARD EVALUATION OF THE SATICOY QUADRANGLE45 SHZR 066
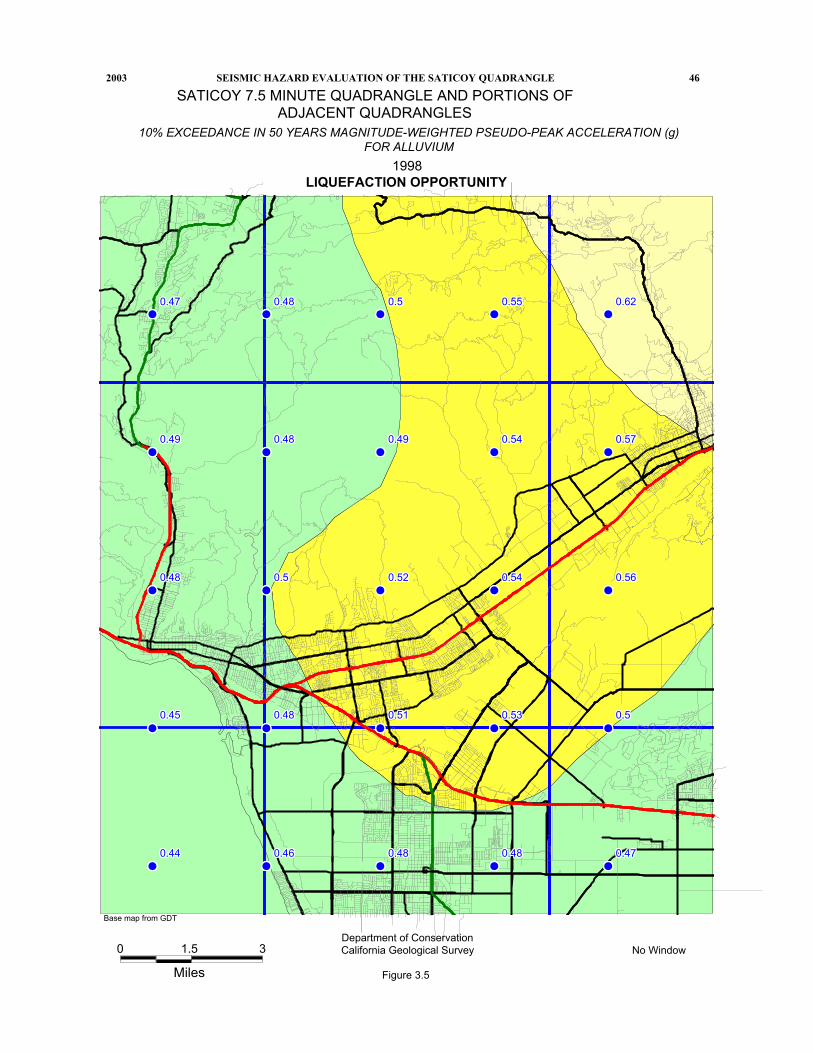
������������������������������������������������� ������������������������������������������������� ������������������������������������������������� ������������������������������������������������� �������������������������������������������������
�������������������������������������������������������������������������������������������������� ������������������������������������������������� ������������������������������������������������� �������������������������������������������������
�������������������������������������������������������������������������������������������������� �������������������������������������������������
�������������������������������������������������������������������������������������������������� �������������������������������������������������
�������������������������������������������������������������������������������������������������� �������������������������������������������������
������������������������������������������������� �������������������������������������������������
������������������������������������������������� �������������������������������������������������
������������������������������������������������� �������������������������������������������������
0.440.440.440.440.440.440.440.440.44 0.460.460.460.460.460.460.460.460.46 0.480.480.480.480.480.480.480.480.48 0.480.480.480.480.480.480.480.480.48 0.470.470.470.470.470.470.470.470.47
0.450.450.450.450.450.450.450.450.45 0.480.480.480.480.480.480.480.480.48 0.510.510.510.510.510.510.510.510.51 0.530.530.530.530.530.530.530.530.53 0.50.50.50.50.50.50.50.50.5
0.480.480.480.480.480.480.480.480.48 0.50.50.50.50.50.50.50.50.5 0.520.520.520.520.520.520.520.520.52 0.540.540.540.540.540.540.540.540.54 0.560.560.560.560.560.560.560.560.56
0.490.490.490.490.490.490.490.490.49 0.480.480.480.480.480.480.480.480.48 0.490.490.490.490.490.490.490.490.49 0.540.540.540.540.540.540.540.540.54 0.570.570.570.570.570.570.570.570.57
0.470.470.470.470.470.470.470.470.47 0.480.480.480.480.480.480.480.480.48 0.50.50.50.50.50.50.50.50.5 0.550.550.550.550.550.550.550.550.55 0.620.620.620.620.620.620.620.620.62
SATICOY 7.5 MINUTE QUADRANGLE AND PORTIONS OFADJACENT QUADRANGLES
10% EXCEEDANCE IN 50 YEARS MAGNITUDE-WEIGHTED PSEUDO-PEAK ACCELERATION (g) FOR ALLUVIUM
1998LIQUEFACTION OPPORTUNITY
Department of ConservationCalifornia Geological Survey
Figure 3.5
No Window 0 1.5
Miles
3
Base map from GDT
SEISMIC HAZARD EVALUATION OF THE SATICOY QUADRANGLE 462003

2003 SEISMIC HAZARD ZONE REPORT FOR THE SATICOY QUADRANGLE 47
USE AND LIMITATIONS
The statewide map of seismic hazard has been developed using regional information and is not appropriate for site specific structural design applications. Use of the ground motion maps prepared at larger scale is limited to estimating earthquake loading conditions for preliminary assessment of ground failure at a specific location. We recommend consideration of site-specific analyses before deciding on the sole use of these maps for several reasons.
1. The seismogenic sources used to generate the peak ground accelerations were digitized from the 1:750,000-scale fault activity map of Jennings (1994). Uncertainties in fault location are estimated to be about 1 to 2 kilometers (Petersen and others, 1996). Therefore, differences in the location of calculated hazard values may also differ by a similar amount. At a specific location, however, the log-linear attenuation of ground motion with distance renders hazard estimates less sensitive to uncertainties in source location.
2. The hazard was calculated on a grid at sites separated by about 5 km (0.05 degrees). Therefore, the calculated hazard may be located a couple kilometers away from the site. We have provided shaded contours on the maps to indicate regional trends of the hazard model. However, the contours only show regional trends that may not be apparent from points on a single map. Differences of up to 2 km have been observed between contours and individual ground acceleration values. We recommend that the user interpolate PGA between the grid point values rather than simply using the shaded contours.
3. Uncertainties in the hazard values have been estimated to be about +/- 50% of the ground motion value at two standard deviations (Cramer and others, 1996).
4. Not all active faults in California are included in this model. For example, faults that do not have documented slip rates are not included in the source model. Scientific research may identify active faults that have not been previously recognized. Therefore, future versions of the hazard model may include other faults and omit faults that are currently considered.
5. A map of the predominant earthquake magnitude and distance is provided from the deaggregation of the probabilistic seismic hazard model. However, it is important to recognize that a site may have more than one earthquake that contributes significantly to the hazard. Therefore, in some cases earthquakes other than the predominant earthquake should also be considered.
Because of its simplicity, it is likely that the SPPV method (DOC, 1997) will be widely used to estimate earthquake shaking loading conditions for the evaluation of ground failure hazards. It should be kept in mind that ground motions at a given distance from an earthquake will vary depending on site-specific characteristics such as geology, soil properties, and topography, which may not have been adequately accounted for in the regional hazard analysis. Although this variance is represented to some degree by the

CALIFORNIA GEOLOGICAL SURVEY SHZR 066 48
recorded ground motions that form the basis of the hazard model used to produce Figures 3.1, 3.2, and 3.3, extreme deviations can occur. More sophisticated methods that take into account other factors that may be present at the site (site amplification, basin effects, near source effects, etc.) should be employed as warranted. The decision to use the SPPV method with ground motions derived from Figures 3.1, 3.2, or 3.3 should be based on careful consideration of the above limitations, the geotechnical and seismological aspects of the project setting, and the “importance” or sensitivity of the proposed building with regard to occupant safety.
REFERENCES
Boore, D.M., Joyner, W.B. and Fumal, T.E., 1997, Empirical near-source attenuation relationships for horizontal and vertical components of peak ground acceleration, peak ground velocity, and pseudo-absolute acceleration response spectra: Seismological Research Letters, v. 68, p. 154-179.
California Department of Conservation, Division of Mines and Geology, 1997, Guidelines for evaluating and mitigating seismic hazards in California: Special Publication 117, 74 p.
Campbell, K.W., 1997, Attenuation relationships for shallow crustal earthquakes based on California strong motion data: Seismological Research Letters, v. 68, p. 180-189.
Cramer, C.H. and Petersen, M.D., 1996, Predominant seismic source distance and magnitude maps for Los Angeles, Orange and Ventura counties, California: Bulletin of the Seismological Society of America, v. 85, no. 5, p. 1645-1649.
Cramer, C.H., Petersen, M.D. and Reichle, M.S., 1996, A Monte Carlo approach in estimating uncertainty for a seismic hazard assessment of Los Angeles, Ventura, and Orange counties, California: Bulletin of the Seismological Society of America, v. 86, p. 1681-1691.
International Conference of Building Officials (ICBO), 1997, Uniform Building Code: v. 2, Structural engineering and installation standards, 492 p.
Jennings, C.W., compiler, 1994, Fault activity map of California and adjacent areas: California Department of Conservation, Division of Mines and Geology, California Geologic Data Map Series, map no. 8.
Petersen, M.D., Bryant, W.A., Cramer, C.H., Cao, T., Reichle, M.S., Frankel, A.D., Lienkaemper, J.J., McCrory, P.A. and Schwartz, D.P., 1996, Probabilistic seismic hazard assessment for the State of California: California Department of Conservation, Division of Mines and Geology Open-File Report 96-08; also U.S. Geological Survey Open-File Report 96-706, 33 p.

2003 SEISMIC HAZARD ZONE REPORT FOR THE SATICOY QUADRANGLE 49
Real, C.R., Petersen, M.D., McCrink, T.P. and Cramer, C.H., 2000, Seismic Hazard Deaggregation in zoning earthquake-induced ground failures in southern California: Proceedings of the Sixth International Conference on Seismic Zonation, November 12-15, Palm Springs, California, EERI, Oakland, CA.
Sadigh, K., Chang, C.-Y., Egan, J.A., Makdisi, F. and Youngs, R.R., 1997, SEA96- A new predictive relation for earthquake ground motions in extensional tectonic regimes: Seismological Research Letters, v. 68, p. 190-198.
Wilson, R.C. and Keefer, D.K., 1983, Dynamic analysis of a slope failure from the 1979 Coyote Lake, California, Earthquake: Bulletin of the Seismological Society of America, v. 73, p. 863-877.
Youd, T.L. and Idriss I.M., 1997, Proceedings of the NCEER workshop on evaluation of liquefaction resistance of soils: Technical Report NCEER-97-0022, 40 p.
Youngs, R.R., Chiou, S.-J., Silva, W.J. and Humphrey, J.R., 1997, Stochastic point-source modeling of ground motions in the Cascadia Region: Seismological Research Letters, v. 68, p. 74-85.
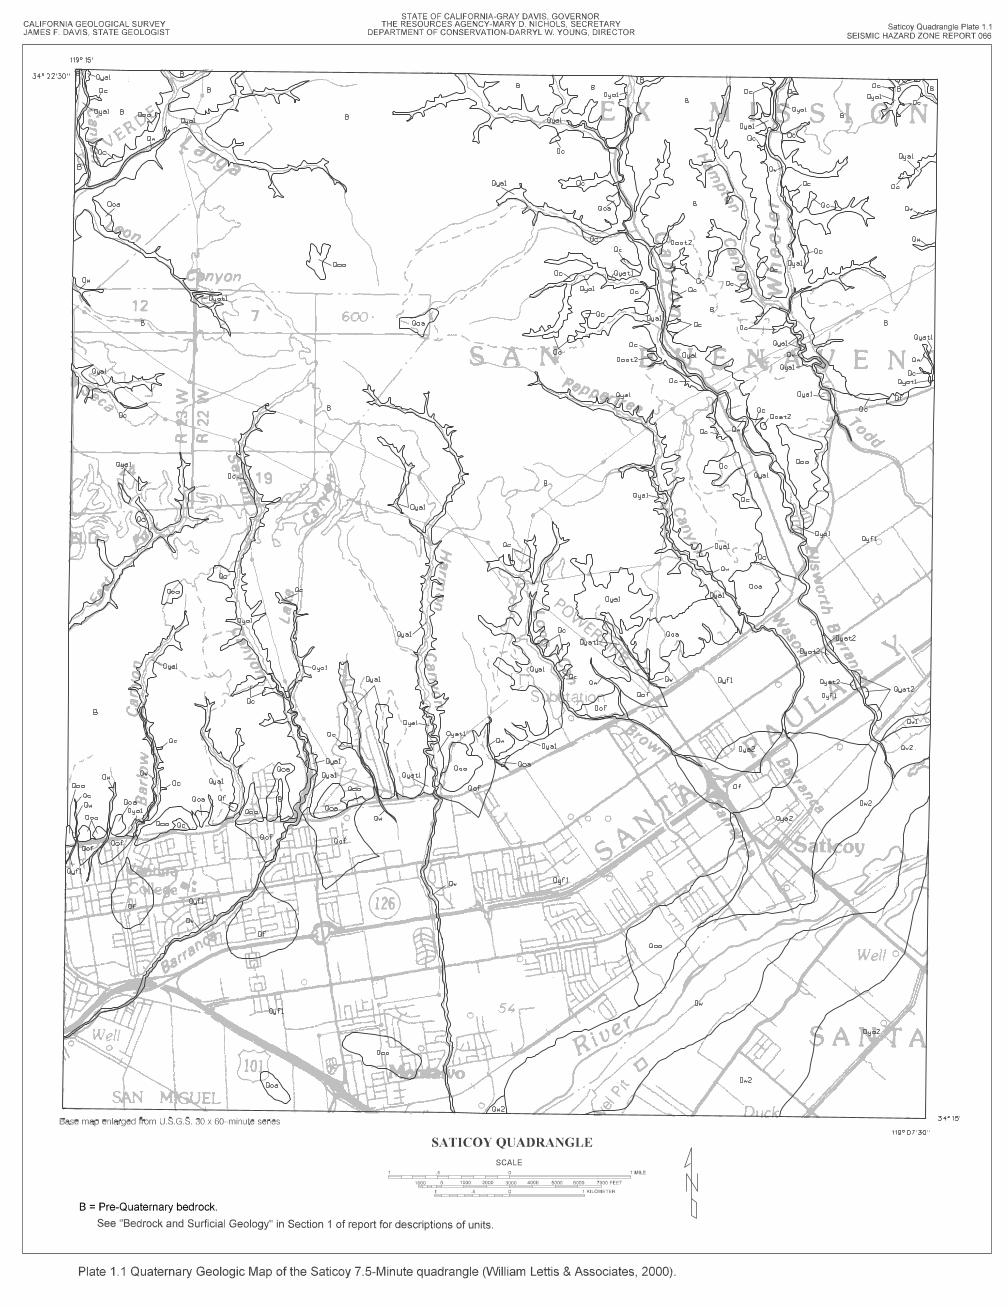
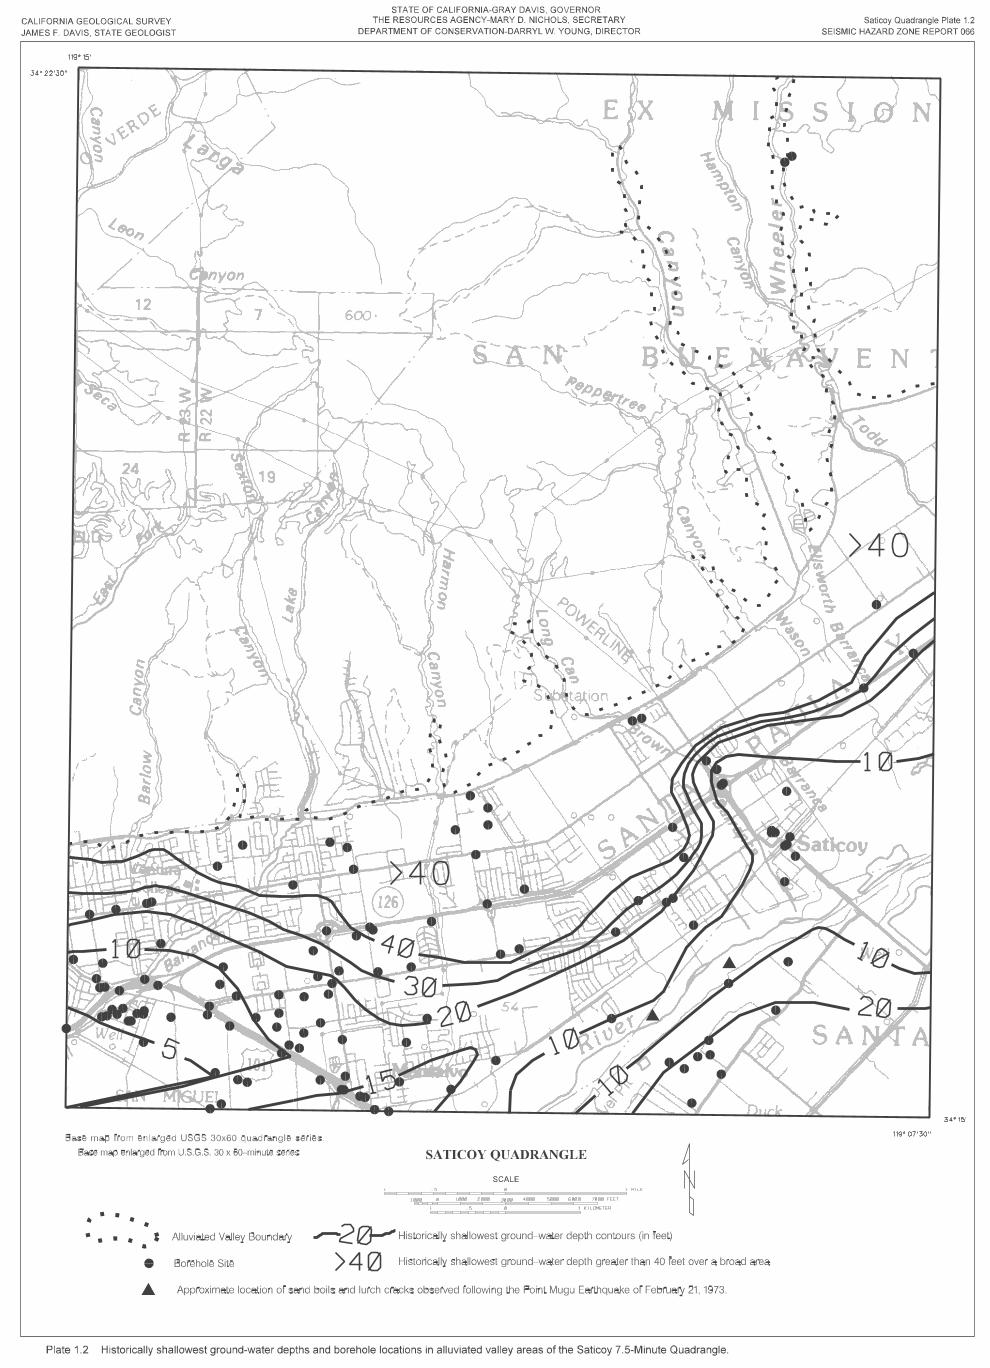

dslideShear test sample location
p g
Plate 2.1 Landslide inventory and shear test sample locations, Saticoy 7.5-Minute quadrangle.
4˚15'
119˚07'30"
119˚15'34˚22'30
STATE OF CALIFORNIA-GRAY DAVIS, GOVERNORTHE RESOURCES AGENCY-MARY D. NICHOLS, SECRETARY
DEPARTMENT OF CONSERVATION-DARRYL W. YOUNG, DIRECTOR SEISMIC HAZARD ZONE REPORT 066
NNSCALE
SATICOY QUADRANGLE
1 0
0
0
1
1000 2000 4000
1 MILE
1 KILOMETER.5
.5
6000 FEET
CALIFORNIA GEOLOGICAL SURVEYJAMES F. DAVIS, STATE GEOLOGIST
Saticoy Quadrangle Plate 2.1