Embed Size (px)
Citation preview

Computational Engineering and Physical Modeling 1-1 (2018) 38-57
How to cite this article: Azadi Kakavand MR, Khanmohammadi M. Seismic Fragility Assessment of Local and Global Failures in
Low-rise Non-ductile Existing RC Buildings: Empirical Shear-Axial Modelling vs. ASCE/SEI 41 Approach. Comput Eng Phys
Model 2018;1(1):38–57. https://doi.org/10.22115/CEPM.2018.114549.1008
2588-6959/ © 2018 The Authors. Published by Pouyan Press.
This is an open access article under the CC BY license (http://creativecommons.org/licenses/by/4.0/).
Contents lists available at CEPM
Computational Engineering and Physical Modeling
Journal homepage: www.jcepm.com
Seismic Fragility Assessment of Local and Global Failures in
Low-rise Non-ductile Existing RC Buildings: Empirical Shear-
Axial Modelling vs. ASCE/SEI 41 Approach
M.R. Azadi Kakavand1*, M. Khanmohammadi2 1. Unit of Strength of Materials and Structural Analysis, Department of basic sciences in engineering sciences,
University of Innsbruck, Innsbruck, Austria
2. Faculty of Civil Engineering, University of Tehran, Tehran, Iran
Corresponding author: [email protected]
https://doi.org/10.22115/CEPM.2018.114549.1008
ARTICLE INFO
ABSTRACT
Article history:
Received: 12 January 2018
Revised: 17 March 2018
Accepted: 19 March 2018
The brittle behavior of older non-ductile reinforced concrete
buildings such as shear-axial failure in columns can cause
lateral instability or gravity collapse. Hence, the attempt is to
assess the collapse potential through fragility curves. Current
research focuses on fragility assessment of these buildings
emphasizing on shear-axial failure using two well-
established methods; empirical limit state material versus
ASCE/SEI 41-13 recommendations. To this aim, two 2D
reinforced concrete models (3 and 5-story) according to
typical detail of existing buildings in Iran were modeled
using two aforementioned modeling approaches and
analyzed under monotonic analysis and incremental dynamic
analysis (IDA). In the following, seismic fragility assessment
were carried out by means of obtained results from IDA. The
results of fragility curves showed that collapse capacity of
buildings modeled by ASCE/SEI 41-13 are more than
empirical method and fewer cases can pass the level of safety
probability of failure suggested by ASCE/SEI-41.
Keywords:
Shear and axial failures;
Local and global collapse;
Non-ductile reinforced concrete
buildings;
Fragility curves.
1. Introduction
A significant portion of constructed buildings during 20th century particularly those in under
developed countries do not satisfy seismic provisions proposed by new seismic regulations. In

39 M. R. Azadi Kakavand ,M. KhanMohammadi/ Computational Engineering and Physical Modeling 1-1 (2018) 38-57
this regard, post inspections of past earthquakes revealed that such vulnerable buildings might
experience severe damages due to lack of adequate ductility and shear strength. Although,
modern buildings considerably secured life safeties under excitation of previous earthquakes it
was shown that they probably would not satisfy higher performance objectives coming from
higher life standards such as collapse prevention or global instability which may induce beyond
acceptable economical impacts [1]. Therefore, many research activities have been conducted to
shift conventional approaches to the new generation of seismic design so-called Performance-
Based Seismic Design (PBSD). With developing the PBSD approaches in both assessment or
design of old and new buildings, the attention on seismic collapse capacity of buildings,
particularly non-ductile, has been emerged as a main concern on the survivability of human life.
In the following, it was particularly noticed that defining reliable and accurate limit states or
performance criteria play a key role in the application of PBSD. In this regard, several
inconsistencies were shown in common proposed threshold values such as rotations, strains,
ductility and inter-story drift. For instance, equivalent local (e.g., rotations or strains) and global
(e.g., inter-story drift ratio) criteria for a moment-resisting RC frame can result in different safety
levels [2]. Hence, many experimental and analytical types of research have been conducted by
different researchers to explore one of the most widely observed failures in existing RC
components, i.e., the shear -axial behavior interaction including both strength and deformation
capacities. In addition, experimental and numerical studies of steel-concrete composite structures are
being conducted to improve the shear capacity and ductility of buildings during the earthquake [3–7]
However, the main focus is reinforced concrete structures. The past experimental tests have aimed to
discover the effects of shear failure on axial failure regarding involved influenced parameters [7–
19]. Almost all the conducted tests have been carried out on single columns as a whole or non-
ductile column as a part of the frame. Additionally, the results of experimental tests were
compared with those obtained from analytical models adopted from empirical proposed
equations [8] for flexure-shear-axial interaction (Eq. 1 and 2) or numerical models consistent
with compression field theory [20–26]. It is worthwhile to note that largely occurred nonlinearity
doubted applicability of common nonlinear analyses such as pushover for these aims. In this
regard, it was noticed that they might lead to acceptable outcomes regarding mean values, but a
significant drift under-estimation possibility and misleading damage location should be expected
[27]. Nevertheless, it was concluded that the proposed model by Elwood and corresponding
developed Limit State material [28] in OpenSees [29] seems to be one of the most practical
approaches. This Limit State material has been based on Equation 1 and 2 in which drift ratio at
shear, and axial failures are addressed, respectively.
(∆𝑠
𝐿) =
3
100+ 4𝜌" −
1
40
𝜈
√𝑓′𝑐
−1
40
𝑃
𝐴𝑔. 𝑓′𝑐
≥1
100 (𝑀𝑃𝑎) (1)
(∆
𝐿)
𝑎𝑥𝑖𝑎𝑙=
4
100
1 + (𝑡𝑎𝑛𝜃)2
𝑡𝑎𝑛𝜃 + 𝑃(𝑠
𝐴𝑠𝑡𝐹𝑠𝑡𝑑𝑐𝑡𝑎𝑛𝜃)
(𝑀𝑃𝑎) 𝑜𝑟 (𝑝𝑠𝑖) (2)
In Eq. 1 and 2, ρ” is the transverse reinforcement ratio, v is nominal shear stress, f’c is the
compressive strength of concrete, P is the axial load on column and Ag is the gross cross-
sectional area, ϴ is the crack angel from horizontal, s is the spacing of the transverse

M. R. Azadi Kakavand, M. KhanMohammadi/ Computational Engineering and Physical Modeling 1-1 (2018) 38-57 40
reinforcement, Ast is the area of the transverse reinforcement, Fst is the yield strength of the
transverse reinforcement and dc is the effective depth of column section. However, the
aforementioned equations are recently modified to increase its accuracy in prediction of the onset
of shear and axial failure in RC columns. Elwood et al. proposed ASCE/SEI 41 update and
introduced new modeling parameters for shear- axial behavior in non-linear columns using the
results of past researches [30]. Eventually, their proposed simple global modeling parameters
were included in last published ASCE-41 in 2013 [31].They implicitly considered shear-axial
failures into global moment-rotation response of deficient columns. In the literature, a few
analytical paper has been published on seismic fragility assessment or probabilistic assessment of
non-ductile R.C. buildings [32–34]. A research was presented by [35] as a part of ATC78 project
to assess a structure with 6 story and 5 bays perimeter moment- resisting frame for collapse risk.
They found that the ratio of column plastic shear to shear capacity and ratio of columns to beams
moment capacities are the important collapse indicators in non-ductile frames. Baradaran
Shoraka et al., conducted an analytical approach to find seismic loss estimation of such building
[36]. To this end, a seven-story eight-bay nonductile building located in Los Angeles was
investigated. They found that the first failure overestimates the financial loss due to ignoring
redistribution of loads. Although the behavior of columns susceptible to suffer shear-axial failure
has been well addressed in the literature, however less analytical assessment on existing non-
ductile R.C buildings, as a whole, has been carried out. Since the geometry and mechanical
properties, structural system, and practice of construction can affect the resulted responses,
generally the results of past few researches on such buildings cannot be assigned to elsewhere.
The existing old non-ductile RC buildings in Iran are different with others from point of
geometry (normally 3-5 story), material strength (very poor to fair), rebar type (the most of them
are plain instead of deformed bar), arrange of both longitudinal and particularly transverse
ties(one circumference hoop without interior ties and seismic hooks, spaced each 0.5H-H) [37].
In the current research, the effect of axial load ratio (P/Ag.f’c), the ratio of plastic shear to shear
capacity (Vp/Vn), on collapse capacity of two representative non-ductile RC buildings are
investigated, where, Vp is the plastic shear demand on the column (shear demand at flexural
strength of the plastic hinges), and Vn is the shear strength of the column [8]. To this end, using
calibrated model and two different approaches, the seismic fragility of structures are assessed,
and finally, the effects of mentioned parameters are investigated.
2. The validation of numerical modeling technique
2.1. The description of the analyzed frame
The aim of this study focuses on the seismic fragility assessment of local and global failures in
low-rise non-ductile existing RC buildings by means of two techniques, empirical modeling, and
ASCE/SEI concrete provisions. To validate the modeling method of columns for simulation of
shear-axial failures, an experimental test is selected [38]. The tested model is a frame with two
stories and two bays. The dimensions and general view of the tested specimen are shown in
Figure 1. The ratios of Vp/Vn and P/Ag.f’c were 0.84 and 0.2 respectively. The Young’s modulus
and the Poisson’s ratio for concrete were set to 18200 MPa and 0.2, respectively. For reinforcing
steel, The Young’s modulus and the Poisson’s ratio were set to 138 GPa and 0.3, respectively.

41 M. R. Azadi Kakavand ,M. KhanMohammadi/ Computational Engineering and Physical Modeling 1-1 (2018) 38-57
The compressive strength of concrete was 28 MPa, and the yield strengths of the longitudinal
and transverse bars in the columns were 444 MPa and 417 MPa respectively [41].
Fig. 1. Schematic scheme of the tested frame MUFS (Yavari et al., 2008) [13].
To calibrate the analytical model with experimental test results, the Limit State material [8]
implemented at OpenSees [31] program is considered to model shear and axial failure [30].
To account slip behavior at the end of members, an elastic rotational spring (Eq. 3) using zero-
length element [39], is modeled.
𝐾𝑠𝑙𝑖𝑝
= 8𝑢
𝑑𝑏𝑓𝑠𝐸𝐼𝑓𝑙𝑒𝑥(𝑀𝑃𝑎) (3)
Where, u is the bond stress (assumed to be 0.8√(f'c), MPa); db is the nominal diameter of the
longitudinal reinforcement, fs is the yield tensile stress in the longitudinal reinforcement, and
EIflex is the effective flexural stiffness. The effective flexural stiffness is calculated from moment-

M. R. Azadi Kakavand, M. KhanMohammadi/ Computational Engineering and Physical Modeling 1-1 (2018) 38-57 42
curvature analysis of a column section. Figure 2 shows the scheme of modeling which is used in
this paper.
Fig. 2. Schematic presentation of the frame model.
Based on observed damages reported by researchers, the beams and joints remained elastic, and
hence, the nonlinear behavior is not assigned here in Fig 2 [13,38]. In the model, five gauss
integration points are defined along the columns. The effect of damping was considered in the
model using Rayleigh damping, and a damping ratio of 0.02 is assigned to the first two modes of
the structures.
The used ground motion in shaking table test was Chi-Chi earthquake (1999 – Station TCU047)
with the PGA of 0.40g. Three tests were carried out with the scaled PGA of 0.30g, 1.10g, and
1.35g. The natural period of the frame was measured 0.29 second. The results of nonlinear
analysis and experimental results are plotted together in Figure 3. The comparison shows
acceptable convergence between the obtained results such as shear failure, maximum drift ratio,
and maximum base shear.
Fig. 3. The comparison of numerical and experimental models via Non-linear time history analysis.

43 M. R. Azadi Kakavand ,M. KhanMohammadi/ Computational Engineering and Physical Modeling 1-1 (2018) 38-57
3. Considered Non-ductile reinforced concrete buildings
3.1. General properties of frames
In this paper, two models as representative of old non-ductile R.C in Iran are considered; a frame
with 3 stories and 3 bays and another one with 5 stories and 2 bays. The mentioned models are
more consistent with existing non-ductile RC buildings in Iran. For analyzing purpose, an
interior frame is chosen and analyzed as a 2D frame as shown in Figure 4. The height of columns
and the span length for all models are 3200 and 4000 mm respectively. The Young’s modulus
and the Poisson’s ratio for concrete were set to 24000 MPa and 0.2, respectively. For reinforcing
steel, The Young’s modulus and the Poisson’s ratio were set to 200 GPa and 0.3, respectively.
The yield stress of longitudinal and transverse reinforcement was selected as 300 MPa, and the
compressive strength of concrete was 20 MPa. All geometric and mechanical characteristic
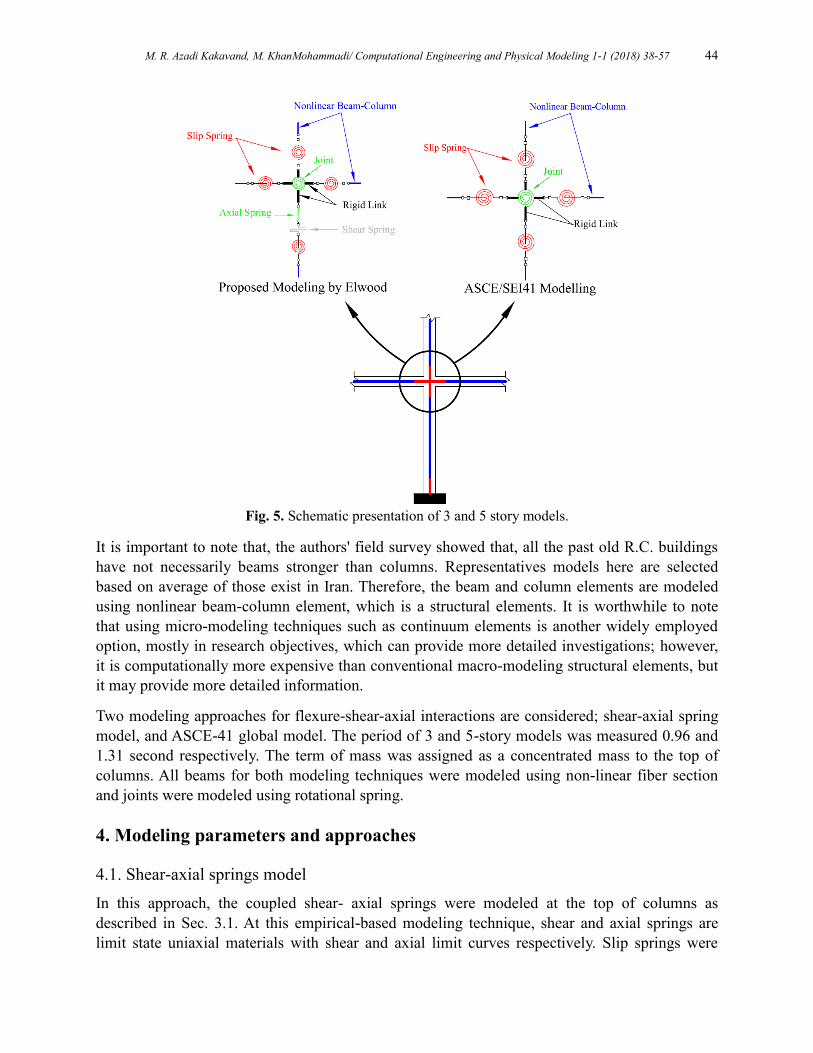
values are common for residential and office buildings in Iran. Figure 5 illustrates two different
modeling approaches, which are employed in this study, proposed by Elwood (2002) and
ASCE/SEI 41. The nonlinear modeling approach, proposed by Elwood, describes the flexure-
shear-axial behavior of reinforced concrete columns by means of slip, shear, and axial springs,
respectively. More information regarding this nonlinear modeling method can be found in
[28,29]. On the other hand, ASCE/SEI 41 proposes criteria for the occurrence of flexure, shear
and axial failure based on geometry and mechanical properties of RC columns. Hence, force-
rotation relations for concrete columns were assigned to the rotational spring, located at the top
of columns, by means of the three-line curve which will be further described in sec. 4.2. In this
paper, three models for each approach are considered. These three models can be stated based on
the initial axial load ratio of columns and the transverse reinforcement spacing in columns
(P/Ag.f’c – S(mm)) as; 0.12–200, 0.17–250 and 0.25–300.
Fig. 4. Elevation view and structural details of case study frames.
M. R. Azadi Kakavand, M. KhanMohammadi/ Computational Engineering and Physical Modeling 1-1 (2018) 38-57 44
Fig. 5. Schematic presentation of 3 and 5 story models.
It is important to note that, the authors' field survey showed that, all the past old R.C. buildings
have not necessarily beams stronger than columns. Representatives models here are selected
based on average of those exist in Iran. Therefore, the beam and column elements are modeled
using nonlinear beam-column element, which is a structural elements. It is worthwhile to note
that using micro-modeling techniques such as continuum elements is another widely employed
option, mostly in research objectives, which can provide more detailed investigations; however,
it is computationally more expensive than conventional macro-modeling structural elements, but
it may provide more detailed information.
Two modeling approaches for flexure-shear-axial interactions are considered; shear-axial spring
model, and ASCE-41 global model. The period of 3 and 5-story models was measured 0.96 and
1.31 second respectively. The term of mass was assigned as a concentrated mass to the top of
columns. All beams for both modeling techniques were modeled using non-linear fiber section
and joints were modeled using rotational spring.
4. Modeling parameters and approaches
4.1. Shear-axial springs model
In this approach, the coupled shear- axial springs were modeled at the top of columns as
described in Sec. 3.1. At this empirical-based modeling technique, shear and axial springs are
limit state uniaxial materials with shear and axial limit curves respectively. Slip springs were

45 M. R. Azadi Kakavand ,M. KhanMohammadi/ Computational Engineering and Physical Modeling 1-1 (2018) 38-57
located at the bottom of columns to consider the effect of strain penetration of longitudinal bars.
Nonlinear beam-column elements connect two zero-length elements located at the top and
bottom of columns. Beams were modeled using nonlinear beam-column element, and slip
springs were located at both ends of beams. To model the behavior of joints, the prescribed
parameters of ASCE/SEI41-13 [31] for Non-ductile reinforced concrete joints, were
implemented. Figure 6 shows the assigned shear force-rotation curves for the joints with initial
axial load ratio of 0.12. The joint behavior curves in other models with the initial axial load ratio
of 0.17 and 0.25 follow the same manner.
Fig. 6. Shear Force Vs. Rotation of the joints for the model with P/Ag.f'c =0.12 (ASCE/SEI 41).
Fig. 6 demonstrates that the strength and ductility capacities of the modeled joints considerably
vary based on the location of joints. This can be described as the effects of confinement on the
terms of strength and ductility. On the other hand, it was observed that with increasing the axial
load in columns, the ductility capacity decreases.
4.2. ASCE/SEI-41 method
This approach was developed according to ASCE/SEI41-13 [31] concrete provision. In this
modeling technique, flexure, shear, and axial springs were removed and a moment-rotation
spring defined to consider the flexure-shear-axial behavior in columns. All rest details are the
same of the previous modeling technique. Figure 7 shows a sample of defined shear force-
rotation curves for the columns in 3 story frame according to the variation of initial axial load
ratios. In figure 7, the shear force is estimated by the sum of shear strength carried by concrete
and stirrups.

M. R. Azadi Kakavand, M. KhanMohammadi/ Computational Engineering and Physical Modeling 1-1 (2018) 38-57 46
Fig. 7. Shear Force Vs. Rotation curves for the columns in 3 story frame according to the variation of
initial axial load ratios (ASCE/SEI 41-13).
Both three and five-story models were categorized using three initial axial load ratios (P/Ag.f’c =
0.25, 0.17 and 0.12) and three spacing of transverse reinforcement (S= 300, 250 and 200 mm).
5. The Pushover Analysis
The results of the push-over analysis can present the mechanism of collapse initiation in
buildings. The obtained results due to pushover analysis for 3 and 5-story models are shown in
Figure 8. Figure 8 illustrates the response of base shear versus roof drift ratio regarding three
axial load ratios and spacing of transverse reinforcement as well as two mentioned modeling
approaches. As expected, decreasing of initial axial load ratio and spacing between stirrups for
the models with shear and axial springs cause an increasing of drift ratio at shear and axial
failure. All models have the same behavior until the occurrence of the first shear failure.
However, when first shear failures were detected, the models experience strength degradation.
After the occurrence of the first shear failure, the rate of strength degradation is different. The
models with shear-axial spring show sudden strength loss, and consequently, first axial failure
terminate the analysis. Unlike this model, modeling based on ASCE-41-13 [31] shows less
strength degradation after first shear failure, and displacement ductility increases more than
shear-axial spring models. The occurrence of an axial failure in this model can not limit
increasing of displacement capacity until a numerical divergence terminates the run. It is
important to note that, the first axial failure in this model (ASCE-41 model) just loses the lateral
capacity of the same column and the last axial failure (as indicated in Figure 8) does not
necessarily happen in the same story. It may occur in another story. Hence, after first axial
failure, the shear capacity necessarily has not sudden drop up to shear-axial spring model.

47 M. R. Azadi Kakavand ,M. KhanMohammadi/ Computational Engineering and Physical Modeling 1-1 (2018) 38-57
Fig. 8. Base shear - Roof drift plot due to non-linear pushover analysis in (a) 3-Story models and (b) 5-
Story models.
The global gravity collapse in non-ductile columns mostly appears after the occurrence of an
axial failure. In other words, in a floor when the axial capacity of a single column is lost, the
other columns can carry the distributed weight from the first failed column. In this circumstance,
the quality of beams performance is crucial. If the beams can bridge between remained columns
and no failure appears in the beams, it is expected that the remained columns can carry excessive
demanded loads until their ultimate axial capacities are met. To investigate the difference
between first and global axial failure, all models have been assessed. Figure 9 shows a sample of
results. Figure 9a illustrates the axial load in a column that experience axial failure (first axial
failure) versus axial displacement. Figure 8b shows the sum of axial loads in story's columns
versus axial displacement. As shown in Figure 9a the initial axial load in column increases (due
to overturning actions) until at displacement of 0.25 cm, axial failure is detected. In the same
manner, axial load of floor illustrated in Fig. 8b is constant up to first axial failure. Rationally,
after first axial failure, the total axial force should be constant, if the lost weight can transmit to
other columns. The analysis results show that, due to numerical problems, the program was not
able to consider more steps of pushover analysis after detection of an axial failure.
Fig. 9. Axial Load – Vertical Disp. plot due to non-linear pushover analysis in 3-Story model (a) the first
axial failure in the column and (b) the first axial failure in the floor.

M. R. Azadi Kakavand, M. KhanMohammadi/ Computational Engineering and Physical Modeling 1-1 (2018) 38-57 48
The numbers of brittle responses in columns at higher drift ratio can produce numerical
instability in responses. So in current research, the first axial failure and global gravity failure are
assumed the same, and in the remaining discussion, no difference is made between them.
6. Earthquake records properties
To perform time history analyses in OpenSees due to far-field records, twelve records were
chosen from FEMA P695 [39]. The magnitude of records varies between 6.5-7.5, the site
distance is between 7.1-23.6 km, and the peak ground accelerations are between 0.21g-0.53g.
The graphs of pseudo-Acceleration versus period for the mentioned records are shown in figure
10.
Fig. 10. The Sa(g) of applied records vs. time period.
7. Incremental dynamic analysis of modeled buildings
Incremental dynamic analysis (IDA) is a collection of non-linear dynamic analyses that uses
several spectra accelerations. Scaled intensity measure (IM) is chosen to consider linear and non-
linear situations of a structure and eventually lateral dynamic instability.
In this study, twelve models are considered to conduct IDA (two buildings, two modeling
approaches, three axial load ratios and transverse reinforcement spacing). Each model is
analyzed under twelve far-filed records to determine the shear and axial failure in columns. To
this end, at first, the IDA curves are developed for every twelve models. The IDA curves show
the spectra acceleration at fundamental period of buildings versus maximum inter-story drift. The
Figures11 and 12 show the sample of results of IDA curves for three and five-story building
models respectively with the same axial load ratio and transverse reinforcement spacing. In the
plotted curves in Figures 11 and 12, the black triangles and circles show the point of first shear

49 M. R. Azadi Kakavand ,M. KhanMohammadi/ Computational Engineering and Physical Modeling 1-1 (2018) 38-57
and axial failure respectively, and black stars indicate the point of lateral dynamic instability. The
dynamic instability point has defined the point on curves that, with a small increase in lateral
acceleration, infinite inter-story drift ratio can achieve. The two points should be paid attention.
The first point is that many of IDA curves have not attained dynamic instability due to numerical
divergence encountered after axial failure and hence, dynamic instability is not addressed in
curves. The second point is that in some cases, the indicated point as dynamic instability is
before axial failure point which is turned to our judgment on indicating a point as dynamic
instability. This matter can not affect our purposes from this research. As a result of Figures 11
and 12, following few steps of analysis after first axial failure, the model becomes unstable and
analysis is terminated. Therefore, in current research, the point of occurrence of first axial failure
can be considered as instability state.
Fig. 11. Sa (g) Vs. Maximum Inter-story drift ratio for 3-Story model with P/Ag.f’c =0.12, S=200 mm. a)
ASCE/SEI 41-13 modeling approach, b) shear and axial springs modeling approach.
Fig.12. Sa (g) Vs. Maximum Inter-story drift ratio for 5-Story model with P/Ag.f’c =0.12, S=200mm. a)
ASCE/SEI 41-13 modeling approach, b) shear and axial springs modeling approach.
The derived results from Figures 11 and 12 are shown in Table 3. Moreover, for comparison, the
results of pushover analysis on both modeling techniques are also listed in Table 1.

M. R. Azadi Kakavand, M. KhanMohammadi/ Computational Engineering and Physical Modeling 1-1 (2018) 38-57 50
Table 1
The mean of maximum inter-story drift ratio at first shear and axial failure derived from IDA.
No. of
Story
Modelling
approach
Type of
Failure
P/Ag.f’c = 0.12
S=200 mm
P/Ag.f’c = 0.17
S=250 mm
P/Ag.f’c = 0.25
S=300 mm
Time
History
(%)
Push
over
(%)
Time
Histor
y (%)
Push
over
(%)
Time
History
(%)
Push
over
(%)
3 Story
Elwood Shear 3.19 2.75 3.07 2.53 2.86 2.35
Axial 5.59 3.59 4.67 3.05 2.86 2.35
ASCE Shear 3.85 3.28 3.51 3.00 3.08 2.62
Axial 7.66 5.97 6.64 5.44 3.08 2.62
5 Story
Elwood Shear 5.79 3.24 4.39 2.27 3.59 2.10
Axial 6.52 3.37 5.35 2.92 3.59 2.10
ASCE Shear 3.97 3.39 3.55 3.02 3.28 2.50
Axial 7.15 5.62 6.18 5.13 3.28 2.50
The results of Table 1 demonstrate that both modeling approaches in two considered frames
nearly present the same shear and axial drift ratios, except that the modeling based on shear-axial
springs, the values of drift ratio at first shear failure of five-story buildings are more than 3-story
frame as 25%-81%. The mentioned differences become smaller where axial load ratio increases
from 0.12 to 0.25. At all listed results in Table 3 with increasing axial load ratio from 0.12 to
0.25 the reported values on both modeling approaches and frames show the fewer differences
and smaller values of drift ratio. For instance, for an axial load ratio of 0.25, all resulted values
are nearly resembled, and less dispersion can be seen in results. The results also reveal that with
increasing in axial load ratio, the difference between first shear failure and first axial failure
become negligible. In comparison between two modeling approaches, the following results can
be inferred:
- In 3-story frame for all axial load ratio, the drift ratio at first shear failure from modeling with
shear-axial springs is less than that of ASCE-41-13 approach as 7%-17%, while in the 5-story
frame, it is inverse (45%-10%).
- Both frames and both modeling approaches have shown that the values of drift ratio at first
axial failure from shear-axial springs model are less than ASCE-41/13 approach. The differences
vary between 7%-17% for the 3-story frame and 9%-14% for the 5-story frame. An exception is
for the 5-story frame at axial load ratio 0.25 which can be assigned to the dispersion of IDA
results.
The results listed in table 3 show that push-over analysis almost underestimates the first shear
and axial failure in comparison with IDA particularly at the 5-story frame and for lower axial
load ratio.

51 M. R. Azadi Kakavand ,M. KhanMohammadi/ Computational Engineering and Physical Modeling 1-1 (2018) 38-57
In section 4, the probability of global collapse occurrence after axial failure in a floor due to non-
linear pushover analysis investigated. In this section, the occurrence of global collapse is
investigated in all models with shear and axial springs. A sample result of models with initial
axial ratios of 0.12 in the 3-Story model due to non-linear time history analysis is shown in
Figure 13.
Fig. 13. Axial load versus time in 3-Story model, (a) in a column suffered axial failure, (b) in the floor
including the column which suffered axial failure.
In Figure 13, the graph of axial load versus time for a column and floor is presented. In Figure
13, the column and floor experienced the first axial failure due to non-linear time history
analysis. According to Figure 13a, the axial load capacity of column decrease around 10% after
axial failure initiation, whereas the axial load capacity of floor did not change significantly
(Figure 13b). The results of the assessment on other columns show that losing axial load at failed
column due to axial failure redistribute on other columns. However, the sum of axial load
capacity of columns in a floor did not change significantly. However as stated in section 4, due to
convergence problems no much more drift is seen after first axial failure. The same conclusion
discussed in section 4, is inferable here and for brevity not explained again. Therefore, no
significant differences can consider between first axial failure and global axial failure in low-rise
buildings.
8. Seismic fragility assessment
The conditional seismic demand in reinforced concrete columns for each record and each
spectral acceleration may be calculated using lognormal distribution as follows:
𝑃 = 1 − Ф (ln(𝑆𝑎 ∗ 𝑔) − 𝜆
𝜉) (4)
Where, Ф is a logical value that determines the form of function, Sa is pseudo acceleration, g is
gravity acceleration, λ is mean deviation and ξ is a standard deviation for each pseudo
acceleration in shear and axial failure. So, the fragility curve is calculated using the following
equation:

M. R. Azadi Kakavand, M. KhanMohammadi/ Computational Engineering and Physical Modeling 1-1 (2018) 38-57 52
𝐹𝑅 = Ф (ln ((𝑆𝑎 ∗ 𝑔) / 𝜆)
𝜉) (5)
The results of statistic calculations for all analyzed models are presented in Table 2, where λ and
ξ are mean and standard deviation of spectral accelerations respectively.
Table 2
Statistic results of the calculation of mean and standard deviation.
Number
of Story
Modelling
Approach
Type of
Failure
P/Ag.f’c = 0.25
S=300 mm
P/Ag.f’c = 0.17
S=250 mm
P/Ag.f’c = 0.12
S=200 mm
λ ξ λ ξ λ ξ
3 Story
Elwood Shear 1.728 0.493 1.751 0.494 1.836 0.491
Axial 1.728 0.493 2.051 0.429 2.262 0.482
ASCE Shear 2.002 0.449 2.167 0.443 2.256 0.446
Axial 2.002 0.449 2.653 0.503 2.795 0.453
5 Story
Elwood Shear 1.712 0.564 1.969 0.573 2.037 0.557
Axial 1.712 0.564 2.169 0.559 2.478 0.534
ASCE Shear 1.797 0.584 1.954 0.597 2.043 0.605
Axial 1.797 0.584 2.524 0.628 2.573 0.586
The results of Table 2 show that the statistic parameters for shear and axial failure in all models
with initial axial load ratio of 0.25 and the spacing of transverse reinforcement of 300 mm, are
the same. The main reason refers to Eq. 1 and 2 which axial failure occurs simultaneously with
the onset of shear failure. The other models follow failure mode of flexure-shear-axial
respectively.
Fig. 14. Seismic fragility curves of shear and axial failure for the 3-story models, (a) probability of first
shear failure, (b) probability of first axial failure.

53 M. R. Azadi Kakavand ,M. KhanMohammadi/ Computational Engineering and Physical Modeling 1-1 (2018) 38-57
Fig. 15. Seismic fragility curve of shear and axial failure for 5-story models, (a) probability first shear
failure, (b) probability first axial failure.
The fragility curves for all models are illustrated in Figures 14 to 15. In Figure 14 and 15, the
probability of shear failure (PoS) and axial failure (PoA) for 3 and 5-story frames in companion
with two modelling approach, and different axial load ratios and transverse reinforcement
spacing, are compared.
To investigate seismic fragility assessment, the values of spectral acceleration at first natural
period of each frame are illustrated in both Figures 14 and 15 by a vertical solid line and relevant
values. As seen from both Figure 14 and 15, generally the fragility curves at axial failure are
wider than shear failure curves. As a general concluding, the probability of failure attained by
shear-axial spring modeling approach, are more than ASCE-41 modeling approach. To compare
the value of failure probability, Table 3 is presented. In Table 3 the values of probability of
failure for all models are listed.
Table 3
The Probability of shear and axial failure at first natural period of each frame for two employed modeling
approach.
No.
of
Story
Type of
Failure
P/Ag.f’c = 0.25
S=300 mm
P/Ag.f’c = 0.17
S=250 mm
P/Ag.f’c = 0.12
S=200 mm
Prob. of Failure (%) Prob. of Failure (%) Prob. of Failure (%)
Elwood ASCE Diff.
(%) Elwood ASCE
Diff.
(%)
Elwoo
d ASCE
Diff.
(%)
3 St. Shear 48.8 26.0 87 47.8 15.5 209 40 11.3 255
Axial 48.8 26.0 87 21.9 3.4 539 13 3.0 330
5 St. Shear 35.7 31.1 14. 21.1 22.7 7 7.9 18.8 58
Axial 35.7 31.1 14. 12.3 5.2 137 3.6 3.4 4
Table 3 reveals that in most cases, the PoS and PoF derived from modeling based on shear-axial
spring are more than ASCE-41 approach. An exception is PoS in 5-story frame for axial load

M. R. Azadi Kakavand, M. KhanMohammadi/ Computational Engineering and Physical Modeling 1-1 (2018) 38-57 54
ratio 0.12 which can be due to dispersion in results. The differences between PoS and PoF due to
two modeling approaches are also listed in Table 3. The listed values show that the differences
between the obtained results for two modeling techniques do not follow a clear procedure,
however with increasing in axial load ratio from 0.12 to 0.25, dispersion becomes smaller.
8.1. Comparison with the level of safety probability of failure suggested by ASCE-41
ASCE-41-13 considers the level of safety when proposed modeling parameters for nonlinear
analysis. The goal in selecting values for modeling parameters in non-ductile concrete columns is
to achieve a high level of safety probability of failure less than 15% for columns that may
experience shear failures, while allowing a slightly lower level of safety 35%, for columns
expected to experience flexural failures. Given the potential of collapse resulting from axial load
failure of individual columns, a high level of safety 15% is desired. It emphasizes that the target
limits for probabilities of failure were selected based on the judgment of Ad Hoc Committee. To
investigate the reliability of proposed modeling parameters and compare the results of two
modeling approaches on buildings responses, in Table 5 those PoS or PoF less than 15% are
bolded. The numbers of bolded items show that many cases do not meet such target. Except for
frames with lower axial load ratio, it can be concluded that no other cases can pass the mentioned
target. Although the proposed rotation values in ASCE-41 on shear and axial failure of columns
have resulted from experimental tests and proposed target values, have considered columns test
and judgment as a whole. However, it seems the probability of failure on the building should be
considered where the modeling parameters are suggested.
9. Summary and conclusion
In this paper, the main purpose was to investigate the prediction of the drift ratio capacity at
shear and axial failure in existing RC columns in framed buildings due to the earthquake.
Therefore, six numerical models were developed according to two modeling techniques, as the
models with shear and axial springs at the top of columns and the models based on ASCE/SEI
41-13 concrete provisions. The results of push-over analysis and IDA were processed and using
fragility curves the following conclusions are inferred:
No meaningful difference in drift ratios between first axial failure, story gravity failure,
and lateral instability was achieved. Almost all cases became unstable after first axial
failure detection.
In comparisons between two modeling approaches, the method of ASCE-41-13 over-
estimates first axial failure than modeling with shear-axial springs. In shear failure
detection, the specific conclusion was not achieved.
The derived results showed that pushover analysis underestimates drift values at shear and
axial failure in comparison with IDA results.
The results of fragility curves showed that the probability of failure attained by shear-axial
spring modeling approach, are more than ASCE-41 modeling. The differences between
results of two modeling techniques do not follow a clear procedure; however, with

55 M. R. Azadi Kakavand ,M. KhanMohammadi/ Computational Engineering and Physical Modeling 1-1 (2018) 38-57
increasing in axial load ratio from 0.12 to 0.25 and transverse reinforcement spacing from
200-300 mm, dispersion becomes smaller.
the results of probability of failure for shear and axial failure corresponding to spectral
acceleration at first natural period (Sa(T1)) showed that, where axial load ratio or spacing
of transverse reinforcements become larger (from 0.12-0.25 for both modelling
approaches), the level of safety cannot pass the level of safety target suggested by ASCE-
41-13(i.e. 15% probability of shear and axial failure on columns).
References
[1] Allahvirdizadeh R, Mohammadi MA. Upgrading equivalent static method of seismic designs
to performance-based procedure. Earthquakes Struct 2016;10:849–65.
doi:10.12989/eas.2016.10.4.849.
[2] Allahvirdizadeh R, Khanmohammadi M, Marefat MS. Probabilistic comparative investigation
on introduced performance-based seismic design and assessment criteria. Eng Struct
2017;151:206–20. doi:10.1016/j.engstruct.2017.08.029.
[3] Shafaei S, Ayazi A, Farahbod F. The effect of concrete panel thickness upon composite steel
plate shear walls. J Constr Steel Res 2016;117:81–90. doi:10.1016/j.jcsr.2015.10.006.
[4] Rassouli B, Shafaei S, Ayazi A, Farahbod F. Experimental and numerical study on steel-
concrete composite shear wall using light-weight concrete. J Constr Steel Res 2016;126:117–
28. doi:10.1016/j.jcsr.2016.07.016.
[5] Ayazi A, Ahmadi H, Shafaei S. The effects of bolt spacing on composite shear wall behavior.
World Acad Sci Eng Technol 2012;6:10–27.
[6] Shafaei S, Farahbod F, Ayazi A. Concrete Stiffened Steel Plate Shear Walls With an
Unstiffened Opening. Structures 2017;12:40–53. doi:10.1016/j.istruc.2017.07.004.
[7] Shafaei S, Farahbod F, Ayazi A. The wall-frame and the steel-concrete interactions in
composite shear walls. Struct Des Tall Spec Build 2018:e1476. doi:10.1002/tal.1476.
[8] Elwood KJ. Shake table tests and analytical studies on the gravity load collapse of reinforced
concrete frames. 2004.
[9] Elwood KJ, Moehle JP. Evaluation of existing reinforced concrete columns. Proceedings,
2004.
[10] Elwood KJ. Modelling failures in existing reinforced concrete columns. Can J Civ Eng
2004;31:846–59. doi:10.1139/l04-040.
[11] Elwood KJ, Moehle JP. Dynamic Shear and Axial-Load Failure of Reinforced Concrete
Columns. J Struct Eng 2008;134:1189–98. doi:10.1061/(ASCE)0733-9445(2008)134:7(1189).
[12] Kabeyasawa T, Kabeyasawa T, Kim Y. Progressive Collapse Simulation of Reinforced
Concrete Buildings Using Column Models with Strength Deterioration after Yielding. Improv.
Seism. Perform. Exist. Build. Other Struct., Reston, VA: American Society of Civil Engineers;
2009, p. 512–23. doi:10.1061/41084(364)47.
[13] Yavari S, Lin SH, Elwood KJ, Wu CL, Hwang SJ, Moehle JP. Study on collapse of flexure-
shear-critical reinforced concrete frames. 14th World Conf. Earthq. Eng. Beijing, China, 2008.

M. R. Azadi Kakavand, M. KhanMohammadi/ Computational Engineering and Physical Modeling 1-1 (2018) 38-57 56
[14] Yavari S, Elwood KJ, Wu C. Collapse of a nonductile concrete frame: Evaluation of analytical
models. Earthq Eng Struct Dyn 2009;38:225–41. doi:10.1002/eqe.855.
[15] Mosalam KM, Talaat M, Park S. Modeling progressive collapse in reinforced concrete framed
structures. Proc. 14th World Conf. Earthq. Eng., 2008, p. 12–7.
[16] Wu C, Kuo W-W, Yang Y-S, Hwang S-J, Elwood KJ, Loh C-H, et al. Collapse of a nonductile
concrete frame: Shaking table tests. Earthq Eng Struct Dyn 2009;38:205–24.
doi:10.1002/eqe.853.
[17] Matamoros AB, Matchulat L, Woods C. Axial load failure of shear critical columns subjected
to high levels of axial load. Proc. 14th World Conf. Earthq. Eng, Citeseer; 2008.
[18] Nakamura T, Yoshimura M. Gravity Load Collapse of Reinforced Concrete Columns with
Brittle Failure Modes. J Asian Archit Build Eng 2002;1:21–7. doi:10.3130/jaabe.1.21.
[19] Nakamura T, Yoshimura M. Simulation of Old Reinforced Concrete Column Collapse by
Pseudo-dynamic Test Method. World Conf. Earthq. Eng., vol. 12, 2012, p. 1–10.
[20] Mostafaei H, Vecchio FJ, Kabeyasawa T. Nonlinear displacement-based response prediction of
reinforced concrete columns. Eng Struct 2008;30:2436–47.
doi:10.1016/j.engstruct.2008.01.020.
[21] Mostafaei H, Vecchio FJ. Uniaxial shear-flexure model for reinforced concrete elements. J
Struct Eng 2008;134:1538–47.
[22] Mostafaei H, Vecchio FJ, Kabeyasawa T. Deformation capacity of reinforced concrete
columns. ACI Struct J 2009;106:187.
[23] Murray JA, Sasani M. Evaluating System-Level Collapse Resistance of Non-Ductile RC
Frames Structures. Proc. 10th Natl. Conf. Earthq. Eng. Earthq. Eng. Res. Institute, Anchorage,
AK, 2014.
[24] Henkhaus KW. Axial failure of vulnerable reinforced concrete columns damaged by shear
reversals 2010.
[25] Sasani M. Shear Strength and Deformation Capacity Models for RC Columns. 13th World
Conf. Earthq. Eng. Vancouver Canada, Pap., 2004.
[26] Kyriakides N, Sohaib A, Pilakoutas K, Neocleous K, Chrysostomou C, Tantele E, et al.
Evaluation of Seismic Demand for Substandard Reinforced Concrete Structures. Open Constr
Build Technol J 2018;12:9–33. doi:10.2174/1874836801812010009.
[27] Allahvirdizadeh R, Gholipour Y. Reliability evaluation of predicted structural performances
using nonlinear static analysis. Bull Earthq Eng 2017;15:2129–48. doi:10.1007/s10518-016-
0062-x.
[28] Kakavand MRA. Limit State Material Manual 2007.
[29] McKenna F, Fenves GL, Scott MH. Open system for earthquake engineering simulation. Univ
California, Berkeley, CA 2000.
[30] Elwood KJ, Matamoros AB, Wallace JW, Lehman DE, Heintz JA, Mitchell AD, et al. Update
to ASCE/SEI 41 Concrete Provisions. Earthq Spectra 2007;23:493–523.
doi:10.1193/1.2757714.
[31] ASCE 41-13. Publ Anticip Seism Eval Upgrad Exist Build 2013;Reston, Vi.

57 M. R. Azadi Kakavand ,M. KhanMohammadi/ Computational Engineering and Physical Modeling 1-1 (2018) 38-57
[32] Kyriakides NC, Pantazopoulou SJ. Collapse Fragility Curves for RC Buildings Exhibiting
Brittle Failure Modes. J Struct Eng 2018;144:04017207. doi:10.1061/(ASCE)ST.1943-
541X.0001920.
[33] Kyriakides N, Ahmad S, Pilakoutas K, Neocleous K, Chrysostomou C. A probabilistic
analytical seismic vulnerability assessment framework for substandard structures in developing
countries. Earthq Struct 2014;6:665–87.
[34] Ahmad S, Kyriakides N, Pilakoutas K, Neocleous K, Zaman Q uz. Seismic fragility assessment
of existing sub-standard low strength reinforced concrete structures. Earthq Eng Eng Vib
2015;14:439–52. doi:10.1007/s11803-015-0035-0.
[35] Galanis PH, Moehle JP. Development of collapse indicators for older-type reinforced concrete
buildings. Proc. 15th World Conf. Earthq. Eng., 2012.
[36] Baradaran Shoraka M, Yang TY, Elwood KJ. Seismic loss estimation of non-ductile reinforced
concrete buildings. Earthq Eng Struct Dyn 2013;42:297–310. doi:10.1002/eqe.2213.
[37] Farahmand H, Reza Azadi Kakavand M, Tavousi Tafreshi S, Hafiz P. The Effect of
Mechanical and Geometric Parameters on the Shear and Axial Failures of Columns in
Reinforced Concrete Frames. Ciência e Nat 2015;37.
[38] Yavari S, Elwood KJ, Wu CL, Lin SH, Hwang SJ, Moehle JP. Shaking table tests on
reinforced concrete frames without seismic detailing. ACI Struct J 2013;110:1001.
[39] (FEMA) FEMA. Quantification of Building Seismic Performance Factors 2009.