Embed Size (px)
Citation preview
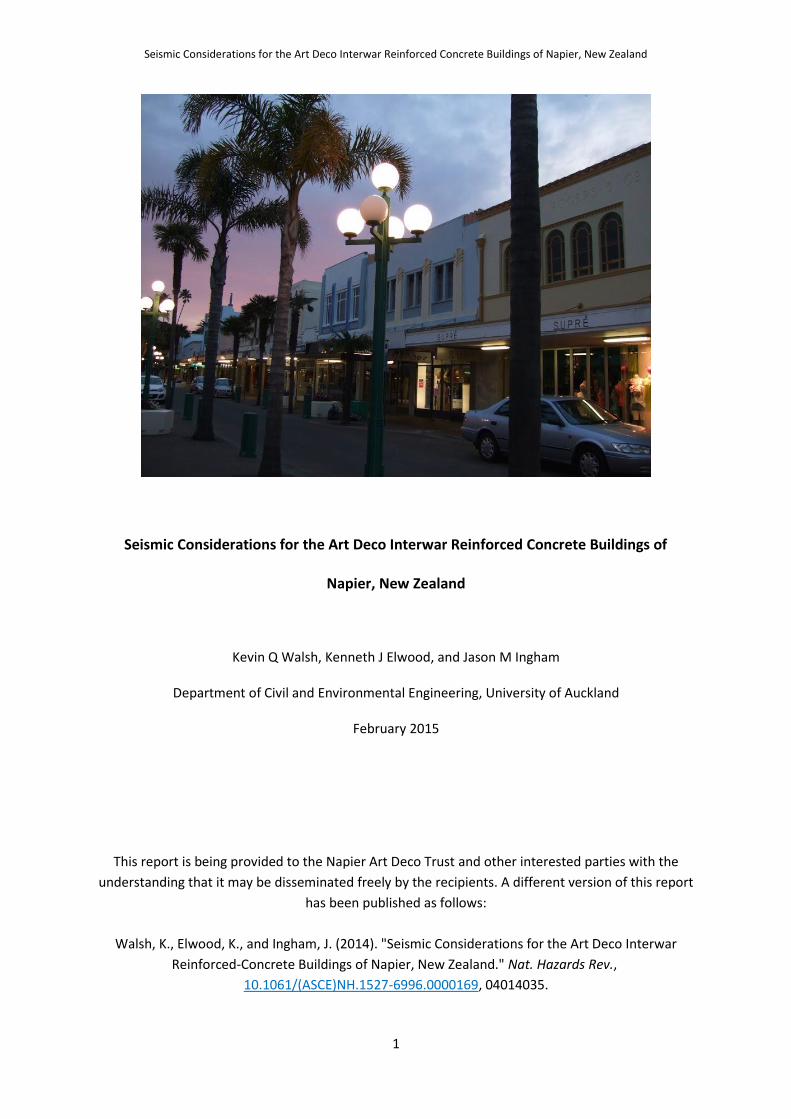
Seismic Considerations for the Art Deco Interwar Reinforced Concrete Buildings of Napier, New Zealand
1
Seismic Considerations for the Art Deco Interwar Reinforced Concrete Buildings of
Napier, New Zealand
Kevin Q Walsh, Kenneth J Elwood, and Jason M Ingham
Department of Civil and Environmental Engineering, University of Auckland
February 2015
This report is being provided to the Napier Art Deco Trust and other interested parties with the
understanding that it may be disseminated freely by the recipients. A different version of this report
has been published as follows:
Walsh, K., Elwood, K., and Ingham, J. (2014). "Seismic Considerations for the Art Deco Interwar
Reinforced-Concrete Buildings of Napier, New Zealand." Nat. Hazards Rev.,
10.1061/(ASCE)NH.1527-6996.0000169, 04014035.
Seismic Considerations for the Art Deco Interwar Reinforced Concrete Buildings of Napier, New Zealand
2
ABSTRACT
Following the devastating 1931 Hawke’s Bay earthquake, buildings in Napier and surrounding areas
in the Hawke’s Bay region were rebuilt in a comparatively homogenous structural and architectural
style comprising the region’s famous Art Deco stock. These interwar buildings are most often
composed of reinforced concrete two-way space frames, and although they have comparatively
ductile detailing for their date of construction, are often expected to be brittle, earthquake-prone
buildings in preliminary seismic assessments. Furthermore, the likelihood of global collapse of an RC
building during a design-level earthquake became an issue warranting particular attention following
the collapse of multiple RC buildings in the February 22, 2011 Christchurch earthquake. Those who
value the architectural heritage and future use of these iconic Art Deco buildings—including building
owners, tenants, and city officials, among others—must consider how they can be best preserved
and utilized functionally given the especially pressing implications of relevant safety, regulatory, and
economic factors. This study was intended to provide information on the seismic hazard, geometric
weaknesses, collapse hazards, material properties, structural detailing, empirically based
vulnerability, and recommended analysis approaches particular to Art Deco buildings in Hawke’s Bay
as a resource for professional structural engineers tasked with seismic assessments and retrofit
designs for these buildings. The observed satisfactory performance of similar low-rise, ostensibly
brittle RC buildings in other earthquakes and the examination of the structural redundancy and
expected column drift capacities in these buildings, led to the conclusion that the seismic capacity of
these buildings is generally underrated in simple, force-based assessments.
KEYWORDS
Reinforced concrete; Art Deco; Napier; Earthquake; Hawke’s Bay; Initial evaluation procedure,
Nonductile.
INTRODUCTION
Early RC buildings are an important part of the architectural heritage of relatively young countries
like New Zealand that historically had limited access to structural iron and steel. Despite having been
constructed within the past century, the famous RC Art Deco buildings in Hawke’s Bay, New Zealand,
represent a critical stock of architectural heritage for a country that has a proud history of structural
engineering with RC and of exhibiting resilience to natural disasters. All nonresidential buildings
constructed in Napier during the interwar period (i.e., 1920–1940) and remaining today are
considered part of Napier’s Art Deco building stock, regardless of actual architectural style; although
most of these buildings have some elements of the Art Deco aesthetic. Art Deco was an architectural
style popularized during the 1920s and 1930s, defined by opulent colors and discrete, rectilinear
geometric shapes (McGregor 1998). In the city of Napier alone, 140 Art Deco nonresidential
buildings existed at the end of 2012 (McGregor 2012) with at least 58 of these buildings registered
with the New Zealand Historic Places Trust (NZHPT) (2012) and at least 123 Art Deco buildings
included on local registries for historic preservation (City of Napier 2001, 2011). Furthermore, in the
nearby city of Hastings, more than 150 nonresidential buildings—at least 90 constructed of RC—
have been identified as having been constructed in a similar time period (G. Lethbridge, unpublished
internal report, September 30, 2013).
Tourism stemming largely from Napier’s Art Deco attractions contributes greatly to the Hawke’s Bay
region’s revenue (Stewart 2009), and Napier’s Art Deco buildings are of immense value to the
Seismic Considerations for the Art Deco Interwar Reinforced Concrete Buildings of Napier, New Zealand
3
cultural and civic heritage of the Hawke’s Bay community. However, a lack of understanding of the
expected performance of these buildings in an earthquake threatens their continued utility. Past
engineering assessments of these ostensibly brittle RC low-rise buildings have predicted generally
poor seismic performance (e.g., van de Vorstenbosch et al. 2002), contrary to the empirical evidence
from the 1931 Hawke’s Bay earthquake (Mitchell 1931; Brodie and Harris 1933) and empirical
evidence from other historical earthquakes in New Zealand (Dowrick and Rhoades 2000). These
buildings are now threatened with forced vacancy or demolition by legislation (New Zealand
Parliament 2004) dependent on their estimated seismic capacities. As a result, other researchers
have called for more sophisticated studies into the seismic capacities of Art Deco buildings in
Hawke’s Bay (Dowrick 2006).
RESEARCH MOTIVATION
As noted, simplified seismic assessment methods, such as qualitative, preliminary procedures
recommended by the New Zealand Society for Earthquake Engineering (NZSEE 2006) or even
equivalent static analyses, may lead to distinct underestimation of the likely seismic performance of
many of Hawke’s Bay’s Art Deco buildings. Because of the high costs and lead times associated with
commissioning quantitative finite-element model-based detailed seismic assessments for every Art
Deco building in the region, a study undertaken to demonstrate that widespread typological and
geometric surveys of the region’s Art Deco building stock would provide the following advantages:
1. Immediate guidance to local officials responsible for mitigating the impacts of regional
hazards and to Art Deco building owners and occupants on the general seismic risk
associated with these buildings: Understanding the typological characteristics of these
buildings and the type and extent of damage observed in similar buildings damaged by
earthquakes elsewhere can help communities better understand their resilience to major
earthquakes and help them prepare for losses in service, even if life-safety is not
compromised;
2. Guidance to engineers on what vulnerabilities, geometries, material strengths, and
reinforcement detailing have been identified within the building stock so as to improve the
accuracy and consistency of detailed models and reporting from practitioners;
3. Guidance for subsequent finite-element model-based detailed seismic assessments of
prototypical Art Deco buildings such that the results can be provisionally extrapolated to a
large proportion of Art Deco buildings in the region and provide consulting engineers
assessing individual buildings with a reference point for comparison; and
4. Demonstrate the utility of typological investigations for assessments of presumably
vulnerable, heritage building stocks.
REGIONAL SEISMICITY AND SEISMIC DESIGN REQUIREMENTS
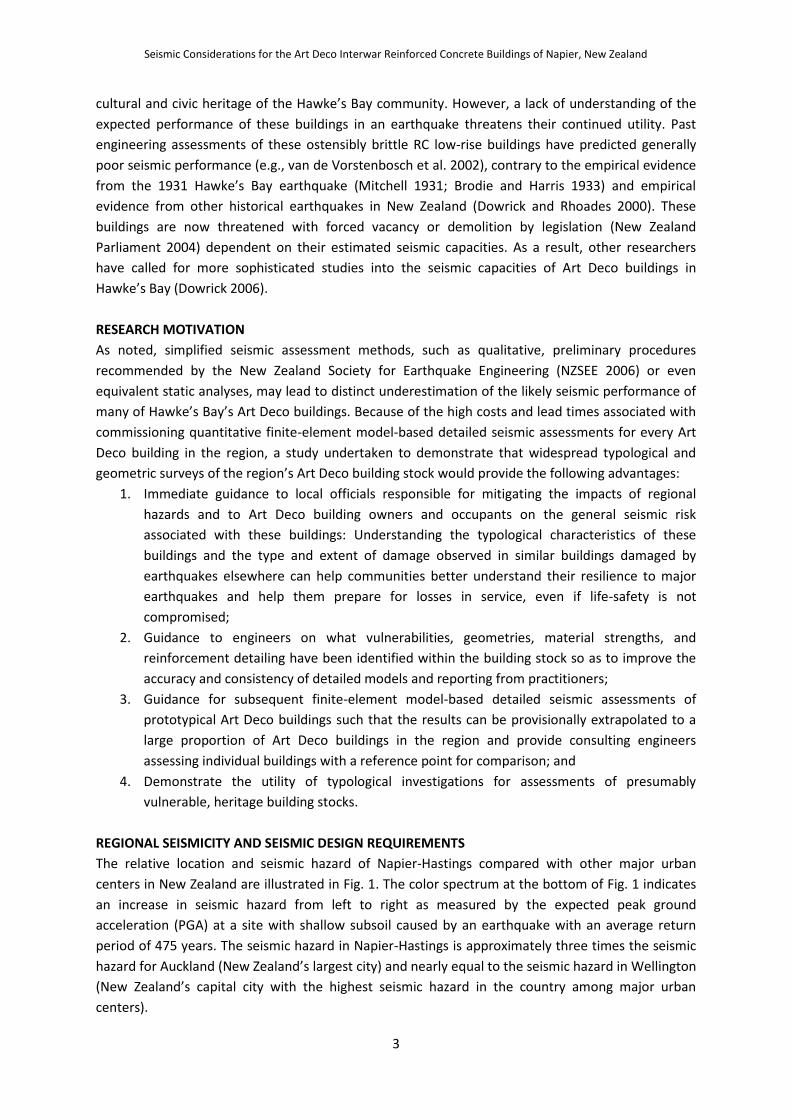
The relative location and seismic hazard of Napier-Hastings compared with other major urban
centers in New Zealand are illustrated in Fig. 1. The color spectrum at the bottom of Fig. 1 indicates
an increase in seismic hazard from left to right as measured by the expected peak ground
acceleration (PGA) at a site with shallow subsoil caused by an earthquake with an average return
period of 475 years. The seismic hazard in Napier-Hastings is approximately three times the seismic
hazard for Auckland (New Zealand’s largest city) and nearly equal to the seismic hazard in Wellington
(New Zealand’s capital city with the highest seismic hazard in the country among major urban
centers).
Seismic Considerations for the Art Deco Interwar Reinforced Concrete Buildings of Napier, New Zealand
4
Fig. 1. Referenced New Zealand cities superimposed on seismic
hazard map (adopted from Stirling et al. 2012)
Design requirements in New Zealand [Standards New Zealand (NZS) 2002] prescribe that buildings
subjected to design basis earthquake (DBE) actions be designed for “avoidance of collapse of the
structural system… or parts of the structure… representing a hazard to human life inside and outside
the structure… [and] avoidance of damage to non-structural systems necessary for… evacuation.” In
accordance with the seismic assessment guidelines published by NZSEE (2006), the emphasized
performance level considered in the assessments discussed in this paper is the ultimate limit state
(ULS), which is theoretically equivalent to the life safety (LS) performance level considered in ASCE
41-13 (ASCE 2014).
TYPOLOGICAL STUDY OF NAPIER’S EXISTING ART DECO BUILDINGS
Due to the confined time period in which so many of the Art Deco buildings in Napier’s city center
were constructed, the structural and architectural styling is distinctively consistent. Although not all
of the Napier Art Deco buildings are formally or completely Art Deco in style, as Spanish Mission,
Stripped Classical, Chicago School, Prairie School, Art Noveau, Beaux Arts, and other architectural
styles are distributed among the building population in Napier (McGregor 2012), the term Art Deco
buildings is commonly used to refer to all of the nonresidential interwar (i.e., 1920–1940) buildings
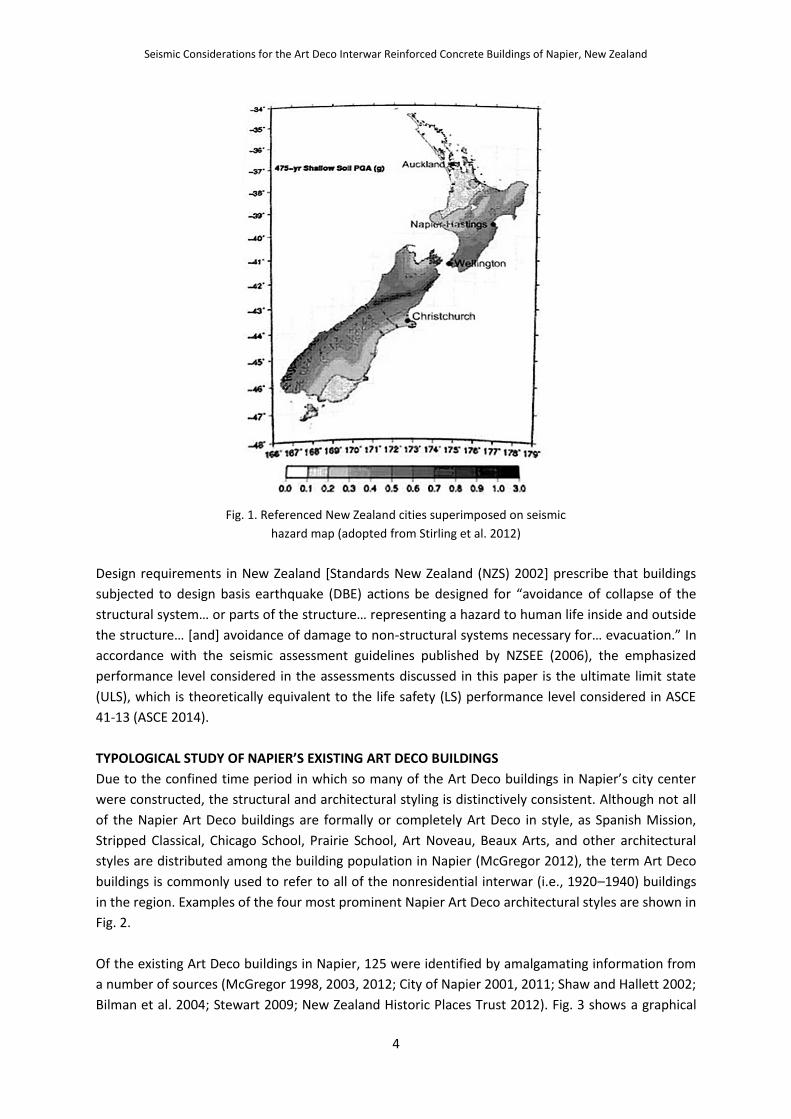
in the region. Examples of the four most prominent Napier Art Deco architectural styles are shown in
Fig. 2.
Of the existing Art Deco buildings in Napier, 125 were identified by amalgamating information from
a number of sources (McGregor 1998, 2003, 2012; City of Napier 2001, 2011; Shaw and Hallett 2002;
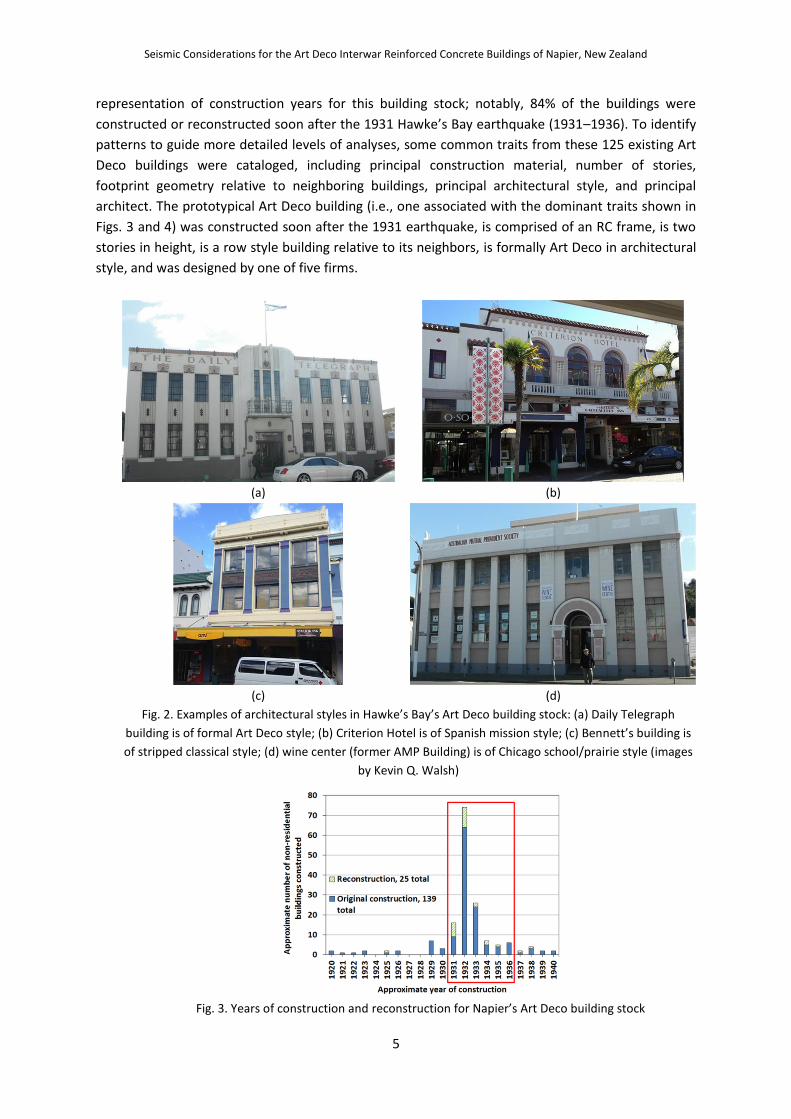
Bilman et al. 2004; Stewart 2009; New Zealand Historic Places Trust 2012). Fig. 3 shows a graphical
Seismic Considerations for the Art Deco Interwar Reinforced Concrete Buildings of Napier, New Zealand
5
representation of construction years for this building stock; notably, 84% of the buildings were
constructed or reconstructed soon after the 1931 Hawke’s Bay earthquake (1931–1936). To identify
patterns to guide more detailed levels of analyses, some common traits from these 125 existing Art
Deco buildings were cataloged, including principal construction material, number of stories,
footprint geometry relative to neighboring buildings, principal architectural style, and principal
architect. The prototypical Art Deco building (i.e., one associated with the dominant traits shown in
Figs. 3 and 4) was constructed soon after the 1931 earthquake, is comprised of an RC frame, is two
stories in height, is a row style building relative to its neighbors, is formally Art Deco in architectural
style, and was designed by one of five firms.
(a) (b)
(c) (d)
Fig. 2. Examples of architectural styles in Hawke’s Bay’s Art Deco building stock: (a) Daily Telegraph
building is of formal Art Deco style; (b) Criterion Hotel is of Spanish mission style; (c) Bennett’s building is
of stripped classical style; (d) wine center (former AMP Building) is of Chicago school/prairie style (images
by Kevin Q. Walsh)
Fig. 3. Years of construction and reconstruction for Napier’s Art Deco building stock
Seismic Considerations for the Art Deco Interwar Reinforced Concrete Buildings of Napier, New Zealand
6
The literary sources used to collect data on the Art deco building stock of Napier were rarely specific
about whether walls or frames were constructed. However, based on knowledge of architectural
preferences in New Zealand at the time and the researchers’ observations from a more detailed
investigation of seven representative buildings (to be discussed further in a subsequent section), it
appears that at least 90% of the buildings identified in this stock were mostly constructed of RC and
were built primarily as two-way space moment-resisting frames (i.e., regular column spacing on both
the perimeter and interior, often with beams running in both orthogonal directions). RC shear walls
are also present in some buildings (van de Vorstenbosch et al. 2002). RC slabs (cast contiguously
with the RC frames) appear to dominate the stock’s structural diaphragms, although there appears
to be some notable variation in roof diaphragm construction (timber, concrete, and corrugated
galvanized iron) as well as the inclusion of steel framing (partial framing, retrofitting, or composite
with concrete) supplementary to the RC framing in some buildings.
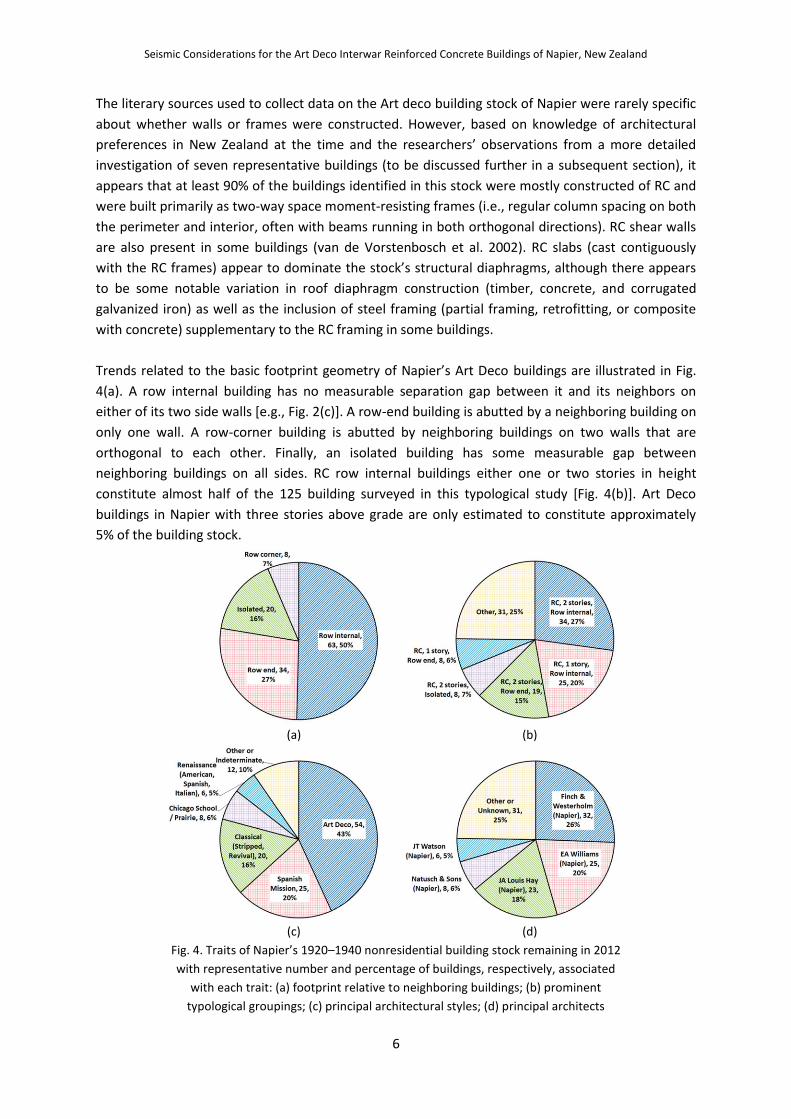
Trends related to the basic footprint geometry of Napier’s Art Deco buildings are illustrated in Fig.
4(a). A row internal building has no measurable separation gap between it and its neighbors on
either of its two side walls [e.g., Fig. 2(c)]. A row-end building is abutted by a neighboring building on
only one wall. A row-corner building is abutted by neighboring buildings on two walls that are
orthogonal to each other. Finally, an isolated building has some measurable gap between
neighboring buildings on all sides. RC row internal buildings either one or two stories in height
constitute almost half of the 125 building surveyed in this typological study [Fig. 4(b)]. Art Deco
buildings in Napier with three stories above grade are only estimated to constitute approximately
5% of the building stock.
(a) (b)
(c) (d)
Fig. 4. Traits of Napier’s 1920–1940 nonresidential building stock remaining in 2012
with representative number and percentage of buildings, respectively, associated
with each trait: (a) footprint relative to neighboring buildings; (b) prominent
typological groupings; (c) principal architectural styles; (d) principal architects
Seismic Considerations for the Art Deco Interwar Reinforced Concrete Buildings of Napier, New Zealand
7
Architects in Hawke’s Bay during the interwar period usually produced both the architectural and
structural drawings. These architects often replicated numerous plan details for reconstructed
Napier Art Deco buildings to produce the plans quickly enough for post-disaster building
reconstruction, often resulting in similar or identical column geometry and detailing being
implemented in buildings designed by the same architect. Hence, the identification of the style and
architect [Figs. 4(c and d)] is important for the typological structural assessments exercise; buildings
of similar architectural styles or designed by the same architect are considered much more likely to
share structural similarities, and they may also share common falling hazards such as high parapets
or exterior ornamentation.
GEOMETRIC STUDY OF NAPIER’S EXISTING ART DECO BUILDINGS
A field investigation was undertaken to document geometric measurements, irregularities, and other
observations of building exteriors for 109 Art Deco buildings in Napier (constituting 78% of the
estimated 140 Napier Art Deco buildings still existing as of 2012). Most buildings had only one visible
or accessible wall (in accordance with the prominence of row buildings in the stock). Nonetheless,
surveys were able to be made of multiple side walls on some buildings, resulting in 139 total building
sides being surveyed from the 109 buildings.
Geometric irregularities
The 109 buildings investigated in the geometric study were assessed for potential critical structural
weaknesses (NZSEE 2006) resulting primarily from geometric irregularities. The Napier Art Deco
building stock is generally comprised of rectangular and regularly configured buildings, such that
severe geometric and configuration irregularities are not commonplace. In accordance with the
criteria associated with the NZSEE (2006) initial evaluation procedure (IEP), fewer than 5% of all
buildings surveyed were determined to have potential plan or vertical irregularities (expected to
cause significantly detrimental eccentric deformations when subjected to lateral load) or potentially
shortened columns (expected to result in brittle column behavior). Due to the density of the built
environment in the Napier City Center, the most significant potential structural weakness identified
in the building stock was the potential for pounding (the phenomenon of neighboring buildings
impacting each other off-phase and/or at offset story heights when subjected to seismic forces).
Unlike with more historical unreinforced masonry (URM) row construction in New Zealand, where
neighboring buildings often shared load-bearing walls, it appears that most Art Deco buildings were
constructed with separate load-bearing exterior frames (i.e., isolated column lines) between
neighboring buildings, such that the buildings are expected to oscillate independently during an
earthquake aside from pounding restraints. NZSEE (2006) instructs engineers carrying out the IEP to
reduce the estimated capacity for a building by at least 30% if the separation gap between two
buildings is less than 1/200 of the building height. The percentage of Napier Art Deco buildings
judged to have at least one wall with less separation from the neighboring building than 1/200 of the
building height is 84% [all cases in Fig. 4(a) besides isolated]. However, the prescribed strength
reduction in the IEP associated with pounding potential is likely to be conservative for most buildings
owing to the qualitative and provisional nature of the procedure. From the geometric survey, it was
determined that only 12% of Napier Art Deco buildings had elevated potential for pounding because
of excessive height differences and/or offset story alignment between neighboring buildings. Severe
pounding potential is most common in situations in which an Art Deco building neighbors a more
modern building, and it is a critical aspect when considering the expected damage level and collapse
Seismic Considerations for the Art Deco Interwar Reinforced Concrete Buildings of Napier, New Zealand
8
potential of select buildings in earthquakes, as observed in the 2011 Christchurch earthquake (Cole
et al. 2012).
Non-structural life-safety hazards
In many cases the most significant hazards to people during an earthquake may not be the failures
of load-bearing structural elements but rather the collapse of nonstructural parts and components.
Although Napier’s Art Deco building stock has few tall chimneys and gable end walls, slender RC
parapets and unreinforced masonry infill walls are prominent. These components can be especially
dangerous to pedestrians just outside a building (Ingham and Griffith 2011; Cooper et al. 2012).
Approximately 30% of buildings surveyed in the geometric study had parapets. The average parapet
height above the roof diaphragm was 1.4 m, and the average parapet length between building
corners or other return walls was 11.9 m (the average parapet length is indicative of the average Art
Deco building plan dimension parallel to the street based on typical construction practices).
Information pertaining to parapet thickness and steel reinforcement detailing was not able to be
procured during the geometric survey. However, intrusive investigations were performed separately
on the parapets of two Art Deco buildings, with one each located in Hastings and Napier. The Art
Deco building in Hastings had parapet heights ranging from 0.79 m along the backside of the building
to 2.03 m at the prominent corners of the building on the street front. The parapet was consistently
0.30 m thick with one reinforcement layer of 12.7-mm-diameter round steel bars spaced at
approximately 0.60 m both horizontally and vertically. Atop a three-story building, the tallest
sections of the parapet were assessed as having a capacity less than 20% of the ULS demands. The
Art Deco building in Napier had parapet heights ranging from 0.92 m along the backside of the
building to 1.80 m along the street front. The parapet was consistently 0.15 m thick with one
reinforcement layer of 12.7-mm-diameter round steel bars spaced at approximately 0.30 m both
horizontally and vertically. Also atop a three-story building, the tallest sections of the parapet were
assessed as having a capacity less than 50% of the ULS demands. Investigations utilizing intrusive or
scanning methods are often needed to assess parapets in these building because it is often unclear
from the available plans whether appropriate anchorage to the frames below were provided for the
tall parapet walls on the buildings inspected in Hawke’s Bay.
Of the 150 contemporary nonresidential buildings identified in Hastings, at least 40% were identified
as having clay brick URM infill panels (G. Lethbridge, unpublished internal report, 2013). In Napier,
many of the perimeter frames surveyed as part of the Napier Art Deco geometric study were infilled
with either RC or clay-fired brick URM in addition to containing portal openings for doors and
windows [Fig. 5(a)]. Although not always apparent because of architectural plaster and
ornamentation, it appeared that approximately 50% of the 109 buildings surveyed had some
perimeter frames at least partially infilled with URM. Of those buildings identified as having URM
infill, approximately 70% were identified as having URM infill panels with cavities, or air gaps,
separating two single wythes of brick [each wythe being approximately 0.11 m thick as shown in Fig.
5(b)]. Based on a limited number of intrusive inspections, URM cavity infill wall wythes were usually
observed to be tied together by 4-mm-diameter Warrington steel wire cavity ties twisted in a figure-
eight configuration, which were generally spaced at 4–5 brick lengths horizontally by 4–5 bricks
heights vertically in a staggered arrangement. One URM cavity infill wall panel tested in a
contemporary building in Hastings in a vertically spanning condition was empirically determined to
Seismic Considerations for the Art Deco Interwar Reinforced Concrete Buildings of Napier, New Zealand
9
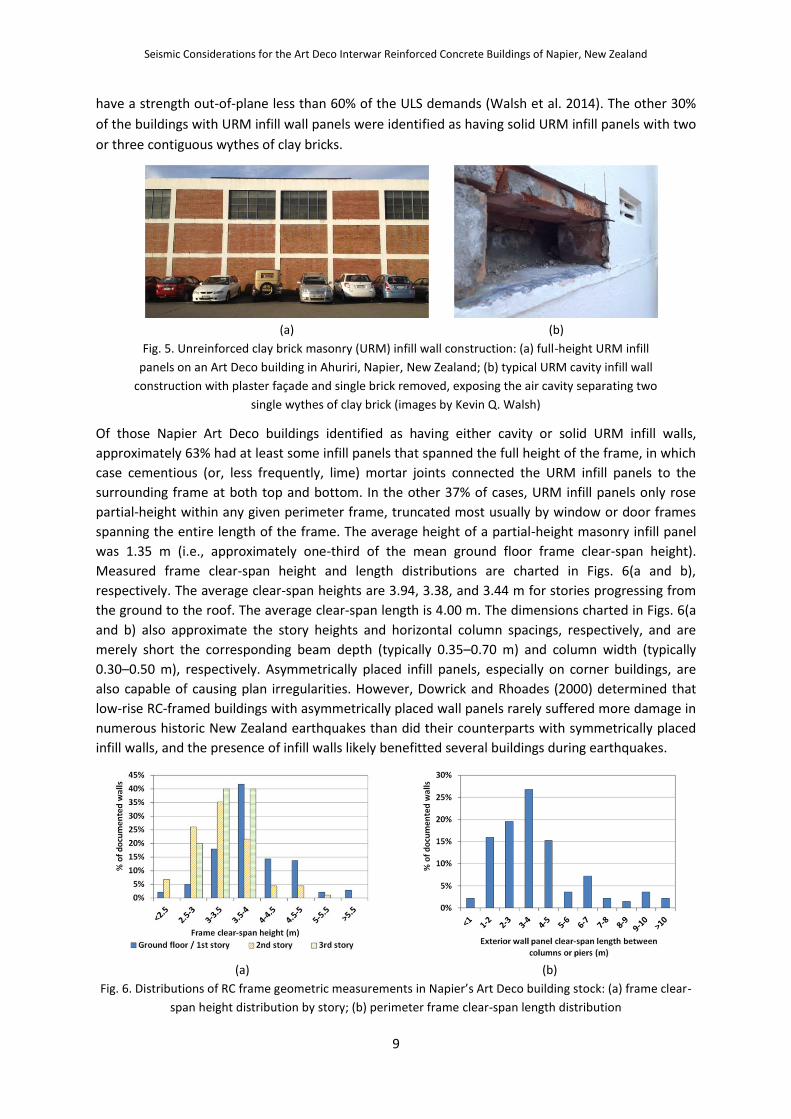
have a strength out-of-plane less than 60% of the ULS demands (Walsh et al. 2014). The other 30%
of the buildings with URM infill wall panels were identified as having solid URM infill panels with two
or three contiguous wythes of clay bricks.
(a) (b)
Fig. 5. Unreinforced clay brick masonry (URM) infill wall construction: (a) full-height URM infill
panels on an Art Deco building in Ahuriri, Napier, New Zealand; (b) typical URM cavity infill wall
construction with plaster façade and single brick removed, exposing the air cavity separating two
single wythes of clay brick (images by Kevin Q. Walsh)
Of those Napier Art Deco buildings identified as having either cavity or solid URM infill walls,
approximately 63% had at least some infill panels that spanned the full height of the frame, in which
case cementious (or, less frequently, lime) mortar joints connected the URM infill panels to the
surrounding frame at both top and bottom. In the other 37% of cases, URM infill panels only rose
partial-height within any given perimeter frame, truncated most usually by window or door frames
spanning the entire length of the frame. The average height of a partial-height masonry infill panel
was 1.35 m (i.e., approximately one-third of the mean ground floor frame clear-span height).
Measured frame clear-span height and length distributions are charted in Figs. 6(a and b),
respectively. The average clear-span heights are 3.94, 3.38, and 3.44 m for stories progressing from
the ground to the roof. The average clear-span length is 4.00 m. The dimensions charted in Figs. 6(a
and b) also approximate the story heights and horizontal column spacings, respectively, and are
merely short the corresponding beam depth (typically 0.35–0.70 m) and column width (typically
0.30–0.50 m), respectively. Asymmetrically placed infill panels, especially on corner buildings, are
also capable of causing plan irregularities. However, Dowrick and Rhoades (2000) determined that
low-rise RC-framed buildings with asymmetrically placed wall panels rarely suffered more damage in
numerous historic New Zealand earthquakes than did their counterparts with symmetrically placed
infill walls, and the presence of infill walls likely benefitted several buildings during earthquakes.
(a) (b)
Fig. 6. Distributions of RC frame geometric measurements in Napier’s Art Deco building stock: (a) frame clear-
span height distribution by story; (b) perimeter frame clear-span length distribution
Seismic Considerations for the Art Deco Interwar Reinforced Concrete Buildings of Napier, New Zealand
10
MATERIAL PROPERTIES
Engineers performing detailed seismic assessments of interwar RC structures in New Zealand and
elsewhere can derive more accurate, less conservative results when enhanced knowledge of
expected material properties is available. Chapman (1991) provided sampling data of steel
reinforcement extracted from New Zealand highway bridges, which is referenced by both NZSEE
(2006) and Transit New Zealand (now called the NZ Transport Agency) (TNZ 2004) in regard to
expected steel reinforcement material properties. However, because of the lack of historic data
regarding steel reinforcement in historic buildings in New Zealand, NZSEE (2006) emphasizes that
“whenever practicable, samples of steel [reinforcement] from the structure [being considered for
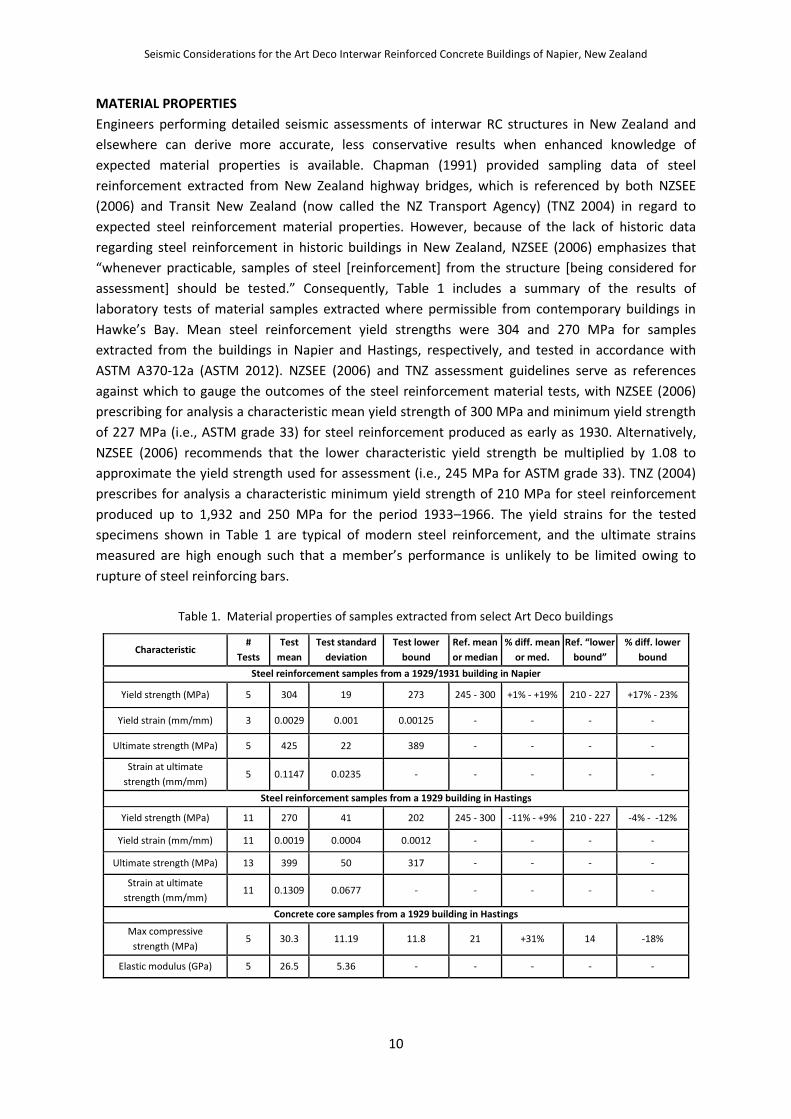
assessment] should be tested.” Consequently, Table 1 includes a summary of the results of
laboratory tests of material samples extracted where permissible from contemporary buildings in
Hawke’s Bay. Mean steel reinforcement yield strengths were 304 and 270 MPa for samples
extracted from the buildings in Napier and Hastings, respectively, and tested in accordance with
ASTM A370-12a (ASTM 2012). NZSEE (2006) and TNZ assessment guidelines serve as references
against which to gauge the outcomes of the steel reinforcement material tests, with NZSEE (2006)
prescribing for analysis a characteristic mean yield strength of 300 MPa and minimum yield strength
of 227 MPa (i.e., ASTM grade 33) for steel reinforcement produced as early as 1930. Alternatively,
NZSEE (2006) recommends that the lower characteristic yield strength be multiplied by 1.08 to
approximate the yield strength used for assessment (i.e., 245 MPa for ASTM grade 33). TNZ (2004)
prescribes for analysis a characteristic minimum yield strength of 210 MPa for steel reinforcement
produced up to 1,932 and 250 MPa for the period 1933–1966. The yield strains for the tested
specimens shown in Table 1 are typical of modern steel reinforcement, and the ultimate strains
measured are high enough such that a member’s performance is unlikely to be limited owing to
rupture of steel reinforcing bars.
Table 1. Material properties of samples extracted from select Art Deco buildings
Characteristic #
Tests
Test
mean
Test standard
deviation
Test lower
bound
Ref. mean
or median
% diff. mean
or med.
Ref. “lower
bound”
% diff. lower
bound
Steel reinforcement samples from a 1929/1931 building in Napier
Yield strength (MPa) 5 304 19 273 245 - 300 +1% - +19% 210 - 227 +17% - 23%
Yield strain (mm/mm) 3 0.0029 0.001 0.00125 - - - -
Ultimate strength (MPa) 5 425 22 389 - - - -
Strain at ultimate
strength (mm/mm) 5 0.1147 0.0235 - - - - -
Steel reinforcement samples from a 1929 building in Hastings
Yield strength (MPa) 11 270 41 202 245 - 300 -11% - +9% 210 - 227 -4% - -12%
Yield strain (mm/mm) 11 0.0019 0.0004 0.0012 - - - -
Ultimate strength (MPa) 13 399 50 317 - - - -
Strain at ultimate
strength (mm/mm) 11 0.1309 0.0677 - - - - -
Concrete core samples from a 1929 building in Hastings
Max compressive
strength (MPa) 5 30.3 11.19 11.8 21 +31% 14 -18%
Elastic modulus (GPa) 5 26.5 5.36 - - - - -
Seismic Considerations for the Art Deco Interwar Reinforced Concrete Buildings of Napier, New Zealand
11
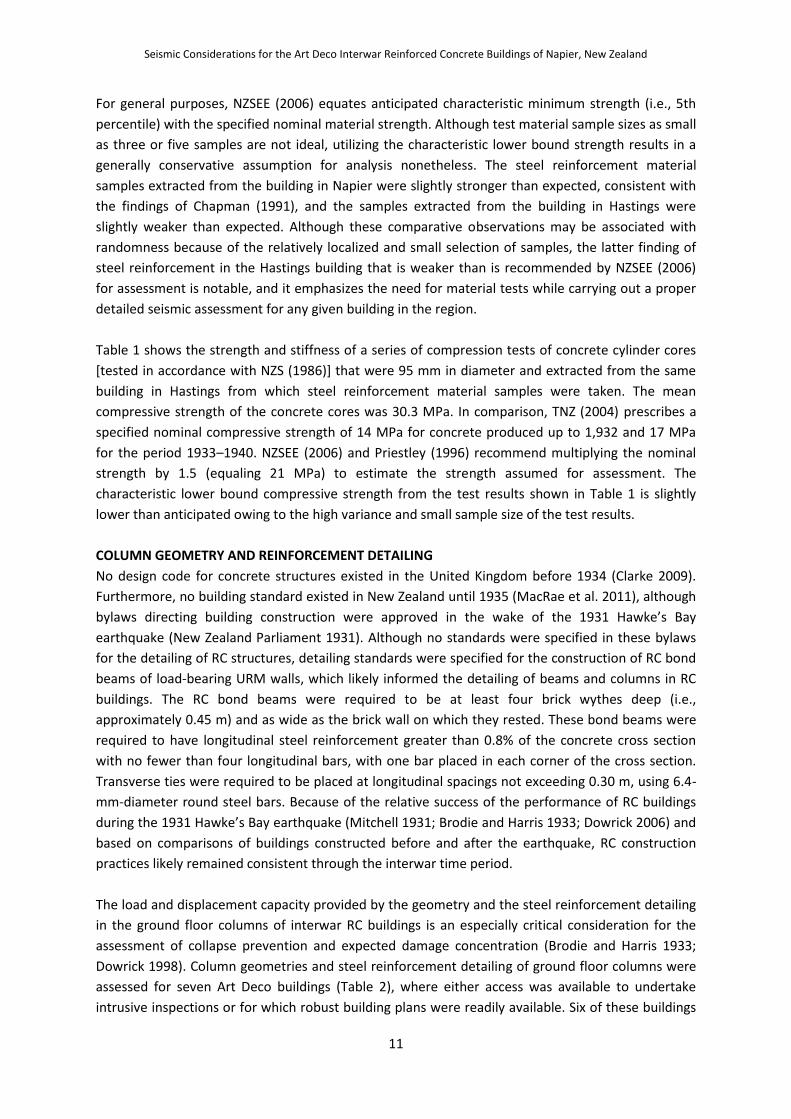
For general purposes, NZSEE (2006) equates anticipated characteristic minimum strength (i.e., 5th
percentile) with the specified nominal material strength. Although test material sample sizes as small
as three or five samples are not ideal, utilizing the characteristic lower bound strength results in a
generally conservative assumption for analysis nonetheless. The steel reinforcement material
samples extracted from the building in Napier were slightly stronger than expected, consistent with
the findings of Chapman (1991), and the samples extracted from the building in Hastings were
slightly weaker than expected. Although these comparative observations may be associated with
randomness because of the relatively localized and small selection of samples, the latter finding of
steel reinforcement in the Hastings building that is weaker than is recommended by NZSEE (2006)
for assessment is notable, and it emphasizes the need for material tests while carrying out a proper
detailed seismic assessment for any given building in the region.
Table 1 shows the strength and stiffness of a series of compression tests of concrete cylinder cores
[tested in accordance with NZS (1986)] that were 95 mm in diameter and extracted from the same
building in Hastings from which steel reinforcement material samples were taken. The mean
compressive strength of the concrete cores was 30.3 MPa. In comparison, TNZ (2004) prescribes a
specified nominal compressive strength of 14 MPa for concrete produced up to 1,932 and 17 MPa
for the period 1933–1940. NZSEE (2006) and Priestley (1996) recommend multiplying the nominal
strength by 1.5 (equaling 21 MPa) to estimate the strength assumed for assessment. The
characteristic lower bound compressive strength from the test results shown in Table 1 is slightly
lower than anticipated owing to the high variance and small sample size of the test results.
COLUMN GEOMETRY AND REINFORCEMENT DETAILING
No design code for concrete structures existed in the United Kingdom before 1934 (Clarke 2009).
Furthermore, no building standard existed in New Zealand until 1935 (MacRae et al. 2011), although
bylaws directing building construction were approved in the wake of the 1931 Hawke’s Bay
earthquake (New Zealand Parliament 1931). Although no standards were specified in these bylaws
for the detailing of RC structures, detailing standards were specified for the construction of RC bond
beams of load-bearing URM walls, which likely informed the detailing of beams and columns in RC
buildings. The RC bond beams were required to be at least four brick wythes deep (i.e.,
approximately 0.45 m) and as wide as the brick wall on which they rested. These bond beams were
required to have longitudinal steel reinforcement greater than 0.8% of the concrete cross section
with no fewer than four longitudinal bars, with one bar placed in each corner of the cross section.
Transverse ties were required to be placed at longitudinal spacings not exceeding 0.30 m, using 6.4-
mm-diameter round steel bars. Because of the relative success of the performance of RC buildings
during the 1931 Hawke’s Bay earthquake (Mitchell 1931; Brodie and Harris 1933; Dowrick 2006) and
based on comparisons of buildings constructed before and after the earthquake, RC construction
practices likely remained consistent through the interwar time period.
The load and displacement capacity provided by the geometry and the steel reinforcement detailing
in the ground floor columns of interwar RC buildings is an especially critical consideration for the
assessment of collapse prevention and expected damage concentration (Brodie and Harris 1933;
Dowrick 1998). Column geometries and steel reinforcement detailing of ground floor columns were
assessed for seven Art Deco buildings (Table 2), where either access was available to undertake
intrusive inspections or for which robust building plans were readily available. Six of these buildings
Seismic Considerations for the Art Deco Interwar Reinforced Concrete Buildings of Napier, New Zealand
12
were constructed (or reconstructed) in either 1931 or 1932, and the seventh was constructed in
1929 and survived the 1931 earthquake with minimal damage. The structural systems represented
by these seven buildings include two-way RC frame (six buildings) and RC frame with RC shear walls
(one building). The architects for six of these buildings are among the four most prominent
architects shown in Fig. 4(d). Although these seven buildings represent a relatively small sample size,
the traits of these buildings (i.e., age of construction, structural system, number of stories above
grade, and architect) were appropriately representative of the most common traits found across the
larger Art Deco building stock (Figs. 3 and 4).
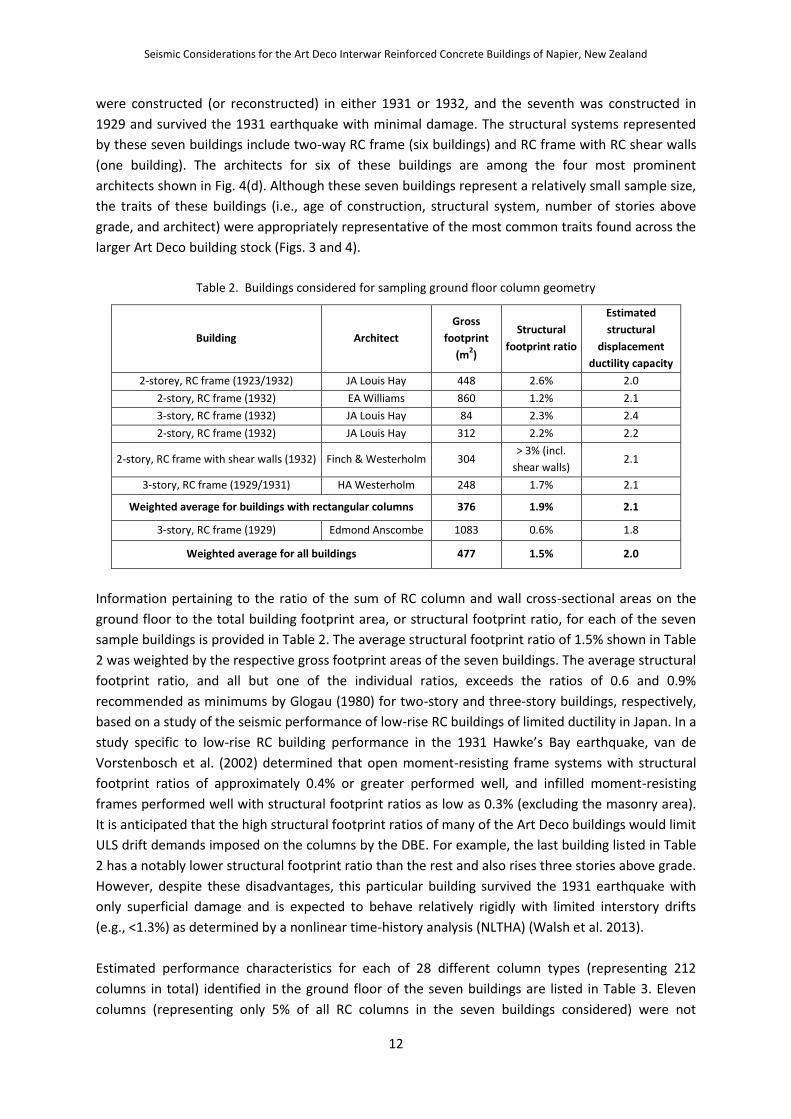
Table 2. Buildings considered for sampling ground floor column geometry
Building Architect
Gross
footprint
(m2)
Structural
footprint ratio
Estimated
structural
displacement
ductility capacity
2-storey, RC frame (1923/1932) JA Louis Hay 448 2.6% 2.0
2-story, RC frame (1932) EA Williams 860 1.2% 2.1
3-story, RC frame (1932) JA Louis Hay 84 2.3% 2.4
2-story, RC frame (1932) JA Louis Hay 312 2.2% 2.2
2-story, RC frame with shear walls (1932) Finch & Westerholm 304 > 3% (incl.
shear walls) 2.1
3-story, RC frame (1929/1931) HA Westerholm 248 1.7% 2.1
Weighted average for buildings with rectangular columns 376 1.9% 2.1
3-story, RC frame (1929) Edmond Anscombe 1083 0.6% 1.8
Weighted average for all buildings 477 1.5% 2.0
Information pertaining to the ratio of the sum of RC column and wall cross-sectional areas on the
ground floor to the total building footprint area, or structural footprint ratio, for each of the seven
sample buildings is provided in Table 2. The average structural footprint ratio of 1.5% shown in Table
2 was weighted by the respective gross footprint areas of the seven buildings. The average structural
footprint ratio, and all but one of the individual ratios, exceeds the ratios of 0.6 and 0.9%
recommended as minimums by Glogau (1980) for two-story and three-story buildings, respectively,
based on a study of the seismic performance of low-rise RC buildings of limited ductility in Japan. In a
study specific to low-rise RC building performance in the 1931 Hawke’s Bay earthquake, van de
Vorstenbosch et al. (2002) determined that open moment-resisting frame systems with structural
footprint ratios of approximately 0.4% or greater performed well, and infilled moment-resisting
frames performed well with structural footprint ratios as low as 0.3% (excluding the masonry area).
It is anticipated that the high structural footprint ratios of many of the Art Deco buildings would limit
ULS drift demands imposed on the columns by the DBE. For example, the last building listed in Table
2 has a notably lower structural footprint ratio than the rest and also rises three stories above grade.
However, despite these disadvantages, this particular building survived the 1931 earthquake with
only superficial damage and is expected to behave relatively rigidly with limited interstory drifts
(e.g., <1.3%) as determined by a nonlinear time-history analysis (NLTHA) (Walsh et al. 2013).
Estimated performance characteristics for each of 28 different column types (representing 212
columns in total) identified in the ground floor of the seven buildings are listed in Table 3. Eleven
columns (representing only 5% of all RC columns in the seven buildings considered) were not
Seismic Considerations for the Art Deco Interwar Reinforced Concrete Buildings of Napier, New Zealand
13
included in Table 3 because of their odd shapes and difficulty of assessing in a manner consistent
with the 212 columns that were evaluated. Average values listed at the bottom of Table 3 were
weighted by the number of columns of each type and are considered for two groupings of buildings:
(1) the six prototypical buildings with rectangular columns and higher structural footprint ratios; and
(2) for all seven buildings, including the less prototypical building with circular columns and a
relatively low structural footprint ratio. For buildings in which material test results were not
available, mean concrete ultimate compressive strength was assumed to be 21 MPa, and the mean
steel reinforcement yield strength was assumed to be 245 MPa. Concrete clear cover thickness was
assumed to be 40 mm when not called out on the plans. The 212 RC columns identified from among
the seven buildings were all identified as having a longitudinal reinforcement cross-sectional area
greater than 0.8% of the gross column cross-sectional area. Where it was possible to identify visually
or in plan sets, all transverse reinforcement hoops were deemed to have hooks greater than or
equal to 135 degrees, or to consist of spiral reinforcement. The other most critical consideration for
column ductility is the detailing of transverse reinforcement in terms of spacing (s or s / h in Table 3)
and cross-sectional area (ρs in Table 3). Over half of the columns assessed (by total number rather
than by type) have a transverse reinforcement spacing ratio, s / h , (weighted average of 0.44)
complying with the relevant criterion necessary to be classified as likely to fail in flexure (i.e., less
than or equal to 0.50) according to ASCE 41-13 (ASCE 2014). Conversely, fewer than half the columns
assessed have a transverse reinforcement ratio, ρs , (weighted average of 0.18%) complying with the
relevant criterion necessary to be classified as likely to fail in flexure (i.e., ρs greater than or equal to
0.20%) according to ASCE 41-13. The outstanding factor in the estimation of failure condition
according to the criteria of ASCE (2014) is the ratio of the estimated shear force corresponding to the
maximum moment capacity of the column and the estimated shear capacity of the column degraded
accordingly to account for flexural ductility demand (values for Vp / Vn in Table 3) using the method
proposed by Sezen and Moehle (2004). The expected failure condition as determined by the criteria
of ASCE (2014) for each column type is listed in the last column of Table 3. Results from tests of
similarly detailed columns with smooth reinforcement have shown that the ASCE 41-13 (ASCE 2014)
criteria are generally conservative (Ricci et al. 2013).
The estimated curvature ductility capacity (μφ) for each column type as listed in Table 3 was
determined using the empirically based equations from Priestley (1998). The weighted average
curvature ductility capacity for all columns considered is 26.4. This value is nearly equal to the
conservative upper limit of 27 used in the current New Zealand design standard (NZS 2006) to
develop the prescribed design limit on transverse reinforcement ratio in RC columns for the ductile
design criteria. The values of plastic rotation capacity (θp) as listed in Table 3 were determined
assuming that the plastic hinge length for each column was equal to half the column depth (NZSEE
2006), and the estimated plastic rotation capacities are consistent with measured plastic hinge
rotations from tests of similarly detailed columns with smooth, round reinforcement (Ricci et al.
2013).
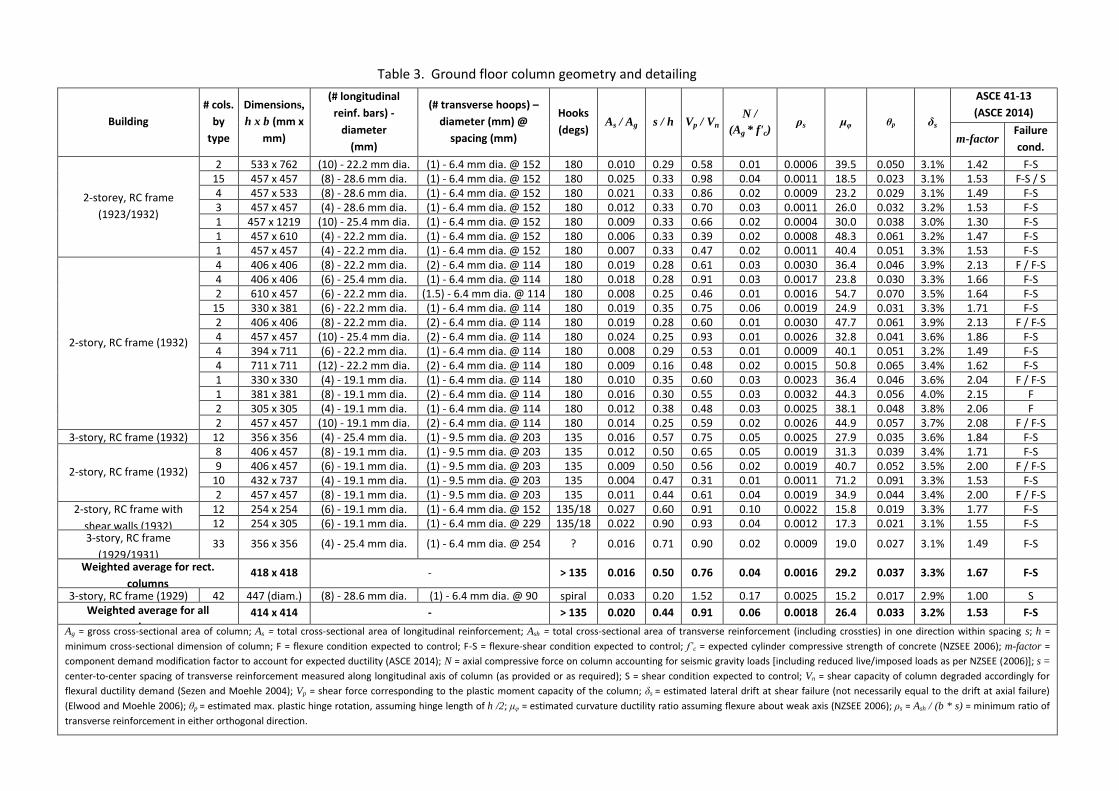
Table 3. Ground floor column geometry and detailing
Building
# cols.
by
type
Dimensions,
h x b (mm x
mm)
(# longitudinal
reinf. bars) -
diameter
(mm)
(# transverse hoops) –
diameter (mm) @
spacing (mm)
Hooks
(degs) As / Ag s / h Vp / Vn
N /
(Ag * f'c) ρs μφ θp δs
ASCE 41-13
(ASCE 2014)
m-factor Failure
cond.
2-storey, RC frame
(1923/1932)
2 533 x 762 (10) - 22.2 mm dia. (1) - 6.4 mm dia. @ 152 180 0.010 0.29 0.58 0.01 0.0006 39.5 0.050 3.1% 1.42 F-S 15 457 x 457 (8) - 28.6 mm dia. (1) - 6.4 mm dia. @ 152 180 0.025 0.33 0.98 0.04 0.0011 18.5 0.023 3.1% 1.53 F-S / S 4 457 x 533 (8) - 28.6 mm dia. (1) - 6.4 mm dia. @ 152 180 0.021 0.33 0.86 0.02 0.0009 23.2 0.029 3.1% 1.49 F-S 3 457 x 457 (4) - 28.6 mm dia. (1) - 6.4 mm dia. @ 152 180 0.012 0.33 0.70 0.03 0.0011 26.0 0.032 3.2% 1.53 F-S 1 457 x 1219 (10) - 25.4 mm dia. (1) - 6.4 mm dia. @ 152 180 0.009 0.33 0.66 0.02 0.0004 30.0 0.038 3.0% 1.30 F-S 1 457 x 610 (4) - 22.2 mm dia. (1) - 6.4 mm dia. @ 152 180 0.006 0.33 0.39 0.02 0.0008 48.3 0.061 3.2% 1.47 F-S 1 457 x 457 (4) - 22.2 mm dia. (1) - 6.4 mm dia. @ 152 180 0.007 0.33 0.47 0.02 0.0011 40.4 0.051 3.3% 1.53 F-S
2-story, RC frame (1932)
4 406 x 406 (8) - 22.2 mm dia. (2) - 6.4 mm dia. @ 114 180 0.019 0.28 0.61 0.03 0.0030 36.4 0.046 3.9% 2.13 F / F-S 4 406 x 406 (6) - 25.4 mm dia. (1) - 6.4 mm dia. @ 114 180 0.018 0.28 0.91 0.03 0.0017 23.8 0.030 3.3% 1.66 F-S 2 610 x 457 (6) - 22.2 mm dia. (1.5) - 6.4 mm dia. @ 114 180 0.008 0.25 0.46 0.01 0.0016 54.7 0.070 3.5% 1.64 F-S
15 330 x 381 (6) - 22.2 mm dia. (1) - 6.4 mm dia. @ 114 180 0.019 0.35 0.75 0.06 0.0019 24.9 0.031 3.3% 1.71 F-S 2 406 x 406 (8) - 22.2 mm dia. (2) - 6.4 mm dia. @ 114 180 0.019 0.28 0.60 0.01 0.0030 47.7 0.061 3.9% 2.13 F / F-S 4 457 x 457 (10) - 25.4 mm dia. (2) - 6.4 mm dia. @ 114 180 0.024 0.25 0.93 0.01 0.0026 32.8 0.041 3.6% 1.86 F-S 4 394 x 711 (6) - 22.2 mm dia. (1) - 6.4 mm dia. @ 114 180 0.008 0.29 0.53 0.01 0.0009 40.1 0.051 3.2% 1.49 F-S 4 711 x 711 (12) - 22.2 mm dia. (2) - 6.4 mm dia. @ 114 180 0.009 0.16 0.48 0.02 0.0015 50.8 0.065 3.4% 1.62 F-S 1 330 x 330 (4) - 19.1 mm dia. (1) - 6.4 mm dia. @ 114 180 0.010 0.35 0.60 0.03 0.0023 36.4 0.046 3.6% 2.04 F / F-S 1 381 x 381 (8) - 19.1 mm dia. (2) - 6.4 mm dia. @ 114 180 0.016 0.30 0.55 0.03 0.0032 44.3 0.056 4.0% 2.15 F 2 305 x 305 (4) - 19.1 mm dia. (1) - 6.4 mm dia. @ 114 180 0.012 0.38 0.48 0.03 0.0025 38.1 0.048 3.8% 2.06 F 2 457 x 457 (10) - 19.1 mm dia. (2) - 6.4 mm dia. @ 114 180 0.014 0.25 0.59 0.02 0.0026 44.9 0.057 3.7% 2.08 F / F-S
3-story, RC frame (1932) 12 356 x 356 (4) - 25.4 mm dia. (1) - 9.5 mm dia. @ 203 135 0.016 0.57 0.75 0.05 0.0025 27.9 0.035 3.6% 1.84 F-S
2-story, RC frame (1932)
8 406 x 457 (8) - 19.1 mm dia. (1) - 9.5 mm dia. @ 203 135 0.012 0.50 0.65 0.05 0.0019 31.3 0.039 3.4% 1.71 F-S 9 406 x 457 (6) - 19.1 mm dia. (1) - 9.5 mm dia. @ 203 135 0.009 0.50 0.56 0.02 0.0019 40.7 0.052 3.5% 2.00 F / F-S
10 432 x 737 (4) - 19.1 mm dia. (1) - 9.5 mm dia. @ 203 135 0.004 0.47 0.31 0.01 0.0011 71.2 0.091 3.3% 1.53 F-S 2 457 x 457 (8) - 19.1 mm dia. (1) - 9.5 mm dia. @ 203 135 0.011 0.44 0.61 0.04 0.0019 34.9 0.044 3.4% 2.00 F / F-S
2-story, RC frame with
shear walls (1932)
12 254 x 254 (6) - 19.1 mm dia. (1) - 6.4 mm dia. @ 152 135/18
0
0.027 0.60 0.91 0.10 0.0022 15.8 0.019 3.3% 1.77 F-S 12 254 x 305 (6) - 19.1 mm dia. (1) - 6.4 mm dia. @ 229 135/18
0
0.022 0.90 0.93 0.04 0.0012 17.3 0.021 3.1% 1.55 F-S 3-story, RC frame
(1929/1931) 33 356 x 356 (4) - 25.4 mm dia. (1) - 6.4 mm dia. @ 254 ? 0.016 0.71 0.90 0.02 0.0009 19.0 0.027 3.1% 1.49 F-S
Weighted average for rect.
columns 418 x 418 - > 135 0.016 0.50 0.76 0.04 0.0016 29.2 0.037 3.3% 1.67 F-S
3-story, RC frame (1929) 42 447 (diam.) (8) - 28.6 mm dia. (1) - 6.4 mm dia. @ 90 spiral 0.033 0.20 1.52 0.17 0.0025 15.2 0.017 2.9% 1.00 S Weighted average for all
columns 414 x 414 - > 135 0.020 0.44 0.91 0.06 0.0018 26.4 0.033 3.2% 1.53 F-S
Ag = gross cross-sectional area of column; As = total cross-sectional area of longitudinal reinforcement; Ash = total cross-sectional area of transverse reinforcement (including crossties) in one direction within spacing s; h =
minimum cross-sectional dimension of column; F = flexure condition expected to control; F-S = flexure-shear condition expected to control; f’c = expected cylinder compressive strength of concrete (NZSEE 2006); m-factor =
component demand modification factor to account for expected ductility (ASCE 2014); N = axial compressive force on column accounting for seismic gravity loads [including reduced live/imposed loads as per NZSEE (2006)]; s =
center-to-center spacing of transverse reinforcement measured along longitudinal axis of column (as provided or as required); S = shear condition expected to control; Vn = shear capacity of column degraded accordingly for
flexural ductility demand (Sezen and Moehle 2004); Vp = shear force corresponding to the plastic moment capacity of the column; δs = estimated lateral drift at shear failure (not necessarily equal to the drift at axial failure)
(Elwood and Moehle 2006); θp = estimated max. plastic hinge rotation, assuming hinge length of h /2; μφ = estimated curvature ductility ratio assuming flexure about weak axis (NZSEE 2006); ρs = Ash / (b * s) = minimum ratio of
transverse reinforcement in either orthogonal direction.
Seismic Considerations for the Art Deco Interwar Reinforced Concrete Buildings of Napier, New Zealand
15
The expected drift capacity for each column at shear failure (δs) as listed in Table 3 was determined
by applying the method proposed by Elwood and Moehle (2006). The estimated column drift
capacities were considered in the determination of the estimated structural displacement ductility
capacities for the seven considered buildings listed in Table 2. These displacement ductility
capacities were estimated based on a conservative assumption of structural interstory yield drift
occurring at 1.5% (Priestley 1998). The estimated displacement ductility capacity was chosen as the
lower of the value derived from the approximation methods proposed by Priestley (1996) (assuming
a column-sway soft-story mechanism) and the ratio of the smallest drift at shear failure for any
ground floor column in the considered building to the assumed yield drift of 1.5%, resulting in
estimated weighted average displacement ductility capacities of 2.1 for the six buildings with
rectangular columns and 2.0 for all seven buildings (Table 2). However, these estimated
displacement ductility capacities are tempered by the slightly lower m-factors determined from ASCE
41-13 (ASCE 2014) criteria, which represent component demand modification factor[s] to account
for expected ductility when performing linear seismic assessments. At low fundamental periods
(e.g., 0.35 s, which approximates the fundamental period for most Napier Art Deco buildings), the
structural displacement ductility capacity, μ , in NZS (2004) is approximately equal to the seismic
load reduction factor, ku / Sp , in NZS 1170.5:2004, which is effectively equivalent to the m-factor in
ASCE 41-13 (although the m-factor is used to enhance capacity rather than reduce demand and is
directly applicable to a specific structural component rather than the structural system). Hence, the
values of the m-factors listed in Table 2 can be assumed to represent limits on the structural
displacement ductility capacity assumed for the buildings. The weighted average m-factor from this
investigation for the columns of the six buildings with rectangular columns is 1.67. Considering the
conservatism inherent in the ASCE 41-13 (ASCE 2014) criteria as well as the higher ductility capacities
determined through alternative methods, it is recommended that New Zealand engineers
performing seismic assessments of these interwar RC buildings should scale the applied earthquake
demands assuming a level of structural displacement ductility capacity equal to at least 1.75 unless a
critical weakness is identified in the RC frame geometry or detailing. Many Art Deco buildings are
expected to have structural displacement ductility capacities exceeding 2.0. For reference, NZSEE
(2006) recommends that RC buildings comprised of columns of limited ductility are expected to
achieve a structural displacement ductility capacity between 2.0 and 3.0. In comparison, RC buildings
comprised of columns designed to be fully ductile in accordance with the modern design standard
(NZS 2006) are expected to achieve a structural displacement ductility capacity of as much as 6.0,
whereas nonductile or nominally ductile RC frames are expected to achieve a structural
displacement ductility capacity less than 1.25 (NZSEE 2006).
Notice the low anticipated axial loads [values for N / (Ag * f'c) in Table 3] as a result of the relatively
close column spacing in the low-rise buildings considered. Column confinement is less likely to
control drift capacity when axial loads are relatively low. Hence, potentially limiting factors not
considered in the column analysis summarized in Table 3 are the effects of bidirectional loading on
columns with limited ductility (Boys et al. 2008), premature longitudinal bar buckling, and bond slip
of anchorage or lap splice connections (NZSEE 2006). The latter consideration is especially
noteworthy because all reinforcement in the columns considered in Table 3 was identified as being
comprised of smooth, round bar. Various other studies into RC columns with similar detailing have
found that round longitudinal bars with ineffective anchorage or development length can induce
failure at relatively low loads, but that properly spliced or anchored round longitudinal bars are likely
Seismic Considerations for the Art Deco Interwar Reinforced Concrete Buildings of Napier, New Zealand
16
to effectuate higher column deformability than deformed bars (Ricci et al. 2013) and induce rocking
mechanisms at the base of the columns (Arani et al. 2013). Where identified on plans, longitudinal
reinforcement in the columns listed in Table 3 was anchored using 180-degree hooks.
FOUNDATIONS
One further observation was made regarding the seven buildings listed in Table 2. All seven of these
buildings were identified as having shallow foundations, typically comprising of spread footings
beneath the columns and grade beams or foundation tie beams spanning between spread footings,
often with thick concrete slabs (or raft foundations) in the basements. These traits are consistent
with the observations of Brodie and Harris (1933) for RC buildings in Hawke’s Bay, who noted that
these foundation types performed satisfactorily in the 1931 earthquake. Dowrick (1998) observed
that deep foundations for RC buildings were not in use in Hawke’s Bay during the interwar period.
OBSERVED DAMAGE TO SIMILAR STRUCTURES IN THE CANTERBURY EARTHQUAKES AND
ELSEWHERE
The 2010–2011 Canterbury, New Zealand, earthquakes serve as the most recent empirical precedent
for a forensic investigation of Napier’s Art Deco buildings. Ten buildings that were constructed
during the interwar period, constructed of RC frames, and between two and four stories in height
were identified in databases and literature describing building damage following the February 22,
2011, Christchurch earthquake [Canterbury Earthquakes Recovery Authority (CERA) 2012; Pampanin
et al. 2012]. Observed damage was typically limited to the exterior of the buildings because
inspectors could not safely enter most of the premises. Shear cracking was observed in several
exterior columns (some severe). Several masonry infill walls were also heavily cracked, and an
exterior URM infill wall in one of the considered buildings even partially collapsed out-of-plane.
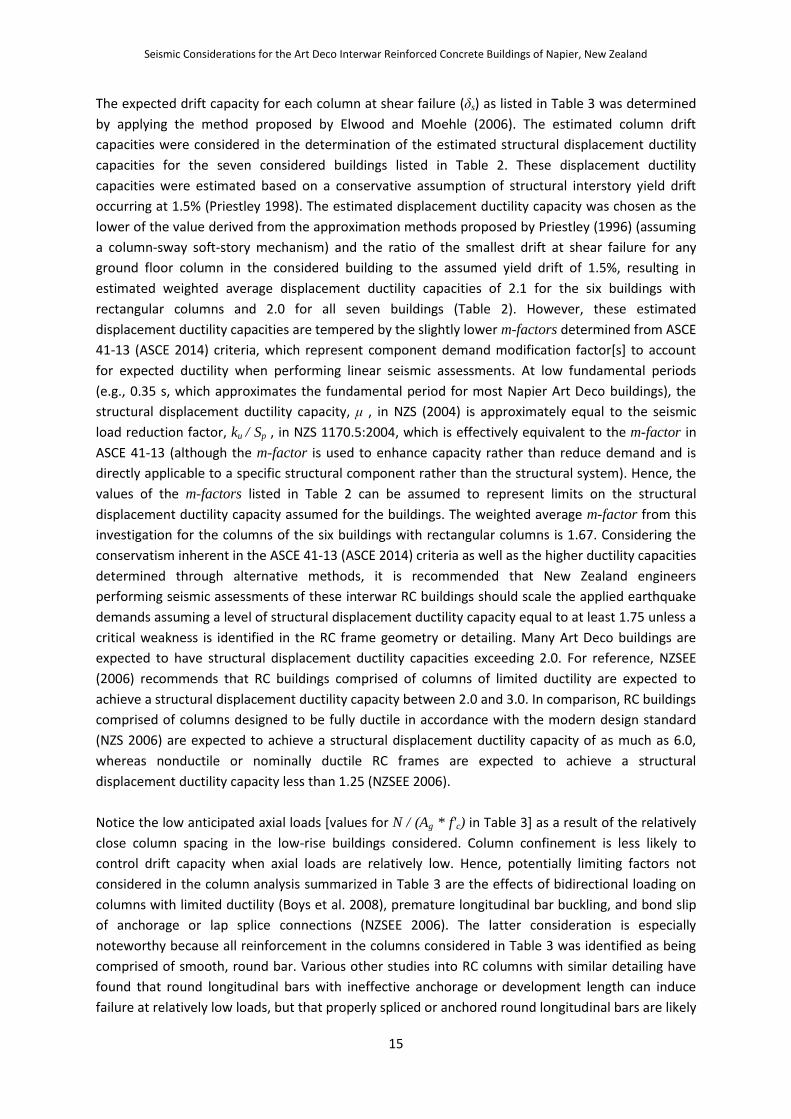
However, none of the ten interwar RC buildings considered experienced the collapse of primary
structural components during the February 22, 2011, earthquake, despite the unusually high
earthquake intensity (Fig. 7, with a comparison of response spectra from records in the 2011
Christchurch earthquake to the DBE response spectrum for Napier). Furthermore, the contemporary
Christchurch buildings considered had already been weakened by the preceding September 4, 2010,
Darfield earthquake. Hence, the observed satisfactory life-safety performance of these interwar RC
buildings in Christchurch should increase engineers’ confidence regarding the probable satisfactory
life-safety performance of Napier’s Art Deco buildings under DBE loading.
The fatal collapses of two relatively modern RC buildings in Christchurch (Cooper et al. 2012),
constructed in 1966 and 1986, brought greater attention to deficiencies in newer-type RC
construction. Even before the 2011 Christchurch earthquake, however, RC buildings of the more
modern era were of generally greater concern to engineers and emergency managers in New
Zealand. NZSEE (2006) noted that
Reinforced concrete buildings from the 1940s and the 1950s are typically low-rise with
regular and substantial wall elements. Many of these structures would be capable of close to
an elastic level of response, with local detailing exceptions. Reinforced concrete buildings
from the 1960s and early 1970s are, however, generally taller, less generously proportioned,
with less redundancy and greater irregularity often in evidence in frame structures.
Seismic Considerations for the Art Deco Interwar Reinforced Concrete Buildings of Napier, New Zealand
17
Fig. 7. NLTHA target response spectrum for Napier assuming deep soils [derived from
NZS 1170.5:2004 (NZS 2004)], maximum horizontal ground motions recorded at four
sites near the Christchurch city center during the February 22, 2011 earthquake, and
the geometric mean (GM) of those four ground motions (data from GeoNet 2013)
Observations of RC building damage from major earthquakes around the world are also consistent
with the NZSEE observations. Citing data accrued by the Architectural Institute of Japan [summarized
by Otani (1999)] from the sites of four of the more significant earthquakes of the past thirty years
(1985 Mexico, 1990 Luzon, 1992 Erzincan, and 1995 Kobe), Wu et al. (2009) noted that “the
probability of structural collapse in older-type concrete buildings was relatively low (1.9–6.6%) even
in such damaging earthquake events,” where it appears that Wu et al. (2009) may have been
referring to older-type buildings as having been constructed prior to approximately 1980.
Furthermore, the Otani (1999) data illustrate the relatively low risk of collapse associated with RC
buildings with no more than three stories, which is the maximum height associated with Napier’s Art
Deco building stock. The 1985 Mexico earthquake ground-motion records are one of the seven
recommended sources of frequency content when performing an NLTHA in Hawke’s Bay (Oyarzo-
Vera et al. 2012).
SUMMARY AND CONCLUSIONS
Typological and geometric investigations were performed on sample groups of Art Deco buildings in
Napier, New Zealand, constructed during the interwar period, with the primary objectives being to
provide initial guidance on the seismic risk of these buildings to interested parties and to help
facilitate more accurate detailed assessments in the future. Specific conclusions derived from this
investigation are as follows:
The Art Deco building stock is relatively homogeneous, and the homogeneity of the building
stock can be leveraged so as to make findings from empirical studies (e.g., performance of
similar buildings in past earthquakes) as well as exemplar detailed assessments useful to a
large number of buildings within the portfolio.
The prototypical Art Deco building was constructed in the first half of the 1930s, has two
stories, is abutted on either side by its neighbors in a row-style footprint, was designed by
one of only five architecture firms, and is comprised of a two-way RC space frame with clay
brick masonry infill in at least some portion of the building.
The prototypical Art Deco building with rectangular columns and two-way framing has a
gross footprint of approximately 380 m2 and a structural footprint ratio of approximately
Seismic Considerations for the Art Deco Interwar Reinforced Concrete Buildings of Napier, New Zealand
18
1.9%, the latter of which is a relatively high value that can be associated with successful
performance in historic earthquakes in New Zealand and internationally.
The prototypical RC rectangular column of an Art Deco building is rectangular in cross
section with dimensions of approximately 420 x 420 mm and has transverse reinforcement
hooked inward toward the confined core at angles equal to or greater than 135 degrees.
This transverse reinforcement is spaced longitudinally at about half of the smallest
dimension of the column and, coupled with low axial loads, is expected to provide sufficient
deformation capacity to facilitate a limited ductile behavior in the column when subjected to
lateral loads. The expected failure condition in the prototypical Art Deco RC rectangular
column is expected to be flexure preceding shear cracking, as was observed in similar
buildings damaged by the 2011 Christchurch earthquake.
The observed performance of similar low-rise, ostensibly brittle RC buildings in the 1931
Hawke’s Bay earthquake, the 2011 Christchurch earthquake, and other historic earthquakes,
both in New Zealand and elsewhere, lends credence to the conclusion that these buildings
are generally underrated in simple, force-based seismic assessments.
Recommendations derived from this study for structural engineers performing detailed seismic
assessments on buildings similar to those discussed in this paper are as follows:
Common potential vulnerabilities identified among the Art Deco buildings that should be
closely considered are nonstructural falling hazards (namely slender, inadequately
reinforced parapets and URM infill walls, especially atop taller buildings), pounding potential
with neighboring buildings with offset building or story heights, splice or anchorage failure of
smooth reinforcement bars, premature buckling of longitudinal reinforcement in columns,
and column shear strength degradation at high ductility demands.
Assumed material strengths for use in assessing these buildings should generally be
approximately 245–270 MPa for the tensile yielding of steel reinforcement and 14–21 MPa
for the ultimate compressive strength of concrete.
Infill walls may have contributed greatly to the successful performance of similar buildings in
previous earthquakes and should be included in detailed seismic assessments as being
generally beneficial elements in-plane (provided they do not create short columns when
only partial height), even for buildings where infill walls appears to create asymmetries in
plan.
Assessment efforts seeking accuracy and the avoidance of excessive conservativeness should
be focused on leveraging the inherent stiffness and redundancy of the complete structures
limiting the estimated interstory drift demands instead of, as is traditionally done, being
focused on increasing the estimated strength capacity of structural elements. Practically, this
approach requires that engineers utilize system-oriented assessment techniques such as
modal response spectrum analyses or, preferably, displacement-based assessment
techniques such as nonlinear procedures (where the nonlinear drift demands and capacities
of columns and other frame elements are considered).
New Zealand engineers performing seismic assessments of Art Deco RC buildings should
reduce the applied earthquake demands assuming a level of structural displacement
ductility capacity of at least 1.75 (to be further considered in future research efforts) unless
a critical weakness is identified in the RC frame geometry or detailing. Many Art Deco
buildings are expected to have structural displacement ductility capacities exceeding 2.0.
Seismic Considerations for the Art Deco Interwar Reinforced Concrete Buildings of Napier, New Zealand
19
Engineers should consider the strong empirical evidence supporting the historic success of
these types of buildings when interpreting the results of detailed assessments.
Building officials and insurers are encouraged to request more sophisticated analyses before
enforcing ordinances, policies, or premiums that could lead to vacancies and building demolitions.
Further efforts to expand on these findings will provide greater clarity on the seismic risks associated
with the Art Deco building stock in Napier. In future efforts, the researchers will perform and report
on the results of a detailed assessment of a representative Art Deco building. The results of this
latter study could also be incorporated into fragility curve functions particular to Hawke’s Bay’s Art
Deco building stock to enhance the accuracy of New Zealand’s seismic hazard models and either
validate or improve upon previous work done internationally in this realm (e.g., Shoraka et al. 2012).
Further study on the deformation capacity of columns with smooth, round longitudinal
reinforcement (including in situ testing, if possible) would help refine the estimation of ductility
capacities for these buildings.
ACKNOWLEDGMENTS
The authors would like to thank those associated with the Napier Art Deco Trust
(http://www.artdeconapier.com) for providing the authors with access to the case-study buildings
and to building plans. Consultants at EQ Struc, Ltd. (http://www.eqstruc.co.nz) and Strata Group
(http://www.stratagroup.net.nz) provided the authors with some of the material test specimens and
typological information. Win Clark of NZSEE (http://www.nzsee.org.nz) provided guidance and
review of preliminary assessment findings. W.Y. Kam and Stefano Pampanin of the University of
Canterbury (http://www.civil.canterbury.ac.nz) and Gareth Wright and Philip Barrett of the
Christchurch City Council (http://www.ccc.govt.nz) provided the authors with information pertaining
to the identification of and documented damage to interwar RC buildings in the 2011 Christchurch
earthquake.
REFERENCES
Arani, K., Marefat, M., Amrollahi-Biucky, A., and Khanmohammadi, M. (2013). “Experimental seismic
evaluation of old concrete columns reinforced by plain bars.” Struct. Design Tall Spec. Build., 22(3),
267–290.
ASCE. (2014). “Seismic evaluation and retrofit of existing buildings.” ASCE 41-13, ASCE/SEI Standard,
Reston, VA.
ASTM. (2012). “Standard test methods and definitions for mechanical testing of steel products.” A370-
12a, West Conshohocken, PA.
Bilman, A., Gill, T., and Ratcliffe, K. (2004). Art Deco inventory, 2nd Ed., Napier City Council and Art Deco
Trust, Inc., Napier, New Zealand.
Boys, A., Bull, D., and Pampanin, S. (2008). “Seismic performance assessment of inadequately detailed
reinforced concrete columns.” Proc., New Zealand Society for Earthquake Engineering (NZSEE) Conf.,
NZSEE, Wellington, New Zealand.
Brodie, A., and Harris, A. (1933). “Report of the Hawke’s Bay earthquake (3rd February, 1931).” Chapter
6, Damage to buildings, Vol. 2, 108–115.
Canterbury Earthquakes Recovery Authority (CERA). (2012). “Buildings demolitions list.” Christchurch,
New Zealand, ⟨http://cera.govt.nz/ demolitions/list⟩ (Oct. 21, 2012).
Chapman, H. (1991). “Seismic retrofitting of highway bridges.” Bull. N. Z. Natl. Soc. Earthquake Eng.,
24(2), 186–201.
Seismic Considerations for the Art Deco Interwar Reinforced Concrete Buildings of Napier, New Zealand
20
City of Napier. (2001). “District plan, Ahuriri section, appendix to section 17.” Napier City Council, Napier,
New Zealand.
City of Napier. (2011). “District plan, volume 1, appendix 13: Heritage items.” Napier, New Zealand.
Clarke, J. (2009). “Historic approaches to the design of concrete buildings and structures.” Technical Rep.
No. 70, The Concrete Society, Surrey, U.K.
Cole, G., Dhakal, R., and Turner, F. (2012). “Building pounding damage observed in the 2011 Christchurch
earthquake.” Earthquake Eng. Struct. Dyn., 41(5), 893–913.
Cooper, M., Carter, R., and Fenwick, R. (2012). Canterbury earthquakes royal commission (CERC) final
report, Vol. 1–7, Royal Commission of Inquiry, Christchurch, New Zealand.
Dowrick, D. (1998). “Damage and intensities in the magnitude 7.8 1931 Hawke’s Bay, New Zealand,
earthquake.” Bull. N. Z. Natl. Soc. Earthquake Eng., 31(3), 139–163.
Dowrick, D. (2006). “Lessons from the performance of buildings in the Mw 7.8 Hawke’s Bay earthquake of
1931.” Proc., New Zealand Society for Earthquake Engineering Conf., Wellington, New Zealand.
Dowrick, D., and Rhoades, D. (2000). “Earthquake damage and risk experience and modelling in New
Zealand.” Proc., 12th World Conf. on Earthquake Engineering, New Zealand Society for Earthquake
Engineering (NZSEE), Wellington, New Zealand.
Elwood, K., and Moehle, J. (2006). “Idealized backbone model for existing reinforced concrete columns
and comparisons with FEMA 356 criteria.” Struct. Des. Tall Spec. Build., 15(5), 553–569.
GeoNet. (2013). “Historical earthquakes catalogue.” Earthquake Commission New Zealand and GNS
Science (EQC-GNS), Lower Hutt, New Zealand,
⟨http://info.geonet.org.nz/display/quake/Historical+Earthquakes⟩ (Apr. 2, 2013).
Glogau, O. (1980). “Low-rise reinforced concrete buildings of limited ductility.” Bull. N. Z. Natl. Soc.
Earthquake Eng., 13(2), 182–193.
Ingham, J., and Griffith, M. (2011). “The performance of earthquake strengthened URM buildings in the
Christchurch CBD in the 22 February 2011 earthquake.” Addendum Rep., Royal Commission of
Inquiry, Christchurch, New Zealand.
MacRae, G., Clifton, C., and Megget, L. (2011). “Review of NZ building codes of practice.” Technical Rep.,
Royal Commission of Inquiry, Christchurch, New Zealand.
McGregor, R. (1998). The new Napier: The Art Deco city in the 1930s, Art Deco Trust, Inc., Napier, New
Zealand.
McGregor, R. (2003). The Art Deco city: Napier, New Zealand, 4th Ed., Art Deco Trust, Inc., Napier, New
Zealand.
McGregor, R. (2012). Napier’s famous Art Deco walk, 14th Ed., Art Deco Trust, Inc., Napier, New Zealand.
Mitchell, A. (1931). “The effects of earthquakes on buildings and structures.” NZIA J., 12(10), 111–117.
New Zealand Historic Places Trust (NZHPT). (2012). “The list.” ⟨http://www.heritage.org.nz/the-list⟩ (Oct.
21, 2012). New Zealand Parliament. (1931). “Report of building regulations committee.” House of
Representatives, Wellington, New Zealand.
New Zealand Parliament. (2004). “Building act, department of building and housing—Te Tari Kaupapa
Whare.” Ministry of Economic Development, New Zealand Government, Wellington, New Zealand.
New Zealand Society for Earthquake Engineering (NZSEE). (2006). “Assessment and improvement of the
structural performance of buildings in earthquakes, recommendations of a NZSEE study group on
earthquake risk of buildings.” Incorporated Corrigenda No. 1 & 2, New Zealand Society for
Earthquake Engineering, Wellington, New Zealand.
Otani, S. (1999). “RC building damage statistics and SDF response with design seismic forces.” Earthquake
Spectra, 15(3), 485–501.
Seismic Considerations for the Art Deco Interwar Reinforced Concrete Buildings of Napier, New Zealand
21
Oyarzo-Vera, C., McVerry, G., and Ingham, J. (2012). “Seismic zonation and default suite of ground-
motion records for time-history analysis in the North Island of New Zealand.” Earthquake Spectra,
28(2), 667–688.
Pampanin, S., Kam, W. Y., Akguzel, U., Tasligedik, A. S., and Quintana- Gallo, P. (2012). “Report on the
observed earthquake damage of reinforced concrete buildings in the Christchurch CBD on the 22
February 2011 earthquake.” Univ. of Canterbury, Christchurch, New Zealand.
Priestley, M. (1996). “Displacement-based seismic assessment of existing reinforced concrete buildings.”
Bull. N. Z. Natl. Soc. Earthquake Eng, 29(4), 256–272.
Priestley, M. (1998). “Brief comments on elastic flexibility of reinforced concrete frames and significance
to seismic design.” Bull. N. Z. Natl. Soc. Earthquake Eng., 31(4), 246–259.
Ricci, P., Verderame, G., and Manfredi, G. (2013). “ASCE/SEI 41 provisions on deformation capacity of
older-type reinforced concrete columns with plain bars.” J. Struct. Eng., 10.1061/(ASCE)ST.1943 -
541X.0000701, 04013014.
Sezen, H., and Moehle, J. (2004). “Shear strength model for lightly reinforced concrete columns.” J.
Struct. Eng., 10.1061/(ASCE)0733-9445 (2004)130:11(1692), 1692–1703.
Shaw, P., and Hallett, P. (2002). Art Deco Napier: Styles of the thirties, 5th Ed., Art Deco Trust, Inc.,
Napier, New Zealand.
Shoraka, M., Yang, T., and Elwood, K. (2012). “Seismic loss estimation of non-ductile reinforced concrete
buildings.” Earthquake Eng. Struct. Dyn., 42(2), 297–310.
Standards New Zealand (NZS). (1986). “Methods of test for concrete, Part 2: tests relating to the
determination of strength of concrete.” NZS 3112:1986, Incorporated Amendments No. 1 and 2,
Standards New Zealand (NZS) Concrete Testing Committee P 3112, Wellington, New Zealand.
Standards New Zealand (NZS). (2002). “Structural design actions, Part 0: General principles.” NZS
1170.0:2002, Standards New Zealand (NZS) Technical Committee BD-006, Wellington, New Zealand.
Standards New Zealand (NZS). (2004). “Structural design actions, Part 5: earthquake actions—New
Zealand.” NZS 1170.5:2004, Standards New Zealand (NZS) Technical Committee BD-006-04-11,
Wellington, New Zealand.
Standards New Zealand (NZS). (2006). “Concrete structures standard, Part 1: The design of concrete
structures.” NZS 3101:2006, Incorp. Amendment No. 1. Standards New Zealand (NZS) Concrete
Design Committee P 3101, Wellington, New Zealand.
Stewart, G. (2009). Napier: Portrait of an Art Deco city, Grantham House, Wellington, New Zealand.
Stirling, M., et al. (2012). “National seismic hazard model for New Zealand: 2010 update.” Bull. Seismol.
Soc. Am., 102(4), 1514–1542.
Transit New Zealand (TNZ). (2004). Evaluation of bridges and culverts, Chapter 6, NZ Transport Agency,
Wellington, New Zealand.
van de Vorstenbosch, G., Charleson, A., and Dowrick, D. (2002). “Reinforced concrete building
performance in the Mw 7.8 1931 Hawke’s Bay, New Zealand, earthquake.” Bull. N. Z. Natl. Soc.
Earthquake Eng., 35(3), 149–164.
Walsh, K., Dizhur, D., Shafaei, J., Derakhshan, H., and Ingham, J. (2014). “Out-of-plane in situ testing of
masonry cavity walls in as-built and improved conditions.” Proc., Australian Earthquake Engineering
Society (AEES) Conf., Melbourne, VIC, Australia.
Walsh, K., Liu, P., Dizhur, D., and Ingham, J. (2013). “Detailed seismic assessment of a Hawke’s Bay Art
Deco case study building.” Proc., New Zealand Concrete Industry (NZCI) Conf., Auckland, NZ.
Wu, C., et al. (2009). “Collapse of a nonductile concrete frame: Shaking table tests.” Earthquake Eng.
Struct. Dyn., 38(2), 205–224.