Embed Size (px)
Citation preview

SEIAA – KARNATAKA
CHECKLIST FOR BUILDING & CONSTRUCTION PROJECTS
Name of the Project: “Development of Residential Apartment with club house”
Sl.
No. DOCUMENTS /
1. Form -1
2. Form -1 A
3. Environmental management plan [EMP]
4. Conceptual Plan [Site Plan]
5. Topo sheet Duly marking the project site with 10Km Radius
6. Original Village Maps duly marking project site. Adjacent village maps of the project
site is located at vicinity of the village boundary
7. Latest Google Map Duly marking the project site
8. CDP Duly marking the project site
9. Latest Site Photographs
10. Land Documents
a. Sale Deed
b. Khatha Certificate
c. Mutation Copy
d. Land allotment Letter in case of KIADB/SEZ NA
e. Survey Sketch, Podi etc.,
f. R.T.C
g. Joint development agreement if Applicable
h. Other-GPA
i. Gazette Notification regarding land acquisition under section 4(1) & 4 (6) of the Karnataka Land revenue Act in case of Area development/ Township Projects
NA
j. List of Survey No's and Extent in case of Area development/ Township Projects NA
k. Disputes if any and copy of documents/ orders there off
11. Copy of earlier E.C/Sanction Plan in case of Expansion and Modification Projects
12. Certified report of the status of compliance of the conditions stipulated in the E.C from
the regional office of MoEF& CC
NA
13. Latest Traffic study Report
14. Comparative statement of the project profile between the existing and the proposed with
difference thereof in case of Expansion and Modification project
NA
15. Copy of Clearance obtained from other Regulatory Authority
a. NOC regarding water supply from the competent Authority-Acknowledgment copy b. NOC from Airport Authority
c. NOC from Fire and Emergency Department
d.
MOU regarding supply of treated water for construction a per FEE 188 ENV 2003 dated
14.08.2003 and As per NGT Direction in O.A 222 of 2014 dated 04.05.2016 with the
prospective supplier and water quality analysis report
e. MoU Letter/Approval letter from GAIL regarding supply of CNG for Generator set
f. Applicability of CRZ Notification and Clearance /recommendations from the competent
Authority NA
g. Other Specify
16. Accreditation certificate for Consultant –Stay order copy enclosed
17. Letter of Authorization issued by the company, Partnership/proprietor if the authorized
signatory other than the proprietor himself for filing of application before SEIAA
NA
18. DD towards processing fee in accordance with G.O No. FEE 46 EPC 2013, dated
10.05.2013 amended from time to time
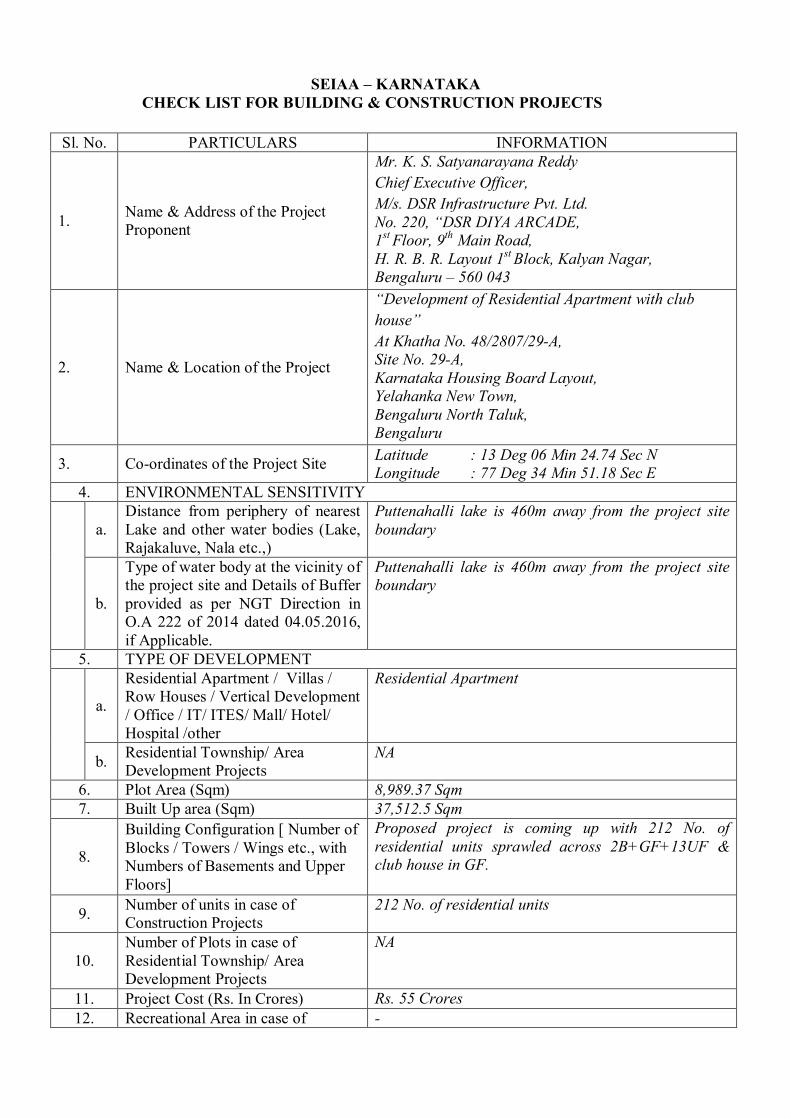
SEIAA – KARNATAKA
CHECK LIST FOR BUILDING & CONSTRUCTION PROJECTS
Sl. No. PARTICULARS INFORMATION
1. Name & Address of the Project
Proponent
Mr. K. S. Satyanarayana Reddy
Chief Executive Officer,
M/s. DSR Infrastructure Pvt. Ltd.
No. 220, “DSR DIYA ARCADE,
1st
Floor, 9th
Main Road,
H. R. B. R. Layout 1st
Block, Kalyan Nagar,
Bengaluru – 560 043
2. Name & Location of the Project
“Development of Residential Apartment with club
house”
At Khatha No. 48/2807/29-A,
Site No. 29-A,
Karnataka Housing Board Layout,
Yelahanka New Town,
Bengaluru North Taluk,
Bengaluru
3. Co-ordinates of the Project Site Latitude : 13 Deg 06 Min 24.74 Sec N
Longitude : 77 Deg 34 Min 51.18 Sec E
4. ENVIRONMENTAL SENSITIVITY
a.
Distance from periphery of nearest
Lake and other water bodies (Lake,
Rajakaluve, Nala etc.,)
Puttenahalli lake is 460m away from the project site
boundary
b.
Type of water body at the vicinity of
the project site and Details of Buffer
provided as per NGT Direction in
O.A 222 of 2014 dated 04.05.2016,
if Applicable.
Puttenahalli lake is 460m away from the project site
boundary
5. TYPE OF DEVELOPMENT
a.
Residential Apartment / Villas /
Row Houses / Vertical Development
/ Office / IT/ ITES/ Mall/ Hotel/
Hospital /other
Residential Apartment
b. Residential Township/ Area
Development Projects
NA
6. Plot Area (Sqm) 8,989.37 Sqm
7. Built Up area (Sqm) 37,512.5 Sqm
8.
Building Configuration [ Number of
Blocks / Towers / Wings etc., with
Numbers of Basements and Upper
Floors]
Proposed project is coming up with 212 No. of
residential units sprawled across 2B+GF+13UF &
club house in GF.
9. Number of units in case of
Construction Projects
212 No. of residential units
10.
Number of Plots in case of
Residential Township/ Area
Development Projects
NA
11. Project Cost (Rs. In Crores) Rs. 55 Crores
12. Recreational Area in case of -

Residential Projects / Townships
13. DETAILS OF LAND USE (SQM)
a. Ground Coverage Area 2,605.63 Sqm
b. Kharab Land -
c.
Total Green belt on Mother Earth
for projects under 8(a) of the
schedule of the EIA notification,
2006
2349.99 Sqm
d. Internal Roads & Hardscape 2,278.20 Sqm
e. Paved area -
f. Others Specify Road widening area = 1238.28 Sqm
Surface parking = 517.27Sqm
g.
Parks and Open space in case of
Residential Township/ Area
Development Projects
-
h. Total 8989.37Sqm
14. DETAILS OF DEMOLITION DEBRIS AND / OR EXCAVATED EARTH
a.
Details of Debris (in cubic
meter/MT) if it involves Demolition
of existing structure and Plan for re
use as per Construction and
Demolition waste management
Rules 2016, If Applicable
Existing sheds will be demolished; brick bat waste of
245cum and Concrete waste of 61cum will be used
within the site.
b.
Total quantity of Excavated earth
(in cubic meter)
15,634 m3
c.
Quantity of Excavated earth propose
to be used in the Project site (in
cubic meter)
15,634 m3
d. Excess excavated earth (in cubic
meter)
-
e.
Plan for scientific disposal of excess
excavated earth along with
Coordinate of the site proposed for
such disposal
Excavated soil is used within the project site
15. WATER
I. Construction Phase
a. Source of water
Domestic water requirement will be sourced from
External Tanker water suppliers & for construction
activities sourced from STP tertiary treated water
b. Quantity of water for Construction
in KLD
18 KLD
c. Quantity of water for Domestic
Purpose in KLD
7.5 KLD
d. Waste water generation in KLD 7.1 KLD
e. Treatment facility proposed and
scheme of disposal of treated water
Domestic sewage generated during construction phase
will be discharged to UGD
II. Operational Phase
a. Total Requirement of Water in
KLD
Fresh 103 KLD
Recycled 54 KLD
Total 157 KLD
b. Source of water BWSSB
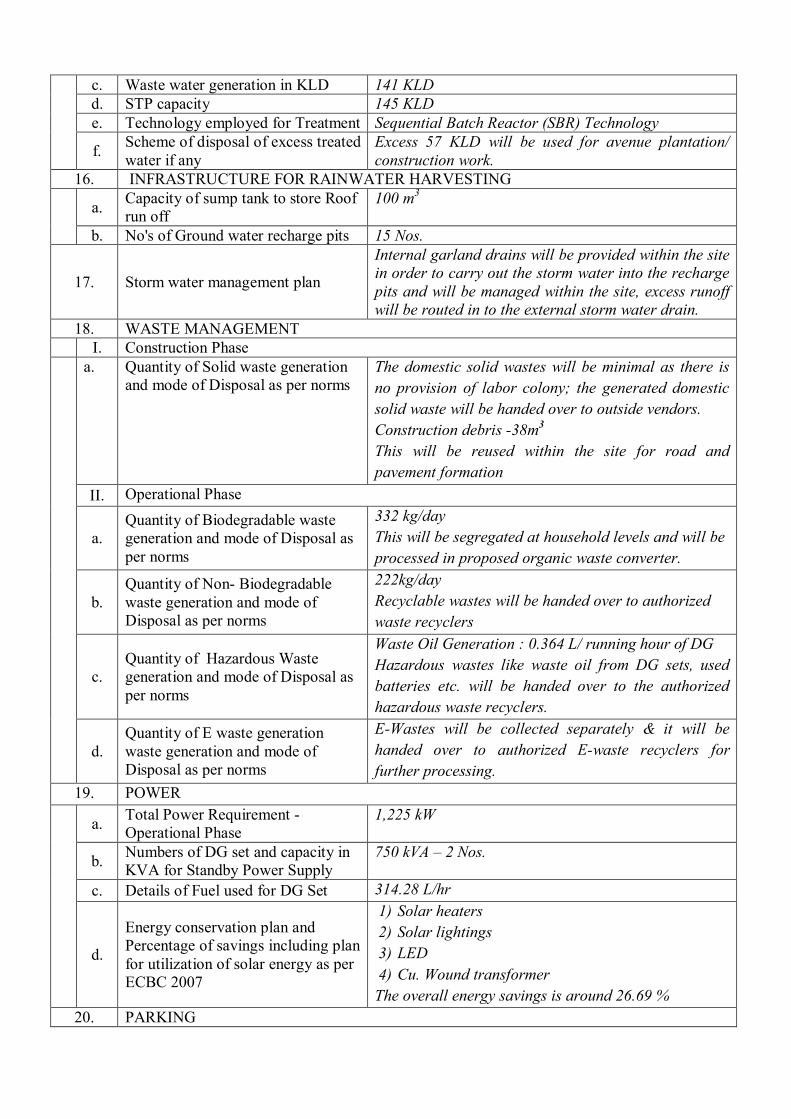
c. Waste water generation in KLD 141 KLD
d. STP capacity 145 KLD
e. Technology employed for Treatment Sequential Batch Reactor (SBR) Technology
f. Scheme of disposal of excess treated
water if any
Excess 57 KLD will be used for avenue plantation/
construction work.
16. INFRASTRUCTURE FOR RAINWATER HARVESTING
a.
Capacity of sump tank to store Roof
run off
100 m3
b. No's of Ground water recharge pits 15 Nos.
17. Storm water management plan
Internal garland drains will be provided within the site
in order to carry out the storm water into the recharge
pits and will be managed within the site, excess runoff
will be routed in to the external storm water drain.
18. WASTE MANAGEMENT
I. Construction Phase
a. Quantity of Solid waste generation
and mode of Disposal as per norms
The domestic solid wastes will be minimal as there is
no provision of labor colony; the generated domestic
solid waste will be handed over to outside vendors.
Construction debris -38m3
This will be reused within the site for road and
pavement formation
II. Operational Phase
a.
Quantity of Biodegradable waste
generation and mode of Disposal as
per norms
332 kg/day
This will be segregated at household levels and will be
processed in proposed organic waste converter.
b.
Quantity of Non- Biodegradable
waste generation and mode of
Disposal as per norms
222kg/day
Recyclable wastes will be handed over to authorized
waste recyclers
c.
Quantity of Hazardous Waste
generation and mode of Disposal as
per norms
Waste Oil Generation : 0.364 L/ running hour of DG
Hazardous wastes like waste oil from DG sets, used
batteries etc. will be handed over to the authorized
hazardous waste recyclers.
d.
Quantity of E waste generation
waste generation and mode of
Disposal as per norms
E-Wastes will be collected separately & it will be
handed over to authorized E-waste recyclers for
further processing.
19. POWER
a.
Total Power Requirement -
Operational Phase
1,225 kW
b. Numbers of DG set and capacity in
KVA for Standby Power Supply
750 kVA – 2 Nos.
c. Details of Fuel used for DG Set 314.28 L/hr
d.
Energy conservation plan and
Percentage of savings including plan
for utilization of solar energy as per
ECBC 2007
1) Solar heaters
2) Solar lightings
3) LED
4) Cu. Wound transformer
The overall energy savings is around 26.69 %
20. PARKING

a. Parking Requirement as per norms 250 Nos.
b.
Level of Service (LOS) of the
connecting Roads as per the Traffic
Study Report
Doddaballapura Rd Existing Changed
Towards
Doddaballapur
B A
Towards Yelahanka C B
c. Internal Road width (RoW) 6 m

28
Annexure – 1(a): Land use details
Existing land use:
The land use pattern planned for the Planning District 3.07 Yelahanka for the
planning year 2015 is as enumerated in the following table. It is observed that the
proposed project site is located in Mutation Corridor zone. The overall land use
proposed for the contained planning district as per the Revised Master plan (RMP)-
2015, is shown in the above fig.
PROJECT
SITE

29
Land use Allocation as per RMP - 2015
Land Use Area in
Hectare % of Total
Residential (main) 1750.27 55.24
Residential (Mixed) 103.30 3.26
Commercial (Central) - -
Commercial (Business) 1.54 0.05
Mutation Corridor 44.24 1.40
Commercial Axes 19.08 0.60
Industrial 220.07 6.95
High Tech - -
Public and Semi Public 282.11 8.90
Green (Parks & open Spaces) 310.19 9.79
Traffic & Transportation 398.38 12.57
Public utilities 39.10 1.23
Unclassified - -
Total 3168.29 100.00

30
Aerial view covering 500 m radius
Latitude : 13 Deg 06 Min 24.74 Sec N
Longitude : 77 Deg 34 Min 51.18 Sec E

31
Topo map covering 10km radius
10 km
PROJECT
SITE
Scale: 1cm: 0.5km 20cm: 10km
TOPO SHEET NOS.:
57G12 & 57G8

32
Table: Land Use within the site
Sl. No. Land use Area in Sqmt In %
I Total Site Area 8989.37
Road widening area 1238.28 II Net Site area 7751.09 100
Land use Breakup in Percentage (%)
1. Ground coverage area 2605.63 33.62 2. Landscape area 2349.99 30.32 3. Drive way area 2278.20 29.39 4. Surface parking 517.27 6.67
Annexure 1(b): Views of the project site

33
Annexure 1(c): Geotechnical Report
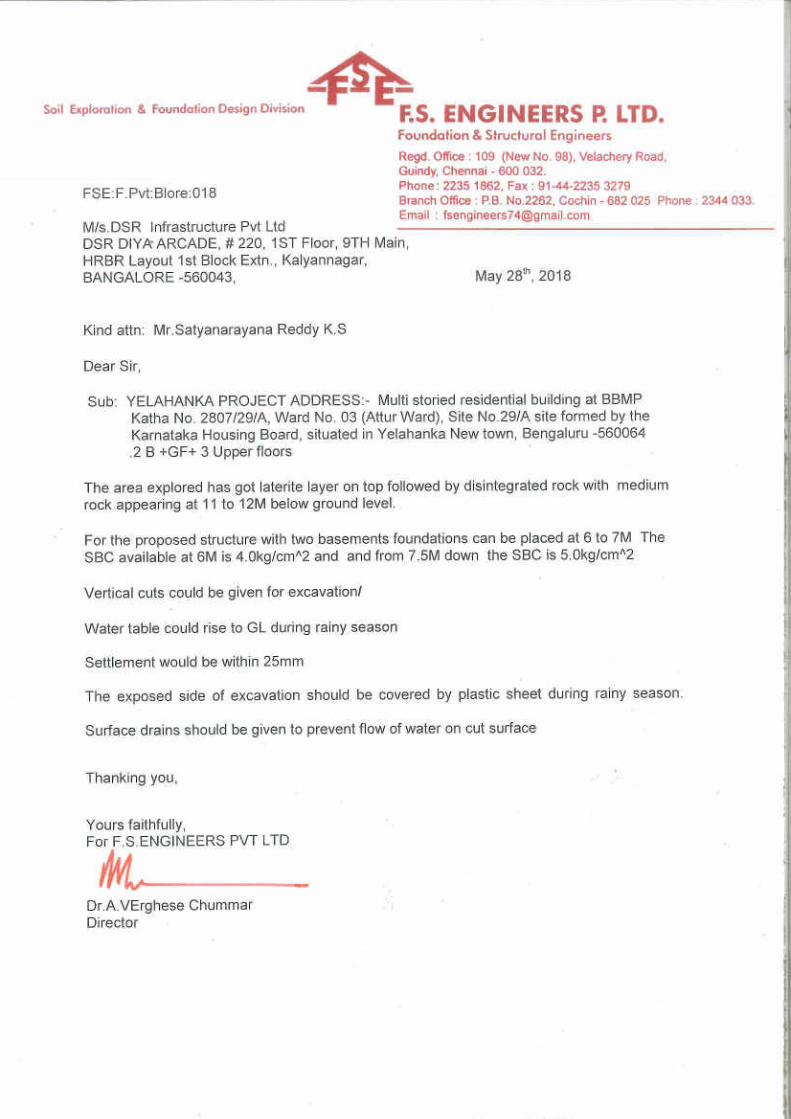

34
Annexure 1(d): Floor wise distribution of Residential Apartment
Sl. No. Floors No. of units
1. Basement 2 00
2. Basement 1 00
3. Ground floor 04 units+ Club
House
4. First floor 16
5. Second floor 16
6. Third floor 16
7. Fourth floor 16
8. Fifth floor 16
9. Sixth floor 16
10. Seventh floor 16
11. Eighth floor 16
12. Ninth floor 16
13. Tenth floor 16
14. Eleventh floor 16
15. Twelfth floor 16
16. Thirteenth floor 16
17. Terrace floor --
Total 212

35
Annexure 1(e): Waste Management
CONSTRUCTION PHASE:
1. SOLID WASTE GENERATION
Construction waste is generated during construction works. It mainly consists
of earth, stones, bricks, inert and non-biodegradable material such as concrete,
plaster, metal, wood, plastics etc & small quantity of domestic solid waste. The
retrievable items such as bricks, wood, metals are recycled; the domestic waste will be
segregated and will not be allowed to mix with construction waste. The construction
earth and other wastes will be used for landscaping within the site premises.
2. DOMESTIC SEWAGE
The domestic sewage generated would be is about 7.1 KLD during construction;
which will be discharged to existing UGD.
OPERATION PHASE:
1. SOLID WASTE GENERATION
The solid wastes generated during operation phase can be categorized under
three groups:
Wet Garbage like Food waste, Lawn mowing wastes etc.
Dry Garbage such as Paper, Plastic, Bottles, etc.
Sludge from Sewage Treatment Plant (STP)
Domestic/Residential Waste:
This category of waste comprises the solid wastes that originate from single and
multi – family household units. These wastes are generated as a consequence of
household activities such as cooking, cleaning, repairs, hobbies, redecoration, empty
containers, packaging, clothing, old books, writing/new paper, and old furnishings.
Households also discard bulky wastes such as furniture and large appliances which
cannot be repaired and used.
Central Pollution Control Board (CPCB) has sponsored a survey to ascertain the
status of municipal solid waste disposal in metro cities, Class-I cities and Class-II

36
towns of India. As per the survey, the per capita generation of solid waste was found to
vary from 0.019 kg/day to 0.747 kg/person/day. A nominal value estimated for
Bengaluru is 0.1 to 0.5 kg/person/day and the same has been considered to estimate
the quantity of domestic solid waste generated due to this proposed project.
The quantity and typical characteristics of domestic solid waste likely to be
generated during operational phase are given in following table. The composition of
garbage in India indicates lower organic matter and high ash or dust contents. It has
been estimated that recyclable content in solid wastes varies from 13 to 20% and
combustible material is about 80-85%.
Quantity and characteristics of Domestic Solid waste
Quantity per day 554 kg
Physical Characteristics Range (% by weight)
Paper 0.81
Plastic 0.5-0.9
Metals 0.3-0.9
Glass 0.3-0.9
Ash, Fine Earth, Stones 25-45
Vegetables, Leaves 40-75
Chemical
Characteristics Range (% by weight)
Moisture content 40-45
Total nitrogen 0.5-0.65
Phosphorous (as P2O5) 0.5-0.85
Potassium (as K2O) 0.7-0.8
Organic matter 32-40
Calorific value (kcal/kg) 800-1050
Source: Nationwide survey sponsored by CPCB to ascertain the status of municipal
solid waste disposal in Indian cities

37
GENERATION:
Sl. No.
Description Population Per capita
considered in kg/Day
Total Waste kg/day
Organic Waste kg/day
In-Organic Waste kg/day
Residential & Club house
1. Residential
Apartment
1060
(212 units
*5persons)
0.5 kg/day/person 530 318 212
2. Club House 159
(15% of Total population)
0.15kg/day/person 24 14 10
Total 554 332 222
STP Sludge 7
The total quantity of solid wastes generated from the proposed project will be
554 kg/day, which will be disposed off safely.
Management:
Biodegradable wastes:
Biodegradable wastes will be segregated at household levels and will be
processed in proposed organic waste converter.
Non-biodegradable Wastes:
The recyclable portion like plastics, glass, metals etc. will be given to the waste
recyclers.
Hazardous wastes like waste oil from DG sets, used batteries etc. will be
handed over to the authorized hazardous waste recyclers.
E-Wastes will be collected separately & it will be handed over to authorized E-
waste recyclers for further processing.

38
2. SEWAGE TREATMENT PLANT
The sewage generated is about 141 KLD, 90% of the domestic water
requirement. This sewage will be treated in a Sewage Treatment Plant with designed
capacity of 145 KLD using Sequential Batch Reactor Technology. Sufficient area for
this plant has been earmarked in the layout plan. The treated water will be utilized for
secondary purposes like gardening & for flushing.
Following is the treatment scheme for 145 KLD of sewage. Various treatment
units which have been envisaged in this sewage treatment plant are explained below.
Table: Raw Sewage Characteristics
pH 6-8.5
Suspended Solids 150 mg/L
BOD5 250-300 mg/L
COD 400-600 mg/L
Oil & Grease 5 – 10 mg/L
NH4-N 20 mg/L
N- Total 30 mg/L
Treatment Methodology:
The methodology adopted for treatment of domestic sewage is based on
Sequencing Batch Reactor (SBR) Technology and preliminary treatment for screening,
followed with tertiary treatment by filtration & disinfection.
The system is designed for operating up to a maximum of 3 cycles in 24 hours
period.
DESIGN:
1. Bar Screen Chamber:
The floating and suspended matter is removed in this unit. The Bar rack with
following dimensions will be provided to reduce the load on the subsequent treatment
units.
Velocity: 0.6 m/s
Angle of Inclination: 60 degree.
Size: 0.6 m X 1.5 m X 1.0 m

39
2. Equalization Unit:
This unit acts as both collection sump and equalization unit. In this, flow will
be equalized to have a uniform concentration.
Design:
Flow - 145m3/day
Average flow hour - 145/17 = 8.53 m3/hr
Provided equalization tank with a HRT of 8 hours (holding tank)
Volume required - (145/17)*8 = 68.23 m3
Provided a tank of 70,000 Lt. Capacity
Tank dimensions - 3.8m X 3.7m X 5.0m
Free board - 0.5 m
3. Sequencing Batch Reactor:
A sequencing batch reactor (SBR) is a Fill – and – Draw Activated – Sludge
treatment system. The unit processes involved in the SBR and conventional activated
– sludge systems are identical. Aeration and sedimentation /clarification are carried
out in both systems. However, there is one important difference. In conventional
plants, the processes are carried out simultaneously in separate tanks, whereas in
SBR operation the processes are carried out sequentially in the same tank.
Process Description:
As currently used, all SBR systems have five steps in common that are carried
out in sequence as follows:
1. Fill
2. React (aeration)
3. Settle (sedimentation/clarification
4. Draw (decant)
5. Idle
Sludge wasting is another important step in the SBR operation that greatly
affects performance. Wasting is not included as one of the five basic process steps
because there is no set time period within the cycle dedicated to wasting. The amount
and frequency of sludge wasting is determined by performance requirements, as with a
conventional continuous – flow system. In a SBR operation, sludge wasting usually
occurs during the settle or idle phases. A unique feature of the SBR system is that

40
there is no need for a return activated – sludge (RAS) system. Because both aeration
and settling occur in the same chamber, no sludge is lost in the react step, and none
has to be returned from the clarifier to maintain the sludge content in the aeration
chamber.
Design:
Average Flow - 145m3/day
Average BOD Load - 36kg/day
No of tanks - 1 No
Fill time - 4 hr
React time - 3 hr
Total aeration time - 5 hr
Settle time - 0.5 hr
Decant Time - 0.5 hr
Cycle Time - 8 hr
Total SRT - 17 d
Tank Volume - 81 m3
Size of the tank - 4.5m X 4.5m X 4m
Fill Volume/Cycle - 48.3 m3
Fill Volume/tank volume - Ratio 0.6
Decant depth - 2.4 m
MLSS - 4000 mg/l
F/M - 0.07
Volumetric BOD load - 0.45kg/m3.d
Decant pumping rate - 1.61m3/min
Total aeration time/d-tank - 15 hr
Average O2 transfer rate - 3.8 kg/h
4. Decant Tank:
Design:
Flow - 145m3/ day
Average Flow - 18 hr
Detention Time - 6 hr

41
Volume required - (145/18)*6 = 48.33 m3
Tank demission - 3.5m X 3.5m X 4.0m
Free board - 0.5 m
5. Filter Press:
The sludge from the SBR tank is dewatered using Filter press.
Capacity - 10.0 cum/day
No. - 1
M.O.C - Mechanical
6. Sludge Collection Tank:
Design:
Flow - 145m3/ day
Average Flow - 18 hr
Detention Time - 6 hr
Volume required - (145/18)*6 =48.33m3
Tank demission - 3.5m X 3.5m X 4.0m
Free board - 0.5 m
7. Pressure Sand Filter & Activated Carbon Filter:
It is used to remove the minute suspended solids, including escape particulate
BOD from SBR tank.
Total flow = 145 m3/day
* Duration of pumping assumed = 12 hr/day
* Pumping rate = 12.1m3/hr
* Surface loading considered = 10 m3/ m2/hr
* Area of filter required = 1.2 m2
* Diameter of filter required = 1.3 m
* Number of sand filters = 1
* Number of carbon filters = 1
* Height of shell = 1.0 m
* Media for sand filter : Pebbles, grit, silt, gravel, and coarse & fine sand.
* Media for Carbon filter : Pebbles, gravel and activated carbon.

42
8. Chlorination:
Chlorinator Tank of 100 Liters capacity with 4–6 LPM Pump shall be
incorporated to disinfect the treated water.
9. Treated Water Sump:
To collect filtered effluent and facilitates to pump garden and other purposes.
Design:
Flow - 145m3/ day
Average Flow - 18 hr
Detention Time - 6 hr
Volume required - (145/18)*6 = 48.33 m3
Tank demission - 3.5m X 3.5m X 4.0m
Free board - 0.5 m
The STP specifications are summarized in the following Tables
Table: List of Civil Structures
The treated sewage characteristics are given in the following Table.
Table: Sewage Characteristics after Treatment
Parameters Standards
pH 6-9.0
BOD5 <10 mg/L
COD <50 mg/L
TSS <20 mg/L
NH4-N < 5 mg/L
N-Total < 10 mg /L
Turbidity < 2 NTU
Fecal Coliform < 100 MPN/100mL
The flow diagram of the STP based on SBR Technology is depicted below
Sl. No. Unit name Dimension of Unit Unit in Nos.
1. Bar Screen Chamber 0.6m X 1.5m X 1.0m 1 No.
2. Equalization tank 3.8m X 3.7m X 5.0m 1 No.
3. SBR tank 4.5m X 4.5m X 4.0m 1 No.
4. Decant tank 3.5m X 3.5m X 4.0m 1 No.
5. Sludge Collection Tank 3.5m X 3.5m X 4.0m 1 No.
6. Treated water sump 3.5m X 3.5m X 4.0m 1 No.

43
FLOW SHEET OF SEWAGE TREATMENT PLANT
Raw Sewage Bar Screen Chamber
Equalization Tank
SBR
Tank
Decant Tank
Sludge
Filter Press Sludge for
manure
Extracted water
Pressure Sand Filter
Activated Carbon Filter
Treated Water Tank
For Flushing, Gardening, Vehicle washing and common
area floor washing
Chlorine Dosing
Backwash

44
Annexure 1(f): Traffic volume

PREPARED BY,
M/s. CONSORTIA OF INFRASTRUCTURE ENGINEERS
VIJAYANAGAR, BENGALURU-40
EMAIL: [email protected]
TRAFFIC IMPACT ASSESSMENT STUDIES
FOR
PROPOSED RESIDENTIAL DEVELOPMENT
AT
YELAHANKA, DODDABALLAPURA ROAD
BANGALORE NORTH TALUK,
BANGALORE.

TIA
Before Const
During Const
Traffic Projection
After Const
Road Geometrics
Road Connectivity
Speed
Impact in V/C &
LoS
Addition Trucks
(const materials)
Requirements for
operation
Traffic data from tpt. dept
Mathematical Modeling
IRC Method for Projection
Projected Traffic
V/C & LoS
Modified
scenario
of V/C &
LoS
Parking
Traffic
Flow
Logistics
Impact
Changed
Scenario
if any for
reduction
in V/C
&LoS
Traffic
Mgm
measure
TRAFFIC IMPACT STUDIES
Traffic Volume V/C & LoS

Project Site
GOOGLE MAP

Project Site
LOCATION PLAN

SITE PLAN

Project site is located along Doddaballapura road near Rail wheel factory.
Doddaballapura road is 30.1 m RoW with (3+3) lanes CW which connects to
Doddaballapura on one side and Yelahanka on another side.
As per BDA-CDP/ NHAI, Doddaballapura road is gett ing widened to 45 m, (3+3) lanes
MCW, (2+2) lanes SR, Footpath,Drainage etc….With area separator & median.
Being a national highway, all type of vehicles including trucks will use the same RoW
way.
The project can also be accessed from other places of Bangalore city such as Yelahanka,
Ramagondanahalli ,Govindapura,NH-7, Jalahalli etc.,
However the entire traffic generated from the project will falls to Doddaballapura road.
ROAD CONNECTIVITY

Road
ROW(m)
Pavement
Surface
Condition
Street
lights
Drainage
in mRoad
RemarksCW (m)
L R Marking SignsLanes
Shoulder
Doddaballapura
Road
(3+3 lanes
divided)
30.1
Good A5 m
FCD
5 m
FCDA A -
10+10
3+3
-
ROAD GEOMETRIC SCENARIO
Note: A – Available NA – Not Available

PHOTOS OF STUDY ROADS DATE:19/05/2018
Doddaballapur
Doddaballapur roadYelahanka
Doddaballapura
Doddaballapura road (3+3lanes divided) Doddaballapura road (3+3lanes divided)
Doddaballapura road (3+3lanes divided) Doddaballapura road (3+3lanes divided)
Yelahanka
Doddaballapura
Yelahanka
Yelahanka

Road Towards
2 Wh 3 Wh4 Wh
(C,J,V)
Buses/
LorriesTrucks
Ma
xMin
Ma
xMin
Ma
xMin
Ma
xMin
Ma
xMin
Doddaballap
ur Road
(3+3 lanes
divided)
Doddaballa
pur58 51 26 18 64 52 36 22 46 38
Yelahanka 47 42 20 14 55 40 28 17 42 34
SPEED SPECTRUM MEASURED FOR THE STUDY ROAD (KMPH)

Time 2Wh 3Wh 4Wh B/L Trucks Total V/C
7:00-8:00 am 187 (94) 21 (16) 79 (79) 25 (75) 8 (32) 320 (295) 0.09
8:00-9:00 am 268 (134) 29 (22) 105 (105) 42 (126) 12 (48) 456 (435) 0.13
9:00-10.00 am 379 (190) 33 (25) 216 (216) 56 (168) 14 (56) 698 (654) 0.20
10:00-11:00
am404 (202) 56 (42) 172 (172) 88 (264) 25 (100) 745 (780) 0.24
4:00-5:00 pm 225 (113) 17 (13) 86 (86) 31 (93) 10 (40) 369 (344) 0.10
5:00-6:00 pm 458 (229) 62 (47) 160 (160) 72 (216) 17 (68) 769 (720) 0.22
6:00-7:00 pm 320 (160) 59 (44) 186 (186) 63 (189) 28 (112) 656 (691) 0.21
7:00-8:00 pm 281 (141) 47 (35) 143 (143) 51 (153) 34 (136) 556 (608) 0.18
REAL TIME TRAFFIC SCENARIO ALONG DODDABALLAPUR ROAD
TOWARDS DODDABALLAPURA (3-LANES)
Note: The highest peak observed is 780 PCU’s/hr as per IRC-106:1990 dur ing 10:00 am to
11:00 am
The traffic projections are made as per IRCconsidering the vehicular growth taking place from past
5 years.

VEHICLE COMPOSITION AND TRAFFIC FLOW DISTRIBUTION ALONG
DODDABALLAPUR ROAD TOWARDS DODDABALLAPURA (3-LANES)
2Wh
54%
3Wh
8%
4Wh
23%
B/L
12%
Trucks
3%
295435
654780
344
720 691608
0
200
400
600
800
1000
7.00-8.00 am 8.00-9.00 9:00-10:00 10:00-11:00 4:00-5:00 pm 5:00-6:00 6:00-7:00 7:00-8:00
PC
U's
/hr
TIME

0.09
0.13
0.20
0.24
0.10
0.22 0.210.18
0.00
0.05
0.10
0.15
0.20
0.25
7.00-8.00 am 8.00-9.00 9:00-10:00 10:00-11:00 4:00-5:00 pm 5:00-6:00 6:00-7:00 7:00-8:00
V/C
Time
VARIATION OF V/C OVER STUDY PERIOD

Note: The highest peak observed is 1406 PCU’s/hr as per IRC-106:1990 dur ing 5:00 pm to 6:00 pm.
REAL TIME TRAFFIC SCENARIO ALONG DODDABALLAPUR ROAD
TOWARDS YELAHANKA (3-LANES)
Time 2Wh 3Wh 4Wh B/L Trucks Total V/C
7:00-8:00 am 286 (143) 24 (18) 135 (135) 67 (201) 11 (44) 523 (541) 0.16
8:00-9:00 am 327 (164) 37 (28) 182 (182) 138 (414) 14 (56) 698 (843) 0.26
9:00-10.00 am 578 (289) 48 (36) 246 (246) 86 (258) 17 (68) 975 (897) 0.27
10:00-11:00
am490 (245) 64 (48) 405 (405) 142 (426) 22 (88) 1123 (1212) 0.37
4:00-5:00 pm 304 (152) 32 (24) 339 (339) 73 (219) 27 (108) 775 (842) 0.26
5:00-6:00 pm648
(324)54 (41) 467 (467) 130 (390) 46 (184) 1345 (1406) 0.43
6:00-7:00 pm 536 (268) 33 (25) 496 (496) 105 (315) 53 (212) 1223 (1316) 0.40
7:00-8:00 pm 487 (244) 28 (21) 384 (384) 94 (282) 64 (256) 1057 (1187) 0.36

VEHICLE COMPOSITION AND TRAFFIC FLOW DISTRIBUTION ALONG
DODDABALLAPUR ROAD TOWARDS YELAHANKA (3-LANES)
2Wh
48%
3Wh
4%
4Wh
35%
B/L
10%
Trucks
3%
541
843 897
1212
842
1406 13161187
0
200400
600
8001000
1200
14001600
7.00-8.00
am
8.00-9.00 9:00-10:00 10:00-11:00 4:00-5:00
pm
5:00-6:00 6:00-7:00 7:00-8:00
PC
U's
/hr
TIME

0.16
0.260.27
0.37
0.26
0.43 0.400.36
0.00
0.05
0.10
0.15
0.20
0.25
0.30
0.35
0.40
0.45
7.00-8.00 am 8.00-9.00 9:00-10:00 10:00-11:00 4:00-5:00 pm 5:00-6:00 6:00-7:00 7:00-8:00
V/C
Time
VARIATION OF V/C OVER STUDY PERIOD

Road Towards V C Existing V/C LOS
Doddaballapur
Road
(3+3 lanes divided)
Doddaballapur 780 3300 0.24 B
Yelahanka 1406 3300 0.43 C
V/C LOS Performance
0.0 - 0.2 A Excellent
0.2 - 0.4 B Very Good
0.4 - 0.6 C Good
0.6 - 0.8 D Fair/Average
0.8 - 1.0 E Poor
1.0& Above F Very Poor
REAL TIME TRAFFIC SCENARIO FOR STUDY ROADS
V= Volume in PCU’s/hr, C= Capacity in PCU’s/ hr, LOS = Level of Service
Note: IRC is accepting the fact that , in Indian roads the real congestion star ts when V/ C ratio is >1, i.e., for
forced flow. Till this limit the road is free for traffic movement without any impediments. Hence it is
acceptable as normal upto V/ C =1 and the per formance will be taken as good only.

The addition of 8 Lorr ies per day carrying construction vehicle do not change any
significantly the traffic flow. Hence OK.
V/ Cdur ing construction (Lor r ies) = 0.24, 0.43.
The present level of service will remain “B & C” along Doddaballapura Road towards
Doddaballapur and Yelahanka respectively.
Number of trucks coming to the site (Off peak hours).
Day time –8 no’s.
The addit ion do not make any significant change for traffic movement at any given time.
Vehicles car rying construction mater ials will be well covered to prevent any spillage.
Vehicles hired for construction mater ial will be in good condit ion and conforms to noise
and air emission standards.
Vehicles will operate only dur ing non peak hours.
DURING CONSTRUCTION

Type No. of Units No. of Cars Per UnitTotal
Nos
Residential
212No. of units B/ W 50
to 225 Sqm212
Visitor ’s car parking (10%) 21
Club House (845.12
sqmt) 1 car / 50sqmt 17
Total no. of car parking required (Including visitor parking) 250
Parking provided 251
PARKING LOGISTICS

FLOW CHART OF TRAFFIC/ TRIPS DISTRIBUTION
From project
100 %
To Doddaballapura Road
40%
To Yelahanka
60 %
Doddaballapura Road
100 %
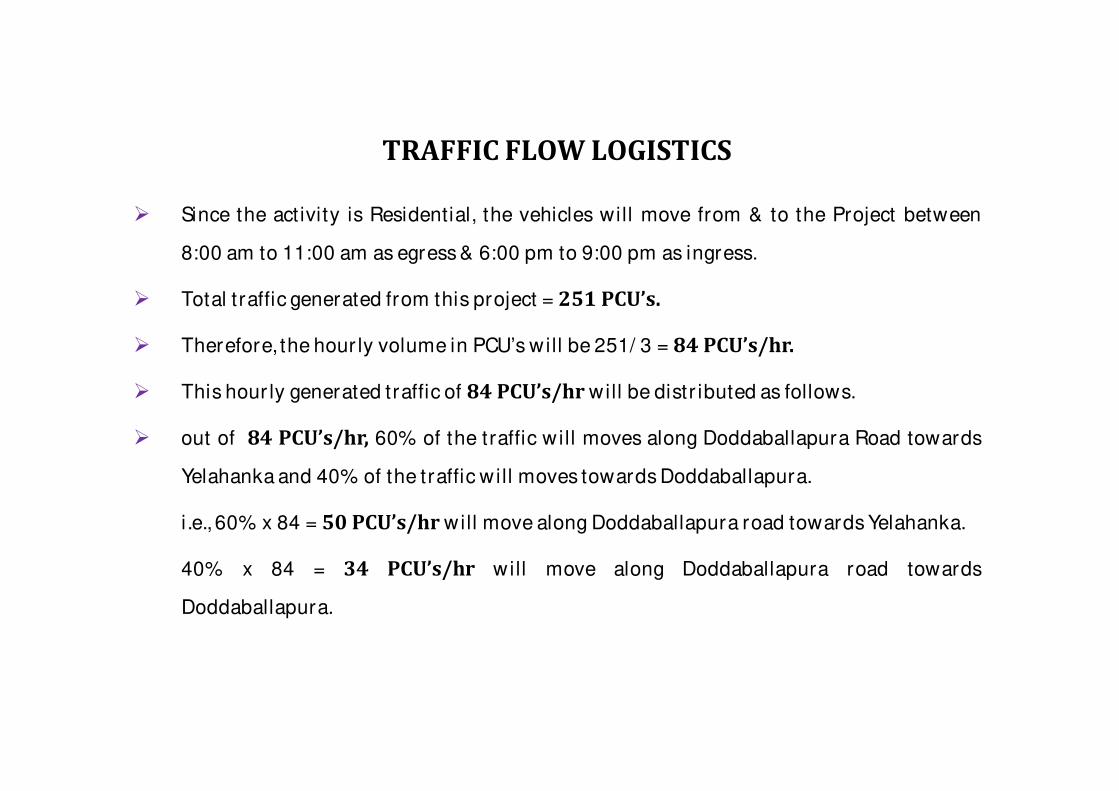
TRAFFIC FLOW LOGISTICS
Since the activity is Residential, the vehicles will move from & to the Project between
8:00 am to 11:00 am as egress & 6:00 pm to 9:00 pm as ingress.
Total traffic generated from this project = 251 PCU’s.
Therefore, the hour ly volume in PCU’s will be 251/ 3 = 84 PCU’s/hr.
This hour ly generated traffic of 84 PCU’s/hr will be distr ibuted as follows.
out of 84 PCU’s/hr, 60% of the traffic will moves along Doddaballapura Road towards
Yelahanka and 40% of the traffic will moves towards Doddaballapura.
i.e.,60% x 84 = 50 PCU’s/hr will move along Doddaballapura road towards Yelahanka.
40% x 84 = 34 PCU’s/hr will move along Doddaballapura road towards
Doddaballapura.

Road Towards
Existing scenario Modified traffic scenario
V C V/C LOS V V/C LOS
Doddaballap
ur Road
(3+3 lanes
divided)
Doddaballapur 780 3300 0.24 B780+34
= 8140.25 B
Yelahanka 1406 3300 0.43 C1406+50 =
14560.44 C
MODIFIED V/C AND LOS AFTER ADDING GENERATED
TRAFFIC TO EXISTING TRAFFIC

PEDESTRIAN FLOW MANAGEMENT & SAFETY
Pedestr ians are considered as most Vulnerable Road Users (VRU) as the accidents are
increasing on pedestr ians. Hence pedestr ians safety must be considered as top pr ior ity
in traffic engineer ing.
As per IRC, a minimum of 1.8 m wide neatly paved, well i lluminated and leveled footpath
must be made available for pedestr ians.
The under ground drain is covered by slabs and used for pedestr ian movement .
Presently due to very less pedestr ians use the footpath being a highway, hence they are
very safe.
30.1 m wide road is gett ing widened to 45 m as said ear lier and Exist ing footpath will be
continued
This width can accommodate more than 5040 ped/ hr in each direction of footpath
being more than 5m wide.

RECOMMENDED PEDESTRIAN SIDE WALK CAPACITY AND
LEVEL OF SERVICE (IRC 103-2012)
Width of side
walk in
(meter)
Design Flow in number of Person per hour
In Both Direction All in one direction
LOS B LOS C LOS B LOS C
1.8 1350 1890 2025 2835
2.0 1800 2520 2700 3780
2.5 2250 3150 3375 4725
3.0 2700 3780 4050 5670
3.5 3150 4410 4725 6615
4.0 3600 5040 5400 7560
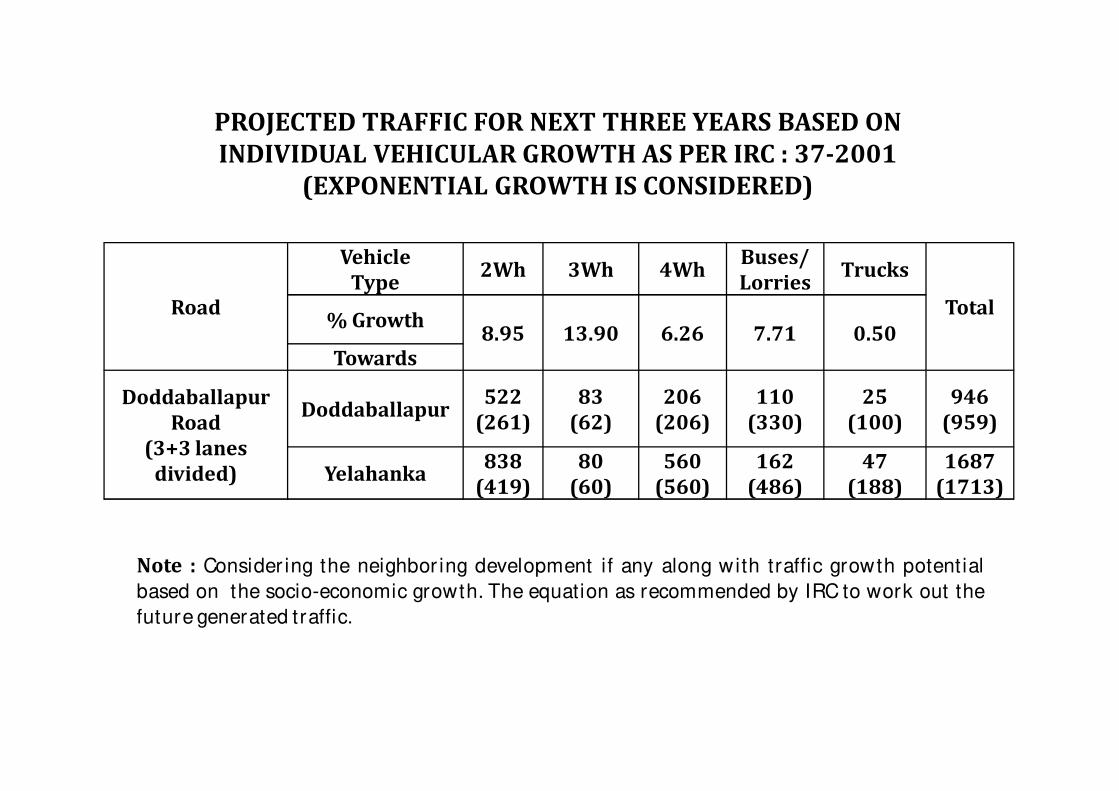
PROJECTED TRAFFIC FOR NEXT THREE YEARS BASED ON
INDIVIDUAL VEHICULAR GROWTH AS PER IRC : 37-2001
(EXPONENTIAL GROWTH IS CONSIDERED)
Road
Vehicle
Type2Wh 3Wh 4Wh
Buses/
LorriesTrucks
Total% Growth
8.95 13.90 6.26 7.71 0.50Towards
Doddaballapur
Road
(3+3 lanes
divided)
Doddaballapur522
(261)
83
(62)
206
(206)
110
(330)
25
(100)
946
(959)
Yelahanka838
(419)
80
(60)
560
(560)
162
(486)
47
(188)
1687
(1713)
Note : Consider ing the neighbor ing development if any along with traffic growth potential
based on the socio-economic growth. The equation as recommended by IRC to work out the
future generated traffic.

MODIFIED V/C & LOS
Road Towards
Projected Traffic for next
Three years
Modified V/C and LOS after
adding the generated traffic
V C V/C LOS V C V/C LOS
Doddaballapur
Road
(3+3 lanes
divided)
Doddaballapur 959 3300 0.29 B959+34 =
9933300 0.30 B
Yelahanka 1713 3300 0.52 C1713+50
= 17633300 0.53 C

BDA-CDP MAP
Project site
PROJECT
SITE

CHANGED SCENARIO-1 (ROAD WIDENING)
Note: As per BDA-CDP map, Doddaballapur road is getting widened to 45m from 30.1 m with
6 lanes main CW (3+3) lanes, 2 lane Service road on both direct ion, with central
median, footpath, shoulder etc with total of 5 lanes on each side.
Road Towards
Modified V/C and LOS after
adding the generated traffic
Changed scenario-1 after
Road widening
V C V/C LOS V C V/C LOS
Doddaballap
ur Road
Doddaballapur 993 3300 0.30 B 993 5500 0.18 A
Yelahanka 1763 3300 0.53 C 1763 5500 0.32 B

CONSOLIDATED V/C AND LEVEL OF SERVICE FOR
CHANGED SCENARIOS
Road Towards
Existing
traffic
scenario
Changed
V/C and
LOS by
adding
generated
traffic
Projected
traffic after
Three years
Modified
V/C and
LOS by
adding the
generated
traffic
Changed
Scenario -1,
After Road
Widening
V/C LOS V/C LOS V/C LOS V/C LOS V/C LOS
Doddaballa
pur road
Doddaballapur 0.24 B 0.25 B 0.29 B 0.30 B 0.18 A
Yelahanka 0.43 C 0.44 C 0.52 C 0.53 C 0.32 B

TRAFFIC AND PEDESTRIAN MANAGEMENT IN FRONT OF
THE PROJECT SITE (EXISTING)

TRAFFIC AND PEDESTRIAN MANAGEMENT IN FRONT
OF THE PROJECT SITE (AFTER WIDENING)

TRAFFIC MANAGEMENT MEASURES & INTERVENTIONS
As per CDP map, Doddaballapura road is gett ing widened to 45 m from 24 m with 6
lanes main CW (3+3 lane), 2 lane Service road (with total of 5 lanes) on both direction,
with central median, footpath, shoulder etc
All precautionary measures are ensured for the safety of construction laborers while
working at the site.
Adequate sign & guide posts for traffic as per IRC (Indian Roads Congress) or ITE
(Instituteof Transpor tation Engineers USA) to be installed along the study roads.
Road marking (edge markings in yellow and lane markings in broken white), STOP lines
etc must be clear ly painted so as to guide the dr ivers along the study Roads.
45
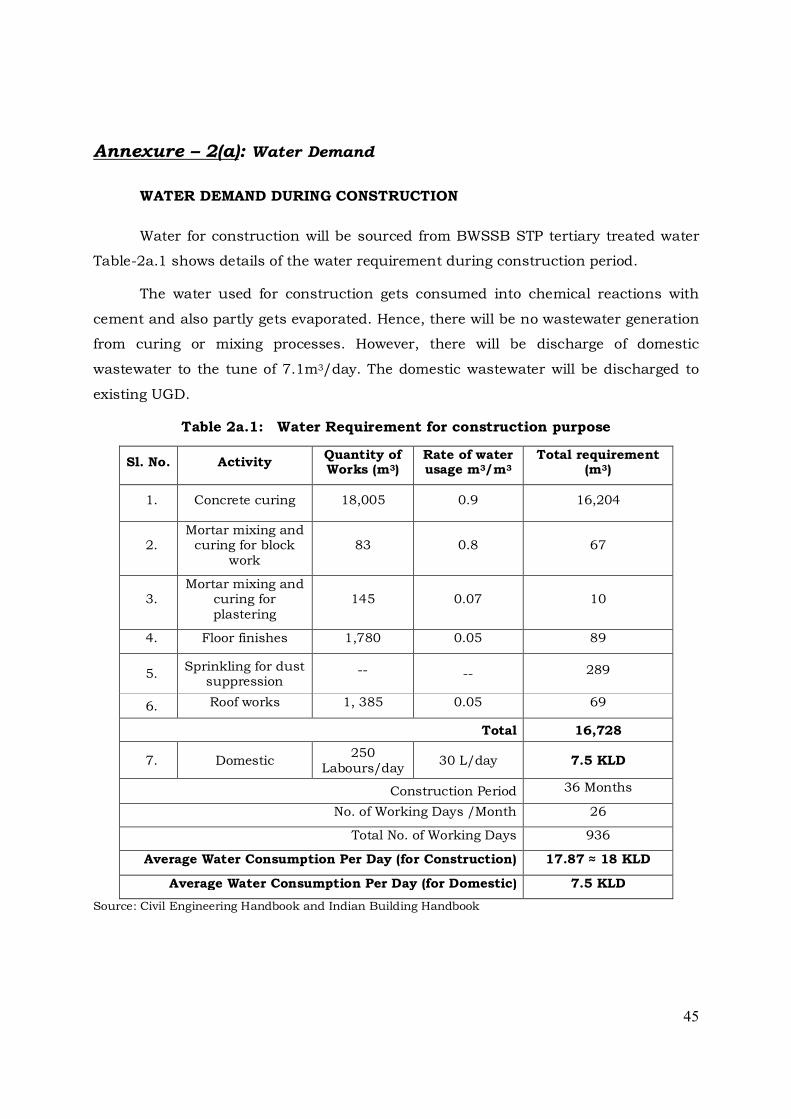
Annexure – 2(a): Water Demand
WATER DEMAND DURING CONSTRUCTION
Water for construction will be sourced from BWSSB STP tertiary treated water
Table-2a.1 shows details of the water requirement during construction period.
The water used for construction gets consumed into chemical reactions with
cement and also partly gets evaporated. Hence, there will be no wastewater generation
from curing or mixing processes. However, there will be discharge of domestic
wastewater to the tune of 7.1m3/day. The domestic wastewater will be discharged to
existing UGD.
Table 2a.1: Water Requirement for construction purpose
Sl. No. Activity Quantity of Works (m3)
Rate of water usage m3/m3
Total requirement (m3)
1. Concrete curing 18,005 0.9 16,204
2. Mortar mixing and
curing for block work
83 0.8 67
3. Mortar mixing and
curing for plastering
145 0.07 10
4. Floor finishes 1,780 0.05 89
5. Sprinkling for dust
suppression -- -- 289
6. Roof works 1, 385 0.05 69
Total 16,728
7. Domestic 250
Labours/day 30 L/day 7.5 KLD
Construction Period 36 Months
No. of Working Days /Month 26
Total No. of Working Days 936
Average Water Consumption Per Day (for Construction) 17.87 ≈ 18 KLD
Average Water Consumption Per Day (for Domestic) 7.5 KLD
Source: Civil Engineering Handbook and Indian Building Handbook

46
WATER REQUIREMENT DURING OPERATION
Sources of Water:
The water will be sourced from the BWSSB. The detailed total water
requirement, based on the number of residential units and other facilities to be
provided, during operation phase is estimated as in below Table 2a.2.
Table 2a.2: Water Requirement Break up
The total water requirement for the project during operation phase is around
157 KLD. It is proposed to use the treated sewage for secondary purposes such as
toilet flushing to the amount of 54KLD. Hence, the net fresh water demand would be
about 103 KLD which will be supplied by BWSSB. During the rainy season the net
Sl. No. Purpose Particulars Total in KLD
I. Total Water Requirement 212 units x 5 Personnel x
135 LPCD 143
II.
Total Water Requirement for club House
(Considering 15% of total population – 159Nos.)
159 Personnel x 45 LPCD 7
III. Total Water Requirement for Maintenance Staff & visitors
159 Personnel x 45 LPCD 7
Total Water Requirement 157
1. Fresh water requirement for units 212 units x 5 Personnel x
90 LPCD 95
2. Fresh Water Requirement for club
House 159 Personnel x 25 LPCD 4.0
3. Fresh Water Requirement for
Maintenance Staff & visitors 159 Personnel x 25 LPCD 4.0
Net Domestic Water Requirement 103
1. Recycled Water for flushing 212 units x 5 Personnel x
45 LPCD (-) 48
2. Club House – Recycled Water for
flushing 159Personnel x 20 LPCD (-) 3
3. Maintenance Staff & visitors - Recycled Water for flushing
159 Personnel x 20 LPCD (-) 3
Total Flushing Water Requirement (-) 54
Total Water Requirement = 157 KLD

47
fresh water requirement will be fulfilled by harvested roof rain water. Water balance
chart during the operation phase is shown in the Fig. 2a.1.
Fig. 2a.1: WATER BALANCE CHART
Total Water Demand For
Entire Project
157 KLD
Sewage Generated @ 90%
141 KLD
STP Capacity –
145 KLD
Excess to Construction
works/Avenue plantation
- 57 KLD
Rec
yclin
g w
ater
Vehicle Cleaning
Purpose -8KLD
Floor Washing
Purpose - 3 KLD
STP Treated Water
141 KLD
For Landscaping
– 19 KLD
D
Fresh
Water
103 KLD Flushing
Water 54 KLD
BWSSB /
Harvested Roof Rain
water during the Rainy
season

48
Annexure 2(b):
Construction Material Resources Requirement
Annexure 5(a):
Emission load from DG set and construction equipments during
construction phase using HSD
Pollutant
Concrete
Mixers
(2 x 3.73
kW/Hr)
Concrete
Pump
(2 x 44.74
kW/Hr)
JCB
Excavator
(1 x 50
kW/Hr)
D G Set
(40kW/Hr)
Earth
Rammers
(1x3.75
kW/Hr)
NOx (@9.2 g/
KW-hr) 68.63 823.21 460 368 34.5
PM (@0.3 g /
KW-hr) 2.24 26.84 15
12 1.12
HC (@1.3 g /
KW-hr) 9.70 116.32 65
52 4.875
CO (@3.5 g /
KW-hr) 26.11 313.18 175 140 13.125
Sl. No. DESCRIPTION UNIT QUANTITY
1. Cement Bags 1,76,170
2. Ready mix concrete CMT 13,009
3. Sand CMT 13,822
4. Aggregates CMT 15,305
5. Steel MT 2,238
6. Solid Blocks Nos. 2,83,704
7. Flush shutter SMT 2,550
8. Glass SMT 3,241
9. Vitrified Tiles SMT 24,250
10. Glazed Tiles SMT 8,360
11. Aluminium KGS 29,550
12. Roof installation Brick Batcoba SMT 17,618

49
Annexure 5(b):
Emission Parameters of the Air Pollution Sources during operation
Sl. No. Stack Details DG sets
(750 KVA- 2No)
1. No. of Stacks (DG Sets) 1
2. Stack height (m) 5.5 m (ARL)
3. Stack top internal diameter (m) 0.2
4. Stack exit temperature (ºC) 536
5. Flow rate (cum/sec) 1.98
6. Stack exit velocity (m/sec) 28.05
7. NO2 emission, in g/s 3.06
8. SPM emission, in g/s 0.10
9. HC emission, in g/s 0.44
10. CO emission, in g/s 1.16
11. SO2 emission, in g/s 0.7
Annexure – A2 (a): Rainwater Harvesting Facilities
As the growth of Bengaluru city is far ahead of the rate at which the water
supply system is being upgraded, it becomes necessary to think of alternative source
of water for the daily needs for secondary purposes like washing, gardening etc. In
these lines, rain water harvesting is gaining importance and has been a part of
building by-laws.
As the project location is blessed with fairly good rainfall, it is planned to collect
the storm water at different gradients of the location. There will be rainfall runoff from
building roof-tops, roads and pavements and greenbelt area. Necessary provision will
be made to collect the quantity of rainfall runoff during the most rainy day of season.
Necessary rain harvesting pit / recharge pit at regular intervals have been envisaged.
The facilities to be established for rainwater harvesting include carriage (piping)
system, pre-treatment unit (filtration) and a storage tank.

50
Design details:
Rational formula for calculating runoff: Q= (CIA)/360
Q = Runoff in m3/sec
I = Intensity of rainfall in mm/hr.
A= Area in sqmt.
C = Co – efficient of run off as below
Intensity of rain fall = 80 mm/ hr
Runoff Coefficients:
Roof top : 1.0
Landscape/Garden : 0.3
Drive Way : 0.6
Total Roof Area : 1991.85 Sqm
Path way/road area : 2795.47 Sqm
Landscape : 2349.99 Sqm
Terrace Area Run-off:
Runoff = Q = (Terrace Area * Intensity of rain fall * Co-efficient of runoff)
(1991.85 Sqm * 0.04 m *1) = 79.67 say 80 cum
Roof rain water collection sump of capacity 100 cum will be provided and same
will be utilized for domestic purpose after prior treatment.
Total Run-off from Hardscape & driveway:
I = Intensity of rainfall : 0.04 m
A = Drive way area : 2795.47 Sqm
C = Co – efficient of runoff : 0.6
Q = Runoff = 0.6 X 0.04 X 2795.47 = 67.09 say 67 cum
Total Run-off from Landscape Area:
I = Intensity of rainfall : 0.04 m
A = Landscape area : 2349.99 Sqm
C = Co – efficient of runoff : 0.3
Q = Runoff = 0.3 X 0.04 X 2349.99 = 28.19 say 28cum
51
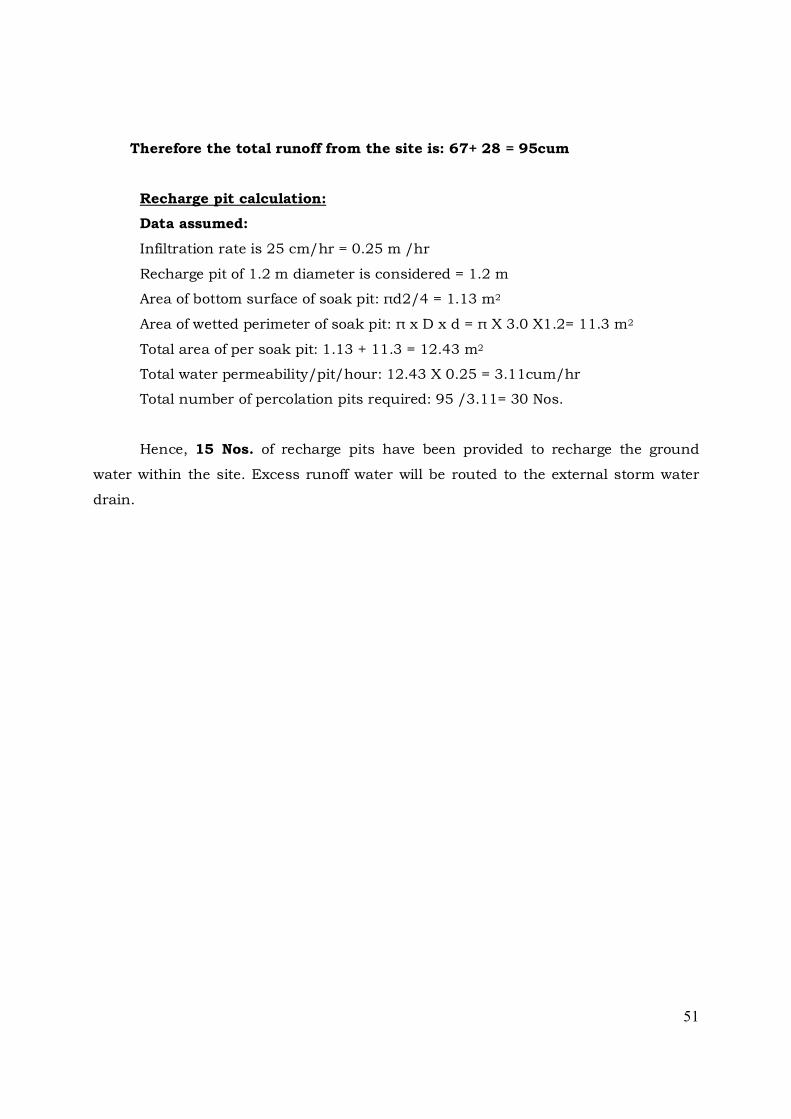
Therefore the total runoff from the site is: 67+ 28 = 95cum
Recharge pit calculation:
Data assumed:
Infiltration rate is 25 cm/hr = 0.25 m /hr
Recharge pit of 1.2 m diameter is considered = 1.2 m
Area of bottom surface of soak pit: πd2/4 = 1.13 m2
Area of wetted perimeter of soak pit: π x D x d = π X 3.0 X1.2= 11.3 m2
Total area of per soak pit: 1.13 + 11.3 = 12.43 m2
Total water permeability/pit/hour: 12.43 X 0.25 = 3.11cum/hr
Total number of percolation pits required: 95 /3.11= 30 Nos.
Hence, 15 Nos. of recharge pits have been provided to recharge the ground
water within the site. Excess runoff water will be routed to the external storm water
drain.

52
Annexure A3: List of Species Proposed
List of Shrubs & Ground Covers Proposed For Landscape
Sl. No Name of the Shrubs Ground Covers
1. Acalypha wilkesiana Alternanthera green
2. Allamanda yellow Bamboo grass veriegatted
3. Antigonon leptopus Belbergia
4. Cassia alata Cupeas purple
5. Hamelia patens Eranthemum nigram
6. Ixora coccinea Hemigraphis colorata
7. Murraya exotica Mentha spp
8. Nerium oleader Ocimum basilium
9. Pissonia alba Opiophogan green
10. Plumbago capensis Salvia officianalis
Sl.
No.
Name of the Species Common name In Nos.
Shading trees
1 Terminalia arjuna Arjuna tree 5
2 Pongamia pinnata Honge 5
3 Azadiracta Indica Neem Tree 5
Flowering trees
4 Bauhinia purpurea Purple camel’s foot 10
5 Cassia spectabilis Scented shower 10
6 Millingtonia hortensis Indian cork tree 10
7 Michelia champaca Champaka tree 10
8 Plumeria rubra Temple Tree 10
9 Plumeria alba Caterpillar tree 10
10 Erythrina indica Indian coral tree 10
Fruit bearing trees
11 Phyllanthus emblica Indian gooseberry 5
12 Syzygium cumini Nerale 5
13 Psidium guajava Guava 10
14 Mangifera indica Mavu 10
15 Syzygium jambos Pannerale 5
16 Annona squomosa Custard apple 5
Total 125

53
Annexure 10: ENVIRONMENTAL MANAGEMENT PLAN
10.1 INTRODUCTION
The Environmental Management Plan (EMP) is aimed at mitigating the possible
adverse impact of a project and ensuring the existing environmental quality. The EMP
converse all aspects of planning, construction and operation of the project relevant to
environment. It is essential to implement the EMP right from the planning stage
continuing throughout the construction and operation stage. Therefore the main
purpose of the Environmental Management Plan (EMP) is to identify the project
specific activities that would have to be considered for the significant adverse impacts
and the mitigation measures required.
The construction phase impacts are mostly short term, restricted to the plot
area and not envisaged on the larger scale. In the operational phase the environmental
impacts are due to continuous operation of the project, hence, the emphasis in the
Environment Management plan (EMP) is to minimize such impacts. The following
mitigation measures are recommended in order to synchronize the economic
development of the project area with the environmental protection of the region.
The emphasis on the EMP development is on the following;
Mitigation measures for each of the activities causing the environmental
impact.
Monitoring plans for checking activities and environmental parameters and
monitoring responsibilities.
Role responsibilities and resource allocation for monitoring; and
Implementation of the scheduled plan.
Environmental management plan has been discussed in the following sections
separately for Construction phase and Operational phase:
10.2 EMP DURING CONSTRUCTION PHASE
During construction phase, the activities which need to be monitored and
managed from the point of pollution are explained in detail in the subsequent
sections.
54
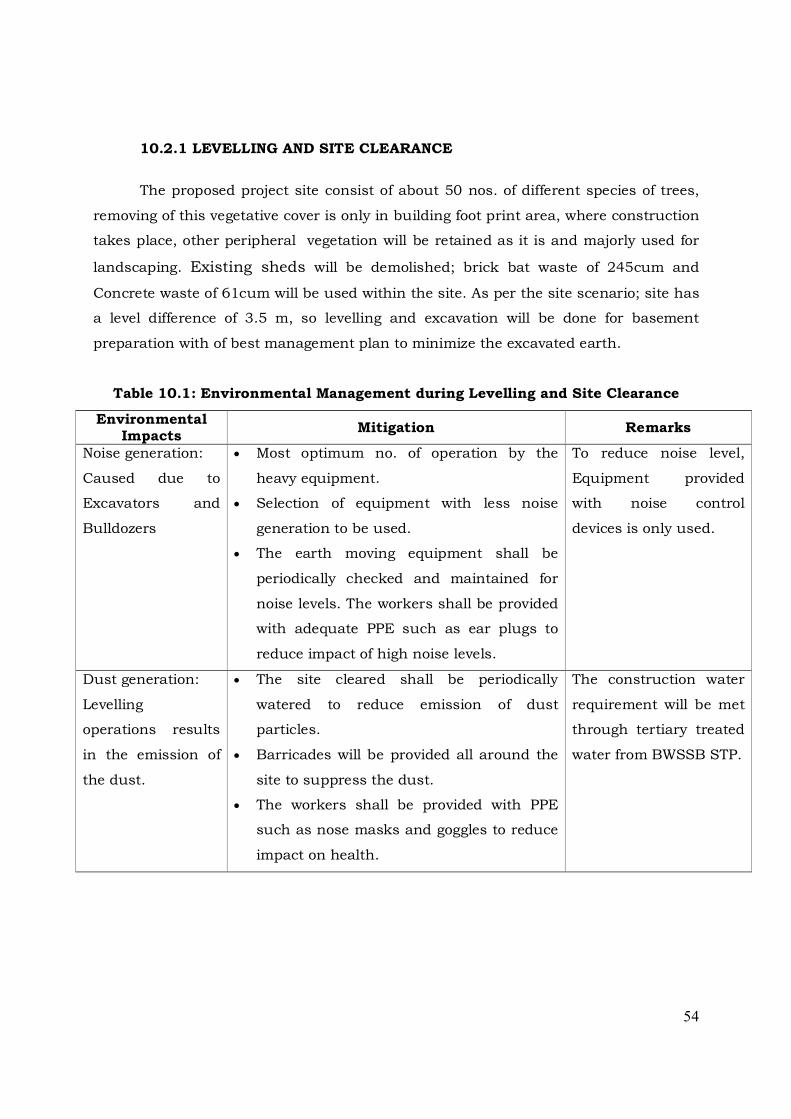
10.2.1 LEVELLING AND SITE CLEARANCE
The proposed project site consist of about 50 nos. of different species of trees,
removing of this vegetative cover is only in building foot print area, where construction
takes place, other peripheral vegetation will be retained as it is and majorly used for
landscaping. Existing sheds will be demolished; brick bat waste of 245cum and
Concrete waste of 61cum will be used within the site. As per the site scenario; site has
a level difference of 3.5 m, so levelling and excavation will be done for basement
preparation with of best management plan to minimize the excavated earth.
Table 10.1: Environmental Management during Levelling and Site Clearance
Environmental Impacts
Mitigation Remarks
Noise generation:
Caused due to
Excavators and
Bulldozers
Most optimum no. of operation by the
heavy equipment.
Selection of equipment with less noise
generation to be used.
The earth moving equipment shall be
periodically checked and maintained for
noise levels. The workers shall be provided
with adequate PPE such as ear plugs to
reduce impact of high noise levels.
To reduce noise level,
Equipment provided
with noise control
devices is only used.
Dust generation:
Levelling
operations results
in the emission of
the dust.
The site cleared shall be periodically
watered to reduce emission of dust
particles.
Barricades will be provided all around the
site to suppress the dust.
The workers shall be provided with PPE
such as nose masks and goggles to reduce
impact on health.
The construction water
requirement will be met
through tertiary treated
water from BWSSB STP.

55
10.2.2 TRANSPORTATION OF CONSTRUCTION MATERIALS
During the transportation of construction materials, minimum no. of vehicles
will be used. Most optimum route is planned to reduce the impact of transportation
activity on the environment.
Table 10.2: Environmental Management during Transportation
Environmental Impacts
Mitigation
Noise generation Quality fuel will be used.
Periodic maintenance of vehicles is required.
Dust generation Quality packaging of the construction materials.
Construction materials shall be covered with
tarpaulin sheets to prevent the material from
being air borne.
The vehicle speed shall be regulated.
Watering to the wheels of the construction vehicle
will be done while entering to the construction
site.
The workers transporting materials shall be
provided with PPE such as nose masks to reduce
impact of air borne dust on their health.
Vehicular
emissions
Periodic emission check for vehicles is required.
Clean fuel shall be used for vehicles.
10.2.3 CONSTRUCTION ACTIVITIES
During the construction work, the following impacts are identified to monitor
and mitigate the level of impact.

56
Table 10.3: Environmental Management during Construction
Environmental impacts
Mitigation Remarks
Noise generation Selection of less noise generating equipment.
Personnel Protective Equipment (PPE) such
as ear plugs and helmets shall be provided
for construction workers.
The working hours shall be imposed on
construction workers.
Implementation
responsibility:
Contractor –
Civil Works.
Dust generation PPE in the form of nose masks shall be
provided for construction workers.
Use of water sprays to prevent the dust from
being air borne.
Providing barricades all around the project
site.
Implementation
responsibility:
Contractor
Water Discharge
from
construction
works
Sewage generated will be discharged to
existing UGD
Implementation
responsibility:
Contractor
Air Emissions
from
construction
machinery
Periodic check and regular maintenance of
construction machinery for emissions.
Clean fuel shall be used in equipments.
Implementation
responsibility:
Contractor
10.2.3.1 WASTEWATER DISCHARGE
The sewage generated from the construction labours during construction is
estimated to be about 7.1 KLD. This will discharged to existing UGD.
10.2.3.2 DISPOSAL OF EXCAVATED EARTH
The excavated earth which is generated during construction will be reused for
development of landscape and pavement area formation therefore there will not be any
solid waste problem from the generation of excavated earth.

57
10.2.3.3 PERSONNEL SAFETY SYSTEM
It is planned to adopt the safe working practices which shall govern all
construction works undertaken throughout the project. Following Safety Aids to all
labourers will be provided:
Safety Helmets
Safety Belts
Safety Shoes
Hand gloves
Gumboots while concreting
Safety Goggles while welding/ Stone dressing etc.
Face masks and full body kit while Pest control
Implementation of Safety procedures such as:
Using proper lifting techniques.
Using Safe Scaffolds.
Hot work permits for Fabrication and welding.
BUDGETARY ALLOCATION FOR EMP DURING CONSTRUCTION
Sl. No. EMP Aspects Cost
Capital Investment In Lakh
1. Barricades all round the site 1.0
Total 1.0
During Construction Lakhs/annum
1. Purchase of water from external authorized
suppliers 3.0
2. Disposal of Solid Waste from project site 2.5
3. Plantations of saplings around the periphery
and maintenance 5.0
4. Environmental Monitoring – Air, water, Noise 1.0
5. EMP cell 2.5
Total 14
10.3 EMP DURING OPERATION PHASE
Following are the identified operational phase activities in the impact
assessment, which may have impact on the environment.

58
1. Air quality
2. Water quality
3. Noise quality
4. Solid waste disposal
5. Landscape development
6. Storm water management
10.3.1 AIR QUALITY MANAGEMENT
The air pollutants likely to be emanated from the proposed project are SPM,
SO2, NO2, HC and CO mainly due to burning of liquid fuel (HSD) in DG.
Exhaust from DG set will be emitted from stack of adequate height for
dispersion of gaseous pollutants. The green belt development is also proposed covering
about 30.32% of the net plot area. Following table presents the EMP for air quality
management during operation phase.
Table 10.4: Air Quality Management during Operation Phase
Environmental
Impacts Mitigation
DG set Equipment selected will ensure the exhaust emission
standard as prescribed as per the latest amendments
from the CPCB.
DG will be used as stand-by unit.
Periodic check and maintenance.
Ambient air
quality
Ambient air quality monitoring as per the prescribed
norms at regular interval.
10.3.2 WATER QUALITY MANAGEMENT
Water requirement of the project will be met through BWSSB, as mentioned
earlier. Water balance is presented in Annexure 2(a).
The sewage generated from the proposed project is about 141 KLD which will be
treated in the proposed STP of capacity 145 KLD. The treatment scheme for domestic
effluents generated from project has also been discussed in Annexure 2(a). The STP

59
treated water will be reused for flushing, gardening etc. Following table presents the
EMP for water quality.
Table 10.5: Water Quality Management during Operation Phase
Environmental impacts Mitigation
Effluent from domestic water
consumption
Treated with proposed state-of-the-art sewage
treatment plant to produce tertiary treated water;
this will be ultimately reused for secondary
purposes such as for flushing, gardening, vehicle
washing and for common area floor washing.
Water conservation measures will be encouraged.
10.3.3 NOISE MANAGEMENT
High noise generating units such as DG set will be provided with acoustic
enclosures. Landscape on the project boundary will further act as noise barrier and
helps in attenuation of noise. Following table presents the EMP for noise levels.
Table 10.6: Noise Management during Operation Phase
Environmental Impacts
Mitigation
Noise from DG set
area
Acoustic enclosures will be provided to DG set.
DG set will be installed in an area (utility section)
where the access will be restricted.
The use of PPE (ear plugs) will be mandatory in this
area.
Selection of equipment to ensure that the residual
noise level of < 65 dB (A).
Noise levels will be checked periodically using a noise
dosimeter.
10.3.4 SOLID WASTE MANAGEMENT
The solid wastes generated during operation phase can be categorized under
three types:
60
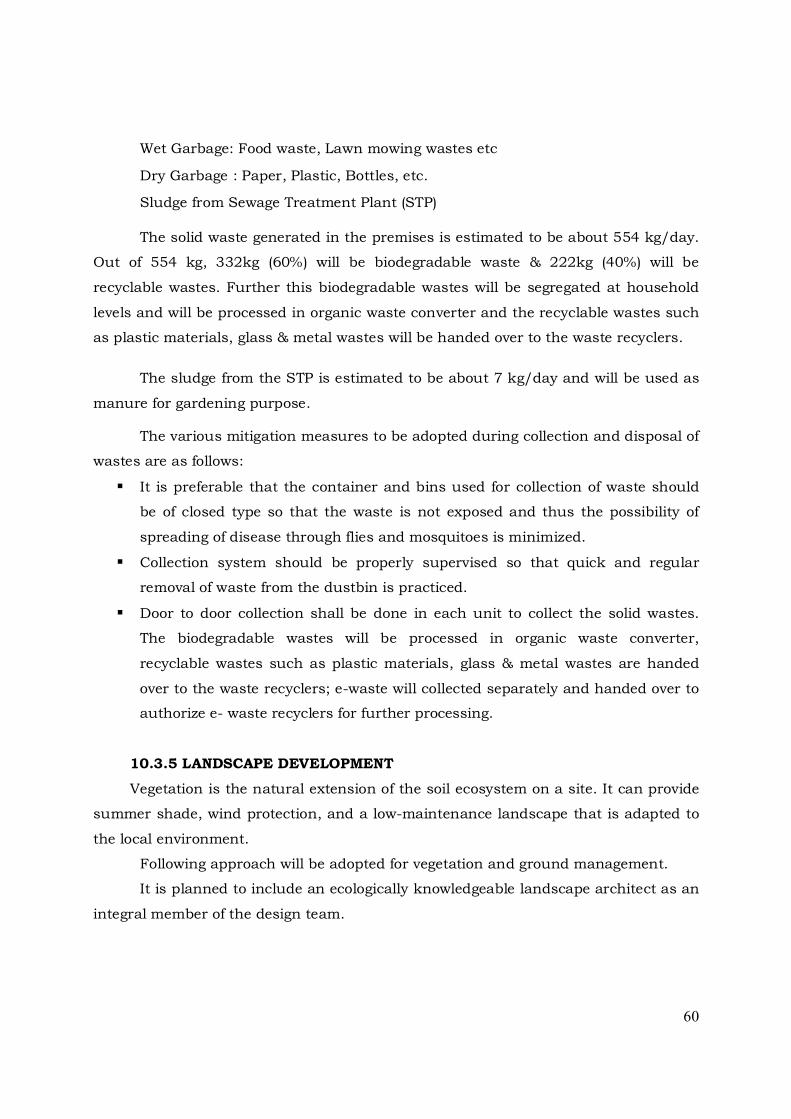
Wet Garbage: Food waste, Lawn mowing wastes etc
Dry Garbage : Paper, Plastic, Bottles, etc.
Sludge from Sewage Treatment Plant (STP)
The solid waste generated in the premises is estimated to be about 554 kg/day.
Out of 554 kg, 332kg (60%) will be biodegradable waste & 222kg (40%) will be
recyclable wastes. Further this biodegradable wastes will be segregated at household
levels and will be processed in organic waste converter and the recyclable wastes such
as plastic materials, glass & metal wastes will be handed over to the waste recyclers.
The sludge from the STP is estimated to be about 7 kg/day and will be used as
manure for gardening purpose.
The various mitigation measures to be adopted during collection and disposal of
wastes are as follows:
It is preferable that the container and bins used for collection of waste should
be of closed type so that the waste is not exposed and thus the possibility of
spreading of disease through flies and mosquitoes is minimized.
Collection system should be properly supervised so that quick and regular
removal of waste from the dustbin is practiced.
Door to door collection shall be done in each unit to collect the solid wastes.
The biodegradable wastes will be processed in organic waste converter,
recyclable wastes such as plastic materials, glass & metal wastes are handed
over to the waste recyclers; e-waste will collected separately and handed over to
authorize e- waste recyclers for further processing.
10.3.5 LANDSCAPE DEVELOPMENT
Vegetation is the natural extension of the soil ecosystem on a site. It can provide
summer shade, wind protection, and a low-maintenance landscape that is adapted to
the local environment.
Following approach will be adopted for vegetation and ground management.
It is planned to include an ecologically knowledgeable landscape architect as an
integral member of the design team.

61
Preservation of existing vegetation, especially native plants, will possibly be
incorporated. Avoid fencing off property where possible to make landscape available to
community increasing project integration.
Decrease paving and monoculture lawns.
Avoid replacing mature trees with young seedlings.
Protect existing plants during construction. Delineate the “drip line” around
trees and demark or fence off areas to avoid damage.
Contain heavy equipment and stockpiling areas to predefined areas.
Design new plantings as diverse communities of species well adapted to the
site. Plant native species of varying ages. Select vegetation that attracts wildlife.
Avoid invasive species and monocultures (same species, same age).
10.3.6 STORM WATER MANAGEMENT
As the project location is blessed with fairly good rainfall, it is planned to collect
the storm water at different gradients of the location. There will be rainfall runoff from
building roof-tops, roads and pavements and landscape area. Necessary provision will
be made to collect the quantity of rainfall runoff during the most rainy day of season.
Necessary rain harvesting pit /recharge pit at equal intervals around the periphery of
the site have been envisaged. A garland drains with RCC precast perforated cover will
be provided around the periphery of property. The details of the rain water harvesting
facilities are interpreted in the early section.
10.3.7 HEALTH, RISK AND DISASTER MANAGEMENT
Public health and safety
Since all the construction related activities shall be confined to the project site,
minimal health related impacts are envisaged within the project influenced area
during the construction stage.
At the project site on an average of 250 persons will be engaged, who face direct
exposure to dust and noise generated from the construction activity. This is likely to
cause health related affects such as asthma, bronchitis etc. and hearing impairments
respectively.
To minimize these anticipated impacts, suitable actions like
Use of water sprinklers to prevent dust from being air borne.

62
Providing suitable personal protective equipments (PPE) like mouth mask
with filters, nose mask, helmets etc.
Periodic health check up camp for the labourers will be arranged.
Provision of safety belts.
In case of injury, on site medical treatment and transport will be organized.
Employing a safety engineer.
Due to operation of the proposed project, there will be enhancement in public
health and safety.
Regular visit of resident medical officer to take care of the first aid and
primary medication in case of emergency for apartment occupants and
labourers.
First aid kit with primary medicines will always be available in the medical
centre.
Display of action plan and preparedness measures during emergency
situations.
Risk and disaster management plan
Disaster is an unexpected event due sudden failure of the system, external
threats, internal disturbances, earth quakes, fire and accidents. Thus an
appropriate management plan shall be incorporated.
Precautions
Once the likelihood of the disaster is suspected, preventive actions
should be undertaken by the project in-charge.
Conditional maintenance of equipments, materials, and expertise for use
during emergency.
The electrical systems shall be provided with automatic circuit breakers
activated by over current.
Fire extinguishers are provided at pre-notified locations inside the
apartments.
Proper escape routes are planned and displayed in the public domain.
Selected representatives are given proper training to guide other
inhabitants during fire accidents.

63
Periodic awareness programme is conducted for the occupants on their
roles during emergency situations.
Important telephone numbers like police authorities, fire department and
hospitals etc. of use during emergency situations are made available.
10.3.8 EMP IMPLEMENTATION SCHEDULE
Phased according to the priority, the implementation schedule is presented in
below table.
Table 10.7: Implementation Schedule for EMP
Sl. No. Recommendations Requirement
1. Air pollution control measures Before commissioning of respective units
2. Water pollution control measures Before commissioning of the project
3. Noise control measures Along with the commissioning of the
project
4. Solid waste management During commissioning of the project
5. Green belt development Stage-wise implementation
The responsibility of EMP implementation lies with the project promoter for a
period of 3 years. Once the project is established, the EMP responsibility will be
properly handed over with clearly defined procedures and guidelines.
10.3.9 ENVIRONMENTAL MONITORING ROUTINES
A comprehensive monitoring programme is suggested in below table:
Table 10.8: Monitoring Schedule for Environmental Parameters
Sl. No. Particulars Monitoring
frequency
Duration of
monitoring
Important
parameters for
monitoring
I. Air Quality
1. Ambient Air monitoring
Project premises Once in a month 24 hourly
sample
PM, SO2, NO2
2. Stack Monitoring Once in a month Grab SO2, SPM, NO2,
HC, CO
II Water and Wastewater Quality
1. Water Quality

64
i. Ground water at two
locations (up-gradient and
down-gradient) of treated
effluent discharge area/
land
Once in a month Grab As per KSPCB
requirements
2. Waste water quality
i. Inlet to STP Daily Composite -
ii. Treated effluent prior to
discharge
Daily Composite -
III Soil Quality
1. Within project premises at
1 location on effluent
discharging area / land
Once in a month Composite
Sample
As per KSPCB
requirements
2. Ecological preservation
and up-gradation
Seasonal Visual
observations
Survival rate
IV Noise Monitoring
1. Project premises Once in a month Day and Night As per KSPCB
requirements
10.4 ENVIRONMENTAL LEGISLATIONS
There are many Environmental Acts & Rules which are formulated by Ministry
of Environment and Forests (MoEF) for the prevention of Environmental squalor and
are to be compiled by the Industry. All the regulations are not applicable to all. The
Act and Rules which are to be constantly perused and followed by the Industry are
enumerated in the following section.
Table 10.9: Particulars of Environmental Legislations
Year of
Enactment LEGISLATION
1974 The Water (Prevention and Control of Pollution) Act.
1975 The Water (Prevention and Control of Pollution) Rules.
1988 The Water (Prevention and Control of Pollution) as amended.
1981 The Air (Prevention and Control of Pollution) Act.
1987 The Air (Prevention and Control of Pollution) and as amended.
1986 The Environment (Protection) Rules.

65
1991 The Environment (Protection) Rules (Amended).
10.4.1 ENVIRONMENT PROTECTION ACT & RULES
Among the various notifications coming under the Environment (Protection) Act,
following are the notifications applicable to this project:
Table 10.10: Notifications under Environmental Protection Act & Rules
YEAR OF
NOTIFICATION RULES
1989 The Hazardous Waste (Management & Handling) Rules
2000 & 2003 The Hazardous Waste (Management & Handling) Rules
(amended)
1992/1993 Environmental Statement
2000 Noise Pollution (Regulation & Control) Rules and
Amendment Rule 2006
2000 Municipal Solid Wastes (Management & Handling) Rules
2002 D.G. Rules
2008 The Hazardous Wastes (Management, Handling &
Transboundary Movement) Rules
The Hazardous Waste (Management & Handling) Rules 1989 (latest amendment
2008)
The DG Set Waste/used oil is included in the schedule-1 of list of Hazardous
Waste under Serial No.5 which states as under:
“Used/spent oil (category No.5.1) generated from industrial operations.
Using mineral/synthetic oil as lubricant in hydraulic systems or other
applications”.
Used oil defined under Rule 3 (34) means any oil derived from crude oil or
mixtures containing synthetic oil including used engine oil, gear oil, hydraulic oil,
turbine oil, compressor oil, industrial gear oil, heat transfer oil, transformer oil, spent
oil and their tank bottom sludge and suitable for re-refining, if it meets the
specifications laid down in Schedule 5, but does not include waste oil.
Responsibility of the occupier and operator of a facility for handling of the
wastes is delineated as under:

66
1. The Occupier and the operator of a facility shall be responsible for proper
collection, reception, treatment, storage and disposal of hazardous wastes listed
in schedule –1, 2 and3 {Rule 4(1)}
2. It shall be the responsibility of the occupier and the operator of a facility, to
take all steps to ensure that the wastes listed in schedule 1,2 and 3 are
properly handled and disposed of without any adverse effects to the
environment {Rule 4(3)}.
3. Hazardous wastes shall be collected, treated, stored and disposed of only in
such facilities as may be authorized for this purpose {Rule 5(1)}.
4. Every occupier handling, or a recycler recycling, hazardous wastes shall make
application in Form-1 to the Member Secretary, State Pollution Control Board
or committee, as the case may be or any Officer designated by the State
Pollution Control Board of committee for the grant of authorization for any of
the said activities { Rule 5(2) }.
5. The Occupier or operator of a facility shall ensure that the hazardous wastes
are packaged, based on the composition in the manner suitable for handling,
storage, and transport and the labeling and packaging shall be easily visible
and be able to withstand physical conditions and climatic factors {Rule 7(1)}.
6. Packaging, labeling and transport of hazardous wastes shall be in accordance
with provisions of the rules made by the Central Government under the Motor
Vehicles Act 1988 and other guidelines issued from time to time { Rule 7(2)}.
7. All Hazardous waste containers shall be provided with a general label as given
in Form-8 of Hazardous Waste (Management Handling) Rules 1989 as amended
there after {Rule 7(3)}.
8. The Occupier shall prepare six copies of the manifest in Form 9 comprising of
colour code indicated below (all six copies to be signed by transporter) {Rule
7(4)}.
9. The Occupier generating hazardous waste and operator of a facility for
collection, reception, treatment, transport, storage and disposal of hazardous
waste shall maintain records of such operations in Form-3 {Rule 9(1)}.

67
10. The occupier or an operator of a facility shall send annual reports to the State
Pollution Control Board or committee in Form-4 {Rule 9(2)}.
11. Where an accident occurs at the facility or on a hazardous waste site or during
transportation of hazardous waste the occupier or Operator of a facility shall
report immediately to the State Pollution Control Board or committee about the
accident in Form-5 {Rule 10}.
12. No owner or occupier generating non-ferrous metal waste specified in schedule
4 or generating used oil or waste oil of ten tons or more per annum shall sell or
auction such non-ferrous metal wastes, used oil or waste oil to a registered re-
refiner or recycler, as the case may be, who undertakes to re-refine or recycle
the waste within the period of validity of his certificate of registration (Rule
20(1)).
Table 10.11: Colour Code for the manifest copies
Copy number with
Colour Code Purpose
Copy 1 (White) To be forwarded by the occupier to the State
Pollution Control Board or Committee.
Copy 2 (Yellow) To be retained by the occupier after taking
signature on it from the transporter and rest of
the four copies to be carried by the transporter
Copy 3 (Pink) To be retained by the operator of the facility after
Signature
Copy 4 (Orange) To be returned to the transporter by the operator
of Facility after accepting waste
Copy 5 (Green)
To be returned by the operator of the facility to
State Pollution Control Board/Committee after
treatment and disposal of wastes
Copy 6 (blue) To be returned by the operator of the facility to the
occupier after treatment and disposal of wastes.
ENVIRONMENTAL STATEMENT:
Under rule 14 of the Environmental Protection Rules 1986, every person
carrying on an industry, operation or process requiring Consent under Section 25 of
Water (Prevention and Control of Pollution) Act, 1974 (6 of 1974) or under Section 21
of the Air (Prevention and Control of Pollution) Act 1981 (14 of 1981) or both or

68
authorization under the Hazardous Waste (Management & Handling) Rules 1989
issued under the Environment (Protection ) Act, 1986 (29 of 1986) shall submit an
Environmental Statement Report for the financial year ending the 31st March in Form-
V to the concerned State Pollution Control Board on or before 15th Day of September
every year.
BUDGETARY ALLOCATION FOR EMP DURING OPERATION
Sl. No. EMP Aspect Cost in Rs
Capital Investment In Lakh
1. Sewage Treatment Plant 30.0
2. Rainwater harvesting facilities 10.0
3. Landscape development 10.0
4. Acoustic & Stacks for DG sets 5.0
5. Organic Waste Converter 3.0
Total 58
Operation Investment Lakh/ Annum
1. STP Maintenance 3.0
2. Landscape Maintenance 2.0
3. OWC Maintenance 1.5
4. EMP Cell 2.5
5. Environmental Monitoring-Air, Water, Noise 1.0
Total 10