Embed Size (px)
Citation preview

University of KentuckyUKnowledge
Biomedical Engineering Faculty Publications Biomedical Engineering
2-21-2016
SegWay: A Simple Framework for UnsupervisedSleep Segmentation in Experimental EEGRecordingsFarid YaghoubyUniversity of Kentucky, [email protected]
Sridhar SunderamUniversity of Kentucky, [email protected]
Right click to open a feedback form in a new tab to let us know how this document benefits you.
Follow this and additional works at: https://uknowledge.uky.edu/cbme_facpub
Part of the Biomedical Engineering and Bioengineering Commons
This Article is brought to you for free and open access by the Biomedical Engineering at UKnowledge. It has been accepted for inclusion in BiomedicalEngineering Faculty Publications by an authorized administrator of UKnowledge. For more information, please contact [email protected].
Repository CitationYaghouby, Farid and Sunderam, Sridhar, "SegWay: A Simple Framework for Unsupervised Sleep Segmentation in Experimental EEGRecordings" (2016). Biomedical Engineering Faculty Publications. 12.https://uknowledge.uky.edu/cbme_facpub/12

SegWay: A Simple Framework for Unsupervised Sleep Segmentation in Experimental EEG Recordings
Notes/Citation InformationPublished in MethodsX, v. 3, p.144-155.
© 2016 The Authors.
This is an open access article under the CC BY license (http://creativecommons.org/licenses/by/4.0/).
Digital Object Identifier (DOI)https://doi.org/10.1016/j.mex.2016.02.003
This article is available at UKnowledge: https://uknowledge.uky.edu/cbme_facpub/12
SegWay: A simple framework for unsupervisedsleep segmentation in experimental EEGrecordings
Farid Yaghouby, Sridhar Sunderam *
Department of Biomedical Engineering, University of Kentucky, Lexington, KY, USA
MethodsX 3 (2016) 144–155
A B S T R A C T
Sleep analysis in animal models typically involves recording an electroencephalogram (EEG) and
electromyogram (EMG) and scoring vigilance state in brief epochs of data as Wake, REM (rapid eye
movement sleep) or NREM (non-REM) either manually or using a computer algorithm. Computerized
methods usually estimate features from each epoch like the spectral power associated with distinctive
cortical rhythms and dissect the feature space into regions associated with different states by applying
thresholds, or by using supervised/unsupervised statistical classifiers; but there are some factors to consider
when using them:
� Most classifiers require scored sample data, elaborate heuristics or computational steps not easily reproduced
by the average sleep researcher, who is the targeted end user.
� Even when prediction is reasonably accurate, small errors can lead to large discrepancies in estimates of
important sleep metrics such as the number of bouts or their duration.
� As we show here, besides partitioning the feature space by vigilance state, modeling transitions between the
states can give more accurate scores and metrics.
An unsupervised sleep segmentation framework, ‘‘SegWay’’, is demonstrated by applying the algorithm step-by-
step to unlabeled EEG recordings in mice. The accuracy of sleep scoring and estimation of sleep metrics is
validated against manual scores.
� 2016 The Authors. Published by Elsevier B.V. This is an open access article under the CC BY license (http://
creativecommons.org/licenses/by/4.0/).
A R T I C L E I N F O
Method name: SegWay: simple sleep segmentation
Keywords: Sleep scoring, EEG, EMG, Clustering, Hidden Markov model, Bout duration, Vigilance state, Sleep–wake, Behavior,
Classifier
Article history: Received 27 August 2015; Accepted 17 February 2016
* Corresponding author at: Department of Biomedical Engineering, University of Kentucky, Lexington, KY 40506-0108, USA.
E-mail address: [email protected] (S. Sunderam).
Contents lists available at ScienceDirect
MethodsX
journal homepage: www.elsevier.com/locate/mex
http://dx.doi.org/10.1016/j.mex.2016.02.003
2215-0161/� 2016 The Authors. Published by Elsevier B.V. This is an open access article under the CC BY license (http://
creativecommons.org/licenses/by/4.0/).
Methods
Approach
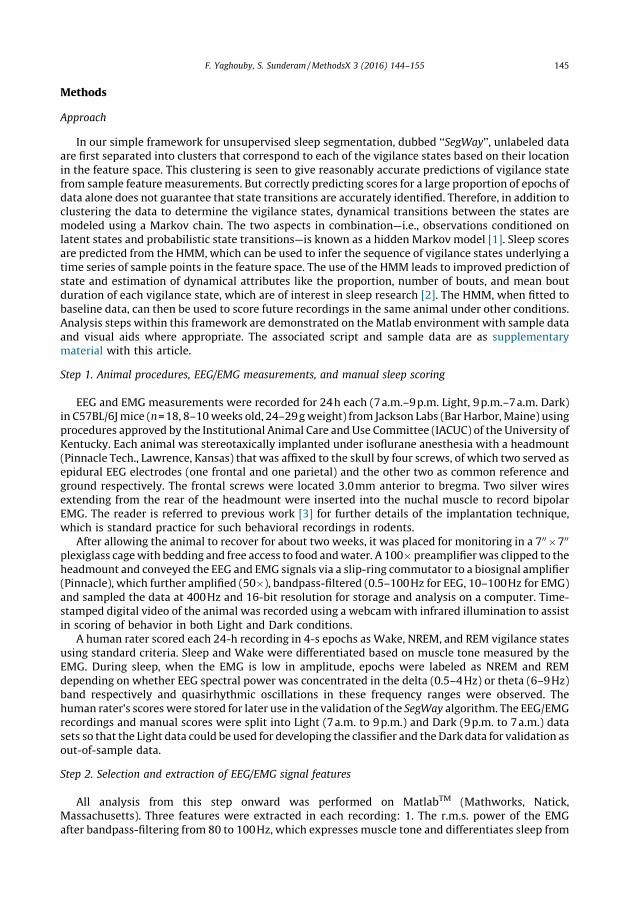
In our simple framework for unsupervised sleep segmentation, dubbed ‘‘SegWay’’, unlabeled dataare first separated into clusters that correspond to each of the vigilance states based on their locationin the feature space. This clustering is seen to give reasonably accurate predictions of vigilance statefrom sample feature measurements. But correctly predicting scores for a large proportion of epochs ofdata alone does not guarantee that state transitions are accurately identified. Therefore, in addition toclustering the data to determine the vigilance states, dynamical transitions between the states aremodeled using a Markov chain. The two aspects in combination—i.e., observations conditioned onlatent states and probabilistic state transitions—is known as a hidden Markov model [1]. Sleep scoresare predicted from the HMM, which can be used to infer the sequence of vigilance states underlying atime series of sample points in the feature space. The use of the HMM leads to improved prediction ofstate and estimation of dynamical attributes like the proportion, number of bouts, and mean boutduration of each vigilance state, which are of interest in sleep research [2]. The HMM, when fitted tobaseline data, can then be used to score future recordings in the same animal under other conditions.Analysis steps within this framework are demonstrated on the Matlab environment with sample dataand visual aids where appropriate. The associated script and sample data are as supplementarymaterial with this article.
Step 1. Animal procedures, EEG/EMG measurements, and manual sleep scoring
EEG and EMG measurements were recorded for 24h each (7a.m.–9p.m. Light, 9p.m.–7a.m. Dark)in C57BL/6J mice (n=18, 8–10 weeks old, 24–29g weight) from Jackson Labs (Bar Harbor, Maine) usingprocedures approved by the Institutional Animal Care and Use Committee (IACUC) of the University ofKentucky. Each animal was stereotaxically implanted under isoflurane anesthesia with a headmount(Pinnacle Tech., Lawrence, Kansas) that was affixed to the skull by four screws, of which two served asepidural EEG electrodes (one frontal and one parietal) and the other two as common reference andground respectively. The frontal screws were located 3.0mm anterior to bregma. Two silver wiresextending from the rear of the headmount were inserted into the nuchal muscle to record bipolarEMG. The reader is referred to previous work [3] for further details of the implantation technique,which is standard practice for such behavioral recordings in rodents.
After allowing the animal to recover for about two weeks, it was placed for monitoring in a 700 �700
plexiglass cage with bedding and free access to food and water. A 100� preamplifier was clipped to theheadmount and conveyed the EEG and EMG signals via a slip-ring commutator to a biosignal amplifier(Pinnacle), which further amplified (50�), bandpass-filtered (0.5–100Hz for EEG, 10–100Hz for EMG)and sampled the data at 400Hz and 16-bit resolution for storage and analysis on a computer. Time-stamped digital video of the animal was recorded using a webcam with infrared illumination to assistin scoring of behavior in both Light and Dark conditions.
A human rater scored each 24-h recording in 4-s epochs as Wake, NREM, and REM vigilance statesusing standard criteria. Sleep and Wake were differentiated based on muscle tone measured by theEMG. During sleep, when the EMG is low in amplitude, epochs were labeled as NREM and REMdepending on whether EEG spectral power was concentrated in the delta (0.5–4Hz) or theta (6–9Hz)band respectively and quasirhythmic oscillations in these frequency ranges were observed. Thehuman rater’s scores were stored for later use in the validation of the SegWay algorithm. The EEG/EMGrecordings and manual scores were split into Light (7a.m. to 9p.m.) and Dark (9p.m. to 7a.m.) datasets so that the Light data could be used for developing the classifier and the Dark data for validation asout-of-sample data.
Step 2. Selection and extraction of EEG/EMG signal features
All analysis from this step onward was performed on MatlabTM (Mathworks, Natick,Massachusetts). Three features were extracted in each recording: 1. The r.m.s. power of the EMGafter bandpass-filtering from 80 to 100Hz, which expresses muscle tone and differentiates sleep from
F. Yaghouby, S. Sunderam / MethodsX 3 (2016) 144–155 145
wakefulness; 2. The ratio of the mean-squared signal power of the frontal EEG after bandpass-filteringin the delta (0.5–4Hz) and theta (6–9Hz) bands, respectively, which helps differentiate REM fromNREM; and 3. The ratio of mean-squared frontal EEG power in high frequency (9–45Hz) and lowfrequency (0.5–9Hz) bands, respectively, which further distinguishes REM. A 3rd order Butterworthfilter was used in each case. These signal features were estimated in each 4-s epoch of the recordingand used as inputs for classification of the three vigilance states. As a preprocessing step, each featuretime series was smoothed using a four-point (16s) moving average and scaled logarithmically toreduce noise and skewness in the distribution, which is a common feature of signal power estimates.
Comments: Various other signal feature sets that separate Wake, NREM, and REM are described inthe literature on sleep scoring in rodents (reviewed in [4]), but an EMG power estimate is frequentlyused to differentiate Wake from sleep, and one or more EEG features to separate REM from NREM onthe basis of delta, theta, alpha, and other commonly observed cortical rhythms. These features can besubstituted for the ones presented here, which we have found useful, and are expected to work in amore or less similar manner with little or no modification required.
Step 3. Clustering of unlabeled signal features into vigilance states
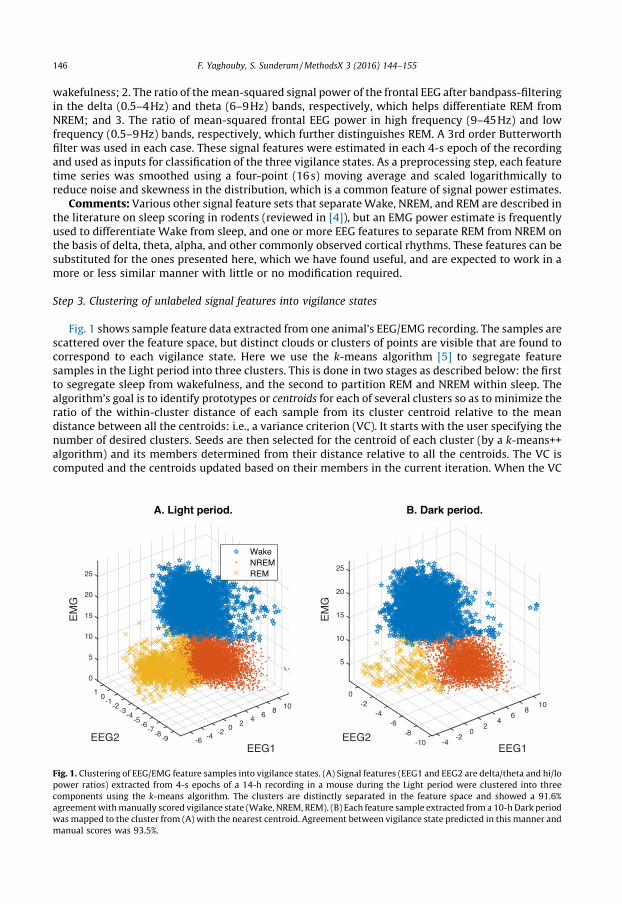
Fig. 1 shows sample feature data extracted from one animal’s EEG/EMG recording. The samples arescattered over the feature space, but distinct clouds or clusters of points are visible that are found tocorrespond to each vigilance state. Here we use the k-means algorithm [5] to segregate featuresamples in the Light period into three clusters. This is done in two stages as described below: the firstto segregate sleep from wakefulness, and the second to partition REM and NREM within sleep. Thealgorithm’s goal is to identify prototypes or centroids for each of several clusters so as to minimize theratio of the within-cluster distance of each sample from its cluster centroid relative to the meandistance between all the centroids: i.e., a variance criterion (VC). It starts with the user specifying thenumber of desired clusters. Seeds are then selected for the centroid of each cluster (by a k-means++algorithm) and its members determined from their distance relative to all the centroids. The VC iscomputed and the centroids updated based on their members in the current iteration. When the VC
[(Fig._1)TD$FIG]
108
EEG1
64
2
A. Light period.
0-2
-4-6-9
-8-7
-6-5
-4-3
EEG2
-2-1
01
5
25
20
15
10
0
EM
G
WakeNREMREM
108
EEG1
64
2
B. Dark period.
0-2
-4-10-8
-6-4
EEG2
-20
5
10
15
20
25
EM
G
Fig. 1. Clustering of EEG/EMG feature samples into vigilance states. (A) Signal features (EEG1 and EEG2 are delta/theta and hi/lo
power ratios) extracted from 4-s epochs of a 14-h recording in a mouse during the Light period were clustered into three
components using the k-means algorithm. The clusters are distinctly separated in the feature space and showed a 91.6%
agreement with manually scored vigilance state (Wake, NREM, REM). (B) Each feature sample extracted from a 10-h Dark period
was mapped to the cluster from (A) with the nearest centroid. Agreement between vigilance state predicted in this manner and
manual scores was 93.5%.
F. Yaghouby, S. Sunderam / MethodsX 3 (2016) 144–155146

converges to an optimum and does not improve with further iteration, the algorithm returns the finalcluster centroids and their members.
In order to increase the likelihood of a favorable partition (i.e., one that best separates samples byvigilance state) we first use the k-means algorithm to partition the r.m.s. EMG feature values into twoclusters, sleep and Wake, and then apply it again to separate the sleep cluster into two sub-clusterscorresponding to REM and NREM based on the delta-theta power ratio feature alone. The clusters inFig. 1 are colored by their final membership after application of the k-means algorithm.
We find that this simple unsupervised clustering procedure labels EEG/EMG features in a way thatagrees substantially with manual scores. It should be noted that even expert human raters candisagree by 5–10% or more [6,7], so this limits the performance to be expected when comparing thealgorithm with any one rater. Perfect agreement with manual scoring is neither feasible nor desirable,since the model may be overfitting the data. For the sample animal’s Light data (Fig. 1A), overallagreement was 91.6% with >90% high sensitivity and specificity for each state. The k-means modelbuilt from the Light period data was then used to classify data from the Dark period by assigning labelsto each epoch based on which of the three centroids is nearest to it in the feature space and found toperform just as well (Fig. 1B): overall accuracy was 93.5%; sensitivity and specificity for Wake andNREM were similarly high but REM sensitivity was low (60%) and specificity was moderate (85%).
Comments: Many unsupervised algorithms, for instance Gaussian mixture models and linkagetrees, are available for clustering unlabeled sample data, and may work just as well as the k-means.The clustering approach presented above offers a quick way to predict vigilance state in unlabeleddata. The only assumption made is that all three states are reasonably well-represented in the sampledata to be modeled (but not necessarily in future samples) since this affects the accuracy of theestimated centroid locations. The proportion of each vigilance state in the sample was assayed fairlywell: 34, 55, and 10% versus 37, 55, and 8% from manual scores for Wake, NREM, and REM respectivelyin the Light period (similar high accuracy in the Dark period).
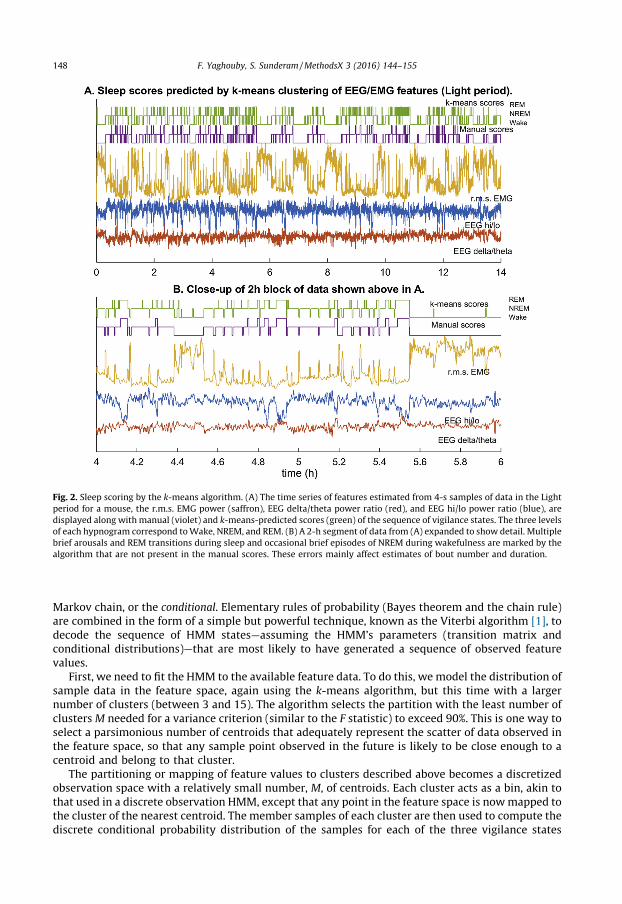
But a closer look at the hypnograms—i.e., the sequences of epoch state labels (manual andpredicted) for the recording—reveals a serious limitation (Fig. 2). Even as the predictions appear totrack the most likely state (per manual scoring) fairly closely over time, there are frequent errors—particularly arousal and REM transitions that are not recognized in the human scores—that could beattributed to noise or variability in the feature values within a state. These errors may be for a smallfraction of all epochs, but they may cause the classifier to miss important state transitions or introducefalse transitions where there are none, thus introducing large errors in estimates of bout number orduration.
The number of bouts or their durations for each vigilance state are important metrics thatcharacterize sleep dynamics in experimental investigations (e.g., [2]) but sleep scoring methods do notreport how accurately they are estimated by computer algorithms [7–10] with some exceptions[11]. Here we find that k-means clustering of the vigilance states injects brief episodes of NREM intoprolonged Wake bouts and spurious episodes of REM or brief arousal during sleep (Fig. 2). Wespeculate that such errors will occur with most published algorithms even if the reported accuracy issignificantly greater than 90%.
Step 4. Modeling vigilance dynamics from signal features using HMMs
In order to improve the estimation of bout number and duration, it is necessary to model thedynamics of vigilance state across transitions in a way that allows state scores to be predicted forsequences of observed EEG/EMG features rather than individual samples. A hidden Markov model(HMM) is capable of doing just this [1].
The HMM is based on the concept of a Markov chain, i.e., a graphical model in which each node is adiscrete state that can make transitions—identified by the edges—at random times to other states withprobabilities that depend only on the current state (known as the Markov property). When the statesof the Markov chain correspond to the vigilance states, such a model would describe the dynamics oftransitions between Wake, NREM, and REM in the form of a matrix of state transition probabilities. Butsince the state is not directly observable, it must be inferred from measurements such as the EEG/EMGsignal features. An HMM specifies the distribution of feature values conditioned on each state of the
F. Yaghouby, S. Sunderam / MethodsX 3 (2016) 144–155 147
Markov chain, or the conditional. Elementary rules of probability (Bayes theorem and the chain rule)are combined in the form of a simple but powerful technique, known as the Viterbi algorithm [1], todecode the sequence of HMM states—assuming the HMM’s parameters (transition matrix andconditional distributions)—that are most likely to have generated a sequence of observed featurevalues.
First, we need to fit the HMM to the available feature data. To do this, we model the distribution ofsample data in the feature space, again using the k-means algorithm, but this time with a largernumber of clusters (between 3 and 15). The algorithm selects the partition with the least number ofclusters M needed for a variance criterion (similar to the F statistic) to exceed 90%. This is one way toselect a parsimonious number of centroids that adequately represent the scatter of data observed inthe feature space, so that any sample point observed in the future is likely to be close enough to acentroid and belong to that cluster.
The partitioning or mapping of feature values to clusters described above becomes a discretizedobservation space with a relatively small number, M, of centroids. Each cluster acts as a bin, akin tothat used in a discrete observation HMM, except that any point in the feature space is now mapped tothe cluster of the nearest centroid. The member samples of each cluster are then used to compute thediscrete conditional probability distribution of the samples for each of the three vigilance states
[(Fig._2)TD$FIG]
Fig. 2. Sleep scoring by the k-means algorithm. (A) The time series of features estimated from 4-s samples of data in the Light
period for a mouse, the r.m.s. EMG power (saffron), EEG delta/theta power ratio (red), and EEG hi/lo power ratio (blue), are
displayed along with manual (violet) and k-means-predicted scores (green) of the sequence of vigilance states. The three levels
of each hypnogram correspond to Wake, NREM, and REM. (B) A 2-h segment of data from (A) expanded to show detail. Multiple
brief arousals and REM transitions during sleep and occasional brief episodes of NREM during wakefulness are marked by the
algorithm that are not present in the manual scores. These errors mainly affect estimates of bout number and duration.
F. Yaghouby, S. Sunderam / MethodsX 3 (2016) 144–155148

(Fig. 3). Then we take the original output of the k-means algorithm, which clusters the data into threevigilance states, and estimate the relative frequencies of transitions between the states to make up the3�3 state transition matrix. The combination of conditional distribution and state transition matrixcomprise the parameters of an HMM with discretized observations that captures the dynamics ofvigilance state transitions. This initial guess of the parameters is refined by applying the Baum–Welchalgorithm, which is an E–M procedure for performing maximum-likelihood estimation [1] thatconverges to a local optimum. In our code, the user has the option of applying the Baum–Welchoptimization or using the initial guess HMM to compare the two. We have found that the two-stagek-means procedure for deriving the initial guess produces better results with the Baum–Welchalgorithm than starting with multiple random initial guesses and choosing the solution with greatestlog-likelihood. We demonstrated a similar approach for segmentation of human sleep recordings in aprevious study [12].
Comments: There are well-documented approaches in the literature for modeling observationsusing HMMs that either: 1. Assume a model for the conditional distribution—usually a multivariateGaussian or mixture-of-Gaussians—in each state [13]; or 2. Separate the feature space into bins ofequal volume, and model the conditional as a discrete probability distribution for each state[14]. While the first approach assumes a continuous distribution over the feature space and can assigna probability density to any point in it, a sparse sample of observations can lead to poor estimates ofparameters (e.g., ill-defined covariance matrices) for the conditional density functions. The latterdiscrete approach has its own drawbacks: fine-grained bins may be needed to better estimate theconditional, but this leads to many empty bins for sparsely sampled data and a prohibitively largeparameter space, whose size is proportional to the number of bins. Our implementation is a hybrid ofboth approaches: firstly, observations of features are discretized, but by mapping them toclusters based on a statistical criterion and not by binning the feature space; and secondly, theconditional of the HMM is a discrete probability distribution of the symbolic clusters to whichobservations are mapped rather than parametric density functions of the continuous-valued
[(Fig._3)TD$FIG]
15
A. Features discretized to clusters.
10
EEG1
50
-5-10-10
-5EEG2
0
10
5
0
25
20
-5
30
15
5
EM
G
Cluster 1Cluster 2Cluster 3Cluster 4Cluster 5Cluster 6Cluster 7
1510
EEG1
C. Features clustered by state.
50
-5-10-10
-5EEG2
0
5
10
30
0
25
20
-5
15
5
EM
G
Wake
NREM
REM1 2 3 4 5 6 7
P(C
lust
er |
Wak
e)
0
0.2
0.4
0.6B. Distribution of clusters by state.
1 2 3 4 5 6 7P
(Clu
ster
| N
RE
M)
0
0.1
0.2
0.3
0.4
Cluster No.1 2 3 4 5 6 7
P(C
lust
er |
RE
M)
0
0.2
0.4
0.6
0.8
Fig. 3. Components of the discretized observation HMM of vigilance dynamics. (A) Sample EEG/EMG features (EEG1=EEG delta/
theta power ratio; EEG2=EEG hi/lo power ratio) extracted from the Light period are separated into seven observation clusters
by the k-means algorithm. (B) The probability distribution of these clusters conditioned on each vigilance state (Wake, NREM,
REM). (C) Vigilance state determined by a three-state k-means clustering of the same data as in (A). The HMM is specified by
fixing the vigilance states, computing the probabilities of transitions between the states from sample data, and computing the
conditional distributions of the discretized observations. The sequence of states underlying future observations can then be
decoded by the HMM using the Viterbi algorithm.
F. Yaghouby, S. Sunderam / MethodsX 3 (2016) 144–155 149

observations. These features make it a discretized observation HMM rather than a discrete orcontinuous observation HMM.
Step 5. Decoding the state sequence from EEG/EMG feature time series
After estimating the HMM, the popular Viterbi algorithm [1] is used to decode the state sequencefrom the time series of features. The Viterbi algorithm finds the state path, within the constraintsimposed by the model parameters, that is most likely to have generated the entire sequence of observedfeatures in the unlabeled data. This is essentially different from classification methods that only modeldifferences between states in the feature space, which means that they optimize the separation based onthe conditional distribution of features and not on dynamical changes in vigilance state. Application ofthe Viterbi algorithm to the Light data set shows that although the accuracy has barely increased (90%)and is actually lower than that of k-means for the Dark period (91% vs. 93%), prediction noise in the timesequence of states is visibly reduced (Figs. 4 and 5). There are only rare instances of false NREM duringprolonged Wake, and few false REM episodes or brief arousals during sleep.
Comments: One limitation found here in using HMMs is that while they avoided generating falsearousals in sleep, they also missed several genuine arousals marked by the human rater. This isattributed to the fact that both brief arousals in sleep and prolonged bouts of Wake are modeled as a
[(Fig._4)TD$FIG]
Fig. 4. Sleep scoring by the discretized observation HMM (Light period). (A) The time series of signal features estimated from 4-s
samples of data in the Light period for a mouse, the r.m.s. EMG power (saffron), EEG delta/theta power ratio (red), and EEG hi/lo
power ratio (blue), are displayed along with the manual (violet) and HMM-predicted (green) sequence of vigilance states. The
three levels of each hypnogram correspond to Wake, NREM, and REM. (B) A 2-h segment of data from (A) expanded to show
detail. The HMM rarely generates predictions of arousal or REM that are not also present in the manual scores. This improves
estimates of sleep metrics over values predicted from the k-means sleep scoring.
F. Yaghouby, S. Sunderam / MethodsX 3 (2016) 144–155150
[(Fig._5)TD$FIG]
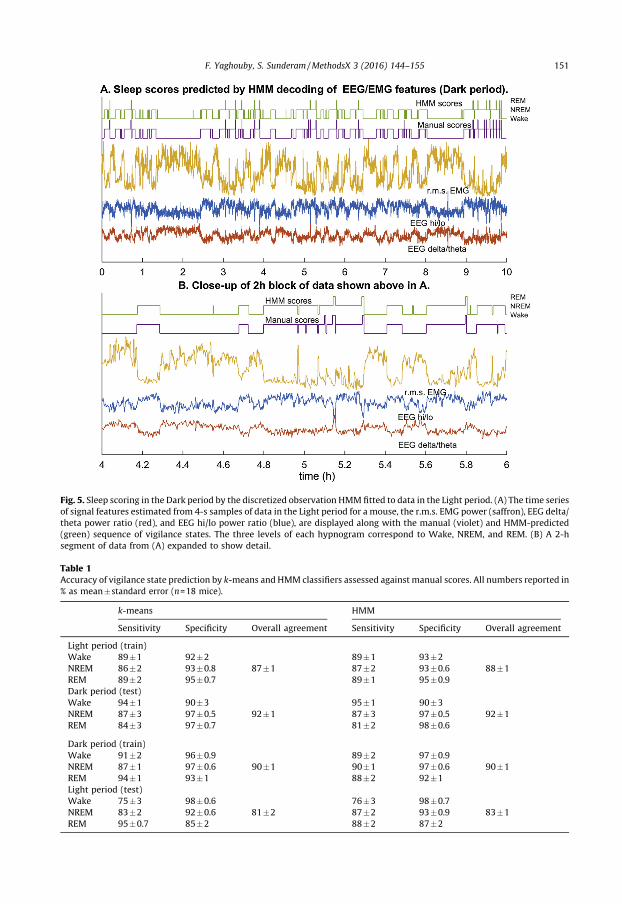
Fig. 5. Sleep scoring in the Dark period by the discretized observation HMM fitted to data in the Light period. (A) The time series
of signal features estimated from 4-s samples of data in the Light period for a mouse, the r.m.s. EMG power (saffron), EEG delta/
theta power ratio (red), and EEG hi/lo power ratio (blue), are displayed along with the manual (violet) and HMM-predicted
(green) sequence of vigilance states. The three levels of each hypnogram correspond to Wake, NREM, and REM. (B) A 2-h
segment of data from (A) expanded to show detail.
Table 1Accuracy of vigilance state prediction by k-means and HMM classifiers assessed against manual scores. All numbers reported in
% as mean�standard error (n=18 mice).
k-means HMM
Sensitivity Specificity Overall agreement Sensitivity Specificity Overall agreement
Light period (train)
Wake 89�1 92�2 89�1 93�2
NREM 86�2 93�0.8 87�1 87�2 93�0.6 88�1
REM 89�2 95�0.7 89�1 95�0.9
Dark period (test)
Wake 94�1 90�3 95�1 90�3
NREM 87�3 97�0.5 92�1 87�3 97�0.5 92�1
REM 84�3 97�0.7 81�2 98�0.6
Dark period (train)
Wake 91�2 96�0.9 89�2 97�0.9
NREM 87�1 97�0.6 90�1 90�1 97�0.6 90�1
REM 94�1 93�1 88�2 92�1
Light period (test)
Wake 75�3 98�0.6 76�3 98�0.7
NREM 83�2 92�0.6 81�2 87�2 93�0.9 83�1
REM 95�0.7 85�2 88�2 87�2
F. Yaghouby, S. Sunderam / MethodsX 3 (2016) 144–155 151
[(Fig._6)TD$FIG]
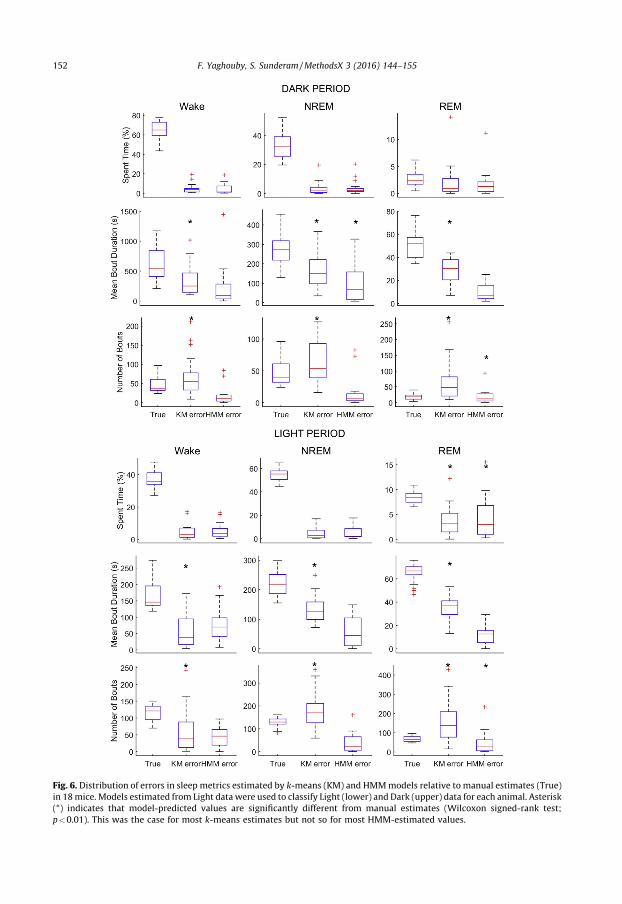
Fig. 6. Distribution of errors in sleep metrics estimated by k-means (KM) and HMM models relative to manual estimates (True)
in 18 mice. Models estimated from Light data were used to classify Light (lower) and Dark (upper) data for each animal. Asterisk
(*) indicates that model-predicted values are significantly different from manual estimates (Wilcoxon signed-rank test;
p<0.01). This was the case for most k-means estimates but not so for most HMM-estimated values.
F. Yaghouby, S. Sunderam / MethodsX 3 (2016) 144–155152
single state when in reality they are dynamically distinct and operate on different timescales. In afuture implementation, we hope to alleviate this behavior using a hierarchical HMM that firstdifferentiates between prolonged sleep and wake bouts, and then models transitions between NREM,REM, and arousal within sleep. Another way to address this problem is to use a generalized Markovmodel framework, in which dwell time distributions for each state are explicitly modeled, and furtherassuming a form for the distribution flexible enough to accommodate (and test for) significantdeviations from a geometric distribution [15].
Validation of the SegWay algorithm on a cohort of mice
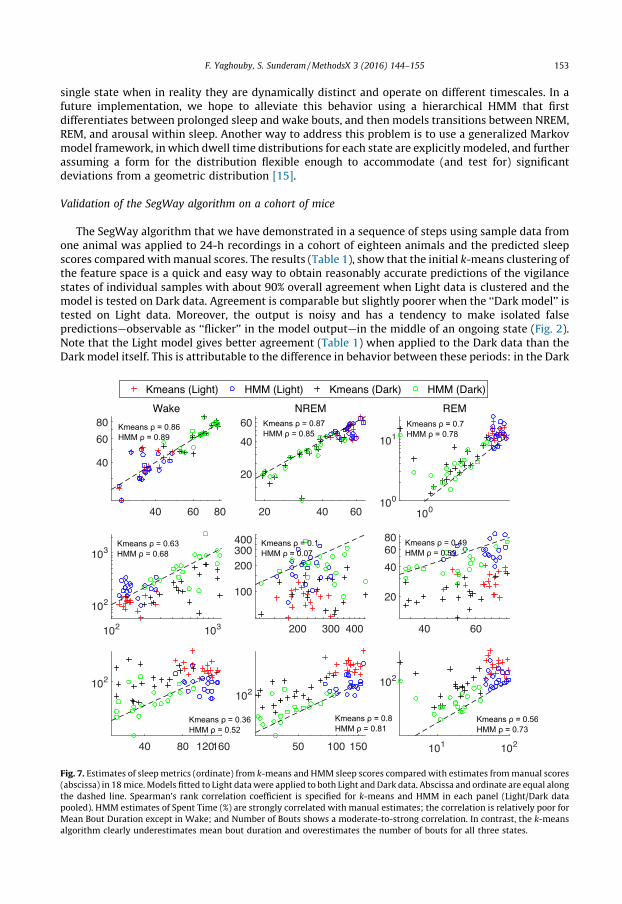
The SegWay algorithm that we have demonstrated in a sequence of steps using sample data fromone animal was applied to 24-h recordings in a cohort of eighteen animals and the predicted sleepscores compared with manual scores. The results (Table 1), show that the initial k-means clustering ofthe feature space is a quick and easy way to obtain reasonably accurate predictions of the vigilancestates of individual samples with about 90% overall agreement when Light data is clustered and themodel is tested on Dark data. Agreement is comparable but slightly poorer when the ‘‘Dark model’’ istested on Light data. Moreover, the output is noisy and has a tendency to make isolated falsepredictions—observable as ‘‘flicker’’ in the model output—in the middle of an ongoing state (Fig. 2).Note that the Light model gives better agreement (Table 1) when applied to the Dark data than theDark model itself. This is attributable to the difference in behavior between these periods: in the Dark[(Fig._7)TD$FIG]
40 60 80
40
60
80Wake
Kmeans (Light) HMM (Light) Kmeans (Dark) HMM (Dark)
20 40 60
20
40
60NREM
100100
101
REM
102 103
102
103
200 300 400
100
200300400
40 60
20
40
6080
40 80 120160
102
50 100 150
102
101 102
102
Fig. 7. Estimates of sleep metrics (ordinate) from k-means and HMM sleep scores compared with estimates from manual scores
(abscissa) in 18 mice. Models fitted to Light data were applied to both Light and Dark data. Abscissa and ordinate are equal along
the dashed line. Spearman’s rank correlation coefficient is specified for k-means and HMM in each panel (Light/Dark data
pooled). HMM estimates of Spent Time (%) are strongly correlated with manual estimates; the correlation is relatively poor for
Mean Bout Duration except in Wake; and Number of Bouts shows a moderate-to-strong correlation. In contrast, the k-means
algorithm clearly underestimates mean bout duration and overestimates the number of bouts for all three states.
F. Yaghouby, S. Sunderam / MethodsX 3 (2016) 144–155 153

period, mice are relatively active and spend much less time in sleep and very little in REM (sometimesas low as 1%). This gives poor estimates of the distribution of REM for the unsupervised models. On theother hand, all three vigilance states are more evenly represented in the Light period, and theirdistributions are therefore better estimated. This leads to more accurate scoring even in the Darkperiod. This underlines the importance of good baseline data when using the model for future out-of-sample analyses.
When the distribution of samples in the feature space is modeled using a larger number of discreteclusters, and these clusters are treated as observations generated by an HMM of the original threeclusters corresponding to vigilance states (Fig. 3), predictions of sleep scores did not appear to be anymore accurate. But the prediction noise is visibly reduced and the classifier is less likely to generatefalse positives (Figs. 4 and 5). This is borne out by the cohort data in Figs. 6 and 7, in which the k-meansand HMM models estimated from Light data are applied separately to Light and then Dark data, andconfirms that incorporating dynamics into sleep classifiers is essential for predicting metrics thatcharacterize the dynamics of sleep.
Conclusions and recommendations
1. The litmus test for a sleep scoring algorithm should be the accuracy with which sleep metrics areestimated from the predicted sequence of scores. Comparison of model-predicted and manualscores (Figs. 4 and 5 and Table 1) and the corresponding estimates of sleep metrics (Fig. 6) suggeststhat the HMM built from observations discretized by k-means clustering gives much more accurateestimates of the number of bouts and mean bout duration of each vigilance state.
2. SegWay is intended as a tool for sleep analysis that, when given a baseline recording, will model thedifferences between vigilance states in an unsupervised manner—i.e., without the need for scoredtraining samples—with reasonable accuracy. Performance is therefore dependent on theavailability of a representative baseline recording in which all vigilance states and their transitionsare reasonably well represented. For this purpose, we recommend the use of several hours of datafrom the Light period in rodents since they are nocturnal by nature. Another reason for attemptingan unsupervised approach is to avoid incorporating a human rater’s bias into the scoring.
3. Once fitted to a baseline EEG recording for an animal, SegWay can then be used to score data fromthe same animal under an experimental condition to evaluate effects on sleep characteristics. Herewe have used data from the Dark period, in which mice are much more active, to test whether sleepcan be scored out of sample by the algorithm. But it certainly does not show how it would workunder sleep restriction or after treatment with a vigilance-modifying drug (e.g., benzodiazepine).Further study is indicated to validate the ability of the algorithm to score sleep under suchconditions.
4. We have emphasized the use of SegWay for scoring baseline and experimental data separatelyfor individual animals. It would of course be interesting to see how each animal’s modelgeneralizes to other animals. It is to be expected that performance will drop due to inter-subjectvariability and signal quality: for instance, placement of EMG electrodes can affect perceivedmuscle tone and the contrast between sleep and wakefulness. The consequent shift in EMGpower, which is not an easy variable to normalize, can cause the locations of clusters in thefeature space to differ from those for the training animal. In our analysis, we found that cross-validation of each animal’s model on another animal’s data was only about 70% accurate in themean, clearly inadequate for most experimental purposes. We would therefore not recommendits use in this manner unless suitably normalized features can be found that do not significantlyalter the distribution of the data.
Supplementary material
A Matlab file segway_sleep.m, and sample Light and Dark feature data (segway_sample_data.mat),are available as supplementary material for readers who wish to use the methodology described herefor their own purposes. The authors request that users cite this paper when using this material.
F. Yaghouby, S. Sunderam / MethodsX 3 (2016) 144–155154
Acknowledgements
This research was supported by a grant (NS083218) from the National Institute of NeurologicalDisorders and Stroke, U.S.A. The authors thank Chris Schildt and Asma’a Ajwad for their help withanimal procedures.
MethodsX thanks the reviewers of this article for taking the time to provide valuable feedback.
Appendix A. Supplementary data
Supplementary data associated with this article can be found, in the online version, at doi:10.1016/j.mex.2016.02.003.
References
[1] L.R. Rabiner, A tutorial on hidden Markov models and selected applications in speech recognition, Proc. IEEE 77 (1989)257–286.
[2] C.J. Winrow, D.L. Williams, A. Kasarskis, J. Millstein, A.D. Laposky, H.S. Yang, K. Mrazek, L. Zhou, J.R. Owens, D. Radzicki, F.Preuss, E.E. Schadt, K. Shimomura, M.H. Vitaterna, C. Zhang, K.S. Koblan, J.J. Renger, F.W. Turek, Uncovering the geneticlandscape for multiple sleep–wake traits, PLoS ONE 4 (4) (2009) e5161.
[3] F. Yaghouby, C.J. Schildt, K.D. Donohue, B.F. O’Hara, S. Sunderam, Validation of a closed-loop sensory stimulation techniquefor selective sleep restriction in mice, IEEE Eng. Med. Biol. Soc. (EMBC) (2014) 3771–3774.
[4] C. Robert, Guilpin, A. Limoge, Automated sleep staging systems in rats, J. Neurosci. Methods 88 (1999) 111–122 (review).[5] B. Flury, A First Course in Multivariate Statistics, Springer, New York, 1997.[6] R.P. Louis, J. Lee, R. Stephenson, Design and validation of a computer-based sleep-scoring algorithm, J. Neurosci. Methods
133 (1–2) (2004) 71–80.[7] K.M. Rytkonen, J. Zitting, T. Porkka-Heiskanen, Automated sleep scoring in rats and mice using the naive Bayes classifier, J.
Neurosci. Methods 202 (2011) 60–64.[8] S. Bastianini, C. Berteotti, A. Gabrielli, et al., SCOPRISM: a new algorithm for automatic sleep scoring in mice, J. Neurosci.
Methods 235 (2014) 277–284.[9] J. Brankack, V.I. Kukushka, A.L. Vyssotski, A. Draguhn, EEG gamma frequency and sleep–wake scoring in mice: comparing
two types of supervised classifiers, Brain Res. 1322 (2010) 59–71.[10] G.A. Sunagawa, H. Sei, S. Shimba, et al., FASTER: an unsupervised fully automated sleep staging method for mice, Genes
Cells 18 (2013) 502–518.[11] B.B. McShane, S.T. Jensen, A.I. Pack, A.J. Wyner, Statistical learning with time series dependence: an application to scoring
sleep in mice, J. Am. Stat. Assoc. 108 (2013) 1147–1162.[12] F. Yaghouby, P. Modur, S. Sunderam, Naive scoring of human sleep based on a hidden Markov model of the
electroencephalogram, IEEE Eng. Med. Biol. Soc. (EMBC) (2014) 5028–5031.[13] A.M. Fraser, Hidden Markov models and dynamical systems, SIAM (2008).[14] S.T. Pan, C.E. Kuo, J.H. Zeng, S.F. Liang, A transition-constrained discrete hidden Markov model for automatic sleep staging,
Biomed. Eng. Online 11 (2012) 52.[15] U. Bockenholt, B.B. McShane, Comments on: latent Markov models: a review of the general framework for the analysis of
longitudinal data with covariates, TEST 23 (2014) 469–472.
F. Yaghouby, S. Sunderam / MethodsX 3 (2016) 144–155 155