Embed Size (px)
Citation preview

Segregation Discovery in aSocial Network of Companies
Alessandro Baroni and Salvatore Ruggieri
Dipartimento di Informatica, Universita di PisaLargo B. Pontecorvo 3, 56127 Pisa, Italy
{baroni,ruggieri}@di.unipi.it
Abstract. We introduce a framework for a data-driven analysis of seg-regation of minority groups in social networks, and challenge it on a com-plex scenario. The framework builds on quantitative measures of segrega-tion, called segregation indexes, proposed in the social science literature.The segregation discovery problem consists of searching sub-graphs andsub-groups for which a reference segregation index is above a minimumthreshold. A search algorithm is devised that solves the segregation prob-lem. The framework is challenged on the analysis of segregation of socialgroups in the boards of directors of the real and large network of Italiancompanies connected through shared directors.
1 Introduction
Social networking services record our connections to friends, colleagues, collab-orators. The analysis of those digital traces can create new comprehensive pic-tures of individual and group behaviour, through the discovery of patterns andmodels, with the potential to transform the understanding of our lives, orga-nizations, and societies. In this paper, we will consider the social problem ofgroup segregation in social networks [8], which is an unjustified separation ordistance in social environments (physical, working, or on-line) of individuals onthe basis of any physical or cultural trait. We present theory and tools, basedon data mining and network science, for data-driven segregation discovery, withtwo main goals. First, we aim at providing a deeper understanding of segre-gation phenomena through the design of analytical processes that proactivelysupport policy makers and control authorities in discovering and in anticipatingpotential segregation problems. Second, we aim at studying the applicability ofproposed methodology in a complex scenario through the analysis of segregationof minority groups in the network of Italian companies linked through shareddirectors in their boards.
The paper is structured as follows. Section 2 provides an overview of segrega-tion indexes from the social science literature. Section 3 introduces the problemof segregation discovery and provides a solution using concepts from itemsetmining. Section 4 challenges the solution on the network of Italian companiesby tackling a few issues arising from the case study. Section 5 concludes andpresents directions for future work.
2 A. Baroni and S. Ruggieri
Fig. 1. Racial spatial segregation in New York City, based on Census 2000 data [7].One dot for each 500 residents. Red dots are Whites, blue dots are Blacks, green dotsare Asian, orange dots are Hispanic, and yellow dots are other races.
2 Segregation Indexes
2.1 On the Notion of Segregation
The term segregation refers to restrictions on the access of people to each other.People are partitioned into two or more groups on the grounds of personal orcultural traits that can foster discrimination, such as gender, age, ethnicity, in-come, skin color, language, religion, political opinion, membership of a nationalminority, etc. Contact, communication, or interaction among groups are lim-ited by their physical, working or socio-economic distance. Members of a grouptend to cluster together when dissecting the society into organizational units(neighborhoods, schools, job types).
In spatial segregation, groups are set apart in neighborhoods where they livein, in schools they attend to, or in companies they work at. As sharply pointedout in Fig. 1, racial segregation very often emerges in most cities characterized byethnic diversity. Schelling’s segregation model [19] shows that there is a naturaltendency to spatial segregation, as a collective phenomenon, even if each indi-vidual is relatively tolerant – in his famous abstract simulation model, Schellingassumed that a person changes residence only if less than 30% of the neighborsare of his/her own race.
Recently, [13] argued that segregation is shifting from ancient forms on thegrounds of racial, ethnic and gender traits to modern socio-economic and cul-tural segregation on the basis of income, job position, and political-religiousopinions. For instance, it has been warned that the personalization of onlinesocial networks may foster segregation and lack of consensus between differentsocial groups, because people are only reinforced in what they already believeand lack exposure to alternative viewpoints and information [16] or because theyare led to self-censorship acts [6] for fear of public opinion on personal thoughts.
Segregation Discovery 3
2.2 Segregation Indexes
A segregation index provides a quantitative measure of the degree of segrega-tion of social groups (e.g., Blacks and Whites) among units of social organization(e.g., schools). Many indexes have been proposed in the literature. [10] representsthe earliest attempt to categorize them. Afterward, the survey [12] provided ashared classification with reference to five key dimensions: evenness, exposure,concentration, centralization, and clustering. We restrict ourselves to binary in-dexes, which assume a partitioning of people into two groups, say majority andminority (but could be Blacks/Whites, women/men, etc.). Let T be size of thetotal population, M be the size of the minority group, and P = M/T be theoverall fraction of the minority group. Assume that there are n units, and thatfor i ∈ [1, n], ti is the population in unit i, mi is the minority population in uniti, and pi = mi/ti is the fraction of the minority group in unit i.
Evenness indexes. Evenness indexes measure the difference in the distri-butions of social groups among the units. They are widely adopted in the socialscience literature on segregation. The mostly referenced indexes are dissimilarityand entropy. The dissimilarity index D is the weighted mean absolute deviationof every unit’s minority proportion from the global minority proportion:
D =1
2 · P · (1− P )
n∑i=1
tiT· |pi − P | (1)
The normalization factor 2 · P · (1 − P ) is to obtain values in the range [0, 1].Since D measures dispersion of minorities over the units, higher values of theindex mean higher segregation. Dissimilarity is minimum when for all i ∈ [1, n],pi = P , namely the distribution of the minority group is uniform over units. Itis maximum when for all i ∈ [1, n], either pi = 1 or pi = 0, namely every unitincludes members of only one group (complete segregation).
A second widely adopted index is the information index, also called the Theilindex [15] in social science, and normalized mutual information in machine learn-ing. Let the population entropy be: E = −P · logP − (1− P ) · log (1− P ), andthe entropy of unit i be: Ei = −pi · log pi− (1−pi) · log (1− pi). The informationindex is the weighted mean fractional deviation of every unit’s entropy from thepopulation entropy:
H =
n∑i=1
tiT· (E − Ei)
E(2)
Information index ranges in [0, 1]. Since it denotes a relative reduction in uncer-tainty in the distribution of groups after considering units, higher values meanhigher segregation of groups over the units. Information index reaches the min-imum when all the units respect the global entropy (full integration) and themaximum when all units contain only one group (complete segregation).
Exposure indexes. Exposure indexes measure the degree of potential con-tact, or possibility of interaction, between members of different groups.
The most used measure of exposure is the isolation index [4], defined as thelikelihood that a member of the minority group is exposed to another member

4 A. Baroni and S. Ruggieri
of the same group in a unit. For a unit i, this can be estimated as the product ofthe likelihood that a member of the minority group is in the unit (mi/M) by thelikelihood that she is exposed to another minority member in the unit (mi/ti,or pi) – assuming that the two events are independent. In formula:
I =1
M·
n∑i=1
mi · pi (3)
The isolation index ranges over [P, 1], with higher values denoting higher seg-regation. The minimum value is reached when for i ∈ [1, n], pi = P , namelythe distribution of the minority group is uniform over the units. The maximumvalue is reached in the same conditions of the previous two indexes. The differ-ences between indexes are the following: (a) H and I are insensitive to units iwhere mi = 0, whilst D is not; (b) D and H are symmetric, i.e., by inverting theminority and majority groups the index remains unchanged, whilst I is not.
Other indexes. The other three classes of indexes are specifically concernedwith spatial notions of segregation. Concentration measures the relative amountof physical space occupied by social groups in an urban area. Centralizationmeasures the degree to which a group is spatially located near the center of anurban area. Finally, clustering measures the degree to which group members livedisproportionately in contiguous areas. We refer the reader to [12] for details.
3 Segregation Discovery
Traditional data analysis approaches from social science typically rely on for-mulating an hypothesis, i.e., a possible context of segregation against a certainsocial group, and then in empirically testing such an hypothesis. For instance, asuspect case of segregation of black female students in high schools from NYC isstudied first by collecting data on race and gender of all high school students inNYC (reference population), and then by computing and analysing segregationindexes over black females (minority group). The formulation of the hypothesis,however, is not straightforward, and it is potentially biased by the expectationsof the data analyst of finding segregation in a certain context. In this process,one may overlook cases where segregation is present but undetected. We proposea data-driven approach, which complements hypothesis testing, by driving thesearch (the “discovery”) of contexts and social groups where a-priori unknownsegregation factors are quantitatively prominent. Recall the previous example.The analyst has to collect data on gender, age, race of students (called segrega-tion attributes), and on city location, school type, and annual fees (called contextattributes). Although no segregation may be apparent in the overall data, it mayturn out that for a specific combination of context attributes (e.g., high schoolslocated in NYC), a specific minority group denoted by a combination of segrega-tion attributes (e.g., black women) is at risk of segregation. We quantify such arisk through a reference segregation index, and assume that a value of the indexabove a given threshold denotes a situation worth for further scrutiny.

Segregation Discovery 5
We call the problem of discovering a-priori unknown minority groups andreference populations for which segregation indexes are above a given threshold,the segregation discovery problem. The problem statement will be formalizedusing notation and concepts from itemset mining [9]. This allows for re-usingmethods and tools from this widely investigated research area. In particular,itemsets will serve to define the search space of segregation discovery. Let R bea relational table (or, simply, a table or a dataset). Tuples in the table denoteindividuals, and attribute values denote information about individuals and unitsthey belong to. Attributes are partitioned into segregation attributes (SA), suchas sex, age, and race, which denote minority groups potentially exposed tosegregation; context attributes (CA) attributes, such as city and job type,which denote contexts where segregation may appear; and an attribute unit,which is an ID of the unit the tuple/individual belongs to. For a discrete attributeA, an A-item is a term A = v, where v ∈ dom(A), the domain of A. We assumethat continuous attributes are discretized into bins [11]. An itemset X is a setof items. As usual in the literature, we write X,Y for X∪Y. A tuple σ from Rsupports X if for every A = v in X, we have σ[A] = v, where σ[A] is the value ofthe attribute A in the tuple σ. The cover of X is the set of tuples that supportX: coverR(X) = {σ ∈ R | σ supports X}. We omit the subscript R if it is clearfrom the context. E.g., cover(sex=female, age=[20-29]) is the set of womenin their 20s included in the dataset. The (absolute) support of X is the size ofits cover, namely supp(X) = |cover(X)|.
We write A,B to denote an itemset where A is non-empty and it includesonly SA-items, and B includes only CA-items. We call A a non-empty SA-itemset, and B a CA-itemset. We are now in the position to extend the notationof the segregation indexes to a reference population, which is the cover of B,and to a reference minority group, which is the cover of A.
Definition 1. Let s() be a segregation index. For an itemset A,B we denote bys(A,B) the segregation index calculated for the population in cover(B) consid-ering as minority population those in cover(A,B).
As an example, D(A,B) is the dissimilarity index, where T = supp(B),M = supp(A,B), ti = supp(B, unit=i), and mi = supp(A,B, unit=i). Recon-sidering the example above, we would fix A as race=black,sex=female and Bas city=NYC. D((race=black,sex=female), city=NYC) is then the dissimilarityindex of segregation of black females in the high schools of NYC.
We introduce now the problem of segregation discovery.
Definition 2. Let s() be a segregation index, and α a fixed threshold.An itemset A,B is α-integrative w.r.t. s() if cover(B) = ∅ or s(A,B) ≤ α.
Otherwise, A,B is α-segregative. The problem of segregation discovery consistsof computing the set of α-segregative itemsets.
Intuitively, we are interested in finding itemsets A,B denoting a minoritysub-group (non-empty A) and a non-trivial context (B with non-empty cover)where the segregation index s() is above the α threshold.

6 A. Baroni and S. Ruggieri
Input: relational table R with context attributes (CA), segregation attributes(SA), unit attribute unit with a total of n units.
Output: segregation index values s(A,B).1 foreach B CA-itemset do2 T = 0;3 foreach i ∈ [1, n] do4 ti = supp(B, unit=i);5 T += ti6 end7 foreach A non-empty SA-itemset do8 M = 0;9 foreach i ∈ [1, n] with ti > 0 do
10 mi = supp(A,B, unit=i);11 M += mi
12 end13 sum = 014 foreach i ∈ [1, n] with ti > 0 do15 sum += fs(mi, ti, M, T)16 end17 s(A,B) = gs(sum, M, T)
18 end
19 endAlgorithm 1: Segregation index computation.
Algorithm 1 is a solution to the problem of computing s(A,B) for a segrega-tion index s() and all itemsets A,B. It can readily solve the segregation problemby filtering itemsets whose index is lower or equal than the threshold α. We as-sumes that the support counting function supp() is available. We implementedit by storing the subset of R at each unit as an array of bitmaps, one bitmap pereach CA and SA item. Position i of a bitmap is set to 1 iff the ith tuple of theunit supports the item associated to the bitmap. Support counting consists thenof bitmap and-operations. An alternative way of implementing supp() is throughthe construction of an FP-tree, a compressed representation of a dataset usedfor frequent itemset mining [9]. The outer loop (lines 1-19) of the algorithm it-erates over all CA-itemsets B. For each of them, the total population size T iscalculated at lines 3–6. The inner loop (lines 7–18) iterates over all non-emptySA-itemsets A. First, the size M of the minority is calculated at lines 9–12. Weaccumulate the results of a function fs() over each unit, and then pass it to thenormalization function gs(). These two functions depend on the segregation in-dex s(). For the information index, we observe that H = 1−(
∑ni=1 ti ·Ei)/(T ·E).
Hence, fs(mi, ti,M, T ) = ti ·Ei and gs(sum,M, T ) = 1− sum/(T ·E), where Ei
and E are clearly calculable from mi, ti and from M,T respectively.
Let δ =∑
A |dom(A)| be the sum of the sizes of domains of context andsegregation attributes, and π =
∏A |dom(A)| be their product. Algorithm 1 has
worst-case time complexity of O(π|R|). Our bitmap-based implementation hasspace complexity of Θ(δ|R|). We will present actual performances on a large

Segregation Discovery 7
dataset later on. Notice that Apriori-like optimizations in the index calculationsare not possible since D and H are not anti-monotonic, and I is monotonic onlyw.r.t A – i.e., I(A ∪A′,B) ≤ I(A,B).
4 Segregation Discovery in Social Networks of Companies
We will challenge the framework for segregation discovery in a complex scenariowith a real and large dataset. We are interested in studying segregation of minor-ity groups (youngsters, seniors, females) in the boards of companies. The socialsegregation question we intend to study is: which minority groups are segregatedin the boards of companies and for which type of companies? A possible an-swer may lead to the discovery that, e.g., for IT companies, females in a certainage-range appear frequently together in boards and rarely with members of themajority group (men or individuals in other age-ranges). In the following, wefirst introduce the notion of social network of companies, then report some basicfacts on the running case study of the network of Italian companies, and finallychallenge the segregation discovery framework on such a case study.
4.1 Social Networks of Companies
The board of directors (BoD) is a body of elected or appointed members whojointly oversee the activities of the company. The presence of a director is thenumber of BoDs the director belongs to. If presence is two or higher, the directoris called a bridge director. As an example, the board of a controlled companytypically includes directors from the board of the controlling company. Otherreasons for multiple presence include partnership consolidation, collusion, coop-tation, monitoring, political influence, friendship, kinship, etc. The presence of asame director in the boards of two companies (interlocking directorate) can thenbe considered a signal of business, personal, or other forms of relationship andinformation exchange between the two companies [14]. Under this “social tie”assumption, we model a social network of companies by linking those companiesthat share at least one director [3].
Let N = {1, . . . , N} be a set of company IDs, and for i ∈ N , let BoD(i) ⊆D be the board of directors of company i, whereD = {1, . . . , D} is the set ofdirectors IDs. A social network of companies is a weighted undirected graphG = 〈N , E〉 where a weighted edge (i, j, w) is in E ⊆ N ×N×R iff w = |BoD(i)∩BoD(j)| > 0, i.e., if companies i and j share at least one director. Intuitively,w is a measure of the strength of ties between the boards of directors of i andj. We write eij = 1 if (i, j, w) ∈ E , and ei j = 0 otherwise. We denote by L the
number of edges, i.e., L = |E|, and by ki the degree of node i, i.e., ki =∑N
j=1 eij .A node is called isolated if its degree is 0. A connected component (CC) is amaximally connected subgraph of G.

8 A. Baroni and S. Ruggieri
100 101 102 103 104
BoD size
10-1
100
101
102
103
104
105
106
107
Count
100 101 102 103
k
10-12
10-11
10-10
10-9
10-8
10-7
10-6
10-5
10-4
10-3
10-2
10-1
100
p(X=k)
Fitted log-spaced bins (xmin=5)
Tr. power law fit (®=2:421;¸=0:026)
100 101 102 103
k
10-1
100
101
102
103
104
105
106
Count
Fig. 2. Distrib.: BoD size (left), director presence (center), node degree (right).
4.2 The Social Network of Italian Companies
The Italian Business Register records information on all Italian companies anddirectors. We had a unique access to a complete 2012 snapshot of the registry.A company can be structured as a partnership, a corporation, or other nationalforms. For corporations, the BoD is elected by shareholders, while for a partner-ship the BoD includes all partners.
There is a total of N ' 2.2 · 106 registered companies, and D ' 3.7 · 106
directors. The network has L ' 5.9 × 10⁶ edges. Around 0.7 · 106 nodes areisolated (i.e., degree is 0). This amounts at 35.2 % of the total number of nodes,and it is quite representative of the Italian scenario, where tiny/family businessesare widespread. Fig. 2 reports the distributions of BoD size, director presence,and node degree. Distributions are heavily tailed (notice the log-log plot), butonly for director presence there is a good fit by a truncated powerlaw (we usedthe software from [2]). A few directors appear in hundreds of boards (one ofthem appears in as many as 404 boards). We investigated the reasons of suchimpressively high numbers, and found two explanations. First, when a companyis winding-up because of bankruptcy, an official receiver is appointed by thecourt as an interim receiver and manager of the company. Such directors areindependent experts appointed in many boards and for a possibly long period.Second, there are groups of companies with a pyramidal structure [1] sharing thesame directors. An example is the outlier in Fig. 2 (right), representing a cliqueof 250 companies having a same person as the unique director in their boards.In order to reduce the impact of the two special cases above on the density ofthe social network of companies, we removed from the set of directors the 0.01%with the highest presence. The age distribution of directors is shown in Fig. 3(left). The plot sadly highlights the glass-ceiling reality for women, who sufferfrom a under-proportional representativeness in top-level job positions.
4.3 Segregation Discovery
We aim at exploiting the segregation discovery framework and algorithm ofSection 3 to the case study of the social network of Italian companies. The datasetunder analysis will contain one tuple for each director. Available segregationattributes include: gender, age (discretized into 5 equal-frequency bins). Context

Segregation Discovery 9
20 30 40 50 60 70 80 90Age
0K
10K
20K
30K
40K
50K
60K
70K
80K
Num
ber
of
dir
ect
ors
male
female
100 101 102 103
k
10-9
10-8
10-7
10-6
10-5
10-4
10-3
10-2
10-1
100
p(X=k)
Fitted log-spaced bins (xmin=6)
Tr. power law fit (®=3:252;¸=0:051)
100 101 102 103
k
10-10
10-9
10-8
10-7
10-6
10-5
10-4
10-3
10-2
10-1
100
p(X=k)
Fitted log-spaced bins (xmin=8)
Power law fit (®=3:592)
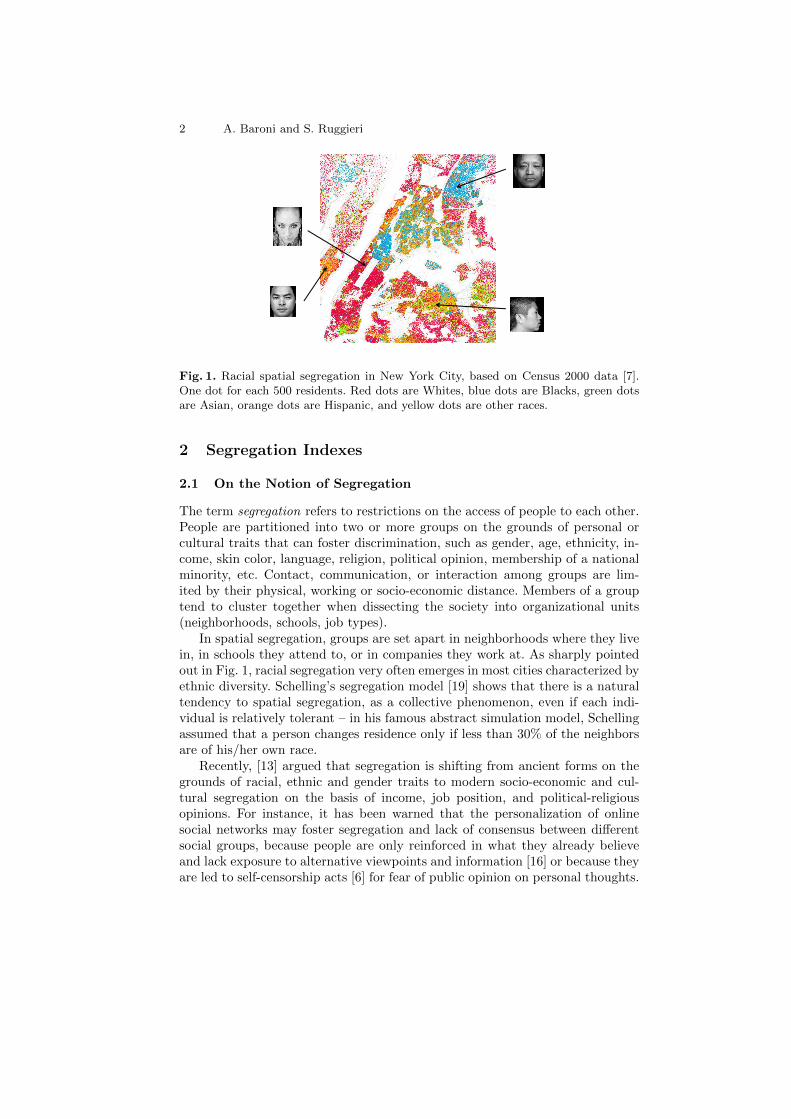
Fig. 3. Left: age distribution. Center: distribution of size of CCs before (center, withoutthe giant component) and after (right) splitting the giant component.
attributes include the company sector (the top level of a hierarchical classificationused by the Italian official statistics institute), with 21 possible values, and theregion of residence of the director (north-east, north-west, center, south, islands,abroad). In this section, we discuss three issues that challenge the framework ofSection 3, and devise solutions for overcoming them.
Segregation index definitions assume a partitioning of individuals into unitsof social organization (schools, neighborhoods, communities). The first challengein the context of social networks of companies is then to define how such unitsare defined. Intuitively, a unit is a set of companies within which directors canget in contact, either directly (because they belong to a same BoD) or indirectly(e.g., through a bridge director connecting two BoDs).
Our approach is to consider a structural decomposition of the social networkgraph into groups of companies, i.e., sub-graphs, each one representing a unit.A natural candidate is to consider the decomposition based on connected com-ponents (CCs). The distribution of the size of CCs, shown in Fig. 3 (center),is fitted by a truncated powerlaw. In addition to the isolated nodes, there are251 · 103 other CCs with size in the range [2-99], and one giant component con-sisting of 642 · 103 nodes (not shown in the figure). The number of directors inthe giant component amounts at 20% of the total. This means that the giantcomponent weights 20% in the calculation of dissimilarity and information gainsegregation indexes (for the isolation index, the weight depends also on the sizeof minority mi). This may prevent segregation from being discovered, becausethe giant component may hide segregated finer-grained units within it. We claimthat the giant component need to be further split. Observe that our assumptionthat bridge directors represent signals of relationships between two companiesdoes not account for the strength of such signals. We exploit this intuition tosplit the giant component into components by removing edges in it that repre-sent “weaker ties”. Recall that the weight of an edge between nodes i and j isw = |BoD(i) ∩ BoD(j)|, i.e., the number of shared directors. We remove edgesfrom the giant component whose weight is lower or equal than a threshold. Theselected threshold (w ≤ 3) is the lowest that leads to no giant component. Theresulting distribution of CCs, shown in Fig. 3 (right), is fitted by a powerlaw

10 A. Baroni and S. Ruggieri
with exponent close the the original distribution without the giant component.The total number of CCs is now ' 1.6 · 106.
The second challenge in segregation discovery originates by the splitting ofthe giant component. In fact, a side effect of any splitting is that in the resultingnetwork a bridge director may appear in two or more units. This is not accountedfor in the framework of Section 3, which assumes that an individual belongs toonly one unit. We will consider multiple instances of bridge directors in differentunits as distinct individuals. With reference to the notation of Sect. 2.2, werevise the definitions of the size of population T and minority group M bysetting T =
∑ni ti and M =
∑ni mi, i.e., by counting every occurrence of an
individual in any unit, not every individual. Algorithm 1 remains unchangedbecause it already computes T and M as above.
The third challenge is motivated by the need of including characteristics ofcompanies among the context attributes, so that segregation, e.g., in the subnet-work of IT companies, can be discovered. However, bridge directors may appearin BoDs of companies with different characteristics. How do we model this in ourframework? We use multi-valued attributes, by admitting that, for an attributeA and a tuple σ, σ[A] ⊆ dom(A) (instead of simply, σ[A] ∈ dom(A)). As an ex-ample, the industry sector of a director is defined as the set of industry sectorsof companies where the director appears, e.g., σ[sector] = { IT, Banks }. Ourframework can be extended to admit multi-valued tuples by simply extendingthe notion of support as follows: a tuple σ supports X if for every A = v in X, wehave v ∈ σ[A] if A is multi-valued, and σ[A] = v otherwise. On the implementa-tion side, this extension does not require drastic changes. The support countingmethod has to be initialized with a set of transaction items A = v1, . . . , A = vkfor {v1, . . . , vk} = σ[A] instead of simply with A = v for v = σ[A]. In our bitmapbased implementation, for a multi-valued attribute A, a tuple σ will lead to setto 1 all the bitmaps of the values in σ[A].
4.4 Segregation Discovery: Findings
The dataset processed as described in the previous section consists of 4.6 ·106 tu-ples, 2 context attributes (residence, sector), 2 segregation attributes (age, sex),and the unit attribute. We have applied Algorithm 1 on the dataset to calculatethe D, H, and I segregation indexes. The total running time of the algorithmwas of 110 seconds, on a commodity PC with Intel Core [email protected] with16 Gb of RAM, Windows 7 OS, and Java 8 as programming language.
The affordable running time allows for more advanced data analysis than theone stated by the definition of segregation discovery, namely selecting/rankingitemsets A,B whose index is above a given threshold. We are in the positionof providing the segregation analyst with a data cube of indexes for exploratoryanalysis in the style of OLAP cubes. Here, indexes play the role of metrics,and context and segregation attributes play the role of dimensions. Also, con-straints on the sizes T (resp., M) of the population (resp., minority group) canbe provided to guide the analysis.

Segregation Discovery 11
Let us present here three real cases. By setting a minimum M ≥ 103, theitemset with the highest dissimilarity index:
sector=‘agriculture’, age=‘<=38’, sex=‘F’ (D = 0.916, H = 0.605, I = 0.431)
regards the population of directors of in the agriculture sector, with women up to38 years old as minority population. Segregation in agriculture is a well-knownphenomenon. Excluding such a sector, the highest information index is for:
residence=‘abroad’, age=‘>=53’ (D = 0.75, H = 0.675, I = 0.805)
the population of directors with residence abroad, and for the minority of di-rectors with age of 53 years or more. Finally, excluding foreign directors, thehighest isolation index is for:
sector=‘electricity’, sex=‘M’ (D = 0.625, H = 0.411, I = 0.907)
directors of companies producing or supplying electric power or gas, with minor-ity population the male directors. In this case, segregation of males means theyhave 90.7% of likelihood of getting in contact with other males in their board orthrough bridge directors.
5 Conclusions and Future Work
We have formulated the problem of segregation discovery in social networks, de-vised a solution that provides the data analyst with a data cube of segregationindexes for exploratory analysis, and challenged the approach on a complex sce-nario with a real and large dataset regarding segregation in boards of directors.
Several issues remain open for future investigation.
First, relations with research streams that appear closely linked must be ex-plored. One related field is community discovery in attributed graphs [5], wheregraph clustering algorithms exploit both the structural dimension of the socialgraphs as well as a compositional dimension represented by features of nodes.Another related field is discrimination discovery [18], where the objective is tosearch for contexts with a disproportionate distribution of socially sensitive deci-sions (granting of a loan, admission to school, hiring, etc.) among social groups.
Second, the proposed framework need to be further validated, e.g., on whetherit is able to cover more complex segregation index definitions and applicationscenarios, and on whether Algorithm 1 scales to a large number of attributes. Theimpact of different segregation indexes on the top segregative itemsets shouldalso be evaluated, as done in [17] for discrimination indexes. The final objec-tive will be a complete framework and working system for OLAP analysis ofsegregation in social networks.
Finally, we argue that segregation discovery is half way towards the morechallenging objective of segregation-aware data mining and social network analy-sis. The objective here is the development of segregation-aware data analysis anddata mining models that, by design, can provide a guarantee about the impactof computer-supported decisions (e.g., link predictions, group recommendation)on individuals and social groups, about the possibilities of interaction betweenthem, and about the increase of social cohesion of society at large.

12 A. Baroni and S. Ruggieri
References
1. Almeida, H.V., Wolfenzon, D.: A theory of pyramidal ownership and family busi-ness groups. The Journal of Finance 61(6), 2637–2680 (2006)
2. Alstott, J., Bullmore, E., Plenz, D.: powerlaw: A Python package for analysis ofheavy-tailed distributions. PLoS ONE 9(1), e85777 (2004)
3. Battiston, S., Catanzaro, M.: Statistical properties of corporate board and directornetworks. The European Physical Journal B 38(2), 345–352 (2004)
4. Bell, W.: A probability model for the measurement of ecological segregation. SocialForces pp. 357–364 (1954)
5. Bothorel, C., Cruz, J.D., Magnani, M., Micenkova, B.: Clustering attributedgraphs: Models, measures and methods. Network Science FirstView, 1–37 (2015)
6. Das, S., Kramer, A.D.I.: Self-censorship on Facebook. In: Proc. of the Int. Confer-ence on Weblogs and Social Media (ICWSM 2013). The AAAI Press (2013)
7. Fischer, E.: Distribution of race and ethnicity in US major cities (2011), publishedon line at http://www.flickr.com/photos/walkingsf under Creative Commons li-cence, CC BY-SA 2.0
8. Freeman, L.C.: A set of measures of centrality based on betweenness. Sociometrypp. 35–41 (1977)
9. Han, J., Cheng, H., Xin, D., Yan, X.: Frequent pattern mining: Current status andfuture directions. Data Mining and Knowledge Discovery 15(1), 55–86 (2007)
10. James, D.R., Tauber, K.E.: Measures of segregation. Sociological Methodology 13,1–32 (1985)
11. Liu, H., Hussain, F., Tan, C.L., Dash, M.: Discretization: An enabling technique.Data mining and knowledge discovery 6(4), 393–423 (2002)
12. Massey, D.S., Denton, N.A.: The dimensions of residential segregation. Social forces67(2), 281–315 (1988)
13. Massey, D.S., Rothwell, J., Domina, T.: The changing bases of segregation in theUnited States. Annals of the American Academy of Political and Social Science626, 74–90 (2009)
14. Mizruchi, M.S.: What do interlocks do? An analysis, critique, and assessment ofresearch on interlocking directorates. Annual Review of Sociology 22(1), 271–298(1996)
15. Mora, R., Ruiz-Castillo, J.: Entropy-based segregation indices. SociologicalMethodology 41, 159–194 (2011)
16. Pariser, E.: The Filter Bubble: What the Internet is hiding from you. Penguin UK(2011)
17. Pedreschi, D., Ruggieri, S., Turini, F.: A study of top-k measures for discriminationdiscovery. Proc. of ACM Int. Symposium on Applied Computing (SAC 2012). pp.126–131. ACM (2012)
18. Romei, A., Ruggieri, S.: A multidisciplinary survey on discrimination analysis. TheKnowledge Engineering Review 29(5), 582–638 (2014)
19. Schelling, T.C.: Dynamic models of segregation. Journal of mathematical sociology1(2), 143–186 (1971)