Embed Size (px)
Citation preview
International Journal of Computer Applications (0975 – 8887)
Volume 95– No.16, June 2014
22
Segmentation of Multi-Textured Images using Optimized
Local Ternary Patterns
G. Madasamy Raja Associate Professor,
Department of Information Technology, PET Engineering College, Vallioor,
Tamilnadu – 627117, India
V. Sadasivam, Ph.D Principal,
PSN College of Engineering & Technology, Tirunelveli,
Tamilnadu – 627152, India
ABSTRACT
Texture segmentation is a process of segmenting an image
into differently textured regions. This paper is aimed at the
segmentation of multitextured images by using Optimized
Local Ternary Patterns (OLTP), a new texture model which is
recently proposed for texture analysis. This paper uses
unsupervised texture segmentation method with the
application of optimized local ternary patterns for finding the
dissimilarity of adjacent image regions during the
segmentation process. The performance of this recently
proposed texture measure OLTP is evaluated, compared with
other texture models Texture Spectrum (TS) and Local Binary
Patterns (LBP) and found to be the best.
Keywords
Texture Spectrum, Texture Segmentation, Kullback-Leibler
Distance, Local Binary Patterns, Optimized Local Ternary
Patterns, Brodatz Textures.
1. INTRODUCTION Image segmentation is a useful tool in many applications for
identifying regions of interest (ROI) in a digital image [1].
Undoubtedly texture is one of the principal features used in
image processing and pattern recognition [2]. Texture plays
an important role in many machine vision tasks such as
surface inspection, scene classification, surface orientation,
and shape determination. Texture can be characterized by the
spatial distribution of image pixel values in a neighborhood
region. Though texture is widely used it has no precise
definition due to its wide variability [3]. Since a digital image
is made up of pixels, texture can be defined as an entity
consisting of mutually related group of pixels. This group of
pixels is called as texture primitives or texture elements or
texels [4].
Texture analysis is one of the most important techniques used
in the investigation and interpretation of images that consists
of repetition or quasi repetition of some fundamental image
elements [5]. Texture classification and Texture segmentation
are the primary issues in texture analysis. In texture
classification, a given texture region is identified from a given
set of texture classes using various texture features. Unlike
texture classification, texture segmentation determines the
boundaries between various textured regions in an image [6].
Texture segmentation is a process which accurately partitions
an image into several distinct textured regions.
The segmentation can be either supervised or unsupervised.
Unsupervised segmentation is a very challenging research
problem in which only limited success has been achieved so
far because no prior information about the textures present in
the image is available. Usually, one does not know what types
of textures exist in an image, how many textures there are,
and what regions contain which textures [7]. Some examples
for unsupervised texture segmentation methods are split-and-
merge technique [8], quad tree method that combines
statistical information with spatial information [9], and texture
spectrum technique [10]. Unsupervised segmentation of
images containing texture primitives at very different scales is
not viable, because it is hard to discriminate small image
regions from large texture primitives without any prior
knowledge [11].
In supervised segmentation, prior knowledge of the type of
textures present in the image is available. Texture
segmentation with stochastic optimization [12] and Texture
segmentation using optimized separation [13] are some
examples in the literature for supervised segmentation. For
any textured analysis, the main conceptual difficulties are to
define a texture measure and a texture classification method
[14].
There are two categories for texture measures and they are
Model based and Non-Model based texture measures. Model
based texture measures construct an image model which is
based on the original image to describe the texture. Gibbs
Markov Random Field (GMRF) [15] and Auto Regressive
model [16] are some examples for model based texture
measurement. Markov Random Field assumes that the
intensity at each pixel in the image depends on the intensities
of only neighboring pixels whereas Auto Regressive model
approximates a pixel in an image as the linear combination of
its local neighbors.
Statistical, Structural and Transform based methods are few
methods which are coming under the category of Non-Model
based texture measures. Statistical methods deals with first
order and second order statistics of image pixels where as
Structural methods describe textures as combination of well
defined texture primitives that are placed according to some
syntactic rules. Transform based methods represent an image
in a new form so that the texture characteristics of texture can
be more easily accessed. Fan and Xia [17] used the
relationship between the periodicity of natural textures and
subbands of wavelet transforms. Colour contrast was used in
the segmentation methods of both Chen et al. [18] and Chang
et al. [19]. By using a color gradient detection technique, a
new color image segmentation algorithm was proposed by
Luis Ugarriza et al. [20]. Uniform Extended Local Ternary
Patterns by Wen-Hung Liao and Young [21], Ternary Pattern
Operator by Suguna and Anandhakumar [22] and Compound
Local Binary Pattern (CLBP) by Faisal Ahmed et al. [23] are
International Journal of Computer Applications (0975 – 8887)
Volume 95– No.16, June 2014
23
some recent developments in the textural analysis under Non-
Model based texture measures.
Texture classification results obtained by using Optimized
Local Ternary Patterns (OLTP), a recent study by Madasamy
Raja and Sadasivam [24], have already been proved better
than those obtained with the existing methods. This OLTP
texture model may also be used for texture segmentation of
multitextured images. The aim of this paper is to further
evaluate the performance of OLTP in the discrimination of
textures that are available in multitextured images and
demonstrate its usefulness for texture segmentation.
This paper is organized as follows: Section 2 describes
already existing texture measures Texture Spectrum (TS) and
Local Binary Patterns (LBP). In this section, the newly
proposed texture model Optimized Local Ternary Patterns
(OLTP) is also briefly reviewed. Segmentation algorithm
which is common to all the experiments in this paper is
illustrated in Section 3. Experimental results are then
discussed in section 4 and conclusions are given in section 5.
2. TEXTURE MEASURES This section gives a brief review of computationally efficient
texture feature extraction methods namely Texture Spectrum
(TS), Local Binary Patterns (LBP) and Optimized Local
Ternary Patterns (OLTP).
2.1 Texture Spectrum (TS) In this method, the local texture information is extracted by
comparing the central pixel (gc) of a 3x3 local neighborhood
with its 8 neighbors (gi, i=0,1,2,…,8). This 3x3 neighborhood
region constitutes the smallest unit called “Texture Unit (TU)”
that contains the comparison results of eight surrounding
neighbors with the center pixel. In a 3x3 neighborhood
region, there will be 8 such comparison results (E1, E2, E3,
E4, E5, E6, E7, E8)
cg
ig if 2
cg
ig if 1
cg
ig if 0
iE for i=1,2,3,…8 (1)
As such element of TU has one of three possible values (0 or
1 or 2), TU ranges from 0 to 6560 and in total there are 6561
texture units (38). The histogram of these texture units forms
a ‘Texture Spectrum’ that represents the image texture
description and it can be used as a texture measure for texture
analysis. The main disadvantage of this method is its
complexity due to large number of texture units that ranges
from 0 to 6561.
2.2 Local Binary Patterns (LBP) The texture model Local Binary Patterns (LBP) was originally
introduced by Ojala et al. [25] and it was really a very
powerful method for texture representation. LBP has been
used successfully for a variety of pattern recognition tasks. It
considers a 3x3 neighborhood and uses the value of the center
pixel of that neighborhood as a threshold, to label the pixels of
the neighborhood region. All these 8 labeled values form a
binary sequence which is considered as a pattern string.
For a 3x3 neighborhood around a centre pixel in an image, the
LBP operator is defined as
otherwise 0
0,u if 1S(U)
and
)ii S(2LBP cn
8
1n
n
8
(2)
where n is the number of pixels in the considered
neighborhood, ic is the pixel value of center pixel c and in are
the pixel values of neighborhood considered. So, for a 3x3
neighborhood a total of 256 (28) different pattern strings can
be generated. An entire image can be represented by a pattern
histogram of 256 elements, which can be used as the texture
descriptor.
In LBP, when larger neighborhoods are used,
correspondingly, the number of pattern strings will get
increased. When the subset of pattern strings is considered,
the length of the pattern histogram is reduced. With the
introduction of the concept of uniform patterns, the length of
pattern histogram was further reduced without significant loss
in its discrimination ability. As the correlation between pixels
in a small neighborhood region is high, LBP efficiently
represents the texture information in a digital image. LBP
operator is invariant to any gray scale transformation. In the
limitation point of view, LBP supports only a binary level
comparison for encoding and so it is inadequate to represent
the local texture information in more detail. Moreover it is
sensitive to noise also.
2.3 Optimized Local Ternary Patterns
(OLTP) In OLTP, a texture image can be decomposed into a set of
small units called patterns. As the texture model OLTP uses
only optimal patterns (selected number of uniform patterns),
the length of the pattern histogram is maintained as optimum.
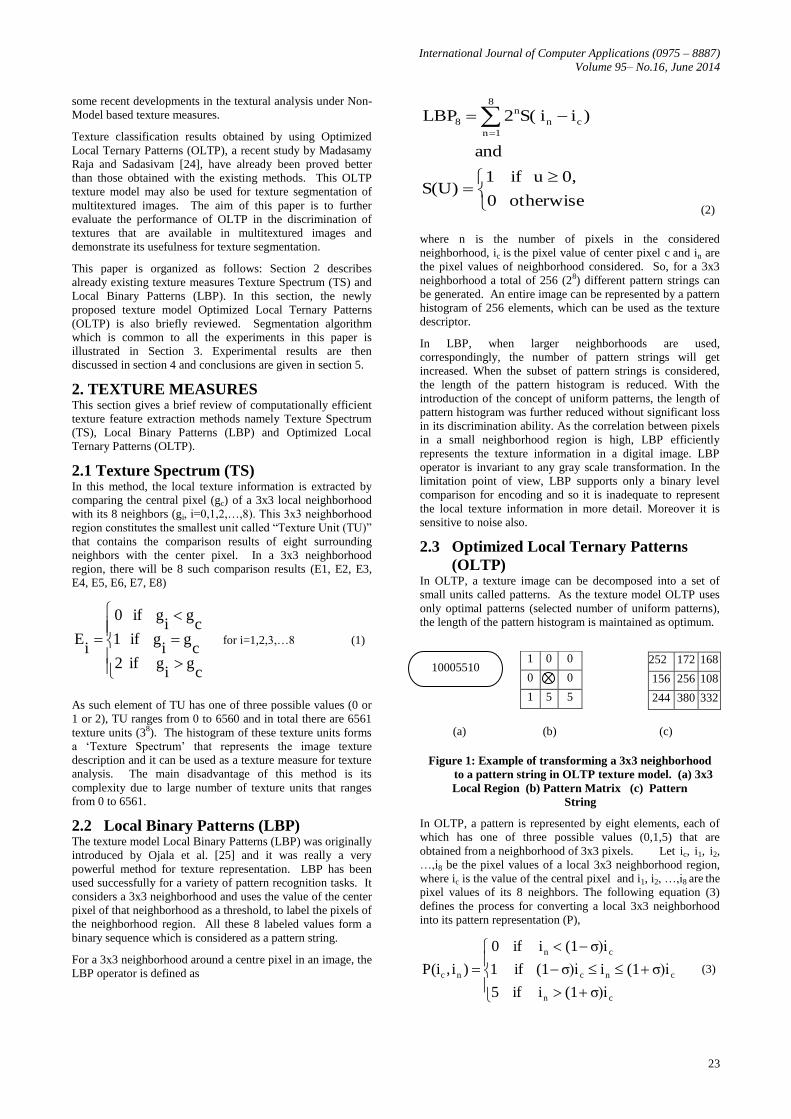
(a) (b) (c)
Figure 1: Example of transforming a 3x3 neighborhood
to a pattern string in OLTP texture model. (a) 3x3
Local Region (b) Pattern Matrix (c) Pattern
String
In OLTP, a pattern is represented by eight elements, each of
which has one of three possible values (0,1,5) that are
obtained from a neighborhood of 3x3 pixels. Let ic, i1, i2,
…,i8 be the pixel values of a local 3x3 neighborhood region,
where ic is the value of the central pixel and i1, i2, …,i8 are the
pixel values of its 8 neighbors. The following equation (3)
defines the process for converting a local 3x3 neighborhood
into its pattern representation (P),
cn
cnc
cn
nc
σ)i(1i if 5
σ)i(1iσ)i(1 if 1
σ)i(1i if 0
)i,P(i (3)
1 0 0
0 0
1 5 5
252 172 168
156 256 108
244 380 332
10005510
International Journal of Computer Applications (0975 – 8887)
Volume 95– No.16, June 2014
24
where σ is a small scaling factor and it is assigned as 0.05.
Figure 1 shows an example of transforming a sample 3x3
local neighborhood into a pattern unit by using equation (3).
For a 3x3 local neighborhood region, the total number of
different pattern strings will be 6561(38). In other words, Eq.
3 will deliver any one pattern string from a set of 6561
different pattern strings for a 3x3 local neighborhood region
when OLTP texture model is used. So, by using this OLTP
texture model a complete texture image can be described by a
pattern histogram of 6561 bins that represents the occurrence
frequency of pattern strings over the texture image.
It is observed that for a 3x3 local neighborhood of a texture
image, only few pattern strings among these 6561 different
pattern strings, are frequently occurring patterns and all other
pattern strings are not so. So it is meaningless to allot separate
bins for all the pattern strings because it may end in wastage
of memory and wastage of time. Further, the analysis of these
frequently occurring pattern strings found that all these pattern
strings have uniform circular structure and they are rotation
invariant. To identify these frequently occurring pattern
strings which are rotation invariant, let us consider, a
uniformity measure ‘U’ which corresponds to the number of
spatial transitions circularly among the sub patterns in the
pattern strings. The uniformity measure ‘U’ is defined as
8
2n
1ncnc8c1c ))i,P(i),i,F(P(i))i,P(i),i,F(P(iU
where F(A,B) =
otherwise 0
0 |BA| if 1 (4)
For example, the pattern string 11111111 has U value of 0,
the pattern string 00000055 has U value of 2 and the pattern
string 55501111 has U value of 3. Patterns with U value of
less than or equal to three are considered as “Uniform Pattern
Strings” and totally 45 uniform pattern strings are available.
The implementation of a new idea to calculate the Transition
Length (ρ) among the uniform patterns and the introduction of
a new concept called Level of Optimality (Lopt) have paved
the way to select the subset of uniform patterns which are
designated as optimal patterns. The elements of the uniform
pattern strings are either 0 or 1 or 5 or any combinations of
these values. If the number of occurrences (cardinality) of 0,
1 and 5 are represented by Card(0), Card(1) and Card(5)
respectively, then the level of optimality for a particular uniform pattern string can be computed as,
(a) (b) (c) (d)
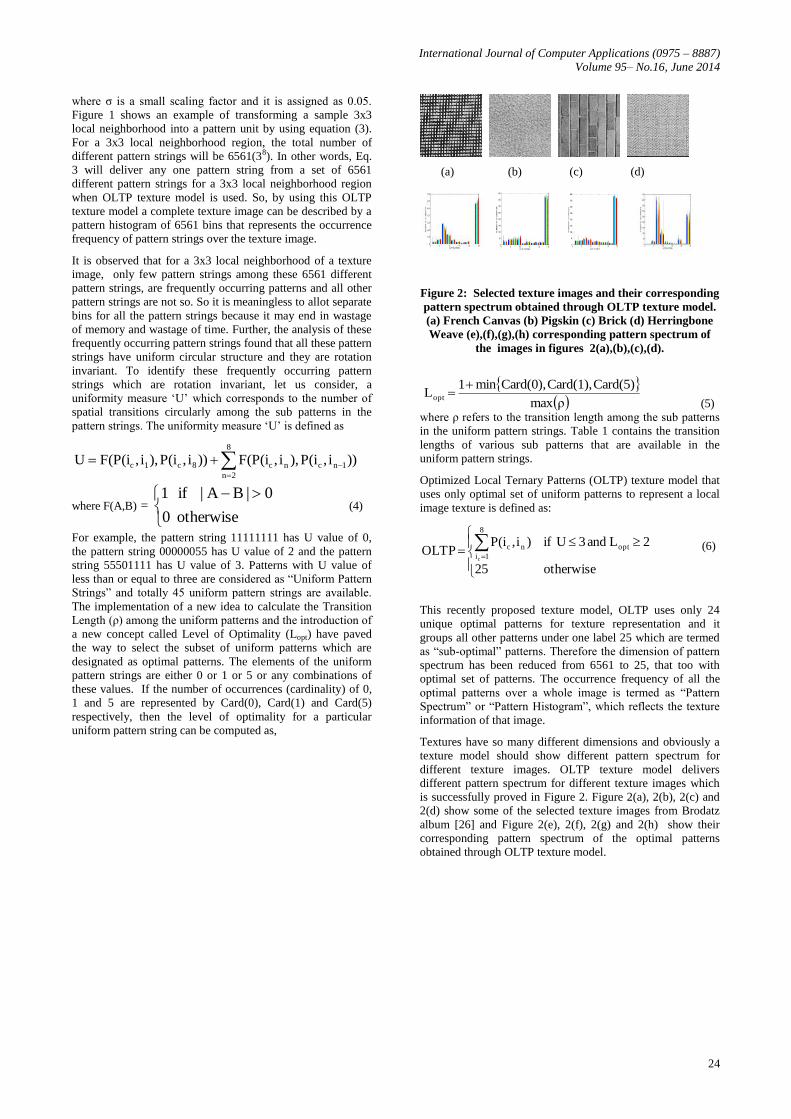
Figure 2: Selected texture images and their corresponding
pattern spectrum obtained through OLTP texture model.
(a) French Canvas (b) Pigskin (c) Brick (d) Herringbone
Weave (e),(f),(g),(h) corresponding pattern spectrum of
the images in figures 2(a),(b),(c),(d).
(5)
where ρ refers to the transition length among the sub patterns
in the uniform pattern strings. Table 1 contains the transition
lengths of various sub patterns that are available in the
uniform pattern strings.
Optimized Local Ternary Patterns (OLTP) texture model that
uses only optimal set of uniform patterns to represent a local
image texture is defined as:
otherwise25
2L and 3 Uif)i,P(iOLTP opt
8
1i
nc
c
(6)
This recently proposed texture model, OLTP uses only 24
unique optimal patterns for texture representation and it
groups all other patterns under one label 25 which are termed
as “sub-optimal” patterns. Therefore the dimension of pattern
spectrum has been reduced from 6561 to 25, that too with
optimal set of patterns. The occurrence frequency of all the
optimal patterns over a whole image is termed as “Pattern
Spectrum” or “Pattern Histogram”, which reflects the texture
information of that image.
Textures have so many different dimensions and obviously a
texture model should show different pattern spectrum for
different texture images. OLTP texture model delivers
different pattern spectrum for different texture images which
is successfully proved in Figure 2. Figure 2(a), 2(b), 2(c) and
2(d) show some of the selected texture images from Brodatz
album [26] and Figure 2(e), 2(f), 2(g) and 2(h) show their
corresponding pattern spectrum of the optimal patterns
obtained through OLTP texture model.
ρmax
Card(5)Card(1),Card(0),min1Lopt
International Journal of Computer Applications (0975 – 8887)
Volume 95– No.16, June 2014
25
Table 1: Details of the Transition Length (ρ) for the sub
patterns of uniform pattern strings
OLTP texture method was empirically proven successfully in
texture classification for a wide range of textures in the
previous study under different kinds of experimental settings
like gray-scale variation, rotation variation, histogram
equalization and noise. In this study, the segmentation
performance of the recently developed OLTP texture model
for a variety of multitextured images is pursued.
3. TEXTURE SEGMENTATION
3.1 Texture Segmentation Principle This study is considered as a test bench to demonstrate the
discrimination ability of the newly developed OLTP texture
model. The evaluation process uses a supervised segmentation
approach over the selected texture images which are extracted
from the standard Brodatz texture database. The steps
involved in the process of texture segmentation are shown in
Figure 3.
3.2 Texture Segmentation Algorithm The algorithm of the texture segmentation is described as
follows.
Step 1. Read the texture mosaic image.
Step 2. Select randomly a sample sub image of 30x30
pixels from the texture image as sample image.
Step 3. Transfer the 30x30 sub image into the OLTP
texture model and obtain the OLTP spectrum for
the selected sub image.
Step 4. Select one sample sub image for each selected texture
image and repeat step 1 to step3 for all the selected
texture sub images (because this study follows
supervised segmentation).
Step 5. Select a window size of 30x30 pixels starting from the
top-left corner of the test image and do step3 for the
selected window.
Step 6. Calculate Kullback-Leibler distance (D) between the
OLTP spectrum of the selected window obtained
from step 5 and one of every sample obtained from
step 4.
Step 7. The central pixel of the window considered in step5
will be assigned to a particular texture class of the
sample, for which the D (obtained from step 6) is the
minimum among all the samples.
Step 8. Repeat step 5 to step 7 for all the windows which are
selected in size 30x30 pixels starting from the top-left
corner of the given test image with a step of two
pixels in the row and column directions.
3.3 Kullback-Leibler Distance Measure Similarity is a quantity that reflects the strength of
relationship between two objects or two features. Distance
measures dissimilarity. Dissimilarity measures the
discrepancy between the two objects on several features.
There are many types of distance measures and each distance
measure has its own characteristics. The Kullback-Leibler
distance (D) between two distributions s and m is defined as
D(s:m)=
n
1i
iii )/mlog(ss (7)
where s and m are the sample and model distributions, n are
the number of bins and si, mi are the respective sample and
model probabilities at a particular bin i.
The modified version of the same Kullback-Leibler distance
(G) is
n
1i
i
ms,
n
1i
i
ms,
n
1i
ii )]f)log(f([]logff2([G
n
1i ms, ms,
n
1i ms,
n
1i
iiii )])f)log(f[()]f)log(f([
(8)
where s and m are the sample and model distributions, n is the
number of bins and si, mi are the respective sample and model
probabilities at a particular bin i. In this study, the modified
version of Kullback-Leibler distance is used to find the
similarity between two OLTP spectrums of test image
window and sample sub images.
Transition Length
S.No Sub Pattern type Transition
Length (ρ)
1 ‘01’ 1
2 ‘10’ 1
3 ‘15’ 1
4 ‘51’ 1
5 ‘05’ 2
6 ‘50’ 2
7 ‘015’ 1
8 ‘510’ 1
9 ‘105’ 2
10 ‘150’ 2
11 ‘051’ 2
12 ‘501’ 2
International Journal of Computer Applications (0975 – 8887)
Volume 95– No.16, June 2014
26
4. EXPERIMENT RESULTS AND
DISCUSSION
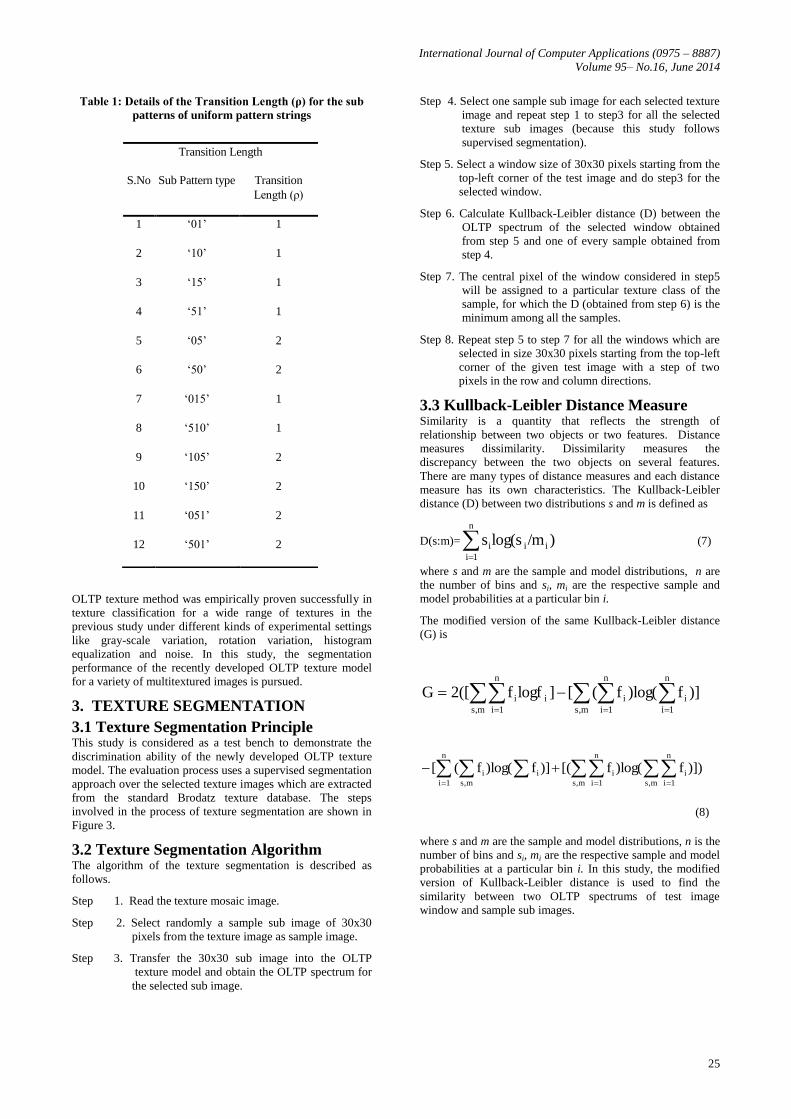
4.1 Image data The texture segmentation problem deals with the image that
contains several different types of texture (composite texture
image) and segments that image according to the textures
available in it. More than 400 composite texture images of
256 gray levels are created using the selected textures from
Brodatz album texture images. This study tests the texture
segmentation ability of the Optimized Local Ternary Patterns
(OLTP) texture approach by performing supervised
segmentation on several composite test images of varying
complexity, which are shown in Figure 4.
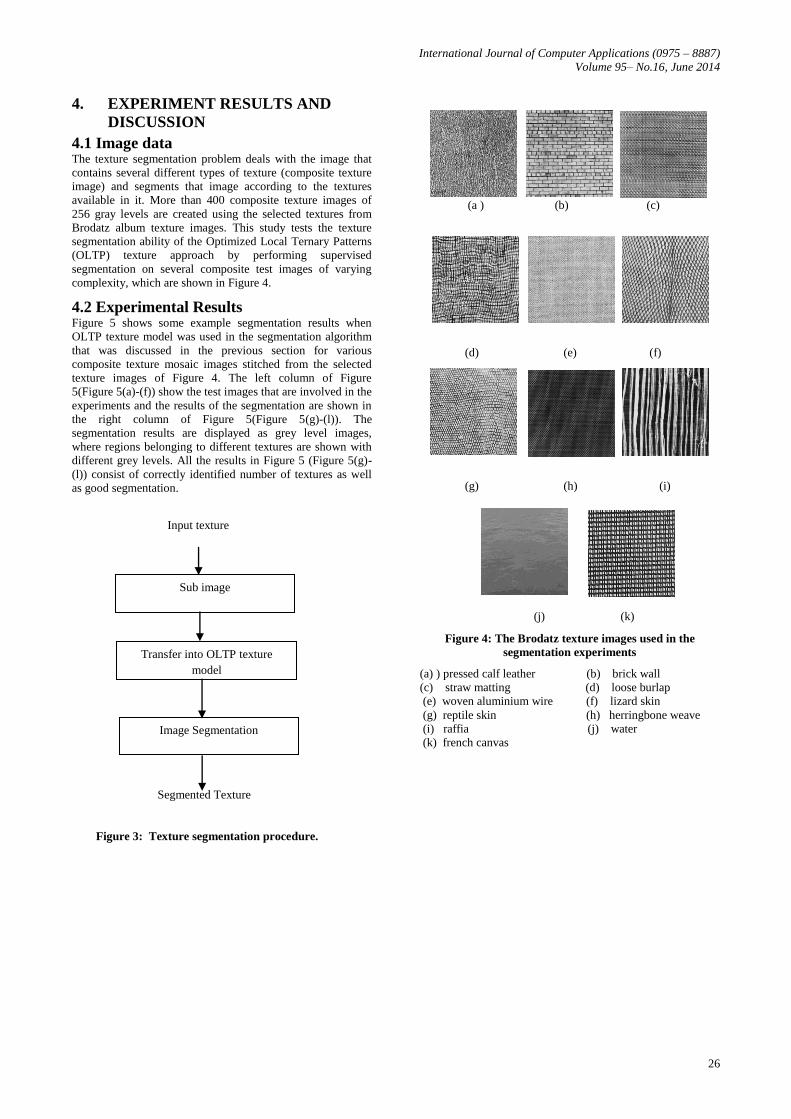
4.2 Experimental Results Figure 5 shows some example segmentation results when
OLTP texture model was used in the segmentation algorithm
that was discussed in the previous section for various
composite texture mosaic images stitched from the selected
texture images of Figure 4. The left column of Figure
5(Figure 5(a)-(f)) show the test images that are involved in the
experiments and the results of the segmentation are shown in
the right column of Figure 5(Figure 5(g)-(l)). The
segmentation results are displayed as grey level images,
where regions belonging to different textures are shown with
different grey levels. All the results in Figure 5 (Figure 5(g)-
(l)) consist of correctly identified number of textures as well
as good segmentation.
Figure 3: Texture segmentation procedure.
(a ) (b) (c)
(d) (e) (f)
(g) (h) (i)
(j) (k)
Figure 4: The Brodatz texture images used in the
segmentation experiments
(a) ) pressed calf leather (b) brick wall
(c) straw matting (d) loose burlap
(e) woven aluminium wire (f) lizard skin
(g) reptile skin (h) herringbone weave
(i) raffia (j) water
(k) french canvas
Segmented Texture
Sub image
(30x30) Block
Transfer into OLTP texture
model
Image Segmentation
Input texture
image
International Journal of Computer Applications (0975 – 8887)
Volume 95– No.16, June 2014
27
4.3 Result Analysis The stitched two texture mosaic image of Figure 5(a) consists
of textures pressed calf leather and brick wall. The two-
texture mosaic image of Figure 5(b) consists of textures
reptile skin and straw matting. The two-texture mosaic image
of Figure 5(c) consists of textures herring bone weave and
brick wall. Result images Figure 5(g), 5(h) and 5(i) are
showing the segmentation results of input images Figure 5(a),
5(b) and 5(c) respectively. In all these result images, the
OLTP texture model successfully discriminates the two
textured regions and detects the boundary between them quite
clearly. The three-texture mosaic image Figure 5(d) consists
of textures woven aluminium wire, lizard skin and loose
burlap. The result image Figure 5(j) for this input image
contains correctly identified number of textures as well as
good segmentation. The stitched four-texture mosaic image
Figure 5(e) consists of textures herring bone weave, french
canvas, pressed calf leather and brick wall. The five-texture
mosaic image Figure 5(f) consists of textures raffia, french
canvas, pressed calf leather, water and brick wall. These input
texture mosaic images are difficult images to discriminate for
several approaches but OLTP texture model gives a
reasonably good segmentation results (Figure 5(k) and Figure
5(l)) with some negligible errors around texture boundaries.
The lack of suitable quantitative measures for finding the
accuracy of segmentation result makes it very difficult to
evaluate and compare texture segmentation algorithms. One
simple measure that is widely used is the percentage of
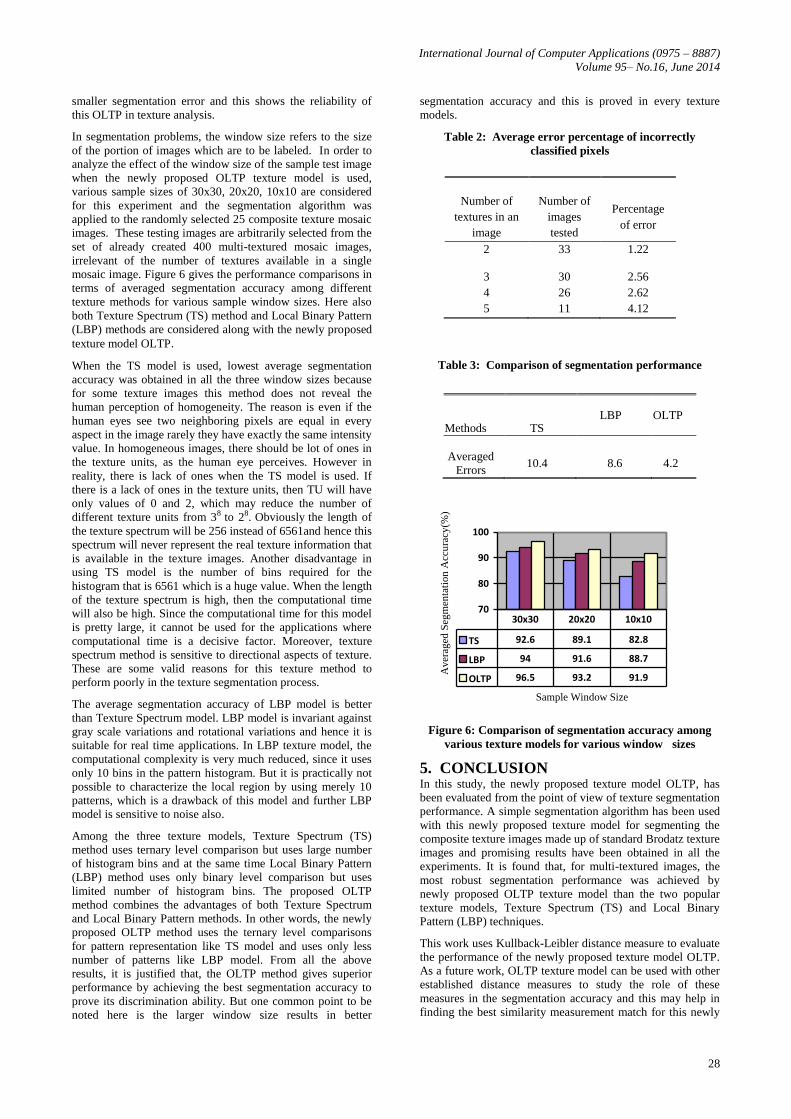
misclassified pixels. Table 2 gives the percentage of
misclassified pixels for the segmentation experiments that are
conducted for 100 test composite texture mosaic images. All
the images give an error percentage of below 4.5% which can
be considered as a good result. It is known that when more
texture boundaries are there in an image, then more difficult
decisions must be made which may result in an increasing
number of misclassified pixels.
Appreciably, from these results, it is also observed that when
the newly proposed OLTP texture model is used even
boundary pixels are also segmented properly. To demonstrate
the benefit of the newly proposed texture descriptor OLTP, in
differentiating textures, a comparative experiment has also
been carried out. This experiment uses 50 randomly chosen
test images with same sizes from the already selected multi-
textured image set irrelevant of the number of textures
available in the mosaic images.
Table 3 compares the error percentage of the incorrectly
classified pixels obtained by applying different segmentation
methods to each of 50 randomly chosen test images. The
averaged errors over the entire test images for this
comparative experiment are listed in Table 3. The right
column illustrates the results of the newly proposed OLTP
texture method, where as the two middle columns show the
results obtained by applying the Texture Spectrum (TS)
method and Local Binary Pattern (LBP) method.
The newly proposed OLTP texture model shows the best
discrimination ability by achieving the least overall
segmentation error. Both Texture Spectrum (TS) and Local
Binary Pattern (LBP) methods were never found to perform
best. It is also observed that both TS and LBP methods failed
to locate accurate boundaries separating the regions in many
test images. The newly proposed texture model OLTP,
outperforms the other popular texture models Texture
Spectrum (TS) and Local Binary Pattern (LBP) by achieving
(d) (j)
(c) (i)
(b) (h)
(a) (g)
(e) (k)
(f) (l)
Figure 5: Supervised texture segmentation
results when OLTP texture model is used.
5(a) – 5(f) various multitextured images
created from the selected texture images and
5(g)-5(l) shows the corresponding segmented
output when OLTP texture model is used.
(f) (l)
International Journal of Computer Applications (0975 – 8887)
Volume 95– No.16, June 2014
28
smaller segmentation error and this shows the reliability of
this OLTP in texture analysis.
In segmentation problems, the window size refers to the size
of the portion of images which are to be labeled. In order to
analyze the effect of the window size of the sample test image
when the newly proposed OLTP texture model is used,
various sample sizes of 30x30, 20x20, 10x10 are considered
for this experiment and the segmentation algorithm was
applied to the randomly selected 25 composite texture mosaic
images. These testing images are arbitrarily selected from the
set of already created 400 multi-textured mosaic images,
irrelevant of the number of textures available in a single
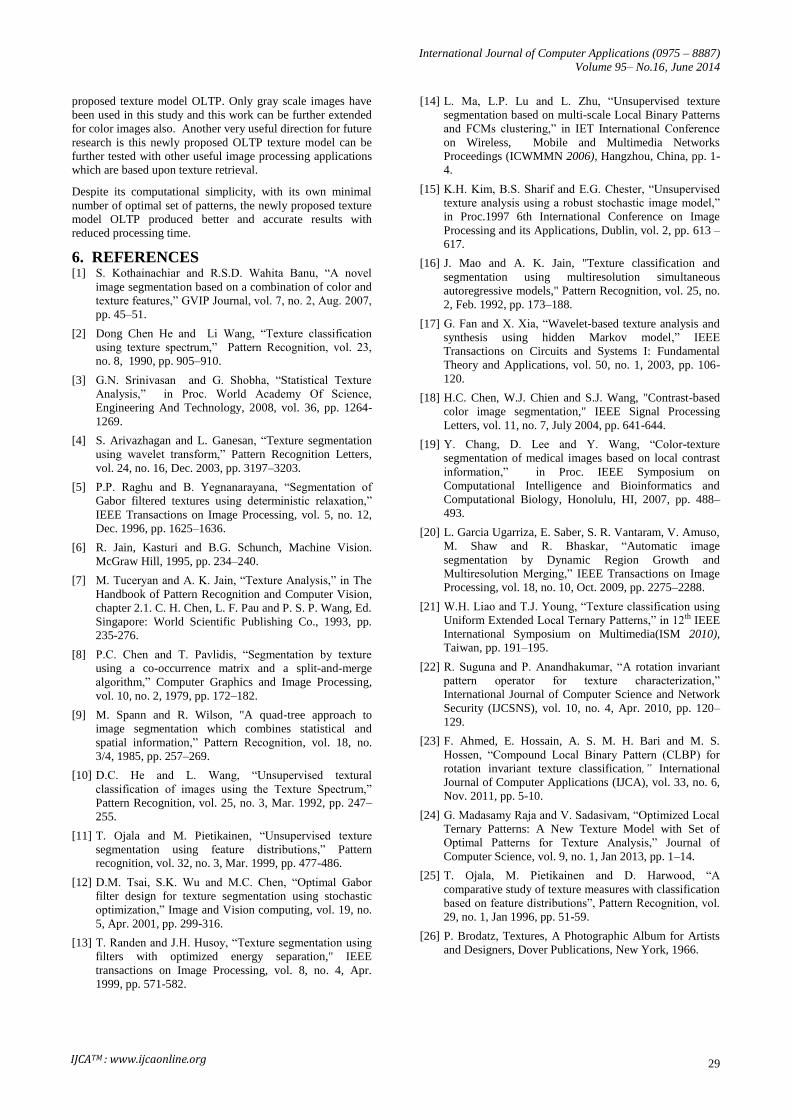
mosaic image. Figure 6 gives the performance comparisons in
terms of averaged segmentation accuracy among different
texture methods for various sample window sizes. Here also
both Texture Spectrum (TS) method and Local Binary Pattern
(LBP) methods are considered along with the newly proposed
texture model OLTP.
When the TS model is used, lowest average segmentation
accuracy was obtained in all the three window sizes because
for some texture images this method does not reveal the
human perception of homogeneity. The reason is even if the
human eyes see two neighboring pixels are equal in every
aspect in the image rarely they have exactly the same intensity
value. In homogeneous images, there should be lot of ones in
the texture units, as the human eye perceives. However in
reality, there is lack of ones when the TS model is used. If
there is a lack of ones in the texture units, then TU will have
only values of 0 and 2, which may reduce the number of
different texture units from 38 to 28. Obviously the length of
the texture spectrum will be 256 instead of 6561and hence this
spectrum will never represent the real texture information that
is available in the texture images. Another disadvantage in
using TS model is the number of bins required for the
histogram that is 6561 which is a huge value. When the length
of the texture spectrum is high, then the computational time
will also be high. Since the computational time for this model
is pretty large, it cannot be used for the applications where
computational time is a decisive factor. Moreover, texture
spectrum method is sensitive to directional aspects of texture.
These are some valid reasons for this texture method to
perform poorly in the texture segmentation process.
The average segmentation accuracy of LBP model is better
than Texture Spectrum model. LBP model is invariant against
gray scale variations and rotational variations and hence it is
suitable for real time applications. In LBP texture model, the
computational complexity is very much reduced, since it uses
only 10 bins in the pattern histogram. But it is practically not
possible to characterize the local region by using merely 10
patterns, which is a drawback of this model and further LBP
model is sensitive to noise also.
Among the three texture models, Texture Spectrum (TS)
method uses ternary level comparison but uses large number
of histogram bins and at the same time Local Binary Pattern
(LBP) method uses only binary level comparison but uses
limited number of histogram bins. The proposed OLTP
method combines the advantages of both Texture Spectrum
and Local Binary Pattern methods. In other words, the newly
proposed OLTP method uses the ternary level comparisons
for pattern representation like TS model and uses only less
number of patterns like LBP model. From all the above
results, it is justified that, the OLTP method gives superior
performance by achieving the best segmentation accuracy to
prove its discrimination ability. But one common point to be
noted here is the larger window size results in better
segmentation accuracy and this is proved in every texture
models.
Table 2: Average error percentage of incorrectly
classified pixels
Table 3: Comparison of segmentation performance
Methods TS LBP OLTP
Averaged
Errors
10.4
8.6
4.2
70
80
90
100
Sample Window Size
Av
erag
ed S
egm
enta
tio
n A
ccu
racy
(%)
TS 92.6 89.1 82.8
LBP 94 91.6 88.7
OLTP 96.5 93.2 91.9
30x30 20x20 10x10
Figure 6: Comparison of segmentation accuracy among
various texture models for various window sizes
5. CONCLUSION In this study, the newly proposed texture model OLTP, has
been evaluated from the point of view of texture segmentation
performance. A simple segmentation algorithm has been used
with this newly proposed texture model for segmenting the
composite texture images made up of standard Brodatz texture
images and promising results have been obtained in all the
experiments. It is found that, for multi-textured images, the
most robust segmentation performance was achieved by
newly proposed OLTP texture model than the two popular
texture models, Texture Spectrum (TS) and Local Binary
Pattern (LBP) techniques.
This work uses Kullback-Leibler distance measure to evaluate
the performance of the newly proposed texture model OLTP.
As a future work, OLTP texture model can be used with other
established distance measures to study the role of these
measures in the segmentation accuracy and this may help in
finding the best similarity measurement match for this newly
Number of
textures in an
image
Number of
images
tested
Percentage
of error
2 33 1.22
3 30 2.56
4 26 2.62
5 11 4.12
International Journal of Computer Applications (0975 – 8887)
Volume 95– No.16, June 2014
29
proposed texture model OLTP. Only gray scale images have
been used in this study and this work can be further extended
for color images also. Another very useful direction for future
research is this newly proposed OLTP texture model can be
further tested with other useful image processing applications
which are based upon texture retrieval.
Despite its computational simplicity, with its own minimal
number of optimal set of patterns, the newly proposed texture
model OLTP produced better and accurate results with
reduced processing time.
6. REFERENCES
[1] S. Kothainachiar and R.S.D. Wahita Banu, “A novel
image segmentation based on a combination of color and
texture features,” GVIP Journal, vol. 7, no. 2, Aug. 2007,
pp. 45–51.
[2] Dong Chen He and Li Wang, “Texture classification
using texture spectrum,” Pattern Recognition, vol. 23,
no. 8, 1990, pp. 905–910.
[3] G.N. Srinivasan and G. Shobha, “Statistical Texture
Analysis,” in Proc. World Academy Of Science,
Engineering And Technology, 2008, vol. 36, pp. 1264-
1269.
[4] S. Arivazhagan and L. Ganesan, “Texture segmentation
using wavelet transform,” Pattern Recognition Letters,
vol. 24, no. 16, Dec. 2003, pp. 3197–3203.
[5] P.P. Raghu and B. Yegnanarayana, “Segmentation of
Gabor filtered textures using deterministic relaxation,”
IEEE Transactions on Image Processing, vol. 5, no. 12,
Dec. 1996, pp. 1625–1636.
[6] R. Jain, Kasturi and B.G. Schunch, Machine Vision.
McGraw Hill, 1995, pp. 234–240.
[7] M. Tuceryan and A. K. Jain, “Texture Analysis,” in The
Handbook of Pattern Recognition and Computer Vision,
chapter 2.1. C. H. Chen, L. F. Pau and P. S. P. Wang, Ed.
Singapore: World Scientific Publishing Co., 1993, pp.
235-276.
[8] P.C. Chen and T. Pavlidis, “Segmentation by texture
using a co-occurrence matrix and a split-and-merge
algorithm,” Computer Graphics and Image Processing,
vol. 10, no. 2, 1979, pp. 172–182.
[9] M. Spann and R. Wilson, "A quad-tree approach to
image segmentation which combines statistical and
spatial information,” Pattern Recognition, vol. 18, no.
3/4, 1985, pp. 257–269.
[10] D.C. He and L. Wang, “Unsupervised textural
classification of images using the Texture Spectrum,”
Pattern Recognition, vol. 25, no. 3, Mar. 1992, pp. 247–
255.
[11] T. Ojala and M. Pietikainen, “Unsupervised texture
segmentation using feature distributions,” Pattern
recognition, vol. 32, no. 3, Mar. 1999, pp. 477-486.
[12] D.M. Tsai, S.K. Wu and M.C. Chen, “Optimal Gabor
filter design for texture segmentation using stochastic
optimization,” Image and Vision computing, vol. 19, no.
5, Apr. 2001, pp. 299-316.
[13] T. Randen and J.H. Husoy, “Texture segmentation using
filters with optimized energy separation," IEEE
transactions on Image Processing, vol. 8, no. 4, Apr.
1999, pp. 571-582.
[14] L. Ma, L.P. Lu and L. Zhu, “Unsupervised texture
segmentation based on multi-scale Local Binary Patterns
and FCMs clustering,” in IET International Conference
on Wireless, Mobile and Multimedia Networks
Proceedings (ICWMMN 2006), Hangzhou, China, pp. 1-
4.
[15] K.H. Kim, B.S. Sharif and E.G. Chester, “Unsupervised
texture analysis using a robust stochastic image model,”
in Proc.1997 6th International Conference on Image
Processing and its Applications, Dublin, vol. 2, pp. 613 –
617.
[16] J. Mao and A. K. Jain, "Texture classification and
segmentation using multiresolution simultaneous
autoregressive models," Pattern Recognition, vol. 25, no.
2, Feb. 1992, pp. 173–188.
[17] G. Fan and X. Xia, “Wavelet-based texture analysis and
synthesis using hidden Markov model,” IEEE
Transactions on Circuits and Systems I: Fundamental
Theory and Applications, vol. 50, no. 1, 2003, pp. 106-
120.
[18] H.C. Chen, W.J. Chien and S.J. Wang, "Contrast-based
color image segmentation," IEEE Signal Processing
Letters, vol. 11, no. 7, July 2004, pp. 641-644.
[19] Y. Chang, D. Lee and Y. Wang, “Color-texture
segmentation of medical images based on local contrast
information,” in Proc. IEEE Symposium on
Computational Intelligence and Bioinformatics and
Computational Biology, Honolulu, HI, 2007, pp. 488–
493.
[20] L. Garcia Ugarriza, E. Saber, S. R. Vantaram, V. Amuso,
M. Shaw and R. Bhaskar, “Automatic image
segmentation by Dynamic Region Growth and
Multiresolution Merging,” IEEE Transactions on Image
Processing, vol. 18, no. 10, Oct. 2009, pp. 2275–2288.
[21] W.H. Liao and T.J. Young, “Texture classification using
Uniform Extended Local Ternary Patterns,” in 12th IEEE
International Symposium on Multimedia(ISM 2010),
Taiwan, pp. 191–195.
[22] R. Suguna and P. Anandhakumar, “A rotation invariant
pattern operator for texture characterization,”
International Journal of Computer Science and Network
Security (IJCSNS), vol. 10, no. 4, Apr. 2010, pp. 120–
129.
[23] F. Ahmed, E. Hossain, A. S. M. H. Bari and M. S.
Hossen, “Compound Local Binary Pattern (CLBP) for
rotation invariant texture classification,” International
Journal of Computer Applications (IJCA), vol. 33, no. 6,
Nov. 2011, pp. 5-10.
[24] G. Madasamy Raja and V. Sadasivam, “Optimized Local
Ternary Patterns: A New Texture Model with Set of
Optimal Patterns for Texture Analysis,” Journal of
Computer Science, vol. 9, no. 1, Jan 2013, pp. 1–14.
[25] T. Ojala, M. Pietikainen and D. Harwood, “A
comparative study of texture measures with classification
based on feature distributions”, Pattern Recognition, vol.
29, no. 1, Jan 1996, pp. 51-59.
[26] P. Brodatz, Textures, A Photographic Album for Artists
and Designers, Dover Publications, New York, 1966.
IJCATM : www.ijcaonline.org