Embed Size (px)
Citation preview

IN DEGREE PROJECT ELECTRICAL ENGINEERING,SECOND CYCLE, 30 CREDITS
, STOCKHOLM SWEDEN 2017
Segmentation of high frequency
3D ultrasound images for skin
disease characterization.
ADRIEN ANXIONNAT
KTH ROYAL INSTITUTE OF TECHNOLOGY
SCHOOL OF ELECTRICAL ENGINEERING
Abstract
This work is rooted in a need for dermatologists to explore skin characteristicsin depth. The influence of skin disease such as acne in dermal tissues is stilla complex task to assess. Among the possibilities, high frequency ultrasoundimaging is a paradigm shift to probe and characterizes upper and deep dermis.For this purpose, a cohort of 58 high-frequency 3D images has been acquiredby the French laboratory Pierre Fabre in order to study acne vulgaris disease.This common skin disorder is a societal challenge and burden affecting late ado-lescents across the world. The medical protocol developed by Pierre Fabre wasto screen a lesion every day during 9 days for different patients with ultrasoundimaging. The provided data features skin epidermis and dermis structure witha fantastic resolution. The strategy we led to study these data can be explainedin three steps. First, epidermis surface is detected among artifacts and noisethanks to a robust level-set algorithm. Secondly, acne spots are located on theresulting height map and associated to each other among the data by comput-ing and thresholding a local variance. And eventually potential inflammatorydermal cavities related to each lesion are geometrically and statistically char-acterized in order to assess the evolution of the disease. The results presentan automatic algorithm which permits dermatologists to screen acne vulgarislesions and to characterize them in a complete data set. It can hence be a pow-erful toolbox to assess the efficiency of a treatment.keywords : level-set segmentation, active contours, optimization, statisticalmodeling, Blitz++.
Sammanfattning
Detta arbete ar grundat i en dermatologs behov att undersoka hudens egen-skaper pa djupet. Paverkan av hudsjukdomar sa som acne pa dermala vavanderar fortfarande svart att bedoma. Bland mojligheterna ar hogfrekvent ultraljud-savbildning ett paradigmskifte for undersokning och karakterisering av ovre ochdjupa dermis. I detta syfte har en kohort av 58 hogfrekventa 3D bilder forvarvatsav det Franska laboratoriet Pierre Fabre for att studera sjukdomen acne vul-garis. Denna vanliga hudsjukdom ar en utmaning for samhallet och en bordasom paverkar de i slutet av tonaren over hela varlden. Protokollet utvecklatav Pierre Fabre innebar att undersoka en lesion varje dag over 9 dagar forolika patienter med ultraljudavbildning. Den insamlade datan visar hudens epi-dermis och dermis struktur med en fantastiskt hog upplosning. Strategin vianvande for att studera denna data kan forklaras i tre steg. For det forsta,hittas epidermis yta bland artifakter och brus tack vare en robust level-set al-goritm. For det andra, acne flackar hittas pa hojdkartan och associeras tillvarandra bland matdatan genom en troskeljamforelse over lokala variationer.Aven potentiellt inflammatoriska dermala halrum relaterade till varje lesion blirgeometriskt ochj statistiskt kannetecknade for att bedoma sjukdomens forlopp.Resultaten framfor en automatisk algoritm som gor det mojligt for dermatologeratt undersoka acne vulgaris lesioner och utmarka de i ett dataset. Detta kandarmed vara en kraftfull verktygslada for att undersoka inverkan av en behan-dling till denna sjukdom.
Acknowledgment
I can not consider starting this report without thanking all the persons thathave helped and supported me during the whole thesis.
I want to thank Creatis laboratory (Lyon, France) 1 and particularly theultrasound team for being an exceptional place of research and discussions inbiomedical imaging field.
I am particularly grateful to my supervisors at Creatis laboratory: Prof.Philippe Delachartre and Dr. Bruno Sciolla for their advice, high involvement,patience and insight during the whole project. I would not have thought that Iwill learn so much in six months. I extend my thanks to Pierre Ferrier and Fab-rice Bellet who were very responsive and effective whenever I had software issues.
I wish to thank Pierre Fabre laboratory (Toulouse, France) embodied byJimmy le Digabel and Gwendal Josse for the multiple meetings and discussionsand for having made our work possible. I have appreciated their engineeringpoint of view and clinical knowledge.
I would also like to thank Prof. Saikat Chatterjee and Prof. Cornel Iona,my supervisors from KTH and Grenoble INP - Phelma, for they goodwill andsupport.
I wish to address special thanks to the PhD students of Creatis, to MatthieuMartin, Sami Quorchi, Maxime Polichetti, Tom Hohweiller, Emeline Turquinand so many others for having made my scientific journey at Creatis a greathuman experience.
1https://www.creatis.insa-lyon.fr
Contents
1 Introduction 11.1 Motivation . . . . . . . . . . . . . . . . . . . . . . . . . . . . . . 11.2 Aim of the master thesis . . . . . . . . . . . . . . . . . . . . . . . 1
2 Ultrasound images acquisition 22.1 Principles of ultrasound . . . . . . . . . . . . . . . . . . . . . . . 22.2 High-frequency ultrasound imaging system (Dermcup) . . . . . . 22.3 Clinical protocol . . . . . . . . . . . . . . . . . . . . . . . . . . . 32.4 3D images . . . . . . . . . . . . . . . . . . . . . . . . . . . . . . . 4
3 Background: review of segmentation methods 63.1 Introduction to segmentation . . . . . . . . . . . . . . . . . . . . 6
3.1.1 Thresholding algorithm . . . . . . . . . . . . . . . . . . . 73.1.2 Clustering . . . . . . . . . . . . . . . . . . . . . . . . . . . 7
3.2 Level-set segmentation . . . . . . . . . . . . . . . . . . . . . . . . 83.2.1 Implicit representation of active contours . . . . . . . . . 83.2.2 Choice of the functional . . . . . . . . . . . . . . . . . . . 83.2.3 Active contour evolution and implementation . . . . . . . 9
4 Methods: Segmentation and characterization of the lesions 114.1 Segmentation of epidermis . . . . . . . . . . . . . . . . . . . . . . 114.2 Segmentation of the epidermic acne region . . . . . . . . . . . . 184.3 Segmentation of the subcutaneous area . . . . . . . . . . . . . . . 20
5 Results 225.1 Validation of the epidermis segmentation . . . . . . . . . . . . . . 225.2 Geometrical characterization . . . . . . . . . . . . . . . . . . . . 235.3 Tissue characterization . . . . . . . . . . . . . . . . . . . . . . . . 255.4 Longitudinal study . . . . . . . . . . . . . . . . . . . . . . . . . . 27
6 Implementation in C/C++ 296.1 Existing work . . . . . . . . . . . . . . . . . . . . . . . . . . . . . 296.2 Blitz library . . . . . . . . . . . . . . . . . . . . . . . . . . . . . . 296.3 Functions . . . . . . . . . . . . . . . . . . . . . . . . . . . . . . . 29
6.3.1 Replicate function . . . . . . . . . . . . . . . . . . . . . . 296.3.2 Convolution function . . . . . . . . . . . . . . . . . . . . . 30
7 Conclusion and Future Work 31
2

Chapter 1
Introduction
1.1 Motivation
High-frequency ultrasound has a fantastic resolution which is ideal for derma-tology and skin research. In the range of 20MHz to 50MHz, the resolution istypically of 4µm to 100µm in the depth axis and 50µm to 150µm in the lateraldirection. With a depth of exploration of 3mm to 12mm, high-frequency ultra-sound allows to gather detailed information on epidermis and dermis layers ofthe skin.
Ultrasound imaging has been used to study several skin disorders: dermati-tis [9], [24] , skin ulcers [22], skin aging [5, 8, 14, 27], lesion classification [4] andimpact of glucocorticoid treatments on the dermis layers [11].
1.2 Aim of the master thesis
The purpose of the present work is to retrieve geometrical and statistical char-acteristics of acne impact on skin in order to enable dermatologists to study thedisease and for example assess the effectiveness of a treatment. Some methodsfor automated epidermis segmentation have been proposed previously, as in [15][7].
In this work we propose a three-step automated algorithm able to process adata set of 3D high-frequency ultrasound images :
• Segment epidermis surface
• Identify cutaneous acne lesions
• Identify subcutaneous follicle inflammation
1
Chapter 2
Ultrasound imagesacquisition
2.1 Principles of ultrasound
Ultrasounds terminology concerns all waves above 20kHz. It has three mainadvantages regarding other imaging modalities. It is non-invasive, low costand easy to use. It is particularly popular for screening fetus with pregnantwomen. In this case, the ultrasound frequency is about 5MHz. But ultrasoundcan be used in several other applications. Particularly, the development of highfrequency probes has permitted in recent years to explore superficial tissues andhence to widen the study field to dermatology. The current devices can reach afrequency up to 50MHz. High frequency ultrasound imaging permits the studyof skin layers, malignant tumors, follicles or skin textures.
2.2 High-frequency ultrasound imaging system(Dermcup)
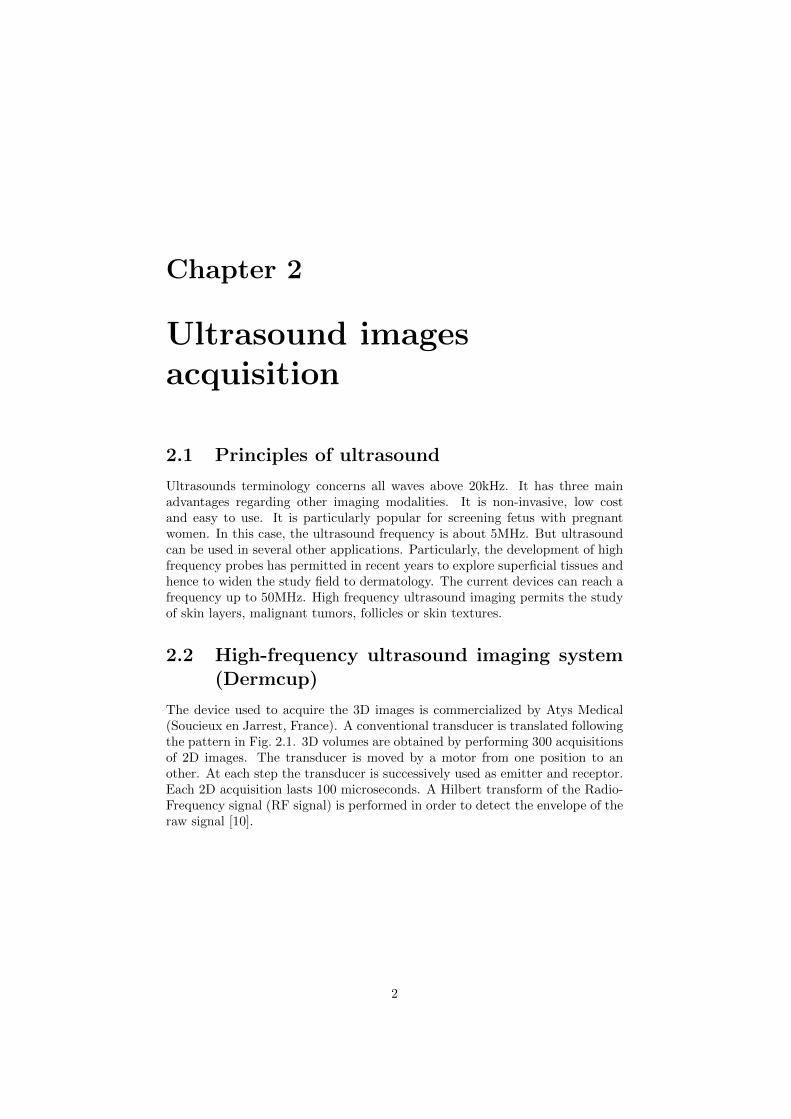
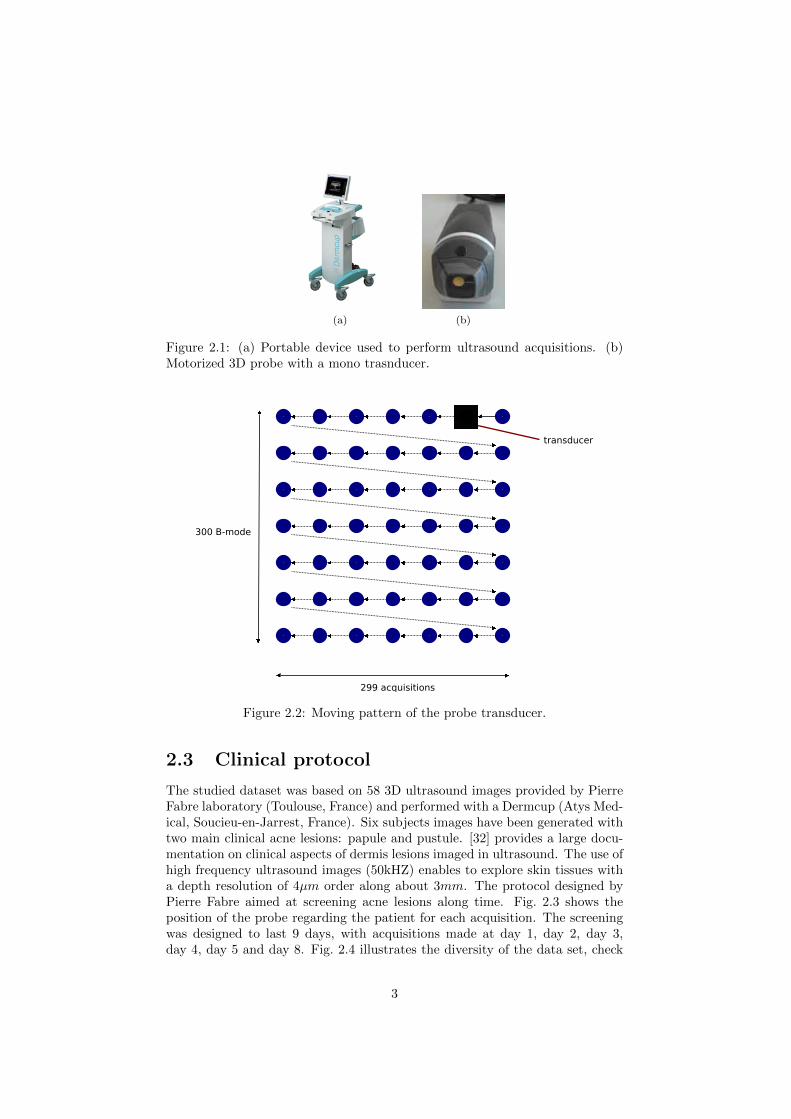
The device used to acquire the 3D images is commercialized by Atys Medical(Soucieux en Jarrest, France). A conventional transducer is translated followingthe pattern in Fig. 2.1. 3D volumes are obtained by performing 300 acquisitionsof 2D images. The transducer is moved by a motor from one position to another. At each step the transducer is successively used as emitter and receptor.Each 2D acquisition lasts 100 microseconds. A Hilbert transform of the Radio-Frequency signal (RF signal) is performed in order to detect the envelope of theraw signal [10].
2
(a) (b)
Figure 2.1: (a) Portable device used to perform ultrasound acquisitions. (b)Motorized 3D probe with a mono trasnducer.
299 acquisitions
300 B-mode
transducer
Figure 2.2: Moving pattern of the probe transducer.
2.3 Clinical protocol
The studied dataset was based on 58 3D ultrasound images provided by PierreFabre laboratory (Toulouse, France) and performed with a Dermcup (Atys Med-ical, Soucieu-en-Jarrest, France). Six subjects images have been generated withtwo main clinical acne lesions: papule and pustule. [32] provides a large docu-mentation on clinical aspects of dermis lesions imaged in ultrasound. The use ofhigh frequency ultrasound images (50kHZ) enables to explore skin tissues witha depth resolution of 4µm order along about 3mm. The protocol designed byPierre Fabre aimed at screening acne lesions along time. Fig. 2.3 shows theposition of the probe regarding the patient for each acquisition. The screeningwas designed to last 9 days, with acquisitions made at day 1, day 2, day 3,day 4, day 5 and day 8. Fig. 2.4 illustrates the diversity of the data set, check
3
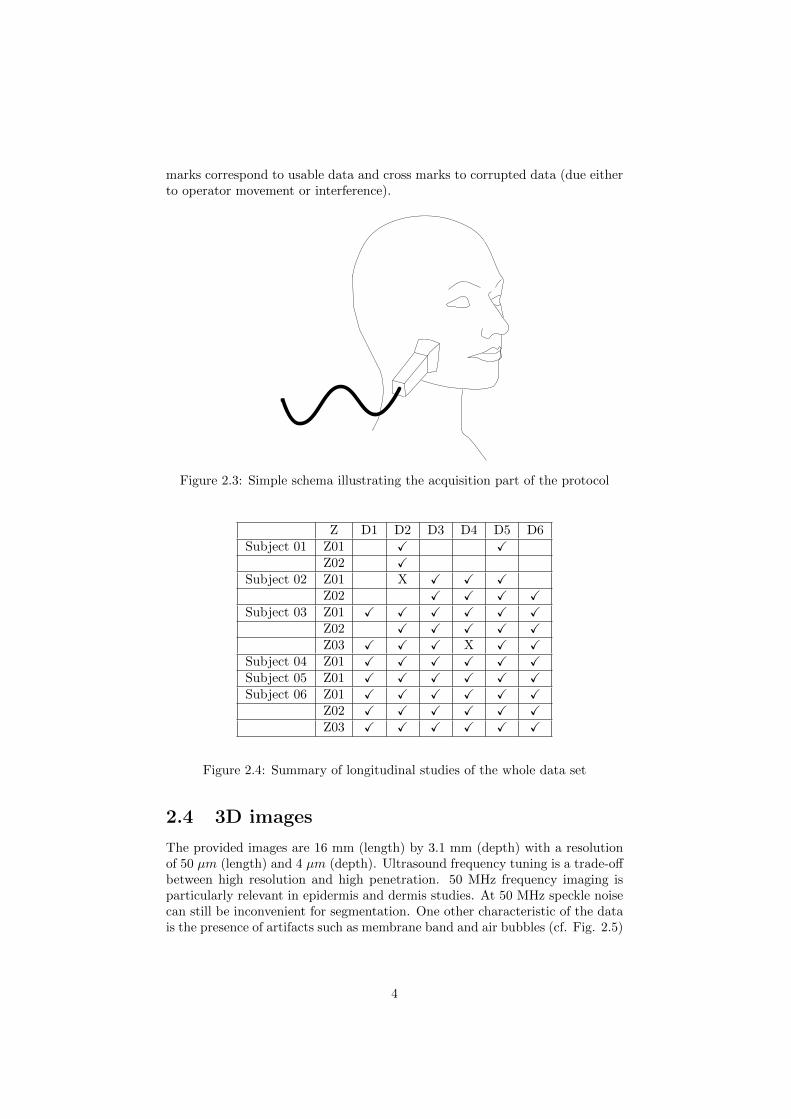
marks correspond to usable data and cross marks to corrupted data (due eitherto operator movement or interference).
Figure 2.3: Simple schema illustrating the acquisition part of the protocol
Z D1 D2 D3 D4 D5 D6Subject 01 Z01 X X
Z02 XSubject 02 Z01 X X X X
Z02 X X X XSubject 03 Z01 X X X X X X
Z02 X X X X XZ03 X X X X X X
Subject 04 Z01 X X X X X XSubject 05 Z01 X X X X X XSubject 06 Z01 X X X X X X
Z02 X X X X X XZ03 X X X X X X
Figure 2.4: Summary of longitudinal studies of the whole data set
2.4 3D images
The provided images are 16 mm (length) by 3.1 mm (depth) with a resolutionof 50 µm (length) and 4 µm (depth). Ultrasound frequency tuning is a trade-offbetween high resolution and high penetration. 50 MHz frequency imaging isparticularly relevant in epidermis and dermis studies. At 50 MHz speckle noisecan still be inconvenient for segmentation. One other characteristic of the datais the presence of artifacts such as membrane band and air bubbles (cf. Fig. 2.5)
4
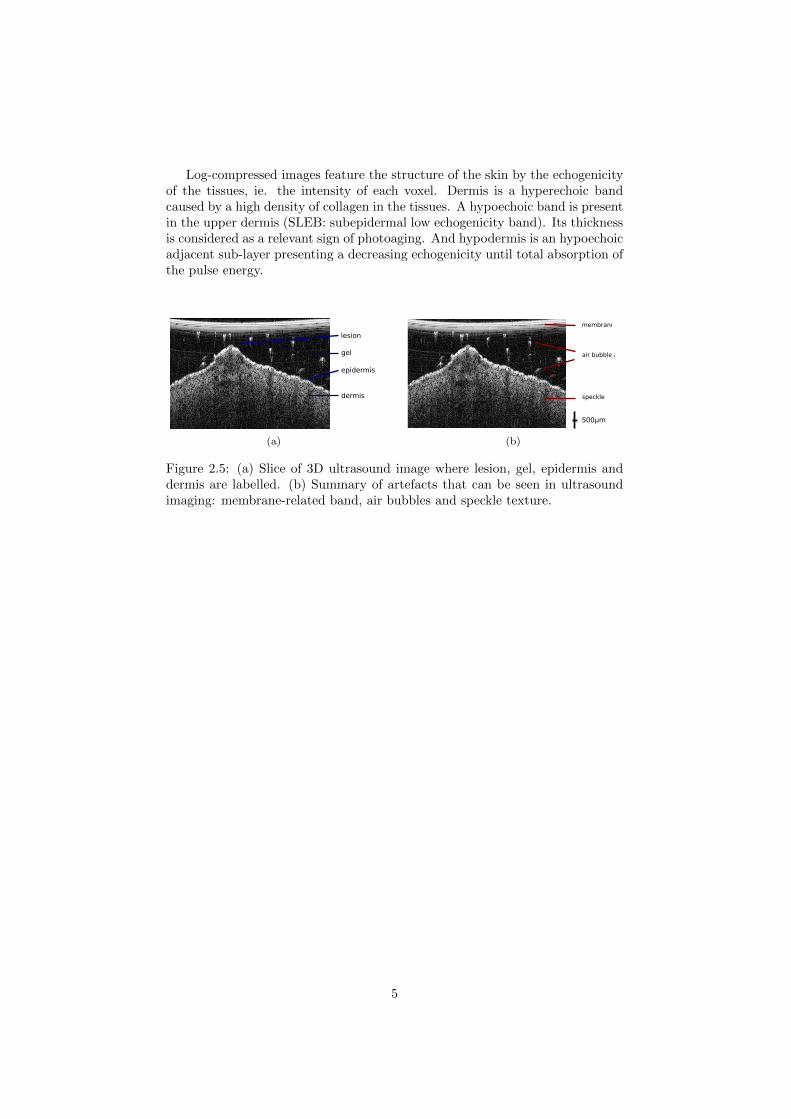
Log-compressed images feature the structure of the skin by the echogenicityof the tissues, ie. the intensity of each voxel. Dermis is a hyperechoic bandcaused by a high density of collagen in the tissues. A hypoechoic band is presentin the upper dermis (SLEB: subepidermal low echogenicity band). Its thicknessis considered as a relevant sign of photoaging. And hypodermis is an hypoechoicadjacent sub-layer presenting a decreasing echogenicity until total absorption ofthe pulse energy.
lesion
dermis
epidermis
1mm
gel
(a)
membrane
speckle
air bubbles
1mm500μm
(b)
Figure 2.5: (a) Slice of 3D ultrasound image where lesion, gel, epidermis anddermis are labelled. (b) Summary of artefacts that can be seen in ultrasoundimaging: membrane-related band, air bubbles and speckle texture.
5
Chapter 3
Background: review ofsegmentation methods
This chapter provides the background necessary to introduce the next methodsection. We first describe what is at stake with segmentation and why it isnowadays a mainstay in computer vision. We present two different types ofalgorithms that are still popular and used in 3D segmentation. Finally weintroduce the active contour method that has been used in this work.
3.1 Introduction to segmentation
Segmentation is the computer vision field that aims at detecting some specificobjects on an image. Segmentation can have plenty of applications. In industryfield, it can be part of assessing and monitoring wear of mechanical pieces oreven detecting barcode. The detection and correction of red eyes effect in pho-tography is performed thanks to segmentation algorithm. Surveillance is as wellan important application domain of segmentation, from the detection of licenseplates for offenses to road code to surveillance of dangerous behavior.
In biomedical field, segmentation is a key stone in post-processing medicalimages. In ultrasound imaging, segmentation permits the automatic measureof a foetus skull [25]. Segmentation of tumours is an active field in order toassist the doctor in his work [29]. Automatic segmentation of ventricle cavityand myocardium can also be performed in order to study the behaviour of heartin some particular disease [19].
6
Segmentation
Thresholding methods
Clustering Activecontour
Parametric model: Ex. : Snake
Non-parametric: Ex. : Level Set
Supervised learning: Ex. : CNN
Unsupervised learning: Ex. : K-means
Histogram based: Ex. : Otsu's method
Transformation based: Ex. : Canny edge
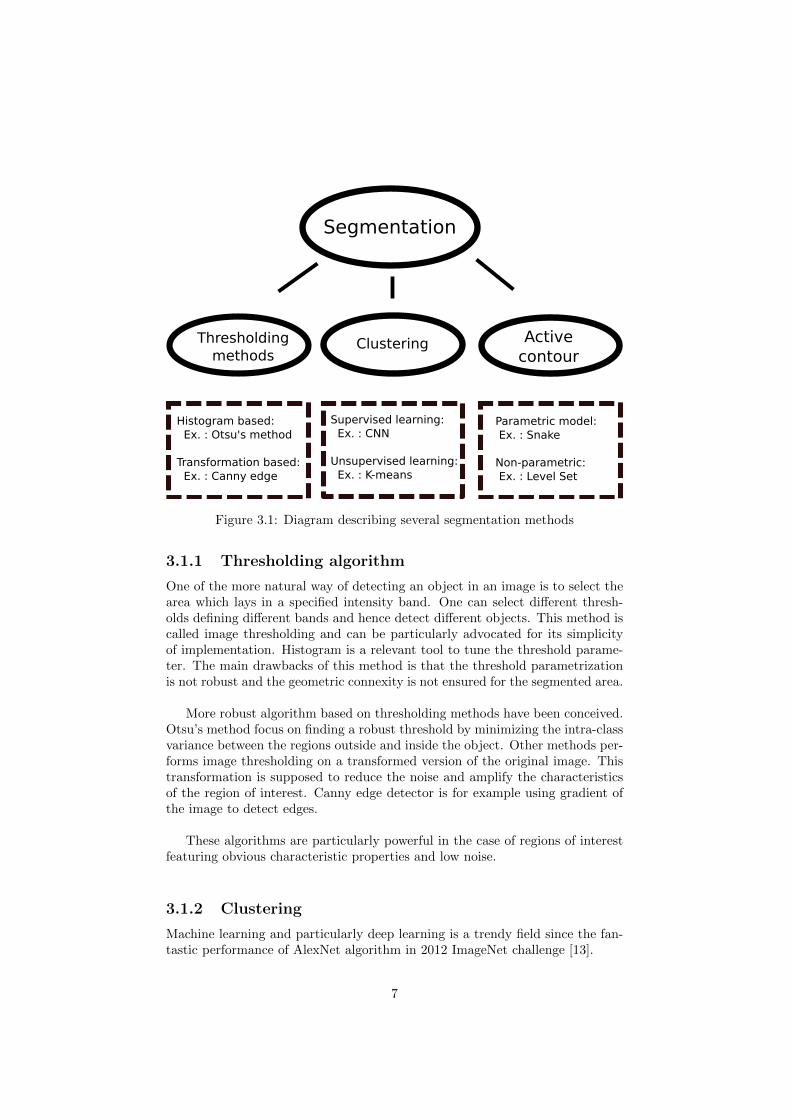
Figure 3.1: Diagram describing several segmentation methods
3.1.1 Thresholding algorithm
One of the more natural way of detecting an object in an image is to select thearea which lays in a specified intensity band. One can select different thresh-olds defining different bands and hence detect different objects. This method iscalled image thresholding and can be particularly advocated for its simplicityof implementation. Histogram is a relevant tool to tune the threshold parame-ter. The main drawbacks of this method is that the threshold parametrizationis not robust and the geometric connexity is not ensured for the segmented area.
More robust algorithm based on thresholding methods have been conceived.Otsu’s method focus on finding a robust threshold by minimizing the intra-classvariance between the regions outside and inside the object. Other methods per-forms image thresholding on a transformed version of the original image. Thistransformation is supposed to reduce the noise and amplify the characteristicsof the region of interest. Canny edge detector is for example using gradient ofthe image to detect edges.
These algorithms are particularly powerful in the case of regions of interestfeaturing obvious characteristic properties and low noise.
3.1.2 Clustering
Machine learning and particularly deep learning is a trendy field since the fan-tastic performance of AlexNet algorithm in 2012 ImageNet challenge [13].
7
More generally, pattern recognition field using machine learning can be splitin two distinct categories: supervised learning and unsupervised learning. In thecase of supervised learning, the algorithm is trained on a labeled data set andused in images with similar properties than data set images. For unsupervisedlearning, there is no knowledge on the data and the algorithm should find itselfway of splitting the data in different classes.
3.2 Level-set segmentation
The core idea of levet-set is to characterize a boundary at t time Γt with a φtfunction . With this characterization any change in topology of the boundary iseasily represented. Level-set representation has however a consistent computingcost as φ function has one more dimension than the boundary itself. Appropri-ate computing tools should be used.
3.2.1 Implicit representation of active contours
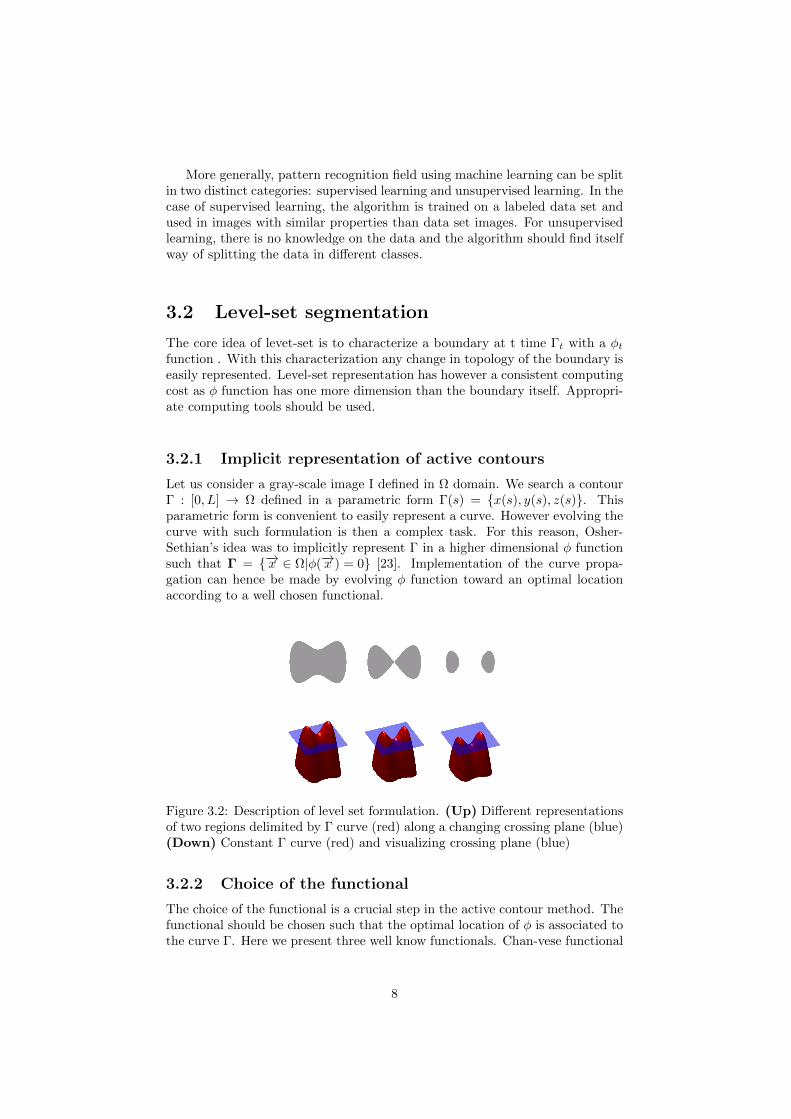
Let us consider a gray-scale image I defined in Ω domain. We search a contourΓ : [0, L] → Ω defined in a parametric form Γ(s) = x(s), y(s), z(s). Thisparametric form is convenient to easily represent a curve. However evolving thecurve with such formulation is then a complex task. For this reason, Osher-Sethian’s idea was to implicitly represent Γ in a higher dimensional φ functionsuch that Γ = −→x ∈ Ω|φ(−→x ) = 0 [23]. Implementation of the curve propa-gation can hence be made by evolving φ function toward an optimal locationaccording to a well chosen functional.
Figure 3.2: Description of level set formulation. (Up) Different representationsof two regions delimited by Γ curve (red) along a changing crossing plane (blue)(Down) Constant Γ curve (red) and visualizing crossing plane (blue)
3.2.2 Choice of the functional
The choice of the functional is a crucial step in the active contour method. Thefunctional should be chosen such that the optimal location of φ is associated tothe curve Γ. Here we present three well know functionals. Chan-vese functional
8
(Eq. 3.1) aims at evolving the curve such that the two separated regions featurehomogeneous gray level intensities. Chan-Vese functional is to be minimized,Yezzi functional is to be maximized. Yezzi’s energy is used to split the domainspace in homogenous regions with a maximum shift between the mean of eachregion (Eq. 3.2). Some other studied functionals are focused on statistics criteriasuch as Zhu-Yuille’s log-likelihood constraint in [36] (Eq. 3.3)
ECV (φ, µin, µout) =
∫Ω
((I(s)− µin)2H(φ(s)) + (I(s)− µout)2H(−φ(s))
)ds
(3.1)where:µin : mean intensity in Ωinµout : mean intensity in Ωout
H : Heaviside function.
EY (φ, µin, µout) =
∫Ω
(µin − µout)2ds (3.2)
EZ(phi, κin, χout) =
∫Ω
− log p(I(s)|χin)H(φ(s))− log p(I(s)|χout)H(−φ(s))ds
(3.3)
where:p(I(s|χ) : probability of I(s) according to a distribution parametrized by χ
H : Heaviside function.
3.2.3 Active contour evolution and implementation
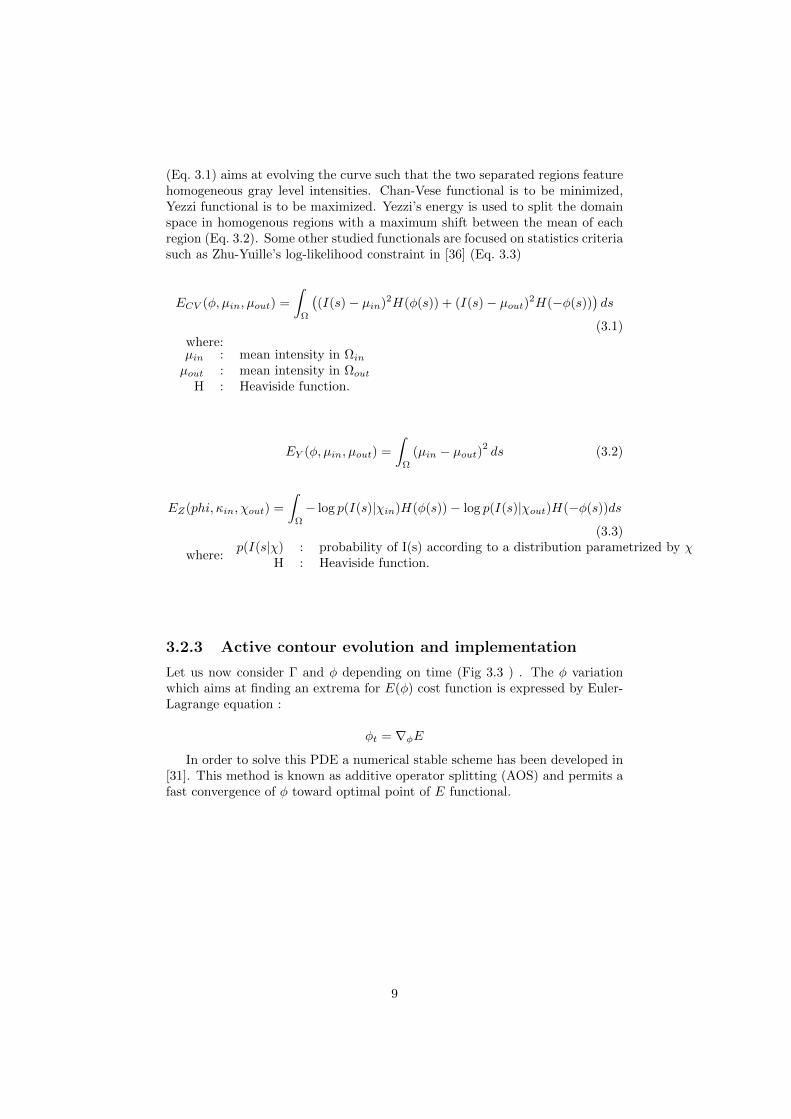
Let us now consider Γ and φ depending on time (Fig 3.3 ) . The φ variationwhich aims at finding an extrema for E(φ) cost function is expressed by Euler-Lagrange equation :
φt = ∇φE
In order to solve this PDE a numerical stable scheme has been developed in[31]. This method is known as additive operator splitting (AOS) and permits afast convergence of φ toward optimal point of E functional.
9
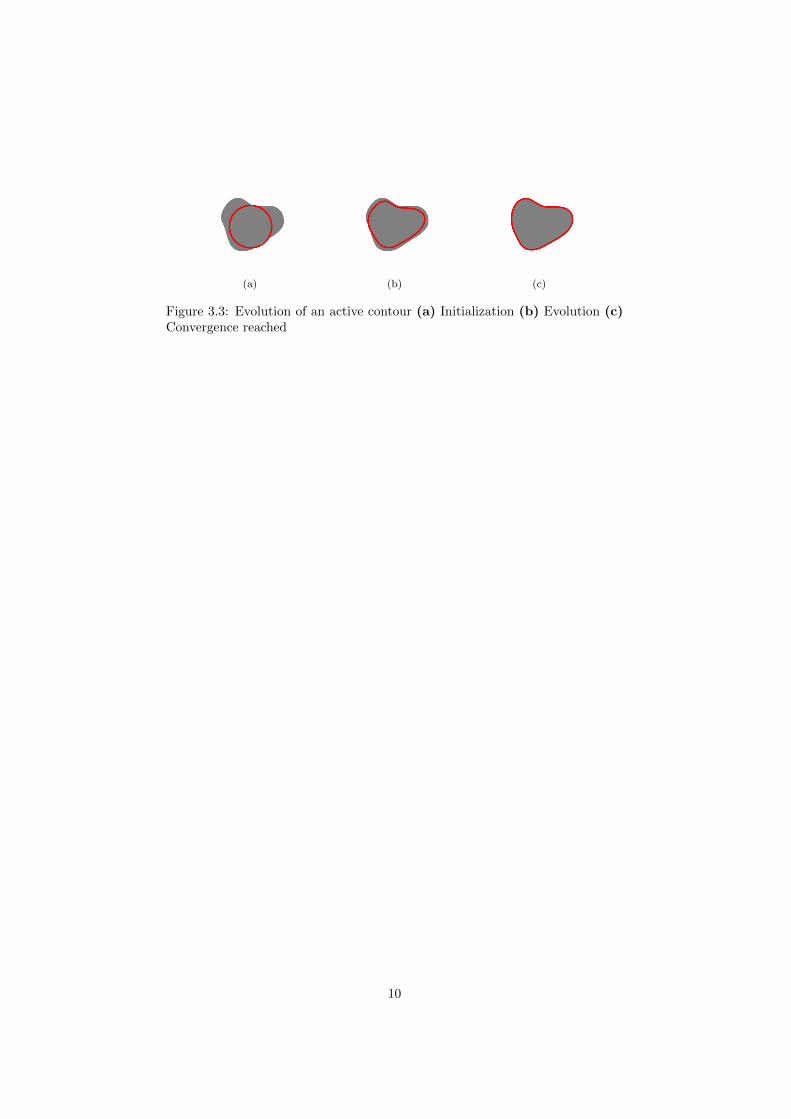
(a) (b) (c)
Figure 3.3: Evolution of an active contour (a) Initialization (b) Evolution (c)Convergence reached
10
Chapter 4
Methods: Segmentationand characterization of thelesions
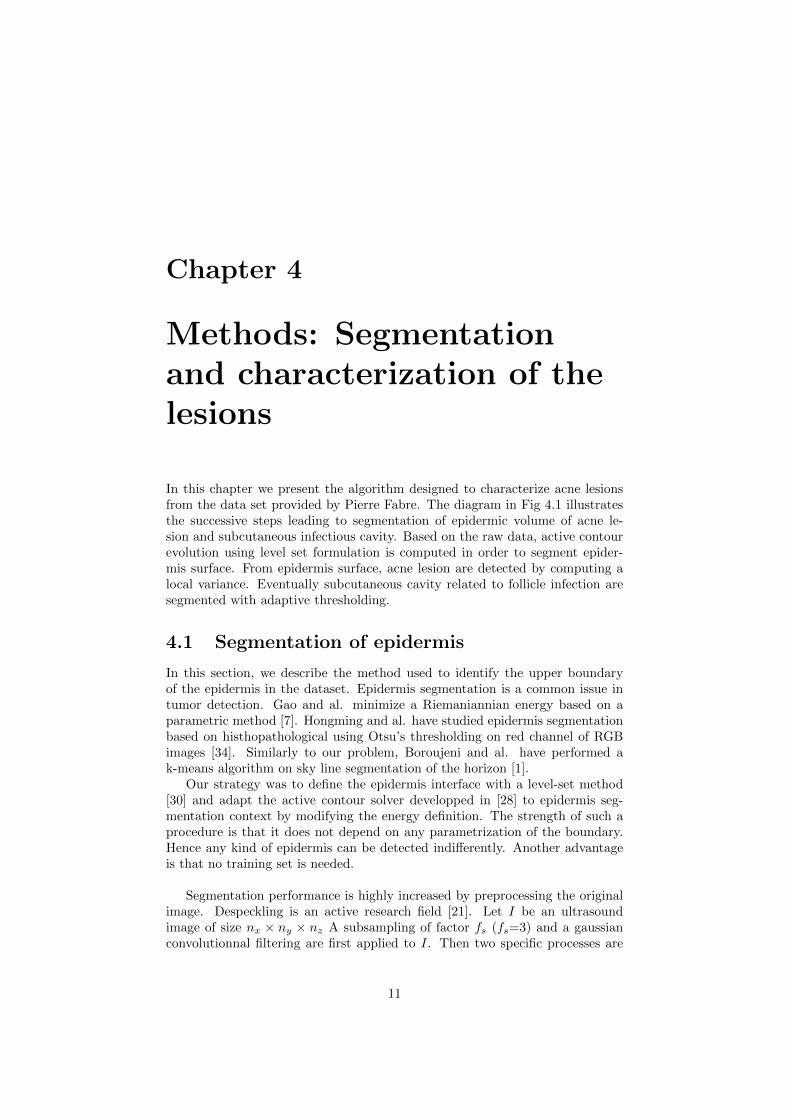
In this chapter we present the algorithm designed to characterize acne lesionsfrom the data set provided by Pierre Fabre. The diagram in Fig 4.1 illustratesthe successive steps leading to segmentation of epidermic volume of acne le-sion and subcutaneous infectious cavity. Based on the raw data, active contourevolution using level set formulation is computed in order to segment epider-mis surface. From epidermis surface, acne lesion are detected by computing alocal variance. Eventually subcutaneous cavity related to follicle infection aresegmented with adaptive thresholding.
4.1 Segmentation of epidermis
In this section, we describe the method used to identify the upper boundaryof the epidermis in the dataset. Epidermis segmentation is a common issue intumor detection. Gao and al. minimize a Riemaniannian energy based on aparametric method [7]. Hongming and al. have studied epidermis segmentationbased on histhopathological using Otsu’s thresholding on red channel of RGBimages [34]. Similarly to our problem, Boroujeni and al. have performed ak-means algorithm on sky line segmentation of the horizon [1].
Our strategy was to define the epidermis interface with a level-set method[30] and adapt the active contour solver developped in [28] to epidermis seg-mentation context by modifying the energy definition. The strength of such aprocedure is that it does not depend on any parametrization of the boundary.Hence any kind of epidermis can be detected indifferently. Another advantageis that no training set is needed.
Segmentation performance is highly increased by preprocessing the originalimage. Despeckling is an active research field [21]. Let I be an ultrasoundimage of size nx × ny × nz A subsampling of factor fs (fs=3) and a gaussianconvolutionnal filtering are first applied to I. Then two specific processes are
11
Epidermis segmentation with Level Set method Lesion
detection with local variance thresholding
Segmentation of dermic area with adaptive thresholding
Figure 4.1: Description of the chain algorithm
carried out with respective outputs I(1)proc and I
(2)proc. I
(1)proc is the result of the edge
detector defined as I(1)proc = gradz ∗ I. Where ∗ is the 3D spatial convolution
and gradz = [−1, ..,−1, 0, .., 0, 1, .., 1]uz is the extended Sobel detector along Z
dimension. I(2)proc aims at filtering the membrane effect that happens in some
images. It can be seen as a volume features high echogenicity layer. Fig. 2.5
shows a slice of 3D image. I(2)proc = |I −mean[1,20,1] ∗ I|.
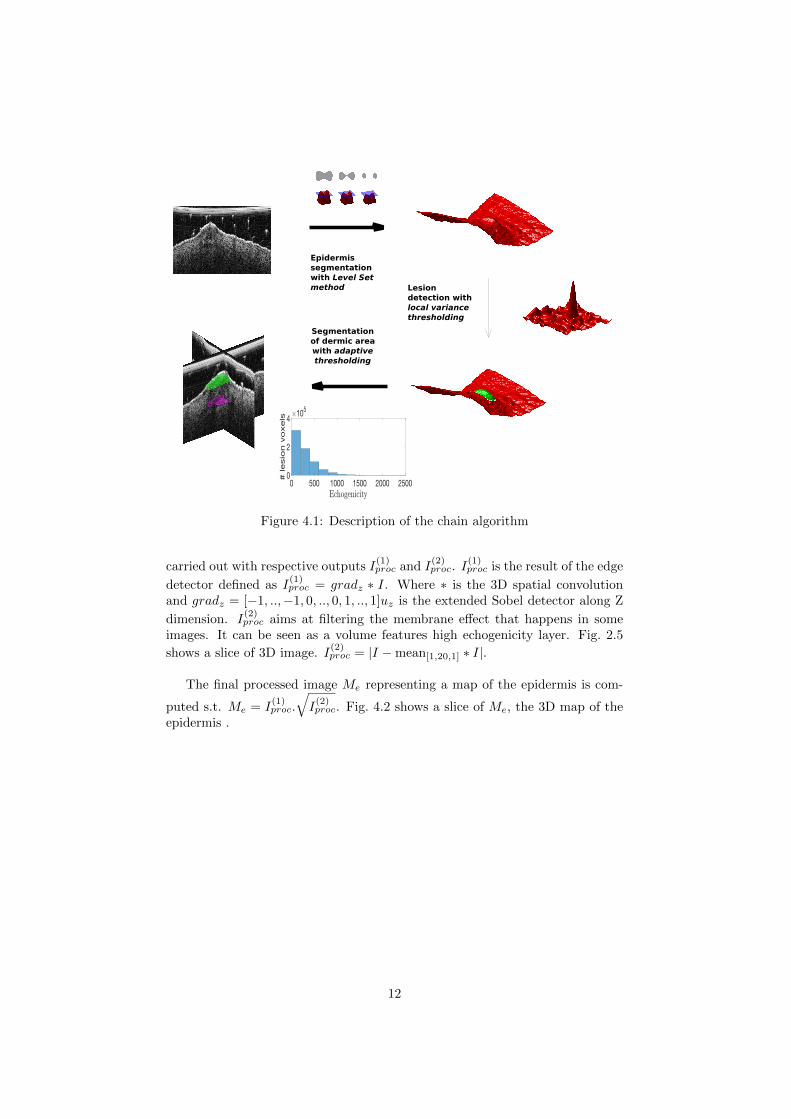
The final processed image Me representing a map of the epidermis is com-
puted s.t. Me = I(1)proc.
√I
(2)proc. Fig. 4.2 shows a slice of Me, the 3D map of the
epidermis .
12
500μm
Figure 4.2: Slice of epidermis map Me showing that the presence of the mem-brane has been drastically curbed and the edge of the epidermis interface hasbeen highlighted.
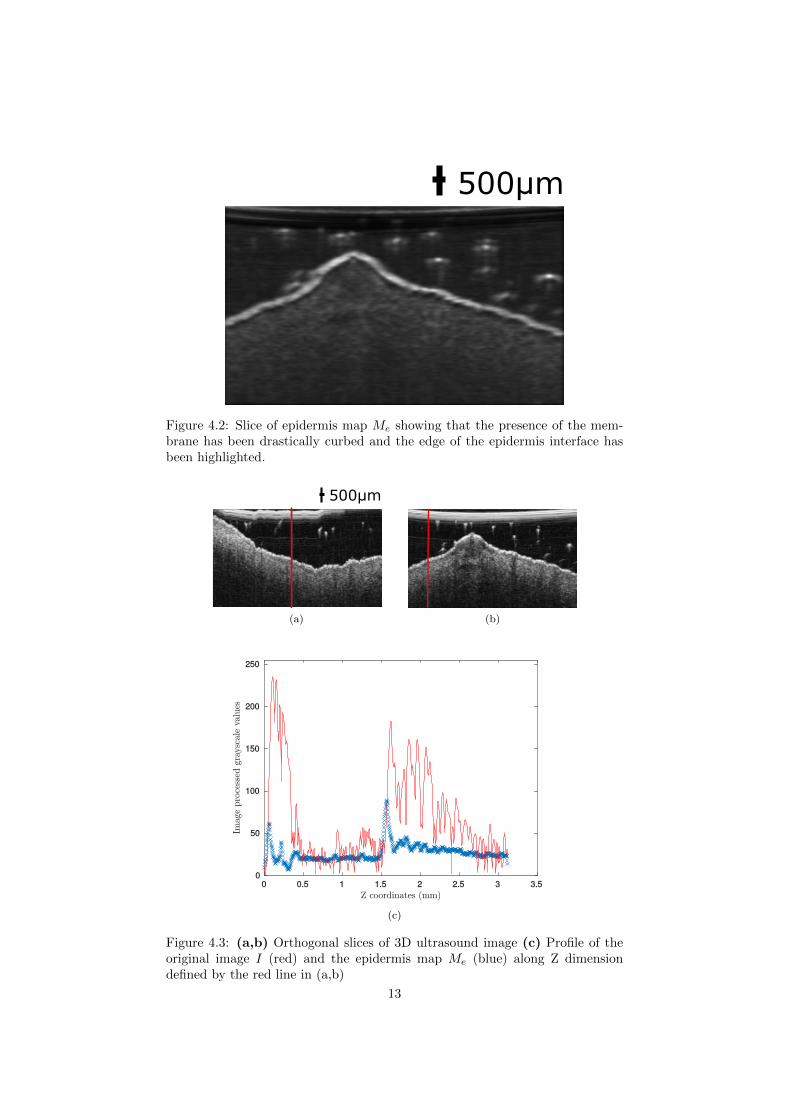
500μm
(a) (b)
(c)
Figure 4.3: (a,b) Orthogonal slices of 3D ultrasound image (c) Profile of theoriginal image I (red) and the epidermis map Me (blue) along Z dimensiondefined by the red line in (a,b)
13
The energy choice is a milestone in active contour evolution and has beenwidely investigated. Active contour energies are commonly split in two cat-egories: region-based energy [3] [12] [17] and boundary-based energy [2]. Asepidermis interface features regional and edge characteristics, the final energymust be a balanced trade-off between both.
Let Ω be the global set ([1, nx]× [1, ny]× [1, nz]). Let φ be a matrix ofthe same size as I. φ defines a boundary Γφ in the level-set fashion ie. Γφ =(x, y, z) ∈ Ω | φ(x, y, z) = 0. Let Ω1 and Ω2 be respectively the upper andlower part of the image according to Γ and such that Ω = Ω1 ∪ Ω2 ∪ Γ. Letφdata be a confidence map of same size as I representing whether the voxel is inΩ1, Ω2 or Γ. This map will be used by the level-set algorithm in the followingway: if φdata(x, y, z) > 0, then (x, y, z) ∈ Ω2, and if φdata(x, y, z) < 0, then(x, y, z) ∈ Ω1. So the active contour Γ will be in-between. Absolute value ofφdata(x, y, z) represents the relative confidence that (x, y, z) is either in Ω1 orΩ2. Eq. 4.1 illustrates the mathematical formulation found such that φdata hasthe described behavior.
φdata(x, y, z) =1
var(M15(x, y)).
∑zmax∈M3,2(x,y)
(H(z − zmax)−H(zmax − z))
(4.1)where:
Mk : N2 → Nk is the set function of the k first maxima of Me along Z direction.Mk,m : N2 → Nk is the set function of the m first indexes of the k first
maxima of Me along Z direction.H : Heaviside function.
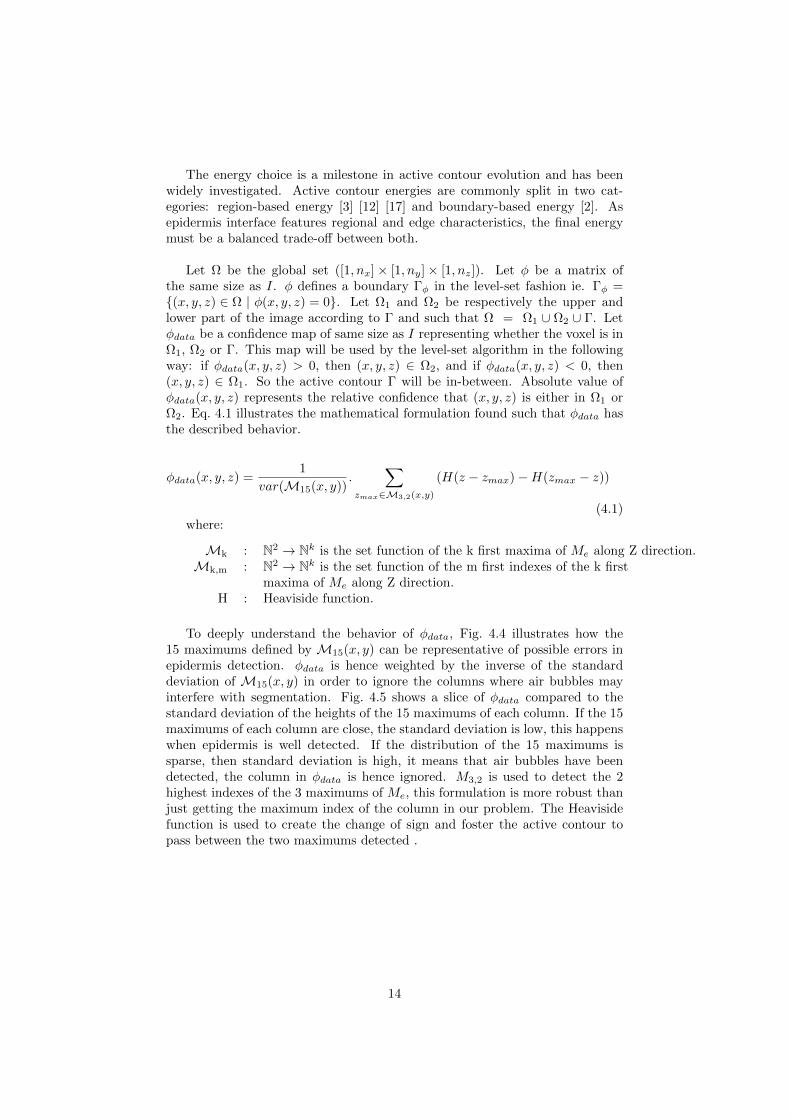
To deeply understand the behavior of φdata, Fig. 4.4 illustrates how the15 maximums defined by M15(x, y) can be representative of possible errors inepidermis detection. φdata is hence weighted by the inverse of the standarddeviation of M15(x, y) in order to ignore the columns where air bubbles mayinterfere with segmentation. Fig. 4.5 shows a slice of φdata compared to thestandard deviation of the heights of the 15 maximums of each column. If the 15maximums of each column are close, the standard deviation is low, this happenswhen epidermis is well detected. If the distribution of the 15 maximums issparse, then standard deviation is high, it means that air bubbles have beendetected, the column in φdata is hence ignored. M3,2 is used to detect the 2highest indexes of the 3 maximums of Me, this formulation is more robust thanjust getting the maximum index of the column in our problem. The Heavisidefunction is used to create the change of sign and foster the active contour topass between the two maximums detected .
14
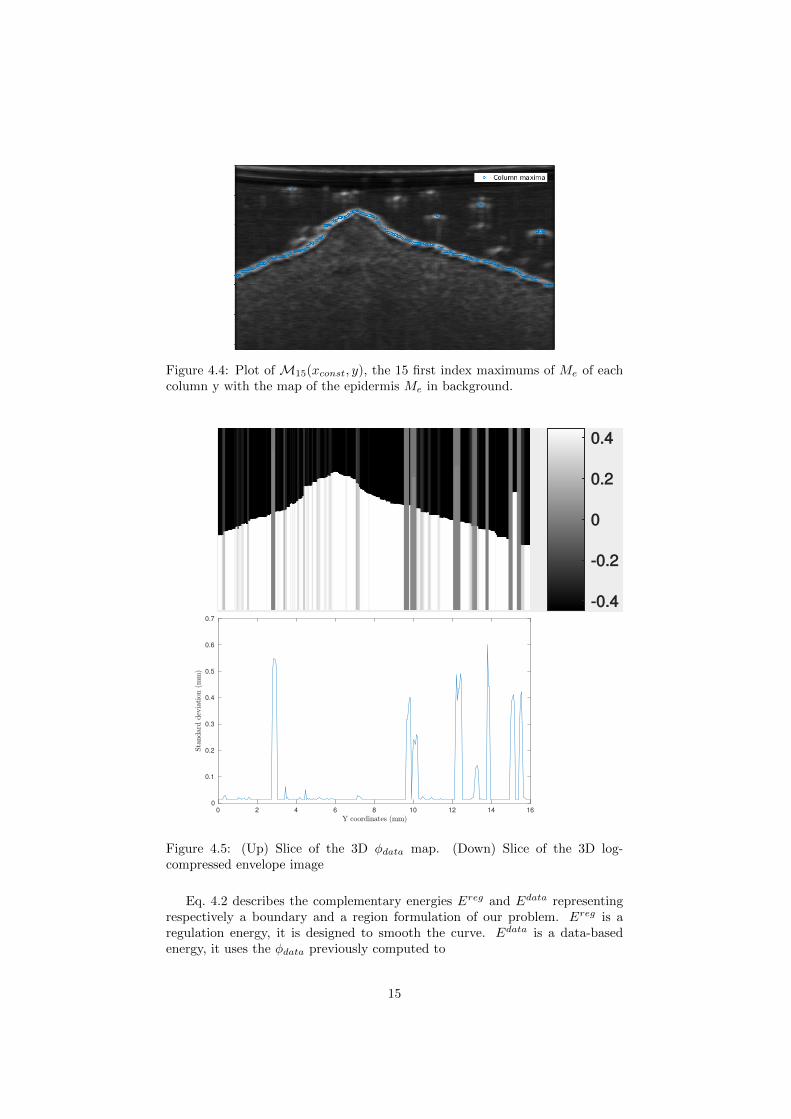
Figure 4.4: Plot of M15(xconst, y), the 15 first index maximums of Me of eachcolumn y with the map of the epidermis Me in background.
0 2 4 6 8 10 12 14 160
0.1
0.2
0.3
0.4
0.5
0.6
0.7
Figure 4.5: (Up) Slice of the 3D φdata map. (Down) Slice of the 3D log-compressed envelope image
Eq. 4.2 describes the complementary energies Ereg and Edata representingrespectively a boundary and a region formulation of our problem. Ereg is aregulation energy, it is designed to smooth the curve. Edata is a data-basedenergy, it uses the φdata previously computed to
15
E(φ) = αEreg(φ) + βEdata(φ) (4.2)
with:
Ereg(φ) =
∫b∈Γφ
db
Edata(φ) =
∫Ω
φdata(x, y, z)H(φ(x, y, z))−H(−φ(x, y, z))
The minimization of the energy is performed with a gradient descent by resolvingLagrange equations. Our algorithm uses a previous solver designed in [28] witha C++ subroutine described in [35].
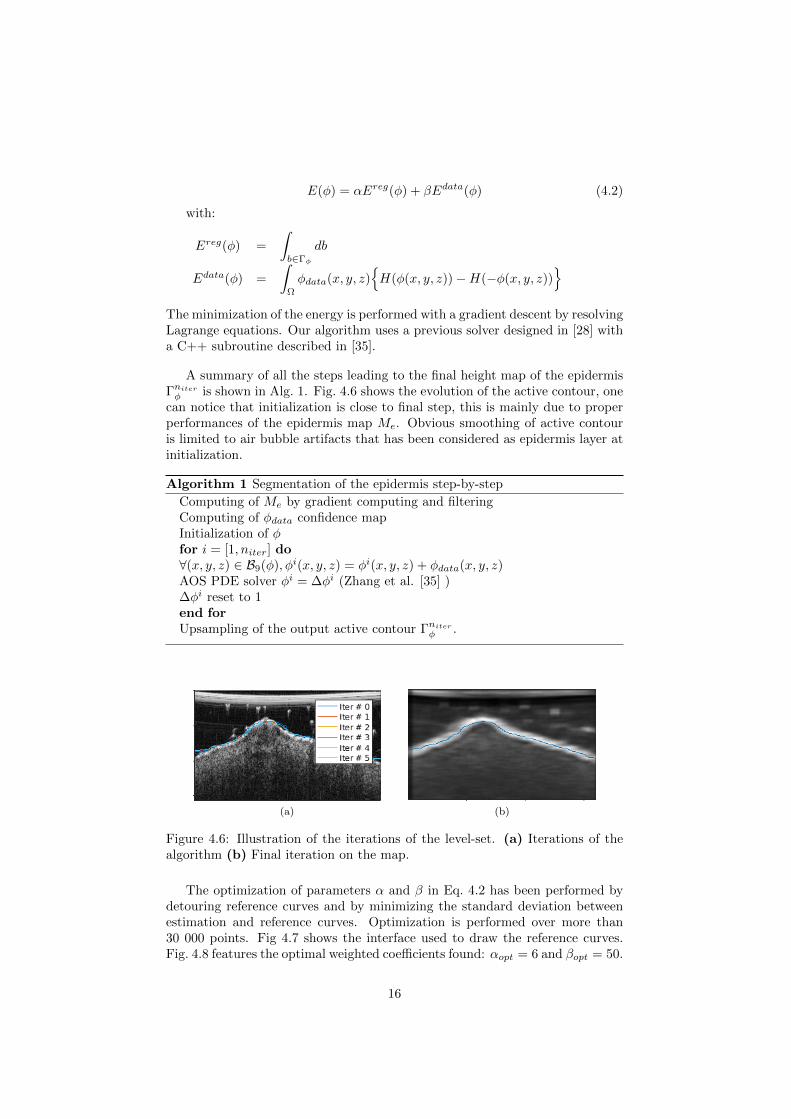
A summary of all the steps leading to the final height map of the epidermisΓniterφ is shown in Alg. 1. Fig. 4.6 shows the evolution of the active contour, onecan notice that initialization is close to final step, this is mainly due to properperformances of the epidermis map Me. Obvious smoothing of active contouris limited to air bubble artifacts that has been considered as epidermis layer atinitialization.
Algorithm 1 Segmentation of the epidermis step-by-step
Computing of Me by gradient computing and filteringComputing of φdata confidence mapInitialization of φfor i = [1, niter] do∀(x, y, z) ∈ B9(φ), φi(x, y, z) = φi(x, y, z) + φdata(x, y, z)AOS PDE solver φi = ∆φi (Zhang et al. [35] )∆φi reset to 1end forUpsampling of the output active contour Γniterφ .
(a) (b)
Figure 4.6: Illustration of the iterations of the level-set. (a) Iterations of thealgorithm (b) Final iteration on the map.
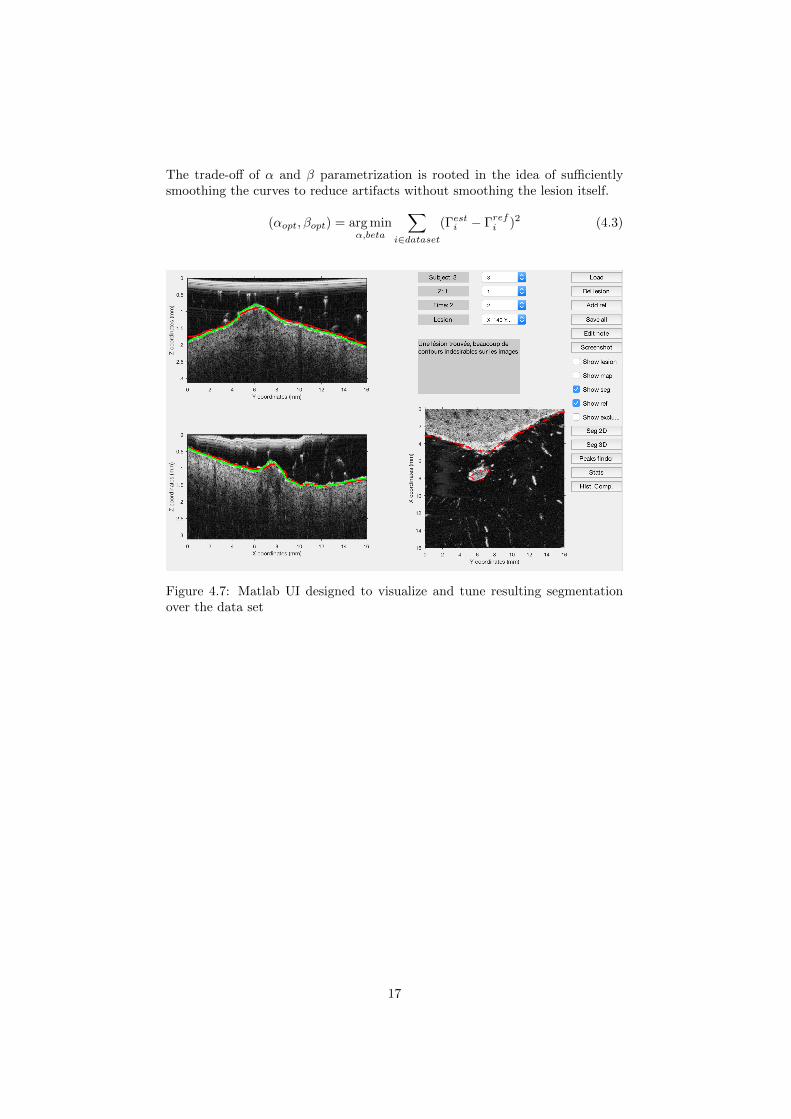
The optimization of parameters α and β in Eq. 4.2 has been performed bydetouring reference curves and by minimizing the standard deviation betweenestimation and reference curves. Optimization is performed over more than30 000 points. Fig 4.7 shows the interface used to draw the reference curves.Fig. 4.8 features the optimal weighted coefficients found: αopt = 6 and βopt = 50.
16
The trade-off of α and β parametrization is rooted in the idea of sufficientlysmoothing the curves to reduce artifacts without smoothing the lesion itself.
(αopt, βopt) = arg minα,beta
∑i∈dataset
(Γesti − Γrefi )2 (4.3)
Figure 4.7: Matlab UI designed to visualize and tune resulting segmentationover the data set
17
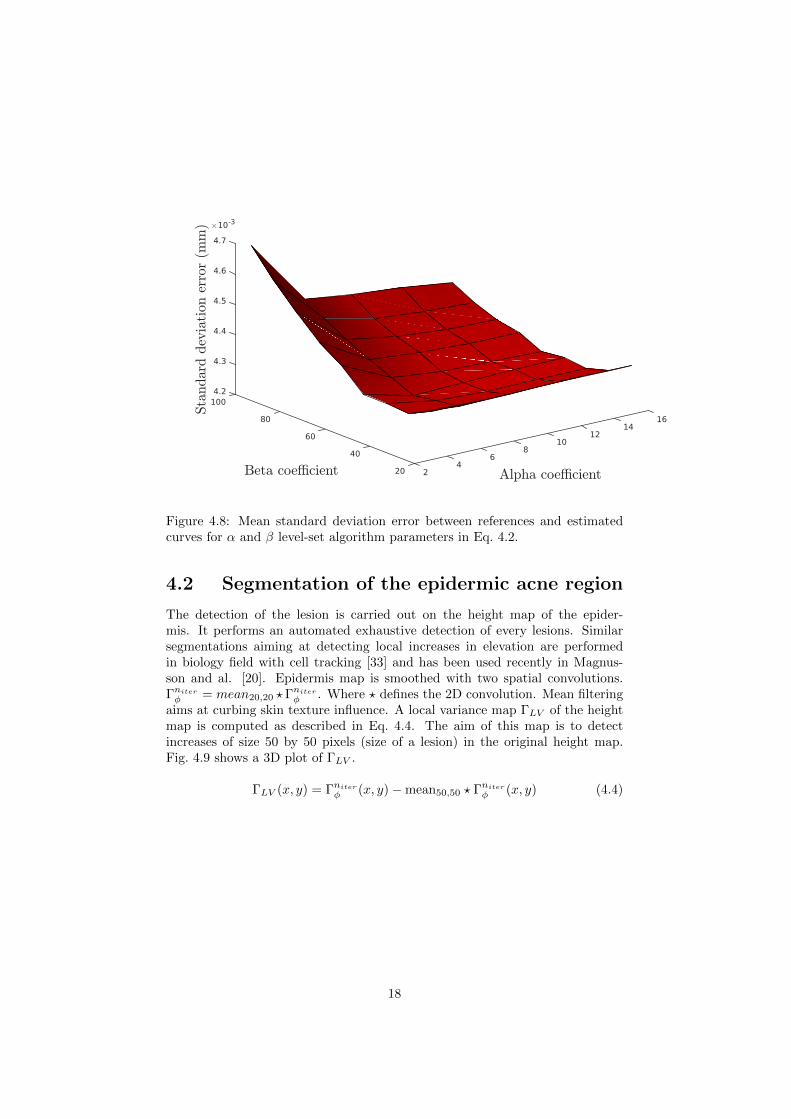
Figure 4.8: Mean standard deviation error between references and estimatedcurves for α and β level-set algorithm parameters in Eq. 4.2.
4.2 Segmentation of the epidermic acne region
The detection of the lesion is carried out on the height map of the epider-mis. It performs an automated exhaustive detection of every lesions. Similarsegmentations aiming at detecting local increases in elevation are performedin biology field with cell tracking [33] and has been used recently in Magnus-son and al. [20]. Epidermis map is smoothed with two spatial convolutions.Γniterφ = mean20,20 ?Γniterφ . Where ? defines the 2D convolution. Mean filteringaims at curbing skin texture influence. A local variance map ΓLV of the heightmap is computed as described in Eq. 4.4. The aim of this map is to detectincreases of size 50 by 50 pixels (size of a lesion) in the original height map.Fig. 4.9 shows a 3D plot of ΓLV .
ΓLV (x, y) = Γniterφ (x, y)−mean50,50 ? Γniterφ (x, y) (4.4)
18
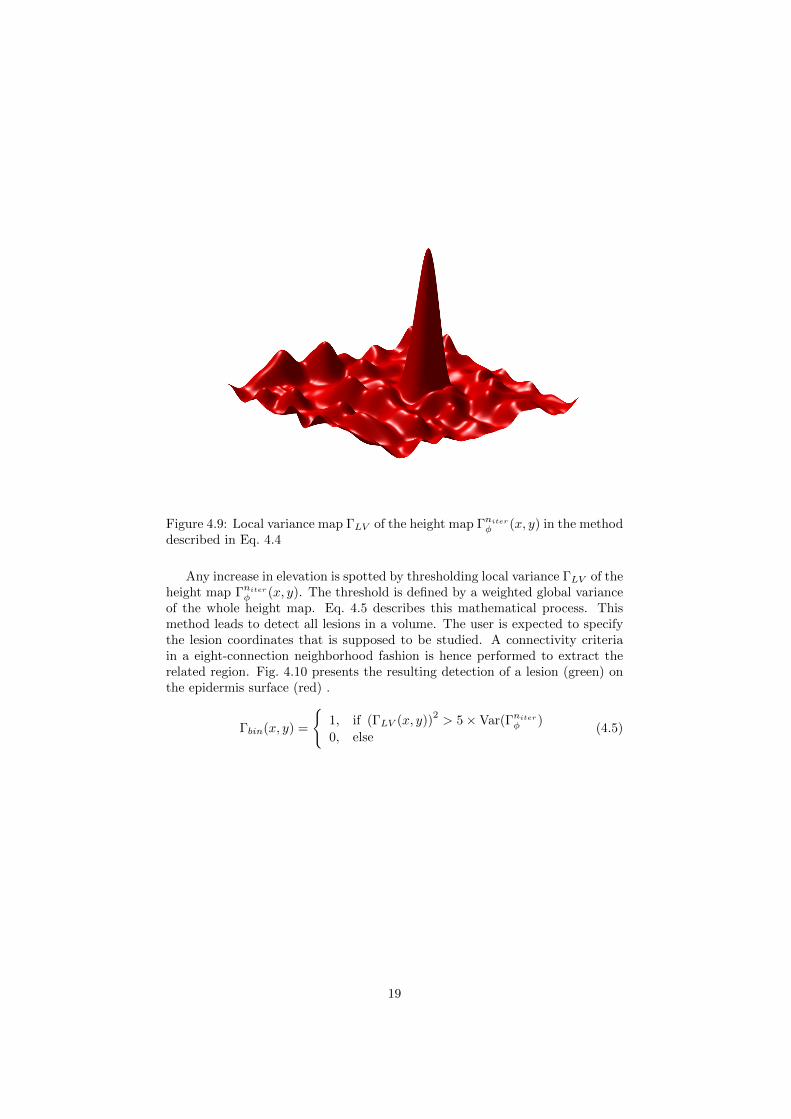
Figure 4.9: Local variance map ΓLV of the height map Γniterφ (x, y) in the methoddescribed in Eq. 4.4
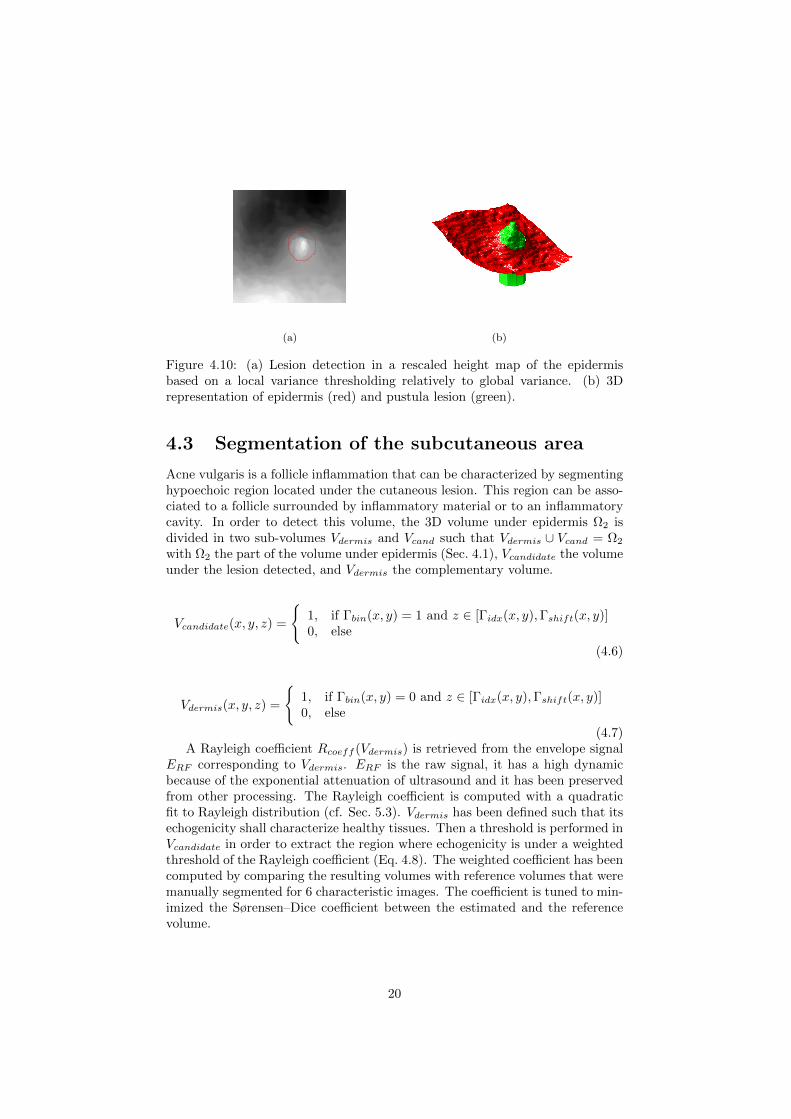
Any increase in elevation is spotted by thresholding local variance ΓLV of theheight map Γniterφ (x, y). The threshold is defined by a weighted global varianceof the whole height map. Eq. 4.5 describes this mathematical process. Thismethod leads to detect all lesions in a volume. The user is expected to specifythe lesion coordinates that is supposed to be studied. A connectivity criteriain a eight-connection neighborhood fashion is hence performed to extract therelated region. Fig. 4.10 presents the resulting detection of a lesion (green) onthe epidermis surface (red) .
Γbin(x, y) =
1, if (ΓLV (x, y))
2> 5×Var(Γniterφ )
0, else(4.5)
19
(a) (b)
Figure 4.10: (a) Lesion detection in a rescaled height map of the epidermisbased on a local variance thresholding relatively to global variance. (b) 3Drepresentation of epidermis (red) and pustula lesion (green).
4.3 Segmentation of the subcutaneous area
Acne vulgaris is a follicle inflammation that can be characterized by segmentinghypoechoic region located under the cutaneous lesion. This region can be asso-ciated to a follicle surrounded by inflammatory material or to an inflammatorycavity. In order to detect this volume, the 3D volume under epidermis Ω2 isdivided in two sub-volumes Vdermis and Vcand such that Vdermis ∪ Vcand = Ω2
with Ω2 the part of the volume under epidermis (Sec. 4.1), Vcandidate the volumeunder the lesion detected, and Vdermis the complementary volume.
Vcandidate(x, y, z) =
1, if Γbin(x, y) = 1 and z ∈ [Γidx(x, y),Γshift(x, y)]0, else
(4.6)
Vdermis(x, y, z) =
1, if Γbin(x, y) = 0 and z ∈ [Γidx(x, y),Γshift(x, y)]0, else
(4.7)A Rayleigh coefficient Rcoeff (Vdermis) is retrieved from the envelope signal
ERF corresponding to Vdermis. ERF is the raw signal, it has a high dynamicbecause of the exponential attenuation of ultrasound and it has been preservedfrom other processing. The Rayleigh coefficient is computed with a quadraticfit to Rayleigh distribution (cf. Sec. 5.3). Vdermis has been defined such that itsechogenicity shall characterize healthy tissues. Then a threshold is performed inVcandidate in order to extract the region where echogenicity is under a weightedthreshold of the Rayleigh coefficient (Eq. 4.8). The weighted coefficient has beencomputed by comparing the resulting volumes with reference volumes that weremanually segmented for 6 characteristic images. The coefficient is tuned to min-imized the Sørensen–Dice coefficient between the estimated and the referencevolume.
20

Vsub lesion(x, y, z) =
1, if Vcandidate(x, y, z) = 1 and EVdermisRF (x, y) < ratio ∗Rcoeff0, else
(4.8)With:
ERF the envelope of the RF ultrasound signalRcoeff (Vdermis) the Rayleigh coefficient associated to the volume defined by Vdermis .
ratio weighting coefficient that minimized Sørensen–Dice coefficent.
21
Chapter 5
Results
In this chapter, we first show results concerning the validation of epidermissegmentation. Then, we propose results using epidermis segmentation data andlesion detection in order to perform a geometrical characterization of the lesions.Next section aims at presenting tissue characterization of dermis using statisticaltools. Eventually a longitudinal study of one patient’s lesion is shown.
5.1 Validation of the epidermis segmentation
Epidermis segmentation is a crucial step in the whole algorithm process becauseevery errors in the detection of the epidermis will hence have an impact in thedetection of the lesion and in the final results. Validation could concern thewhole epidermis surface, but we decided to reduce the space of study to orthog-onal curves passing by the lesions. The reason is that the segmentation shouldbe as close as possible in these regions and it can be accepted that other areas ofepidermis may be less well detected. The main idea is to curb error propagationin the next steps of the algorithm. Fig. 5.1 features the worst and the bestepidermis segmentation (red) considering quadratic error with manually drawnreferences (green).
Fig. 5.2 shows mean error and mean standard deviation over 30 000 pointsin total, the results are presented by patient. One can notice that mean error isvery low, it means that our algorithm does not feature any shift error. Standarderror over the data is as well very low, it reaches a maximum of about 3% of thewhole probe depth (3.1 mm) for patient 1. Comparing these results with othermodalities is not possible because high frequency ultrasound imaging applied indermatology is a brand new field of research. Nevertheless, we can consider thatsuch results is enough for the proper functioning of the whole chain algorithm.
22
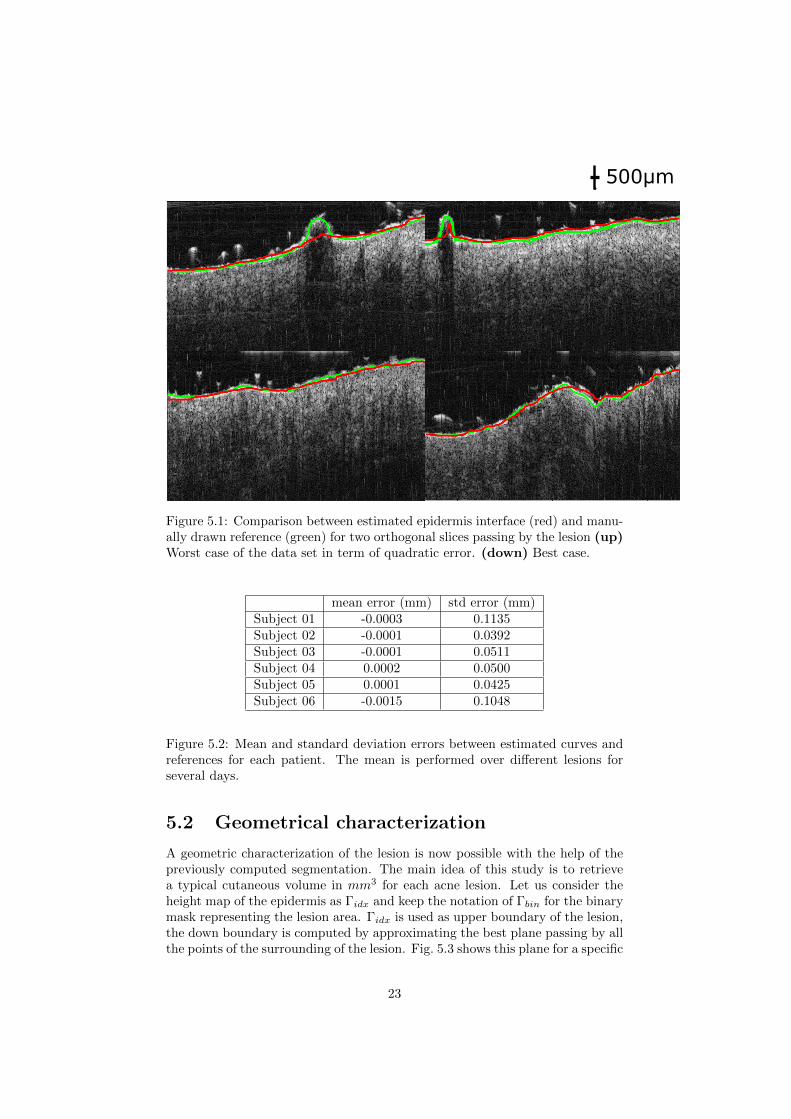
500μm
Figure 5.1: Comparison between estimated epidermis interface (red) and manu-ally drawn reference (green) for two orthogonal slices passing by the lesion (up)Worst case of the data set in term of quadratic error. (down) Best case.
mean error (mm) std error (mm)Subject 01 -0.0003 0.1135Subject 02 -0.0001 0.0392Subject 03 -0.0001 0.0511Subject 04 0.0002 0.0500Subject 05 0.0001 0.0425Subject 06 -0.0015 0.1048
Figure 5.2: Mean and standard deviation errors between estimated curves andreferences for each patient. The mean is performed over different lesions forseveral days.
5.2 Geometrical characterization
A geometric characterization of the lesion is now possible with the help of thepreviously computed segmentation. The main idea of this study is to retrievea typical cutaneous volume in mm3 for each acne lesion. Let us consider theheight map of the epidermis as Γidx and keep the notation of Γbin for the binarymask representing the lesion area. Γidx is used as upper boundary of the lesion,the down boundary is computed by approximating the best plane passing by allthe points of the surrounding of the lesion. Fig. 5.3 shows this plane for a specific
23
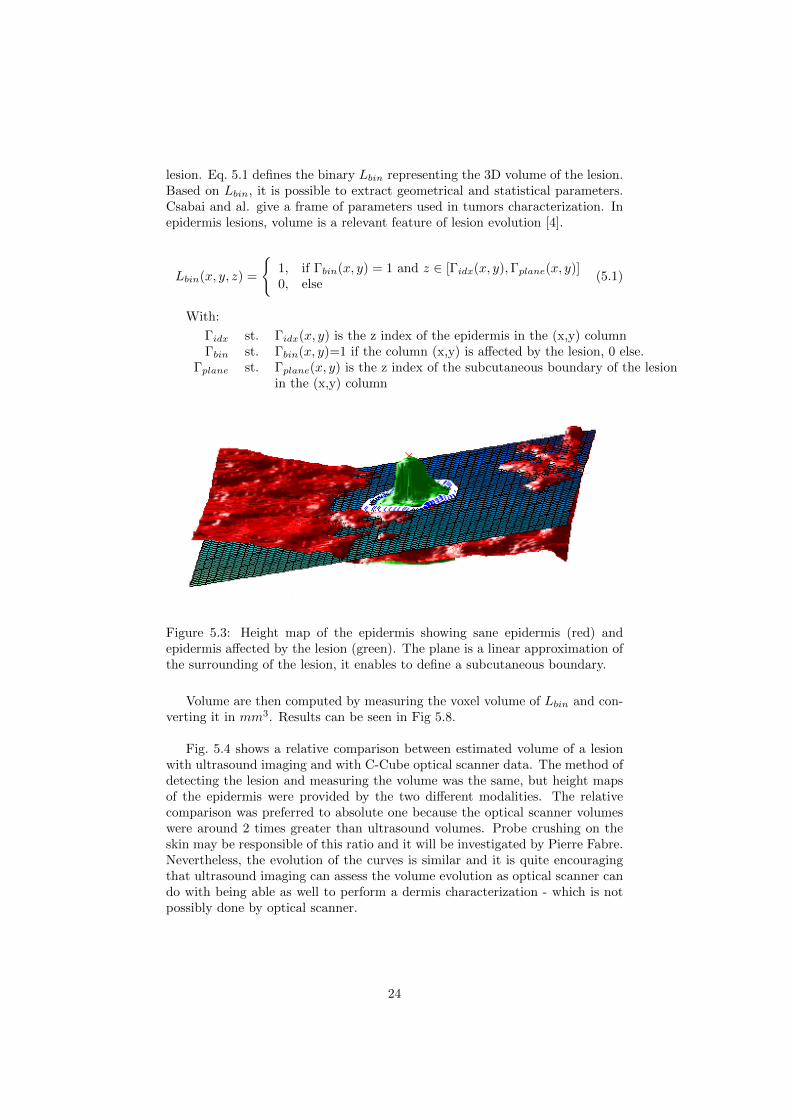
lesion. Eq. 5.1 defines the binary Lbin representing the 3D volume of the lesion.Based on Lbin, it is possible to extract geometrical and statistical parameters.Csabai and al. give a frame of parameters used in tumors characterization. Inepidermis lesions, volume is a relevant feature of lesion evolution [4].
Lbin(x, y, z) =
1, if Γbin(x, y) = 1 and z ∈ [Γidx(x, y),Γplane(x, y)]0, else
(5.1)
With:
Γidx st. Γidx(x, y) is the z index of the epidermis in the (x,y) columnΓbin st. Γbin(x, y)=1 if the column (x,y) is affected by the lesion, 0 else.
Γplane st. Γplane(x, y) is the z index of the subcutaneous boundary of the lesionin the (x,y) column
Figure 5.3: Height map of the epidermis showing sane epidermis (red) andepidermis affected by the lesion (green). The plane is a linear approximation ofthe surrounding of the lesion, it enables to define a subcutaneous boundary.
Volume are then computed by measuring the voxel volume of Lbin and con-verting it in mm3. Results can be seen in Fig 5.8.
Fig. 5.4 shows a relative comparison between estimated volume of a lesionwith ultrasound imaging and with C-Cube optical scanner data. The method ofdetecting the lesion and measuring the volume was the same, but height mapsof the epidermis were provided by the two different modalities. The relativecomparison was preferred to absolute one because the optical scanner volumeswere around 2 times greater than ultrasound volumes. Probe crushing on theskin may be responsible of this ratio and it will be investigated by Pierre Fabre.Nevertheless, the evolution of the curves is similar and it is quite encouragingthat ultrasound imaging can assess the volume evolution as optical scanner cando with being able as well to perform a dermis characterization - which is notpossibly done by optical scanner.
24
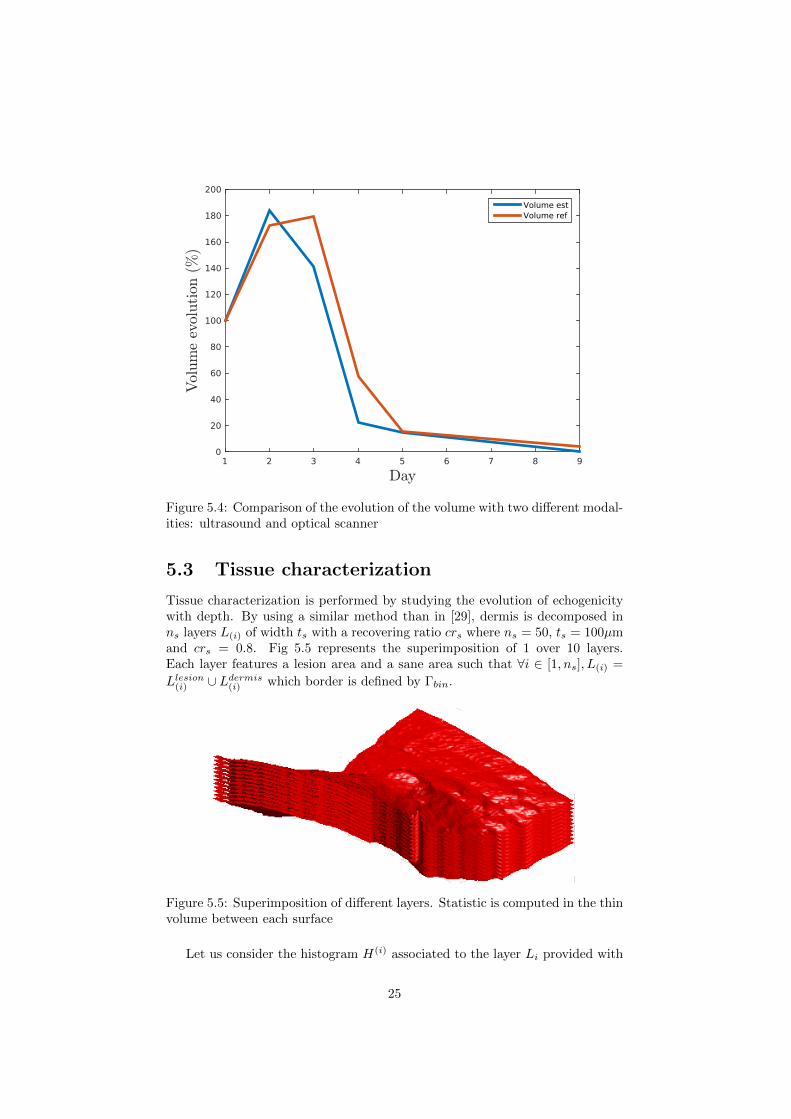
Figure 5.4: Comparison of the evolution of the volume with two different modal-ities: ultrasound and optical scanner
5.3 Tissue characterization
Tissue characterization is performed by studying the evolution of echogenicitywith depth. By using a similar method than in [29], dermis is decomposed inns layers L(i) of width ts with a recovering ratio crs where ns = 50, ts = 100µmand crs = 0.8. Fig 5.5 represents the superimposition of 1 over 10 layers.Each layer features a lesion area and a sane area such that ∀i ∈ [1, ns], L(i) =
Llesion(i) ∪ Ldermis(i) which border is defined by Γbin.
Figure 5.5: Superimposition of different layers. Statistic is computed in the thinvolume between each surface
Let us consider the histogram H(i) associated to the layer Li provided with
25
RF signal values. H(i) is composed of N bins from 0 to Max RF. Petrella and al.has shown that for ultrasound images H(i) features a Rayleigh distribution [26].
The estimation of the distribution P (i) is done according to Parzen-Rosenblattmethod. It is mathematically defined in Eq. 5.2. Minimization is performedwith Nelder-Mead method [16].
P (i)(E) =1
Nh
N∑k=1
K
(x− xkh
)(5.2)
with:xk , the mean value of H(i) binh , smoothing coefficient set to 1
K , the kernel s.t. K(x) = 1√2πe−
12x
2
A Rayleigh parameter σi is related to the layer L(i), and sub-parameters
σlesioni and σdermisi are respectively associated to layers Llesion(i) and Ldermis(i) .Rayleigh parameters σi are computed such that they minimise the quadraticerror between Rayleign distribution PRayleighσ (E) and estimated distribution
P (i). Rayleigh distribution is defined by PRayleighσ (E) = Eσ2 e− E2
2σ2 and P (i) isdescribed in Eq. 5.3.
σi = arg minσ∈R
∫ (PRayleighσ (E)− P (i)(E)
)2
dE. (5.3)
with:
PRayleighσ (E) = Eσ2 e− E2
2σ2
P (i)(E) = 1N
∑Nk=1K (x− xk)
K(x) = 1√2πe−
12x
2
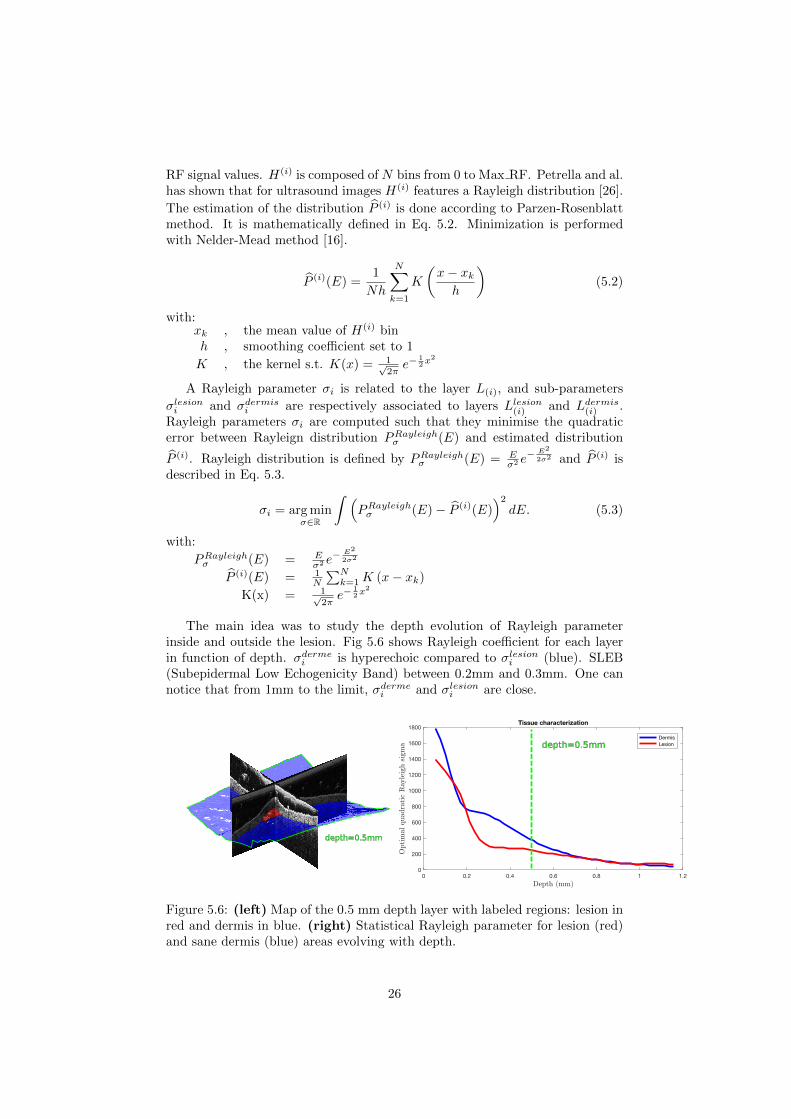
The main idea was to study the depth evolution of Rayleigh parameterinside and outside the lesion. Fig 5.6 shows Rayleigh coefficient for each layerin function of depth. σdermei is hyperechoic compared to σlesioni (blue). SLEB(Subepidermal Low Echogenicity Band) between 0.2mm and 0.3mm. One cannotice that from 1mm to the limit, σdermei and σlesioni are close.
depth=0.5mm
depth=0.5mm
Figure 5.6: (left) Map of the 0.5 mm depth layer with labeled regions: lesion inred and dermis in blue. (right) Statistical Rayleigh parameter for lesion (red)and sane dermis (blue) areas evolving with depth.
26
5.4 Longitudinal study
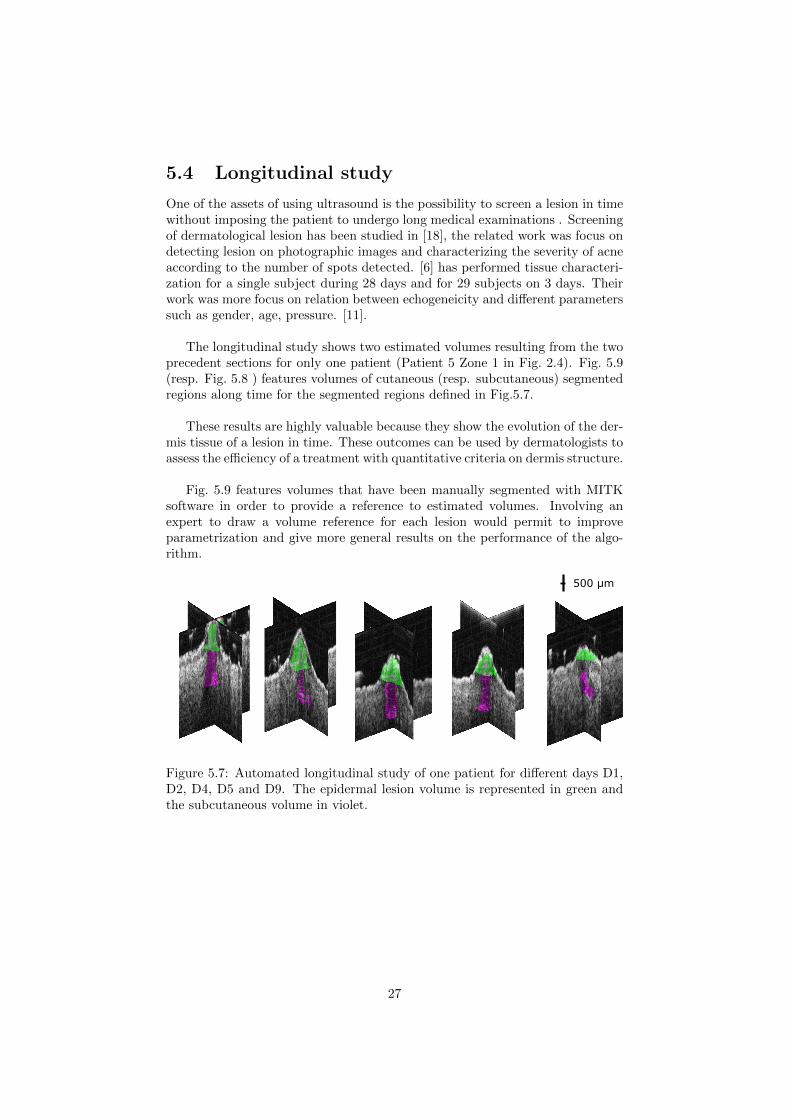
One of the assets of using ultrasound is the possibility to screen a lesion in timewithout imposing the patient to undergo long medical examinations . Screeningof dermatological lesion has been studied in [18], the related work was focus ondetecting lesion on photographic images and characterizing the severity of acneaccording to the number of spots detected. [6] has performed tissue characteri-zation for a single subject during 28 days and for 29 subjects on 3 days. Theirwork was more focus on relation between echogeneicity and different parameterssuch as gender, age, pressure. [11].
The longitudinal study shows two estimated volumes resulting from the twoprecedent sections for only one patient (Patient 5 Zone 1 in Fig. 2.4). Fig. 5.9(resp. Fig. 5.8 ) features volumes of cutaneous (resp. subcutaneous) segmentedregions along time for the segmented regions defined in Fig.5.7.
These results are highly valuable because they show the evolution of the der-mis tissue of a lesion in time. These outcomes can be used by dermatologists toassess the efficiency of a treatment with quantitative criteria on dermis structure.
Fig. 5.9 features volumes that have been manually segmented with MITKsoftware in order to provide a reference to estimated volumes. Involving anexpert to draw a volume reference for each lesion would permit to improveparametrization and give more general results on the performance of the algo-rithm.
500 μm
Figure 5.7: Automated longitudinal study of one patient for different days D1,D2, D4, D5 and D9. The epidermal lesion volume is represented in green andthe subcutaneous volume in violet.
27
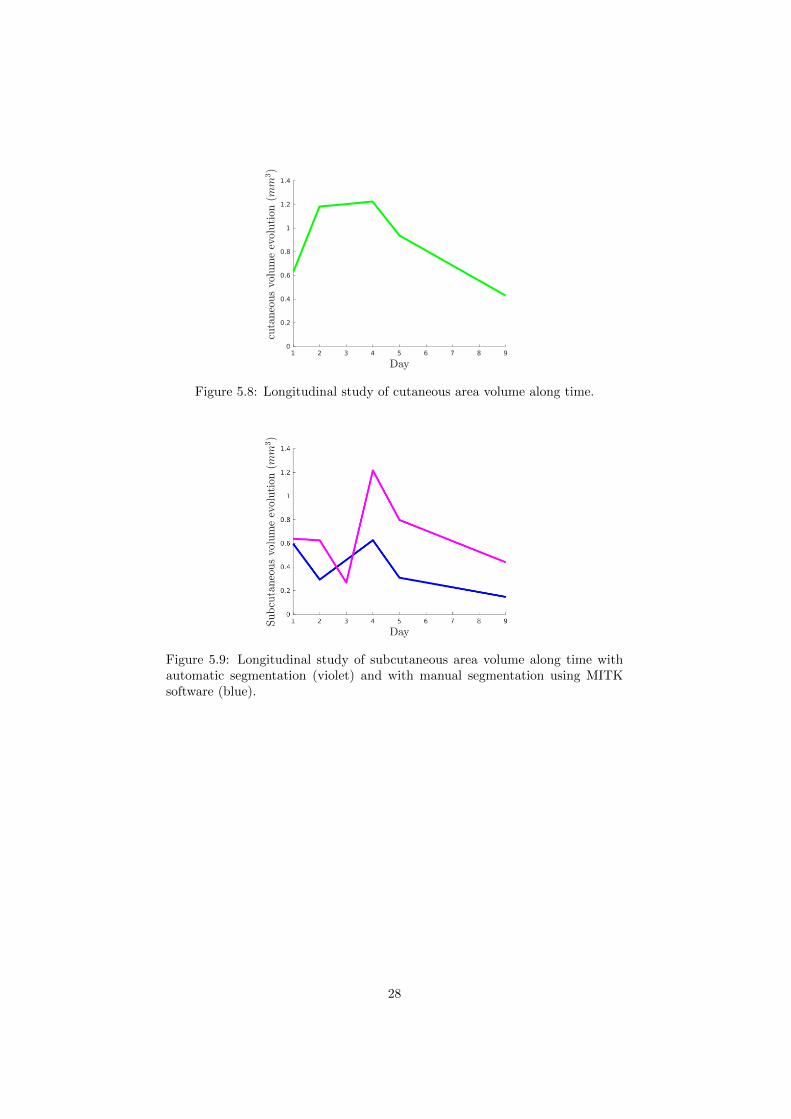
Figure 5.8: Longitudinal study of cutaneous area volume along time.
Figure 5.9: Longitudinal study of subcutaneous area volume along time withautomatic segmentation (violet) and with manual segmentation using MITKsoftware (blue).
28
Chapter 6
Implementation in C/C++
In this chapter, we describe the purpose of the implementation and the specificfunctions that we have achieved to code.
6.1 Existing work
Bruno Sciolla has coded a C++ UI used to segment skin tumors [28]. Forthis segmentation he needs an efficient segmentation of epidermis. Regardingthe proper results of the present epidermis segmentation method, I started toconvert this specific part of the algorithm into C++. The original code is usingBlitz library to deal with 3D data.
6.2 Blitz library
Blitz library is a C++/C library used to perform fast scientific calculus. It isbased on fortran root and permits to easily manipulate 3D data. The libraryfeatures an important set of 3D functions concerning indexing. The main pur-pose of my work in this section was to implement the epidermis segmentationmethod to an existent software.
6.3 Functions
6.3.1 Replicate function
The replicate function that has been coded is used to pad the 3D matrix beforea convolution. The main padding choices can be : symmetric, replicate andcircular. Symmetric way of padding consists in copying the border values sym-metrically according to the border. Circular way is out of question because thereis no link between opposite border of our data. Symmetric padding consists incopying the border value by applying a symmetric transform according to thehyperplan defined by the border itself. For example the symmetric padding oflength 2 of V = [1, 2, 3, 2, 1] would produce Vsym = [3, 2, 1, 2, 3, 2, 1, 2, 3]. Thistype of padding is not a relevant choice in our case because it tends to artificiallycreate area with high local variance. Replicate padding corresponds to copying
29

the border pixel along the length of the padding, so the replicated version of Vwould be Vrep = [1, 1, 1, 2, 3, 2, 1, 1, 1] Replicate way of padding is a convenientway of keeping convolution output and input data of the same size and curbingany interference at the border.
6.3.2 Convolution function
The implementation of the 3D convolution function is highly facilitated by theuse of Blitz library. In C++, 3D data are stored in an array fashion whichmeans that retrieving neighbouring voxels can be puzzling. Blitz permits tocreate index along each dimension.
30
Chapter 7
Conclusion and FutureWork
The master thesis in the context of high frequency 3D ultrasounds imaging hasshown promising results by demonstrating the feasibility of isolating acne lesionswith an automatic and exhaustive procedure. The retrieving of bio features ofthe lesion leaves the study field wide open.
According to our collaborators at Pierre Fabre, the in-vivo characterizationof acne lesions is an entirely new area of research in the field of cosmetics anddermatology. Most previous studies were based on photographic images of anentire area of the skin, and were not capable of monitoring the evolution of asingle lesion in time. An article is being written to present the results of thisthesis. This work paves the way to a new methodology for studying the treat-ment of acne lesions.
The C++ algorithm developed during this thesis will be deployed on thecommercial 3D segmentation software of Atys Medical.
Future work of the project may concern improvements in subcutaneous re-gion segmentation. An active contour method using a log likelihood functionalinspired from Sciolla and al. [28] has been investigated. It has shown remark-able results and represents another promising avenue for research.
31

Bibliography
[1] N. S. Boroujeni, S. A. Etemad, and A. Whitehead. Robust horizon detec-tion using segmentation for uav applications. In 2012 Ninth Conference onComputer and Robot Vision, pages 346–352, May 2012.
[2] V. Caselles, R. Kimmel, and G. Sapiro. Geodesic active contours. InComputer Vision, 1995. Proceedings., Fifth International Conference on,pages 694–699, Jun 1995.
[3] T.F. Chan and L.A. Vese. Active contours without edges. Image Processing,IEEE Transactions on, 10(2):266–277, Feb 2001.
[4] D Csabai, K Szalai, and M Gyongy. Automated classification of commonskin lesions using bioinspired features. In Ultrasonics Symposium (IUS),2016 IEEE International, pages 1–4. IEEE, 2016.
[5] Jean De Rigal, Catherine Escoffier, Bernard Querleux, Brigitte Faivre,Pierre Agache, and Jean-Luc Leveque. Assessment of aging of the humanskin by in vivo ultrasonic imaging. Journal of investigative dermatology,93(5):621–625, 1989.
[6] Celine Fournier, S Lori Bridal, Genevieve Berger, and Pascal Laugier. Re-producibility of skin characterization with backscattered spectra (12–25mhz) in healthy subjects. Ultrasound in medicine & biology, 27(5):603–610, 2001.
[7] Yi Gao, Allen Tannenbaum, Hao Chen, Mylin Torres, Emi Yoshida, Xi-aofeng Yang, Yuefeng Wang, Walter Curran, and Tian Liu. Automatedskin segmentation in ultrasonic evaluation of skin toxicity in breast cancerradiotherapy. Ultrasound in medicine & biology, 39(11):2166–2175, 2013.
[8] M Gniadecka. Effects of ageing on dermal echogenicity. Skin Research andTechnology, 7(3):204–207, 2001.
[9] Elisabeth A. Holm, Hans C. Wulf, Lars Thomassen, and Gregor B.E. Je-mec. Instrumental assessment of atopic eczema: Validation of transepider-mal water loss, stratum corneum hydration, erythema, scaling, and edema.Journal of the American Academy of Dermatology, 55(5):772 – 780, 2006.
[10] M. Daniels James and Richard A. Hoppmann, editors. Practical Point-of-Care Medical Ultrasound. Springer International Publishing, 2016.
32
[11] G Josse, C Rouvrais, A Mas, M Haftek, A Delalleau, Y Ferraq, F Ossant,J George, JM Lagarde, and AM Schmitt. A multitechnique evaluation oftopical corticosteroid treatment. Skin Research and Technology, 15(1):35–39, 2009.
[12] J. Kim, J.W. Fisher, A. Yezzi, M. Cetin, and A.S. Willsky. A nonparametricstatistical method for image segmentation using information theory andcurve evolution. Image Processing, IEEE Transactions on, 14(10):1486–1502, Oct 2005.
[13] Alex Krizhevsky, Ilya Sutskever, and Geoffrey E Hinton. Imagenet classi-fication with deep convolutional neural networks. In F. Pereira, C. J. C.Burges, L. Bottou, and K. Q. Weinberger, editors, Advances in NeuralInformation Processing Systems 25, pages 1097–1105. Curran Associates,Inc., 2012.
[14] Francesco Lacarrubba, Aurora Tedeschi, Beatrice Nardone, and GiuseppeMicali. Mesotherapy for skin rejuvenation: assessment of the subepidermallow-echogenic band by ultrasound evaluation with cross-sectional b-modescanning. Dermatologic therapy, 21(s3):S1–S5, 2008.
[15] Jean-Michel Lagarde, Jerome George, Romain Soulcie, and David Black.Automatic measurement of dermal thickness from b-scan ultrasound imagesusing active contours. Skin Research and Technology, 11(2):79–90, 2005.
[16] Jeffrey C Lagarias, James A Reeds, Margaret H Wright, and Paul E Wright.Convergence properties of the nelder–mead simplex method in low dimen-sions. SIAM Journal on optimization, 9(1):112–147, 1998.
[17] S. Lankton and A. Tannenbaum. Localizing region-based active contours.Image Processing, IEEE Transactions on, 17(11):2029–2039, Nov 2008.
[18] S. Lucut and M. R. Smith. Dermatological tracking of chronic acne treat-ment effectiveness. In 2016 38th Annual International Conference of theIEEE Engineering in Medicine and Biology Society (EMBC), pages 5421–5426, Aug 2016.
[19] Michael Lynch, Ovidiu Ghita, and Paul F Whelan. Automatic segmenta-tion of the left ventricle cavity and myocardium in mri data. Computers inbiology and medicine, 36(4):389–407, 2006.
[20] Klas EG Magnusson, Joakim Jalden, Penney M Gilbert, and Helen M Blau.Global linking of cell tracks using the viterbi algorithm. IEEE transactionson medical imaging, 34(4):911–929, 2015.
[21] Oleg V Michailovich and Allen Tannenbaum. Despeckling of medical ultra-sound images. ieee transactions on ultrasonics, ferroelectrics, and frequencycontrol, 53(1):64–78, 2006.
[22] M Omura, A Coron, SL Bridal, K Yoshida, and T Yamaguchi. Quantitativeultrasound imaging of bacterial infection on skin ulcers by envelope statis-tics analysis. In Ultrasonics Symposium (IUS), 2016 IEEE International,pages 1–4. IEEE, 2016.
33
[23] Stanley Osher and James A Sethian. Fronts propagating with curvature-dependent speed: algorithms based on hamilton-jacobi formulations. Jour-nal of computational physics, 79(1):12–49, 1988.
[24] M. Pereyra, N. Dobigeon, H. Batatia, and J. Tourneret. Segmentation ofskin lesions in 2D and 3D ultrasound images using a spatially coherentgeneralized rayleigh mixture model. Medical Imaging, IEEE Transactionson, 31(8):1509–1520, Aug 2012.
[25] J. L. Perez-Gonzalez, J. C. Bello Munoz, M. C. Rolon Porras, FernandoArambula-Cosıo, and V. Medina-Banuelos. Automatic Fetal Head Mea-surements from Ultrasound Images Using Optimal Ellipse Detection andTexture Maps, pages 329–332. Springer International Publishing, Cham,2015.
[26] Lorena Itatı Petrella, Heliomar de Azevedo Valle, Paulo Roberto Issa, Car-los Jose Martins, Joao Carlos Machado, and Wagner Coelho A Pereira.Statistical analysis of high frequency ultrasonic backscattered signals frombasal cell carcinomas. Ultrasound in medicine & biology, 38(10):1811–1819,2012.
[27] Bernard Querleux, Therese Baldeweck, Stephane Diridollou, Jean De Rigal,Etienne Huguet, Frederic Leroy, and Victoria Holloway Barbosa. Skin fromvarious ethnic origins and aging: an in vivo cross-sectional multimodalityimaging study. Skin Research and Technology, 15(3):306–313, 2009.
[28] B. Sciolla, L. Cowell, T. Dambry, B. Guibert, and P. Delachartre. Segmen-tation of skin tumors in high-frequency 3d ultrasound images. Ultrasoundsin Medecine and Biology, 2016.
[29] Bruno Sciolla, Lester Cowell, Thibaut Dambry, Benoıt Guibert, andPhilippe Delachartre. Segmentation of skin tumors in high-frequency 3-d ultrasound images. Ultrasound in medicine & biology, 2016.
[30] J. A. Sethian. Level Set Methods and Fast Marching Methods. CambridgeUniversity Press, 1999.
[31] J. Weickert, B.M.T.H. Romeny, and M.A. Viergever. Efficient and reliableschemes for nonlinear diffusion filtering. Image Processing, IEEE Transac-tions on, 7(3):398–410, Mar 1998.
[32] Ximena Wortsman, Pedro Claveria, Fernando Valenzuela, Maria TeresaMolina, and Jacobo Wortsman. Sonography of acne vulgaris. Journal ofUltrasound in Medicine, 33(1):93–102, 2014.
[33] Kenong Wu, David Gauthier, and Martin D Levine. Live cell image segmen-tation. IEEE Transactions on biomedical engineering, 42(1):1–12, 1995.
[34] Hongming Xu and Mrinal Mandal. Epidermis segmentation in skinhistopathological images based on thickness measurement and k-means al-gorithm. EURASIP Journal on Image and Video Processing, 2015(1), 2015.
34

[35] Yan Zhang, B.J. Matuszewski, L. Shark, and C.J. Moore. Medical imagesegmentation using new hybrid level-set method. In BioMedical Visual-ization, 2008. MEDIVIS ’08. Fifth International Conference, pages 71–76,July 2008.
[36] Song Chun Zhu and Alan Yuille. Region competition: Unifying snakes,region growing, and bayes/mdl for multiband image segmentation. IEEEtransactions on pattern analysis and machine intelligence, 18(9):884–900,1996.
35

TRITA 2017:044ISSN 1653-5146
www.kth.se