Embed Size (px)
Citation preview
Portland State University Portland State University
PDXScholar PDXScholar
TREC Final Reports Transportation Research and Education Center (TREC)
10-2018
SEGMENT: Applicability of an Existing Segmentation SEGMENT: Applicability of an Existing Segmentation
Technique to TDM Social Marketing Campaigns in Technique to TDM Social Marketing Campaigns in
the United States the United States
Philip L. Winters University of South Florida
Amy Lester University of South Florida
Minh Pham University of South Florida
Follow this and additional works at: https://pdxscholar.library.pdx.edu/trec_reports
Part of the Transportation Commons, Urban Studies Commons, and the Urban Studies and Planning
Commons
Let us know how access to this document benefits you.
Recommended Citation Recommended Citation Winters, P.L., Lester, A.B., & Pham, M. SEGMENT: Applicability of an Existing Segmentatio Technique to TDM Social Marketing Campaigns in the United States. NITC-RR-1057. Portland, OR: Transportation Research and Education Center (TREC), 2018. https://doi.org/10.15760/trec.210
This Report is brought to you for free and open access. It has been accepted for inclusion in TREC Final Reports by an authorized administrator of PDXScholar. Please contact us if we can make this document more accessible: [email protected].

SEGMENT: Applicability of an Existing Segmentation Technique to TDM Social Marketing Campaigns in the United States
FINAL REPORT
NITC-RR-1057 October 2018
NITC is a U.S. Department of Transportation national university transportation center.

ii
SEGMENT: APPLICABILITY OF AN EXISTING SEGMENTATION TECHNIQUE TO TDM SOCIAL
MARKETING CAMPAIGNS IN THE UNITED STATES
Final Report
NITC-RR-1057
by
Philip L. Winters Amy B. Lester, PhD
Minh Pham, MS University of South Florida
Center for Urban Transportation Research
for
National Institute for Transportation and Communities (NITC) P.O. Box 751
Portland, OR 97207
October 2018

iii
Technical Report Documentation Page 1. Report No.
NITC-RR-1057
2. Government Accession No.
3. Recipient’s Catalog No.
4. Title and Subtitle SEGMENT: Applicability of an Existing Segmentation Technique to TDM Social Marketing Campaigns in the United States
5. Report Date October 2018
6. Performing Organization Code
7. Author(s) Philip Winters, Dr. Amy Lester, and Minh Pham
8. Performing Organization Report No.
9. Performing Organization Name and Address Center for Urban Transportation Research University of South Florida 4202 E. Fowler Ave., CUT100 Tampa, FL 33620
10. Work Unit No. (TRAIS)
11. Contract or Grant No. NITCN-RR-1057
12. Sponsoring Agency Name and Address National Institute for Transportation and Communities (NITC) P.O. Box 751 Portland, OR 97207
13. Type of Report and Period Covered
14. Sponsoring Agency Code
15. Supplementary Notes
16. Abstract
Social marketing seeks to develop and integrate marketing concepts with other approaches to influence behaviors that benefit individuals and communities for the greater social good. Social marketing is a useful transportation demand management (TDM) planning approach to promote travel-behavior change. The purpose of this study was to explore a consumer market segmentation technique (SEGMENT) successfully used in Europe for its applicability to social marketing campaigns in the United States. Major contributions of this project are the validation of a successful existing segmentation technique for applicability in the United States, which will maximize the impact of TDM social marketing campaigns on changing travel behavior and reduce the costs of customized segmentation studies.
17. Key Words Social marketing, segmentation, transportation demand management, TDM
18. Distribution Statement No restrictions. Copies available from NITC: www.nitc.us
19. Security Classification (of this report) Unclassified
20. Security Classification (of this page) Unclassified
21. No. of Pages 73
22. Price


5
ACKNOWLEDGEMENTS This project was funded by the National Institute for Transportation and Communities (NITC) under grant number NITCN-RR-1057. The PI would like to acknowledge graduate student Minh Pham for his assistance with the statistical analysis portion of this project, and for his contributions to the development of segment groups and the “golden questions.”
DISCLAIMER The contents of this report reflect the views of the authors, who are solely responsible for the facts and the accuracy of the material and information presented herein. This document is disseminated under the sponsorship of the U.S. Department of Transportation University Transportation Centers Program and Florida Department of Transportation in the interest of information exchange. The U.S. Government and Florida Department of Transportation assume no liability for the contents or use thereof. The contents do not necessarily reflect the official views of the U.S. Government and Florida Department of Transportation. This report does not constitute a standard, specification, or regulation.
RECOMMENDED CITATION Winters, P.L., Lester, A.B., & Pham, M. SEGMENT: Applicability of an Existing Segmentation Technique to TDM Social Marketing Campaigns in the United States. NITC-RR-1057. Portland, OR: Transportation Research and Education Center (TREC), 2018.

6
TABLE OF CONTENTS EXECUTIVE SUMMARY ............................................................................................................ 9 1.0 LITERATURE REVIEW ................................................................................................ 10
1.1 SOCIAL MARKETING ................................................................................................... 10 1.1.1 Examples of Social Marketing Campaigns ........................................................ 10 1.1.2 Distinguishing Features of Social Marketing ...................................................... 12
1.2 MARKET SEGMENTATION ......................................................................................... 13 1.2.1 Values, Attitudes, Life Style (VALSTM) ................................................................ 13 1.2.2 Potential Rating Index by ZIP market (PRIZM®) ............................................... 16 1.2.3 Examples of Transportation Market Segmentation .......................................... 20
1.3 TRANSPORTATION DEMAND MANAGEMENT ..................................................... 23 1.4 SOCIAL MARKETING AND PERSONAL TRAVEL BEHAVIOR ............................ 24
1.4.1 Travel Blending® .................................................................................................... 24 1.4.2 Sustained Impacts of Travel Blending ................................................................ 28
2.0 EUROPEAN SEGMENT PROJECT ........................................................................... 30 2.1 THE EUROPEAN SEGMENT PROJECT .................................................................. 30
2.1.1 SEGMENT Profiles ................................................................................................ 32 2.1.2 SEGMENT Case Examples .................................................................................. 32
3.0 METHODOLOGY ........................................................................................................... 33 3.1 SURVEY DESIGN .......................................................................................................... 33 3.2 METHODOLOGY FOR STATISTICAL ANALYSIS .................................................. 33
4.0 RESULTS AND FINDINGS .......................................................................................... 35 4.1 NON-DRIVER SEGMENTS .......................................................................................... 35 4.2 DRIVER SEGMENTS .................................................................................................... 40
5.0 DISCUSSION .................................................................................................................. 45 5.1 FINDINGS ....................................................................................................................... 45 5.2 SEGMENTS PROFILING ............................................................................................. 45
5.2.1 Non-driver groups................................................................................................... 45 5.2.2 Driver Groups .......................................................................................................... 46
5.3 SEGMENT REPRESENTATION BY STATE............................................................. 47 6.0 CONCLUSIONS AND FUTURE WORK .................................................................... 49 7.0 REFERENCES ............................................................................................................... 51 8.0 APPENDICES................................................................................................................. 54
7
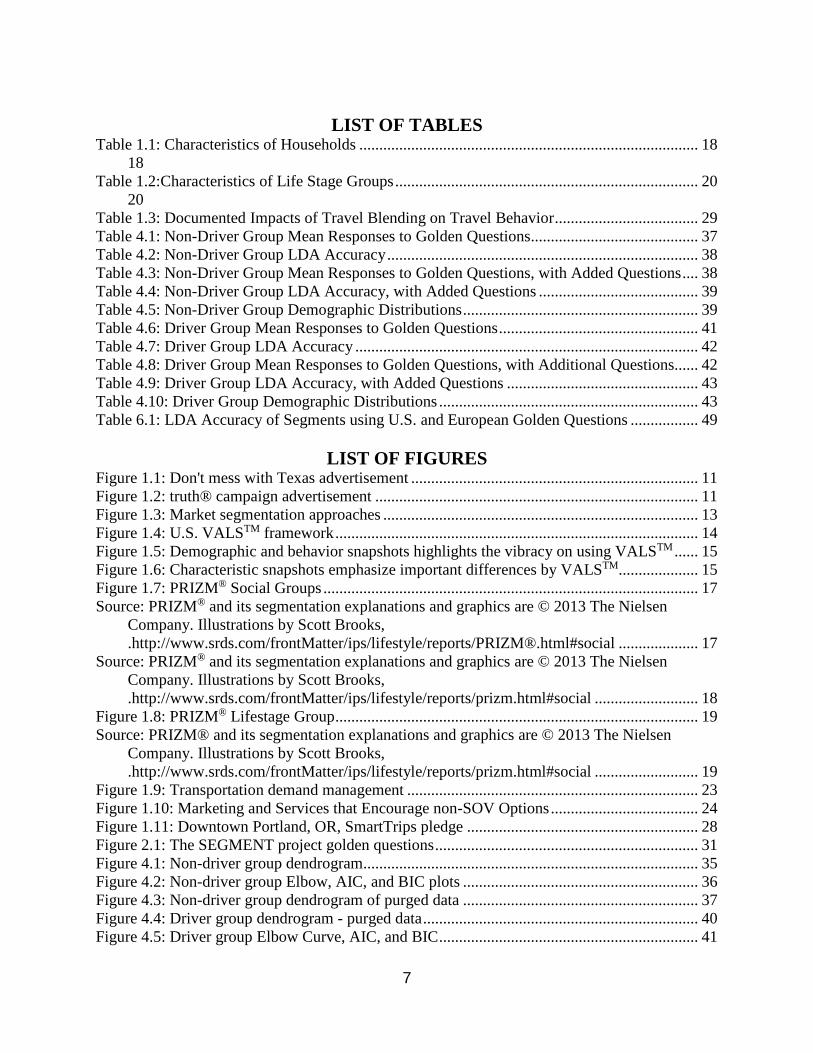
LIST OF TABLES
Table 1.1: Characteristics of Households ..................................................................................... 18 18 Table 1.2:Characteristics of Life Stage Groups ............................................................................ 20 20 Table 1.3: Documented Impacts of Travel Blending on Travel Behavior .................................... 29 Table 4.1: Non-Driver Group Mean Responses to Golden Questions .......................................... 37 Table 4.2: Non-Driver Group LDA Accuracy .............................................................................. 38 Table 4.3: Non-Driver Group Mean Responses to Golden Questions, with Added Questions .... 38 Table 4.4: Non-Driver Group LDA Accuracy, with Added Questions ........................................ 39 Table 4.5: Non-Driver Group Demographic Distributions ........................................................... 39 Table 4.6: Driver Group Mean Responses to Golden Questions .................................................. 41 Table 4.7: Driver Group LDA Accuracy ...................................................................................... 42 Table 4.8: Driver Group Mean Responses to Golden Questions, with Additional Questions...... 42 Table 4.9: Driver Group LDA Accuracy, with Added Questions ................................................ 43 Table 4.10: Driver Group Demographic Distributions ................................................................. 43 Table 6.1: LDA Accuracy of Segments using U.S. and European Golden Questions ................. 49
LIST OF FIGURES Figure 1.1: Don't mess with Texas advertisement ........................................................................ 11 Figure 1.2: truth® campaign advertisement ................................................................................. 11 Figure 1.3: Market segmentation approaches ............................................................................... 13 Figure 1.4: U.S. VALSTM framework ........................................................................................... 14 Figure 1.5: Demographic and behavior snapshots highlights the vibracy on using VALSTM ...... 15 Figure 1.6: Characteristic snapshots emphasize important differences by VALSTM.................... 15 Figure 1.7: PRIZM® Social Groups .............................................................................................. 17 Source: PRIZM® and its segmentation explanations and graphics are © 2013 The Nielsen
Company. Illustrations by Scott Brooks, .http://www.srds.com/frontMatter/ips/lifestyle/reports/PRIZM®.html#social .................... 17
Source: PRIZM® and its segmentation explanations and graphics are © 2013 The Nielsen Company. Illustrations by Scott Brooks, .http://www.srds.com/frontMatter/ips/lifestyle/reports/prizm.html#social .......................... 18
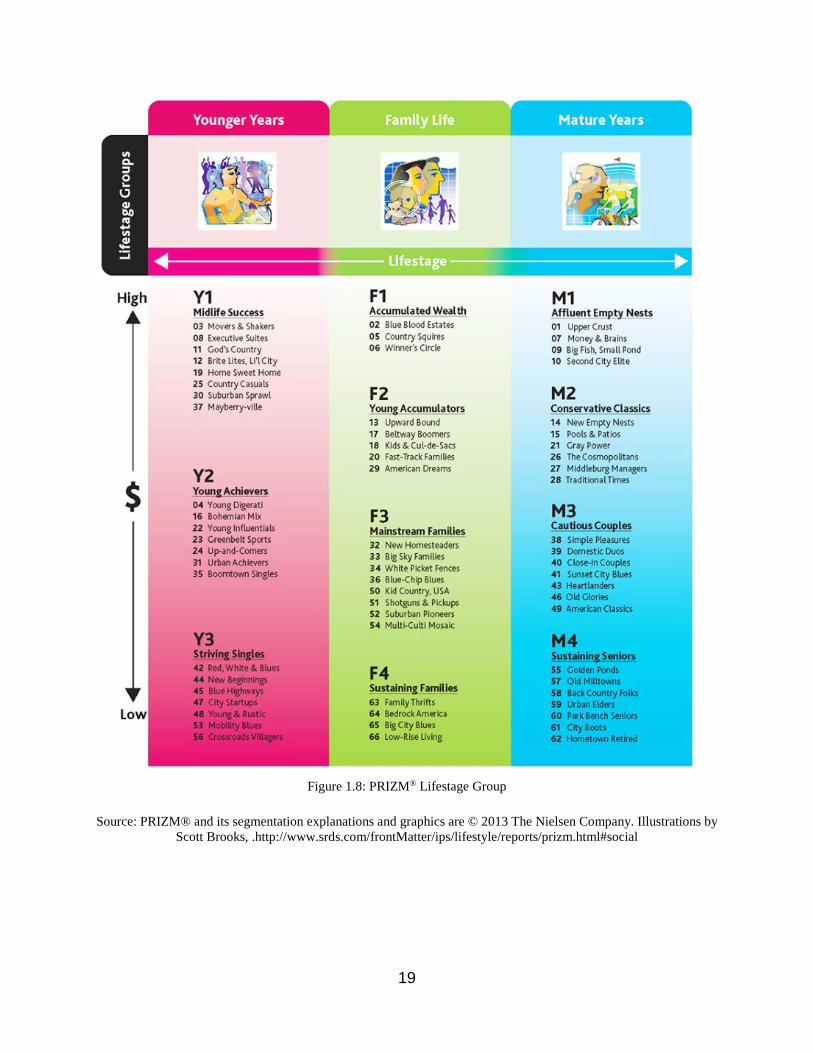
Figure 1.8: PRIZM® Lifestage Group ........................................................................................... 19 Source: PRIZM® and its segmentation explanations and graphics are © 2013 The Nielsen
Company. Illustrations by Scott Brooks, .http://www.srds.com/frontMatter/ips/lifestyle/reports/prizm.html#social .......................... 19
Figure 1.9: Transportation demand management ......................................................................... 23 Figure 1.10: Marketing and Services that Encourage non-SOV Options ..................................... 24 Figure 1.11: Downtown Portland, OR, SmartTrips pledge .......................................................... 28 Figure 2.1: The SEGMENT project golden questions .................................................................. 31 Figure 4.1: Non-driver group dendrogram.................................................................................... 35 Figure 4.2: Non-driver group Elbow, AIC, and BIC plots ........................................................... 36 Figure 4.3: Non-driver group dendrogram of purged data ........................................................... 37 Figure 4.4: Driver group dendrogram - purged data ..................................................................... 40 Figure 4.5: Driver group Elbow Curve, AIC, and BIC ................................................................. 41

8
Figure 5.1: Distribution of segments by state ............................................................................... 48
9
EXECUTIVE SUMMARY Social marketing seeks to develop and integrate marketing concepts with other approaches to influence behaviors that benefit individuals and communities for the greater social good (International Social Marketing Association, 2013). Social marketing is a useful transportation demand management (TDM) planning approach to promote travel-behavior change, and combines at least seven distinguishing features which set it apart from other popular, behavior-change planning approaches, such as education and mass media campaigns. These seven features include a focus on socially beneficial behavior change; a strong consumer orientation; the use of audience segmentation techniques and the selection of target audiences; the use of marketing’s conceptual framework (marketing mix and exchange theory); the recognition of competition; and continual marketing research.
The purpose of this study was to explore a consumer market segmentation technique (SEGMENT) successfully used in Europe for its applicability to social marketing campaigns in the United States.
The SEGMENT project in Europe was a three-year project that examined how consumer market-segmentation techniques can influence travel-behavior choices in favor of more energy-sustainable modes of travel. The project analyzed over 10,000 responses to comprehensive attitudinal surveys containing over 100 questions to generate eight main attitudinal segments useful for the design of mobility social marketing campaigns; additional analysis produced 18 “golden questions” representing the smallest number of survey questions required to reproduce the eight market segments (Intelligent Energy Europe, 2015).
The SEGMENT project in Europe concluded that most of their eight segments can be detected in all locations (27 EU member states); however, the proportion to which each segment is represented in each partner city differs. Additionally, the SEGMENT project analysis identified key dimensions of diversity across attitudinal groups which enabled a core set of attitudinal questions to be identified; from these different dimensions, the golden questions were produced.
The eight segments and golden questions identified by the European SEGMENT project cannot be directly transferrable to the United States’ population without further analysis. The research questions for this study included:
• Are attitudinal market segments the same in Europe and the United States? • What proportion of each segment is represented in each of three states in the
United States? • Are the golden questions used in Europe able to accurately predict segment
orientation in the United States?
Major contributions of this project are the validation of a successful existing segmentation technique for applicability in the United States, which will maximize the impact of TDM social marketing campaigns on changing travel behavior and reduce the costs of customized segmentation studies.
10
1.0 LITERATURE REVIEW
1.1 SOCIAL MARKETING
According to the International Social Marketing Association, social marketing is a practice that “seeks to develop and integrate marketing concepts with other approaches to influence behaviors that benefit individuals and communities for the greater social good.” Furthermore, the “practice is guided by ethical principles. It seeks to integrate research, best practice, theory, audience and partnership insight, to inform the delivery of competition sensitive and segmented social change programs that are effective, efficient, equitable, and sustainable.” (International Social Marketing Association, 2013). The National Social Marketing Centre (NSMC) of England (2011) defines social marketing as “an approach used to develop activities aimed at changing or maintaining people’s behavior for the benefit of individuals and society as a whole.” Another definition that further explains the practice is “Social marketing is a process that applies marketing principles and techniques to create, communicate, and deliver value in order to influence target audience behaviors that benefit society (public health, safety, the environment, and communities) as well as the target audience” (Lee and Kotler, 2011).
Whereas traditional marketing is used to sell goods and services, social marketing sells behaviors. Social marketers typically want to influence target markets to do one of four things: (1) accept a new behavior (e.g., bicycle to work); (2) reject a potentially undesirable behavior (e.g., purchase a vehicle); (3) modify a current behavior (e.g., decrease number of single occupancy vehicle trips); or (4) abandon an old undesirable behavior (e.g., texting while driving). Social marketers may also encourage a one-time behavior (e.g., purchase a fuel-efficient vehicle) or the establishment of a habit and the prompting of a repeated behavior (e.g., wearing a seat belt) (Lee and Kotler, 2011). Additionally, the behavior change must benefit society; “social marketers insist that the behaviors being promoted contribute to the consumers’ and society’s well-being… social marketers see it as their responsibility to design and deliver offerings that preserve and enhance social good” (Bryant, 2000). The key goal of social marketing in contrast with commercial marketing is outlined as, “ . . . commercial marketing tries to change people's behavior for the benefit of the marketer; social marketing tries to change people's behavior for the benefit of the consumer, or of society as a whole,” (Lawrence, 2015).
1.1.1 Examples of Social Marketing Campaigns
Social marketing has been applied in many different fields including public health (e.g., tobacco use), environmental protection (e.g., recycling), and injury prevention (e.g., seat belt use).
Two examples of social marketing campaigns that are somewhat familiar and have had impactful results will be discussed in the next section: a) the 30-years old and continuing anti-littering campaign, “Don’t mess with Texas: Keeping Texas Litter Free,” and b) the anti-tobacco use campaign “truth®.”
11
1.1.1.1 The Anti-littering Campaign, “Don’t mess with Texas”
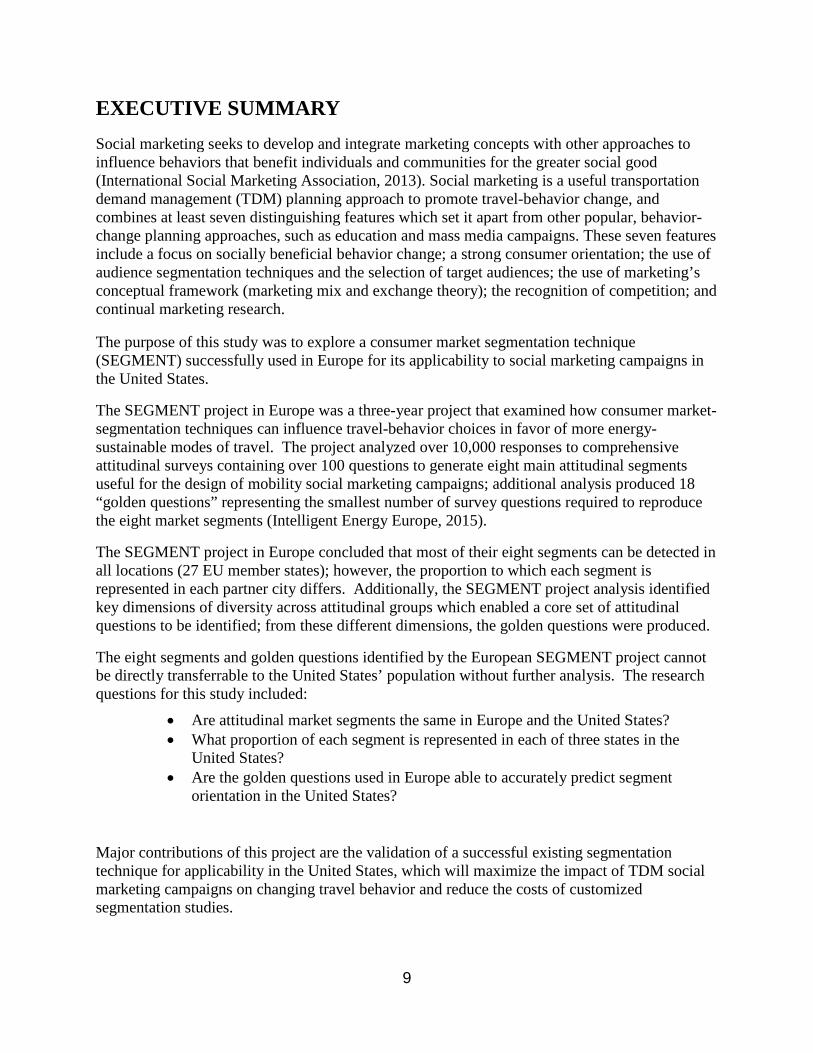
“Don’t mess with Texas” was a collaborative among the Texas Highway Commission, the Texas Department of Transportation (TxDOT) Adopt-A-Highway litter prevention programs, and Keep Texas Beautiful that conducts an annual Trash-Off day.
The campaign included advertising by well-known Texas celebrities and the placement of “Don’t mess with Texas” trashcans that were made available to businesses and entertainment venues. More recently, celebrities posted anti-litter selfies on their social networks with the red, white, and blue barrels made recognizable by the campaign. The Texas example illustrates a definition of social marketing as, “. . . a proven, evidence-based approach that combines behavioral science and design methodologies to motivate your audience to take action,” (Weinreich Communications, 2016).
While researching the target market, it was discovered that 18- to 35-year-old males were most likely to litter. The behavior was unintentional, and this market group did not recognize that their littering was contributing to the problem. This market segment was found to have a high degree of Texas pride, preferred pickup trucks, loved football, and listened to music while driving. The resulting TV and radio commercials featured celebrity Texans playing music that this group identified with.
One measurable impact of the campaign was the reduction in cost of cleaning the roadways from $2.33 to only $1.90 per Texan (Smith, 2016).
1.1.1.2 The truth® Campaign
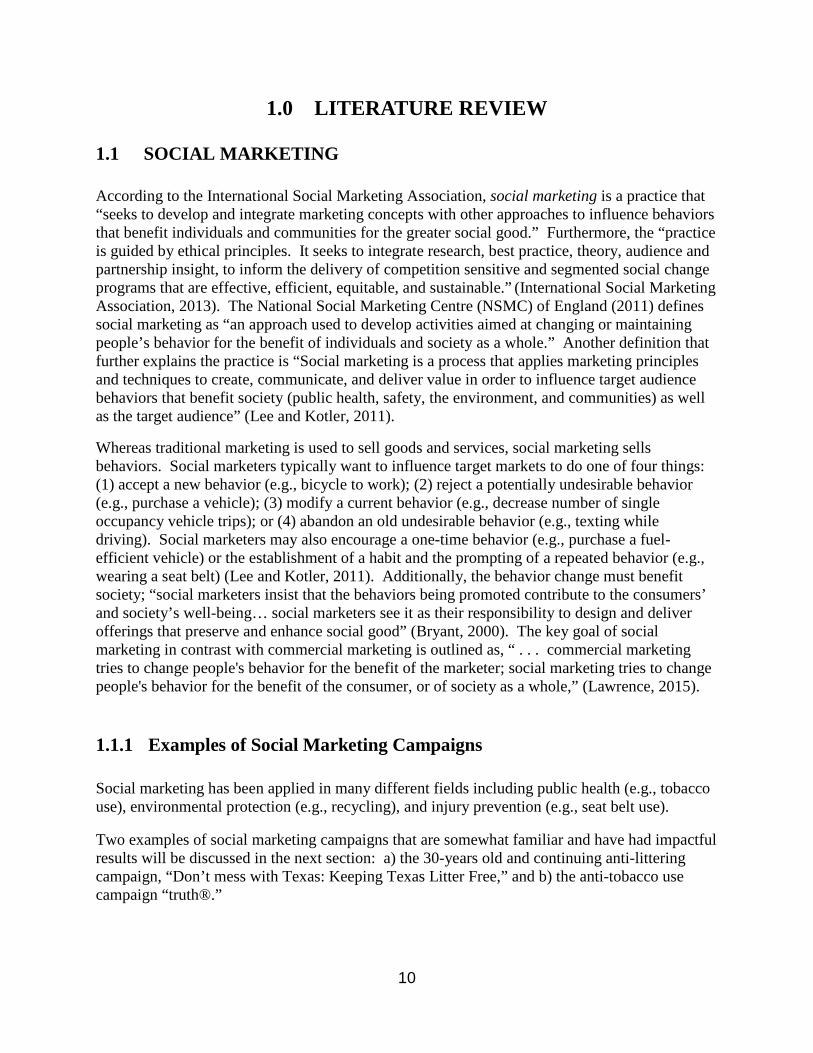
When targeting youth (ages 12 to 17 years old) in the United States for tobacco use prevention from 1999 to 2002, smoking decreased from 25.3% to 18% (300,000 young people), with the American Legacy Truth truth® campaign credited for 22% of that reduction (Farrelly et al., 2002).
Several effective strategies were used in the campaign. The truth® campaign set to reach the younger population by positioning their brand to compete with the tobacco brands (Allen, 2010). The advertising strategy was based on revealing that cigarette manufacturers intentionally lied about what they knew to be cancer-causing elements in their products. The teens were encouraged to rebel against the industry. The campaign focused on altering the core beliefs and attitudes against smoking, swaying the intention to smoke, and decreasing the frequency of smoking.
Figure 1.2: truth® campaign advertisement
Figure 1.1: Don't mess with Texas advertisement

12
Among the many studies that evaluated the truth® campaign, one attributed the increase in anti-tobacco attitudes and beliefs to the counter marketing advertisements (Weinreich, 2016). Another study concluded that using behavioral branding works well as a public health strategy (Evans, 2005).
1.1.2 Distinguishing Features of Social Marketing
Social marketing integrates several distinguishing features, which set it apart from other popular behavior-change planning approaches, such as education and mass media campaigns. These features include:
• a focus on socially beneficial behavior change; • a strong consumer orientation; • the use of audience segmentation techniques and the selection of target audiences; • the use of marketing’s conceptual framework (marketing mix and exchange theory); • the recognition of competition; and • continual marketing research.
Of particular relevance to influencing behavior effectively is the need to segment an audience and target measures accordingly (Davies, 2012). Segmentation refers to dividing a market into groups of customers to develop different products, services, and communications to meet their specific needs, and to focus resources on those segments that have the greatest potential for change. Segmentation can increase the efficiency and effectiveness of social marketing efforts (Andreasen, 2002; Kotler and Lee, 2008; McLeay and Oglethorpe, 2013), and several studies have shown that not only do distinct market segments exist within social contexts, but they have differential responses to social marketing programs (Gray and Bean, 2011; Schuster, Kubacki, and Rundle-Thiele, 2015; Walsh et al., 2010).
13
1.2 MARKET SEGMENTATION
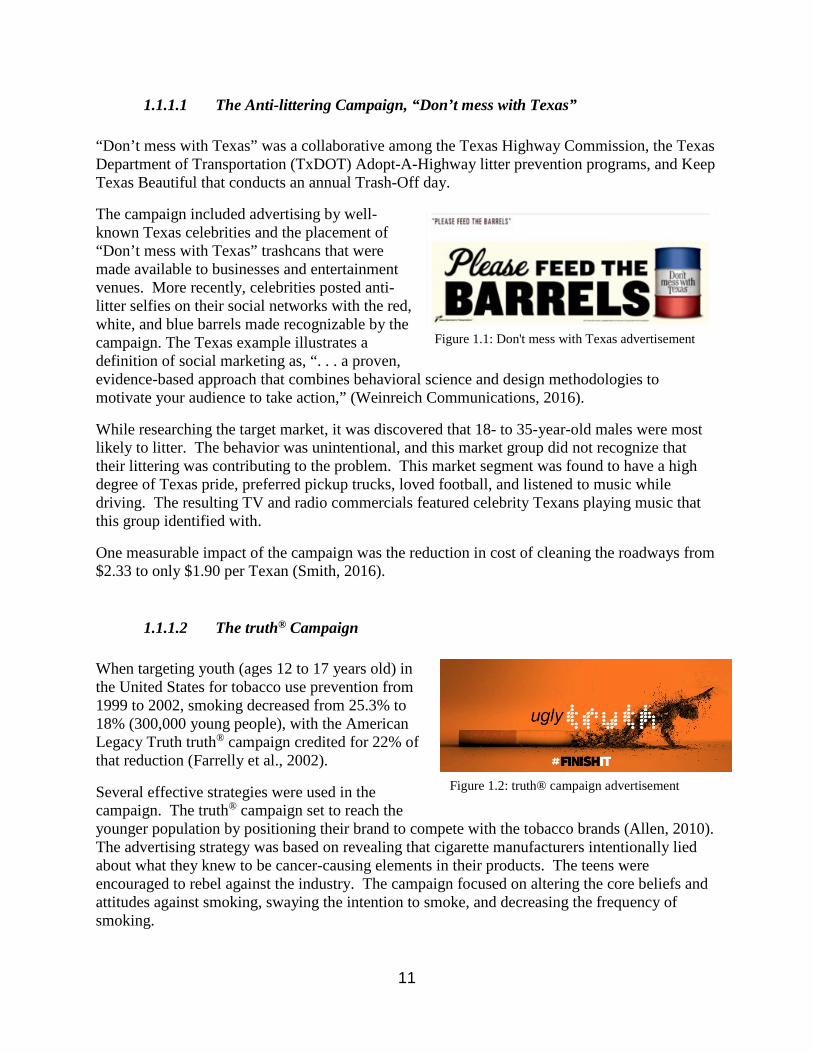
Market segmentation approaches prioritize groups of consumers based on similarities such as demographic, geographical, behavioral, and psychographic characteristics. Figure 1.3 depicts the various characteristics that may be used to segment audiences. For example, groups may be segmented based on a behavioral trait such as their readiness to change stage: “I've been trying to use my seat belt, but I just keep forgetting” versus “I am never going to use that darn thing, it's a nuisance.” Often a segment will be based on a combination of these factors.
Figure 1.3: Market segmentation approaches
Branded segmentation techniques include Values, Attitudes, Life Style (VALSTM), and Potential Rating Index by ZIP market (PRIZM®).
1.2.1 Values, Attitudes, Life Style (VALSTM)
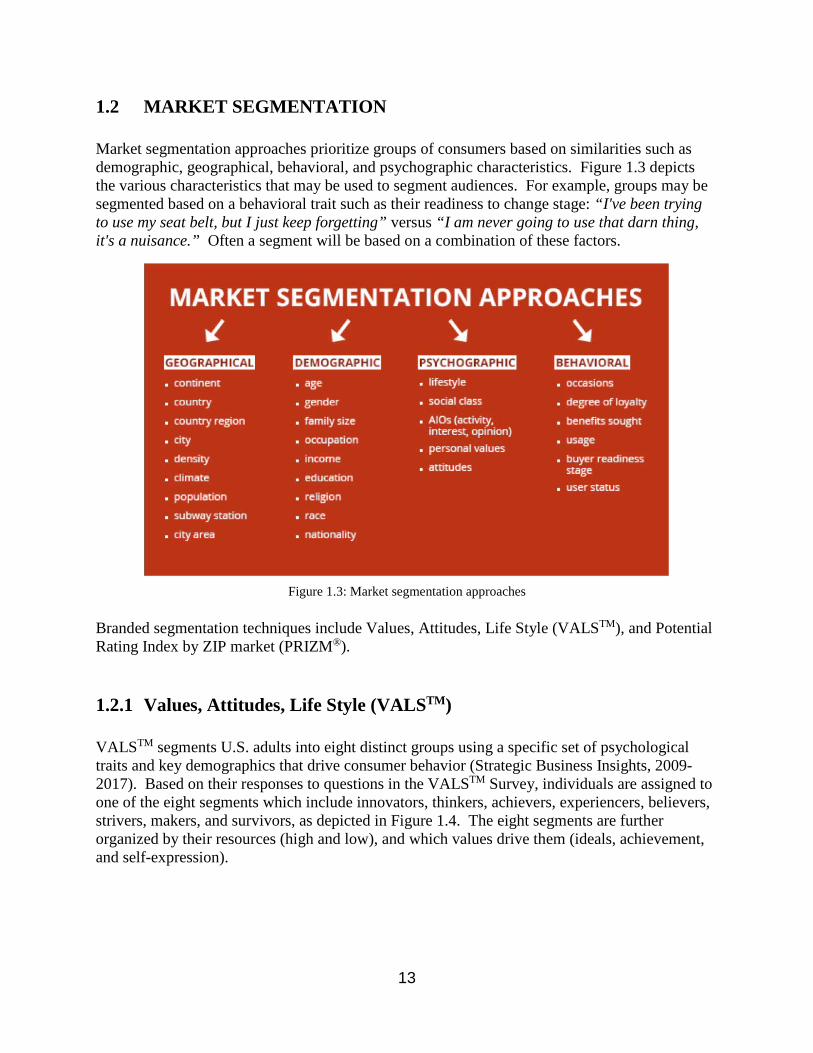
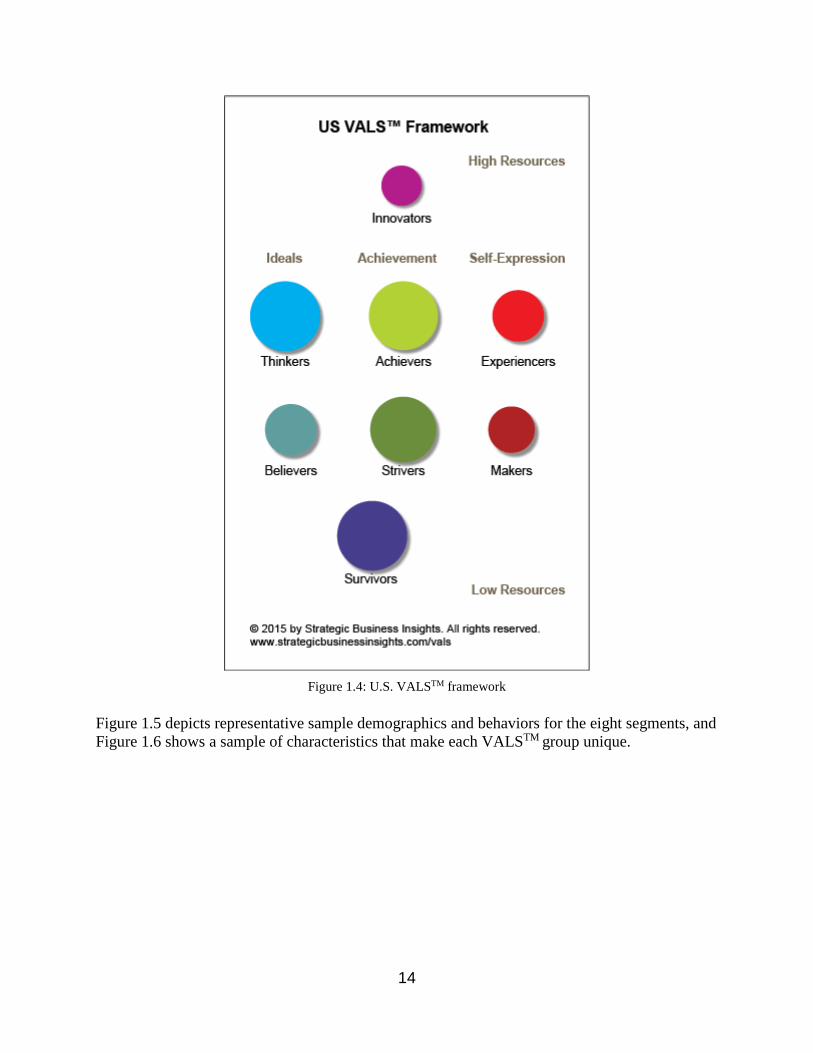
VALSTM segments U.S. adults into eight distinct groups using a specific set of psychological traits and key demographics that drive consumer behavior (Strategic Business Insights, 2009-2017). Based on their responses to questions in the VALSTM Survey, individuals are assigned to one of the eight segments which include innovators, thinkers, achievers, experiencers, believers, strivers, makers, and survivors, as depicted in Figure 1.4. The eight segments are further organized by their resources (high and low), and which values drive them (ideals, achievement, and self-expression).
14
Figure 1.4: U.S. VALSTM framework
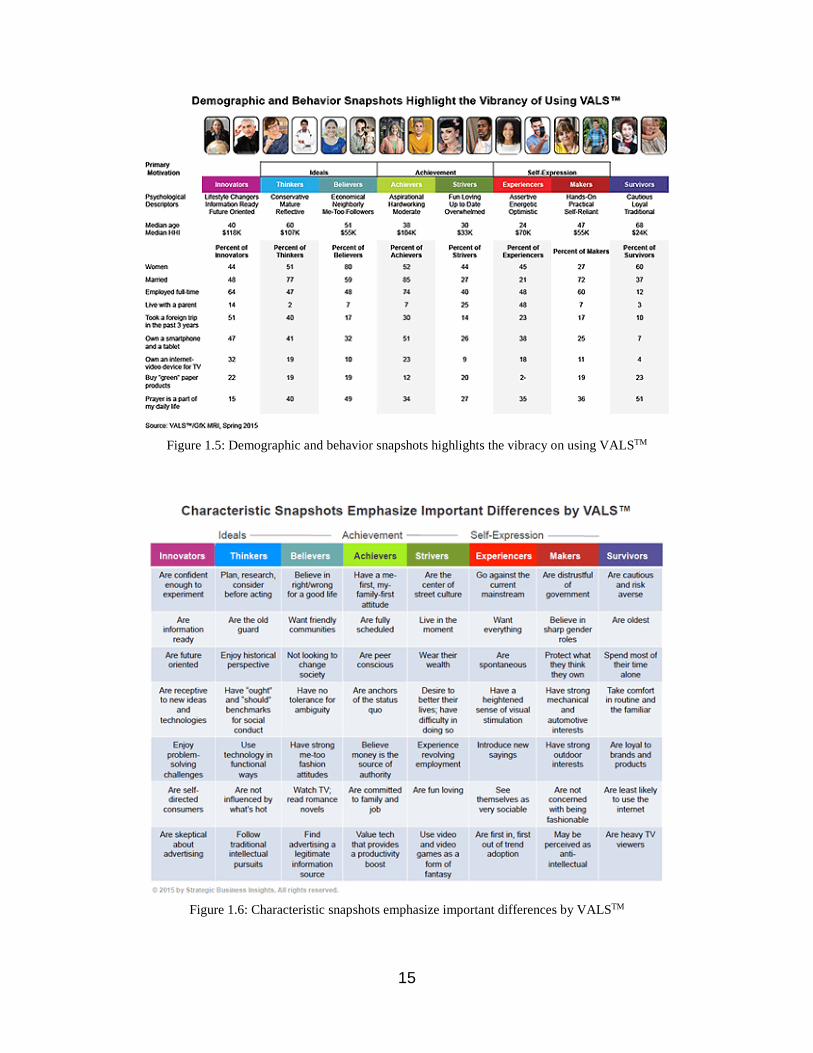
Figure 1.5 depicts representative sample demographics and behaviors for the eight segments, and Figure 1.6 shows a sample of characteristics that make each VALSTM group unique.
15
Figure 1.5: Demographic and behavior snapshots highlights the vibracy on using VALSTM
Figure 1.6: Characteristic snapshots emphasize important differences by VALSTM

16
1.2.2 Potential Rating Index by ZIP market (PRIZM®)
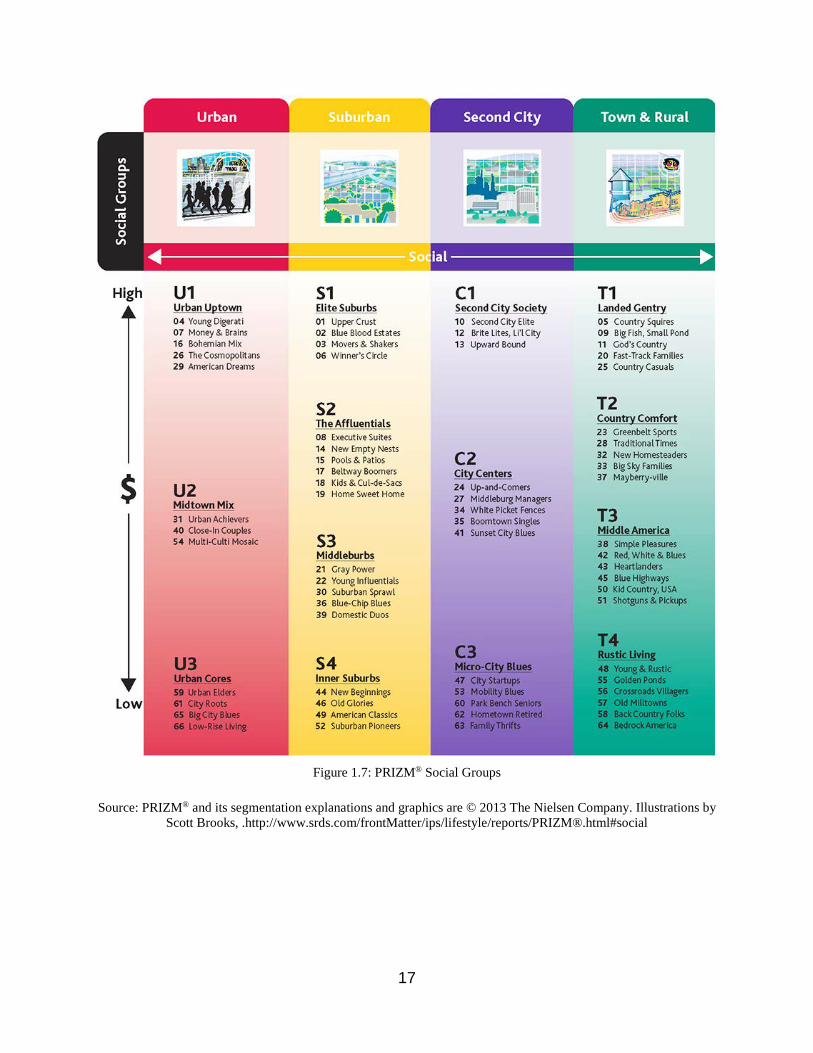
Often viewed as the leading segmentation tool, Nielson-Claritas’ PRIZM® combines demographic, consumer behavior, and geographic data to target customers. PRIZM® was developed assuming that similar households group naturally by geography. Using census data, PRIZM® groups U.S. households into 66 demographically and behaviorally distinct segments, (Nielson PRIZM®). Figure 1.7 lists the 66 segments grouped in 14 social groups with brief definitions in Table 1.1. Figure 1.8 lists the 66 segments grouped in 12 life stage classes with brief definitions in Table 1.2.
17
Figure 1.7: PRIZM® Social Groups
Source: PRIZM® and its segmentation explanations and graphics are © 2013 The Nielsen Company. Illustrations by Scott Brooks, .http://www.srds.com/frontMatter/ips/lifestyle/reports/PRIZM®.html#social
18
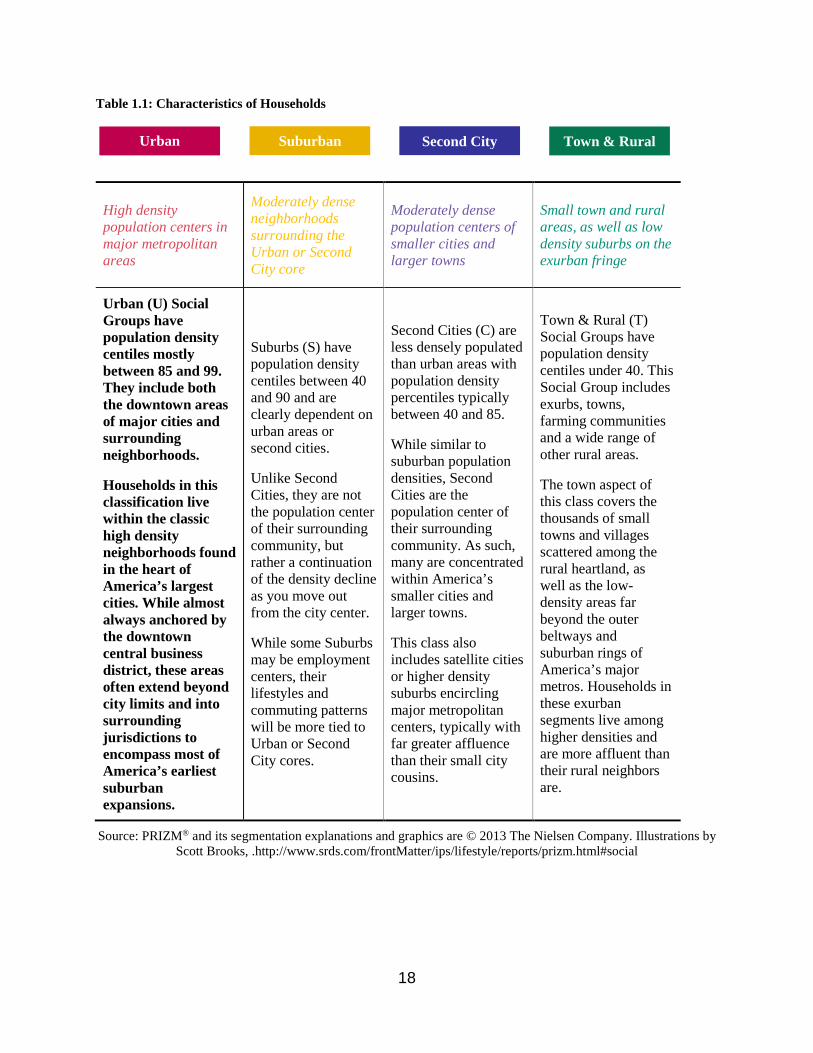
Table 1.1: Characteristics of Households
High density population centers in major metropolitan areas
Moderately dense neighborhoods surrounding the Urban or Second City core
Moderately dense population centers of smaller cities and larger towns
Small town and rural areas, as well as low density suburbs on the exurban fringe
Urban (U) Social Groups have population density centiles mostly between 85 and 99. They include both the downtown areas of major cities and surrounding neighborhoods.
Households in this classification live within the classic high density neighborhoods found in the heart of America’s largest cities. While almost always anchored by the downtown central business district, these areas often extend beyond city limits and into surrounding jurisdictions to encompass most of America’s earliest suburban expansions.
Suburbs (S) have population density centiles between 40 and 90 and are clearly dependent on urban areas or second cities.
Unlike Second Cities, they are not the population center of their surrounding community, but rather a continuation of the density decline as you move out from the city center.
While some Suburbs may be employment centers, their lifestyles and commuting patterns will be more tied to Urban or Second City cores.
Second Cities (C) are less densely populated than urban areas with population density percentiles typically between 40 and 85.
While similar to suburban population densities, Second Cities are the population center of their surrounding community. As such, many are concentrated within America’s smaller cities and larger towns.
This class also includes satellite cities or higher density suburbs encircling major metropolitan centers, typically with far greater affluence than their small city cousins.
Town & Rural (T) Social Groups have population density centiles under 40. This Social Group includes exurbs, towns, farming communities and a wide range of other rural areas.
The town aspect of this class covers the thousands of small towns and villages scattered among the rural heartland, as well as the low-density areas far beyond the outer beltways and suburban rings of America’s major metros. Households in these exurban segments live among higher densities and are more affluent than their rural neighbors are.
Source: PRIZM® and its segmentation explanations and graphics are © 2013 The Nielsen Company. Illustrations by Scott Brooks, .http://www.srds.com/frontMatter/ips/lifestyle/reports/prizm.html#social
Urban Suburban Second City Town & Rural
19
Figure 1.8: PRIZM® Lifestage Group
Source: PRIZM® and its segmentation explanations and graphics are © 2013 The Nielsen Company. Illustrations by Scott Brooks, .http://www.srds.com/frontMatter/ips/lifestyle/reports/prizm.html#social

20
Table 1.2:Characteristics of Life Stage Groups
Predominantly under age 45, singles and couples mostly without children
Predominantly middle-aged families with children in the household
Predominantly age 55 and above, empty-nest couples and mature singles
Segments in Younger Years (Y) consist of mostly singles and couples who are typically under 45 years old and generally have no children in the household. Residents may be too young to have children and/or are approaching middle age and choose not to have them.
At the household level, around age 45 is the cutoff for most segments. Among these younger segments, only those explicit in their definition for lack of children or with low indices for presence of children, tend to be included in Younger Years.
Family Life (F) is composed of segments that are middle-aged and either defined by presence of children in the household or have high indices for households with children under age 18. They may be married couples or single parents.
At the household level, presence of children is the primary driver for many segments in this class. While this class also includes segments where the presence of children is not explicit at the household level, in general they do show high indices for that characteristic.
Mature Years (M) includes segments whose residents are primarily empty nesters or those with children in their late teens, away at college, or rebounding back to mom and dad’s home.
At the household level, the primary driver is age, not necessarily the absence of children. Segments that are uniquely child-centered tend to be younger and are grouped under Family Years while those under age 45 and without children are grouped in Younger Years—leaving the last group of segments for the Mature Years.
Source: PRIZM® and its segmentation explanations and graphics are © 2013 The Nielsen Company. Illustrations by Scott Brooks, .http://www.srds.com/frontMatter/ips/lifestyle/reports/prizm.html#social
1.2.3 Examples of Transportation Market Segmentation
Several transportation organizations have used segmentation approaches to differentiate groups of users based on their personal travel behaviors and characteristics.
1.2.3.1 Cycling Behavior
According to Roger Geller, the Bicycle Coordinator at the Portland Bureau of Transportation (2006), the following are categories that describe Portlanders and their relationships to bicycling:
• The “Strong and the Fearless” bicycled in Portland regardless of roadway conditions.
Younger Years Family Life Mature Years

21
• The “Enthused and Confident” were those comfortable sharing the roadway with auto traffic; however, they appreciated bicycle lanes and bicycle boulevards.
• The “Interested but Concerned” were those who are interested but had concerns about safety on the traffic network.
• The “No Way, No How” group were just not interested in bicycling. Geller divided Portlanders into these groups to better understand the recipients of bikeway treatments. A further investigation of these market segments offered better understanding of the demographics of each as well as attitudes and perceptions to the physical environment and to social and personal factors (Dill and McNiel, 2013).
1.2.3.2 Mode Choice Behavior
In order to assess mode choice, eight market segments in the European Segment project were identified based on distinct psychographic groups (Anable, 2013). Segmentation was achieved based on behaviors and reactions to marketing messages and specific transportation initiatives. The eight market segments were:
• “Devoted Drivers” were not convinced that other modes are realistic alternatives and therefore primarily used their cars for travel.
• “Image Improvers” did not want any restrictions on driving, nonetheless somewhat concerned for the environment.
• “Malcontented Motorists” found driving stressful and desired the reduction of car use, but found the alternatives not practical for their travel needs.
• “Active Aspirers” were motivated by environmental awareness, and prefer walking and cycling to public transportation in short trips when trying to reduce car use.
• “Practical Travelers” used cars for efficiency and practicality and had little tendency to change their habits.
• “Car Contemplators” aspired to be car owners, desiring the freedom and independence driving offers.
• “Public Transport Dependents” were not anti-car mode, had little interest in environmental issues, and were frustrated with transit service.
• “Car-free Choosers” were conscientiously using healthy modes of transportation and deeply concerned about environmental issues.
The research by Anable confirmed that in-depth segmentation in travel behavior could be effectively used in developing transportation policies.
1.2.3.3 Public Transportation
In addition to on-time performance, basic concerns of transit agencies are maintaining ridership numbers and attracting new riders to public transportation. New transit services (e.g., wi-fi on buses/trains or trip planning) have been implemented in many agencies to promote transit use to new riders and improve customer satisfaction. If the current or potential transit rider is not a user of these technologies, promoting these services does not affect their choices. Understanding the rider has been very important in planning and managing transit.
22
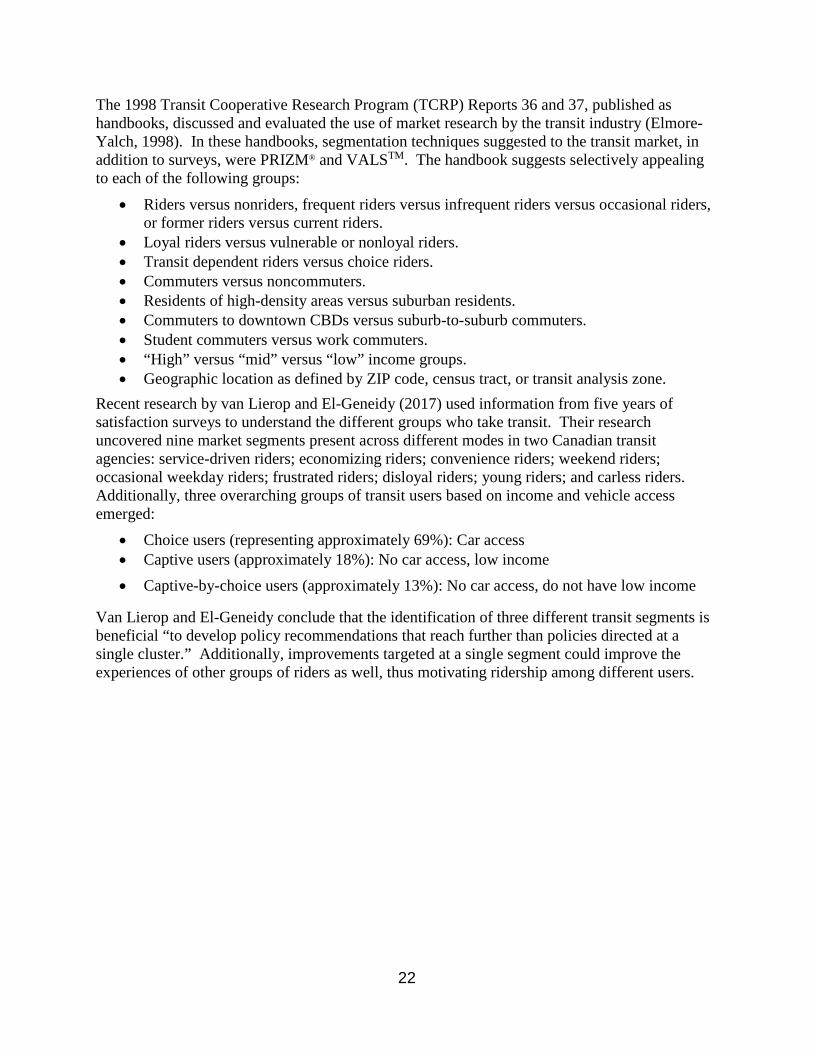
The 1998 Transit Cooperative Research Program (TCRP) Reports 36 and 37, published as handbooks, discussed and evaluated the use of market research by the transit industry (Elmore-Yalch, 1998). In these handbooks, segmentation techniques suggested to the transit market, in addition to surveys, were PRIZM® and VALSTM. The handbook suggests selectively appealing to each of the following groups:
• Riders versus nonriders, frequent riders versus infrequent riders versus occasional riders, or former riders versus current riders.
• Loyal riders versus vulnerable or nonloyal riders. • Transit dependent riders versus choice riders. • Commuters versus noncommuters. • Residents of high-density areas versus suburban residents. • Commuters to downtown CBDs versus suburb-to-suburb commuters. • Student commuters versus work commuters. • “High” versus “mid” versus “low” income groups. • Geographic location as defined by ZIP code, census tract, or transit analysis zone.
Recent research by van Lierop and El-Geneidy (2017) used information from five years of satisfaction surveys to understand the different groups who take transit. Their research uncovered nine market segments present across different modes in two Canadian transit agencies: service-driven riders; economizing riders; convenience riders; weekend riders; occasional weekday riders; frustrated riders; disloyal riders; young riders; and carless riders. Additionally, three overarching groups of transit users based on income and vehicle access emerged:
• Choice users (representing approximately 69%): Car access • Captive users (approximately 18%): No car access, low income • Captive-by-choice users (approximately 13%): No car access, do not have low income
Van Lierop and El-Geneidy conclude that the identification of three different transit segments is beneficial “to develop policy recommendations that reach further than policies directed at a single cluster.” Additionally, improvements targeted at a single segment could improve the experiences of other groups of riders as well, thus motivating ridership among different users.
23
1.3 TRANSPORTATION DEMAND MANAGEMENT
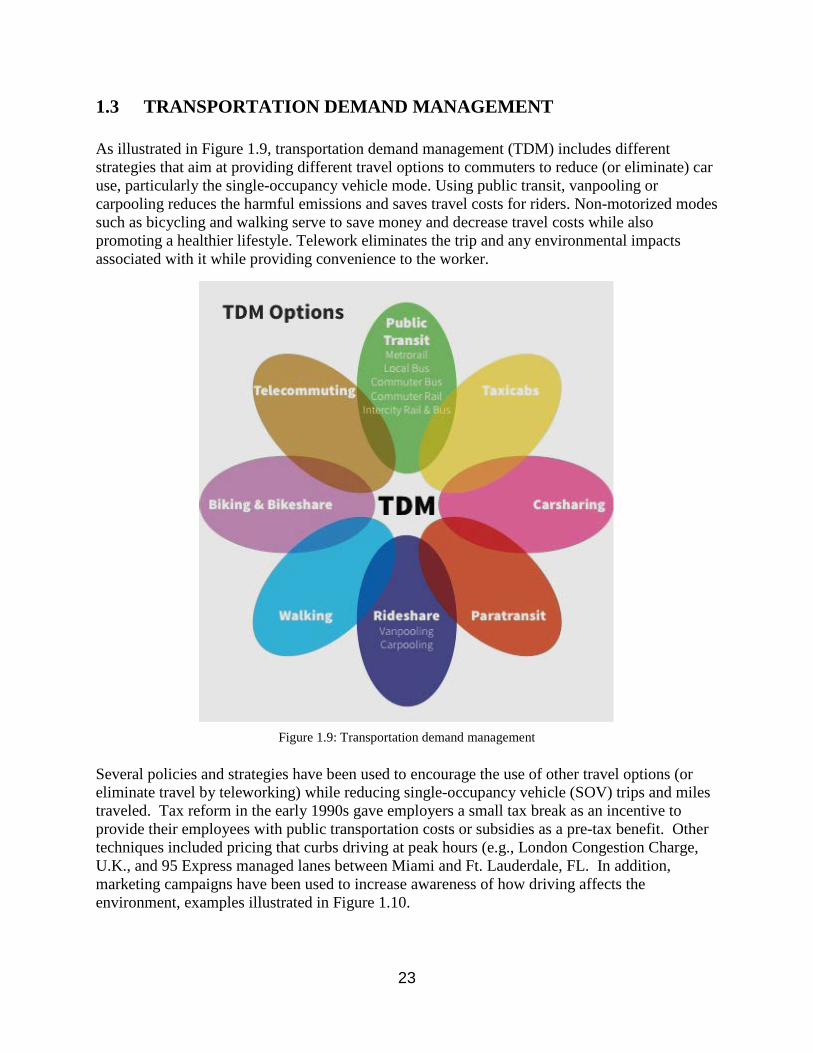
As illustrated in Figure 1.9, transportation demand management (TDM) includes different strategies that aim at providing different travel options to commuters to reduce (or eliminate) car use, particularly the single-occupancy vehicle mode. Using public transit, vanpooling or carpooling reduces the harmful emissions and saves travel costs for riders. Non-motorized modes such as bicycling and walking serve to save money and decrease travel costs while also promoting a healthier lifestyle. Telework eliminates the trip and any environmental impacts associated with it while providing convenience to the worker.
Figure 1.9: Transportation demand management
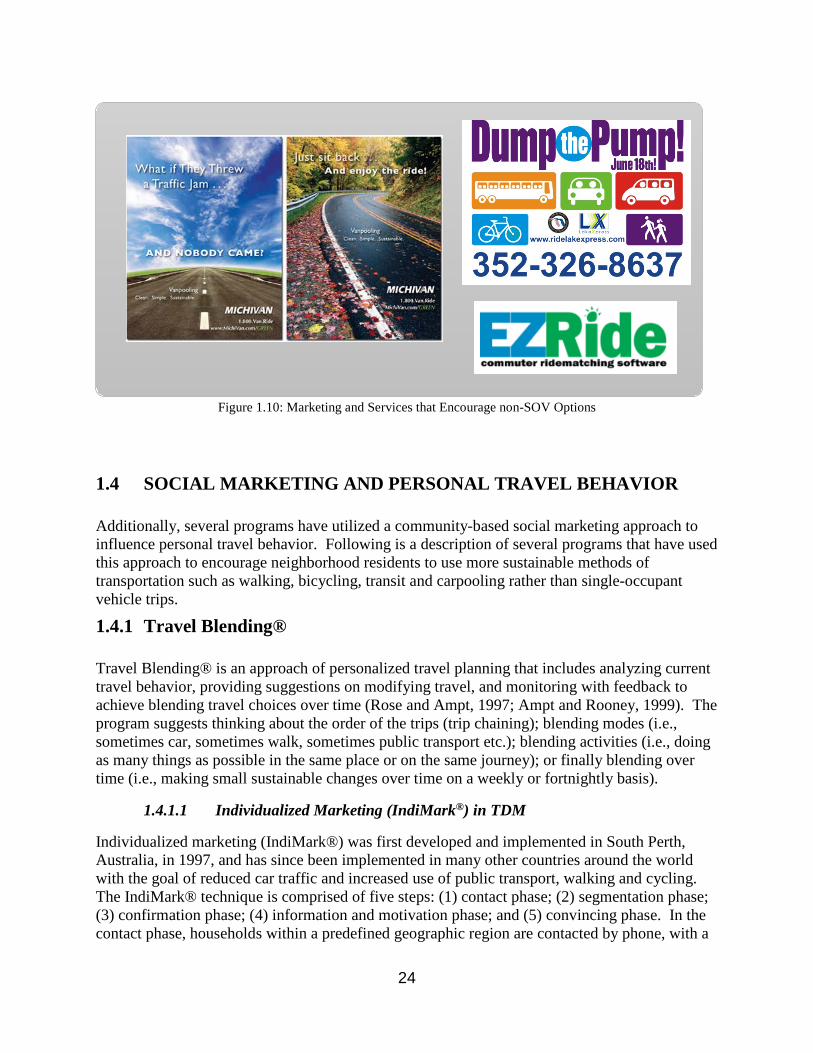
Several policies and strategies have been used to encourage the use of other travel options (or eliminate travel by teleworking) while reducing single-occupancy vehicle (SOV) trips and miles traveled. Tax reform in the early 1990s gave employers a small tax break as an incentive to provide their employees with public transportation costs or subsidies as a pre-tax benefit. Other techniques included pricing that curbs driving at peak hours (e.g., London Congestion Charge, U.K., and 95 Express managed lanes between Miami and Ft. Lauderdale, FL. In addition, marketing campaigns have been used to increase awareness of how driving affects the environment, examples illustrated in Figure 1.10.
24
Figure 1.10: Marketing and Services that Encourage non-SOV Options
1.4 SOCIAL MARKETING AND PERSONAL TRAVEL BEHAVIOR
Additionally, several programs have utilized a community-based social marketing approach to influence personal travel behavior. Following is a description of several programs that have used this approach to encourage neighborhood residents to use more sustainable methods of transportation such as walking, bicycling, transit and carpooling rather than single-occupant vehicle trips.
1.4.1 Travel Blending®
Travel Blending® is an approach of personalized travel planning that includes analyzing current travel behavior, providing suggestions on modifying travel, and monitoring with feedback to achieve blending travel choices over time (Rose and Ampt, 1997; Ampt and Rooney, 1999). The program suggests thinking about the order of the trips (trip chaining); blending modes (i.e., sometimes car, sometimes walk, sometimes public transport etc.); blending activities (i.e., doing as many things as possible in the same place or on the same journey); or finally blending over time (i.e., making small sustainable changes over time on a weekly or fortnightly basis).
1.4.1.1 Individualized Marketing (IndiMark®) in TDM
Individualized marketing (IndiMark®) was first developed and implemented in South Perth, Australia, in 1997, and has since been implemented in many other countries around the world with the goal of reduced car traffic and increased use of public transport, walking and cycling. The IndiMark® technique is comprised of five steps: (1) contact phase; (2) segmentation phase; (3) confirmation phase; (4) information and motivation phase; and (5) convincing phase. In the contact phase, households within a predefined geographic region are contacted by phone, with a
25
goal of direct contact with every member of the target population. The target population serves as the intervention group while a completely separate group acts as the control group. This differentiates IndiMark® from Travel Blending®, as IndiMark® considers all contacted households as exposed to the intervention, regardless if they participate in the program; in doing so, the reporting of behavior change represents whole communities. During the segmentation phase, households are segmented into several broad categories in order to determine the type of treatment they receive: regular user (“R”) of environmentally friendly mode, interested (“I”) in using environmentally friendly mode, and not interested (”N”) in using environmentally friendly mode. Households identified as not interested receive no further contact. Households identified as regular users move to the confirmation phase, which rewards households with at least one member who regularly walks, bikes, or uses public transport with a small gift. Households identified as interested move to the information and motivation phase, which provides an opportunity for residents to order information and services (e.g., generic information brochures, personalized documents, test tickets for the public transport network), and provides them with support and encouragement (verbal support, advice and comments). Finally, further services for walking, cycling and public transport are offered through home visits during the convincing phase.
The program evaluation is based primarily on before-and-after mail travel surveys of the intervention and control households, which asked respondents about activities during the day prior. Additionally, analysis of public transport electronic ticketing information on services operating in the area subject to the intervention is conducted. The IndiMark® large-scale demonstration project in South Perth (1997) decreased car trips by 14%, increased walking by 35%, increased cycling by 61%, and increased public transport by 17%. Additionally, the average reduction in individual car trips across the target populations of all IndiMark® programs (i.e., South Perth and Brisbane, Australia; Portland, U.S.; Goteburg, Sweden; Gloucester, UK; etc.) conducted between 1997 and 2002 was about 10%, with a range of 6% to 14% for specific interventions, which equates to a 5.5% to 13% reduction across the entire population (Roth et al., 2003).
1.4.1.2 TravelSmart Australia
The TravelSmart Household Program (TSHP) is a component of Australia’s larger TravelSmart program following the successful application of individualized marketing (IndiMark®) in South Perth in 2000. The TravelSmart program encourages and supports residents at the household level to voluntarily change their travel behavior from car use to more environmentally friendly ways of traveling by motivating and providing personalized information on public transport, walking and bicycling. The specific aims of the project are to reduce private car use through behavior change, measured by vehicle kilometers travelled (VKT); achieve ongoing change in travel behavior; engage individuals on a voluntary basis; directly engage people within their own settings and cultural context, capturing interest across all social-demographics; provide simple, motivation tools and techniques addressing individuals’ most significant barriers to behavior change; build strong partnerships with key stakeholder; integrate continuous improvement into project delivery; and independently measure behavior change results using statistically valid methods.
For each implementation of this program (Inner North, West Torrens, West), a large, geographically diverse area is selected to serve as the target market. The most current version of
26
the project is the TSHP in the West, which is described in this section. Prior to project delivery, a study of community perceptions about private car use and more sustainable travel options was undertaken to identify perceived barriers and benefits of reducing car use and making alternative choices such as public transport, walking, and cycling. For example, the project in the West identified benefits such as money, petrol reduction, environment, and health/physical activity, and barriers such as time, work commitments, inconvenience, and lack of connectivity. These findings influence the design of the project and the supporting tools, which enable a more strategic approach targeting the specific concerns of the community.
Residents in the target area are then approached via two components delivered concurrently: a community development approach, and an individualized conversation-based approach using the IndiMark® technique. For the community development approach, community organizations such as clubs, churches, schools, and workplaces are targeted and asked to host a TravelSmart presentation for their members. For the individualized conversation-based approach, households receive a mailed letter introducing them to the program and letting them know they would be contacted soon, as well as giving credibility to the TravelSmart staff who would be contacting them. Households are then contacted by phone or in person and engaged in a guided conversation aided by tools to help them make changes that appealed to them and consistent with their values or motivations. Tools of change include a local activities guide, access guide (map), affirmation letter, kid’s activities, journey planner, promotional postcards, ideas letter, good newsletter, kilometer monitor, shopping list, memory jogger, travel blending diary, and work-from-home information.
TravelSmart Household Project evaluation is based on the use of two measurements: global positioning system (GPS) surveys and vehicle odometer surveys. The primary objectives of the evaluation are to provide data to measure changes in household travel behavior, focusing on travel by private car, and to understand the factors (barriers and benefits) that contribute to travel-behavior choices. The project used longitudinal panels carried out prior to household engagement until after the conclusion of project delivery to collect repeated sets of measurements (“waves”); each wave involved continuous monitoring of all households in the panel for a one-week time period. The panels included participants and non-participants representing test and control groups; the non-participants were chosen at random to be representative of the target area’s population. The GPS survey required all household members to carry a personal passive GPS data logger for one week annually (three waves total), and collected mode of transport, number of trips made, trip duration and distance travelled. The odometer survey required each household to report the odometer readings from all the vehicles they owned every four months (eight waves total).
At the completion of the project, the TSHP in the West reported a reduction of 10.4 kilometers per household per day, representing an 18% reduction. Additionally, the total reduction of VKT per day for all participating households was 229,850 kilometers per day while non-participants increased VKT by 605,030 kilometers.
Finally, a community perceptions survey was undertaken at the completion of the project using the same respondents and survey as the pre-project community perceptions survey. Participants had significantly increased their willingness to reduce car use, and had significantly increased the level of importance they attached to carpooling, doing several things before returning home, and

27
travelling with others to reduce car use. No change of attitude was observed in people who were non-participants (control group).
1.4.1.3 Portland SmartTrips
The Portland, OR, SmartTrips program is modeled on the TravelSmart Australia program and uses direct individualized marketing techniques and community outreach to encourage residents in targeted geographic areas of the city to reduce drive-alone trips and increase walking, biking, transit and carpool trips. The Portland SmartTrips program was piloted in 2003, with the first large-scale project following in 2004; the project has since been implemented every year in a new area of Portland or to a new demographic (e.g., new residents, workplace commuters). Primary goals for the project include: reducing drive-alone trips; reducing vehicle miles driven by area residents, employees and customers; increasing awareness and raising acceptability of all travel modes; increasing walking, biking, transit, carpooling and car sharing trips; increasing neighborhood mobility and livability; and increasing bicycling and walking safety.
Each year in March, every household in a SmartTrips area receives a newsletter with a calendar of nearby walks, clinics and bike rides. The newsletter highlights SmartTrips programs and describes other transportation projects and programs, and how to use the transit agency’s services. The newsletter also alerts residents to an order form that they will receive. Order forms are mailed out in waves each week, and allow residents to order a variety of maps, brochures, tips, and event schedules for every mode of transportation: walking, bicycling, transit, carpool, car sharing, and driving. Residents also choose one incentive with their order: a SmartTrips umbrella, Bandana Bicycle Map, or Transportation Options T-shirt. When residents return an order form, their request is processed and delivered within two weeks; all materials are delivered by bicycle delivery, and arrive in a vinyl tote bag with a personalized luggage tag. Three weeks after the order form is sent, a reminder postcard is mailed to each resident who does not return the order form; the postcard includes the web order form as well as the phone number they can call to receive another mailed order form. At the beginning of May, all residents receive a second newsletter reminding them to order materials and provide information about upcoming events and activities. Three additional newsletters are mailed every two months to everyone who orders materials or attends one or more of the walks and rides.
The program evaluation was based primarily on a random telephone survey of approximately 300 to 600 households in each SmartTrips area with a corresponding control group. Trip diaries from survey participants were also used to capture trip activity for the previous day with calls made over a two-week period. The program has yielded a reduction of 9% to 13% in drive-alone car trips by all area residents with a corresponding increase in walking, bicycling, and transit mode shares in the SmartTrips areas. Approximately 30% of all area residents either ordered materials or participated in a SmartTrips event or activity, and 20% of all households ordered materials.
28
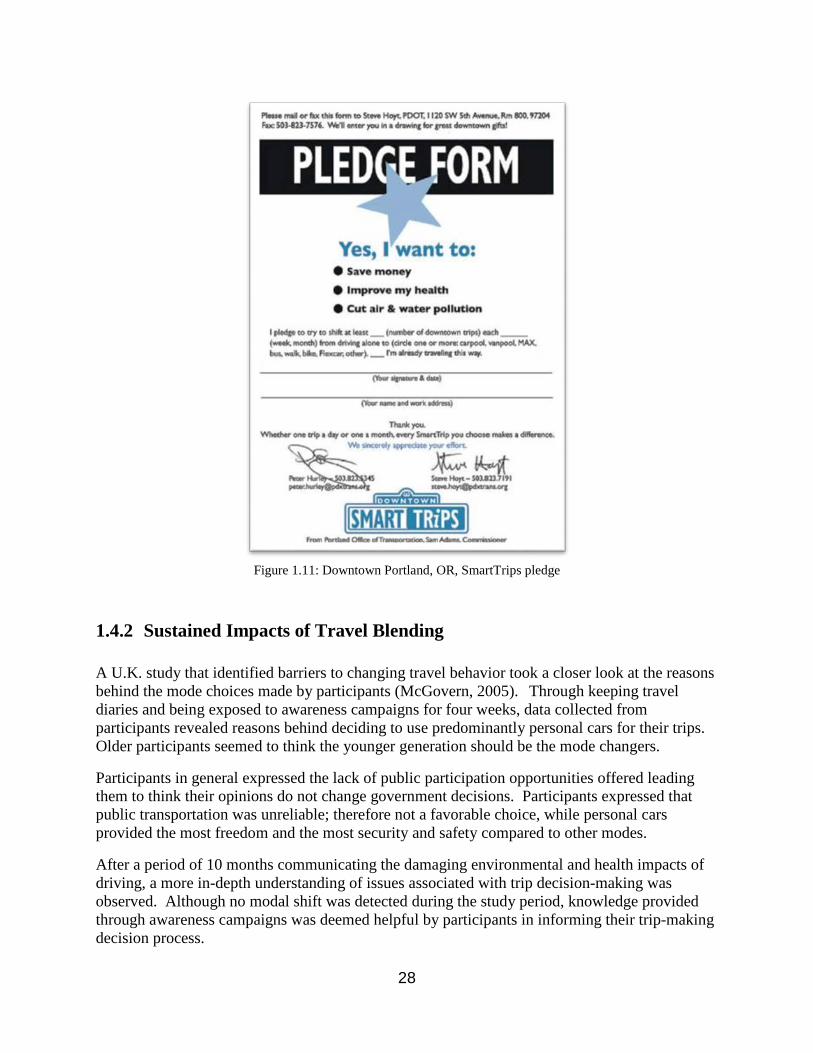
Figure 1.11: Downtown Portland, OR, SmartTrips pledge
1.4.2 Sustained Impacts of Travel Blending
A U.K. study that identified barriers to changing travel behavior took a closer look at the reasons behind the mode choices made by participants (McGovern, 2005). Through keeping travel diaries and being exposed to awareness campaigns for four weeks, data collected from participants revealed reasons behind deciding to use predominantly personal cars for their trips. Older participants seemed to think the younger generation should be the mode changers.
Participants in general expressed the lack of public participation opportunities offered leading them to think their opinions do not change government decisions. Participants expressed that public transportation was unreliable; therefore not a favorable choice, while personal cars provided the most freedom and the most security and safety compared to other modes.
After a period of 10 months communicating the damaging environmental and health impacts of driving, a more in-depth understanding of issues associated with trip decision-making was observed. Although no modal shift was detected during the study period, knowledge provided through awareness campaigns was deemed helpful by participants in informing their trip-making decision process.
29
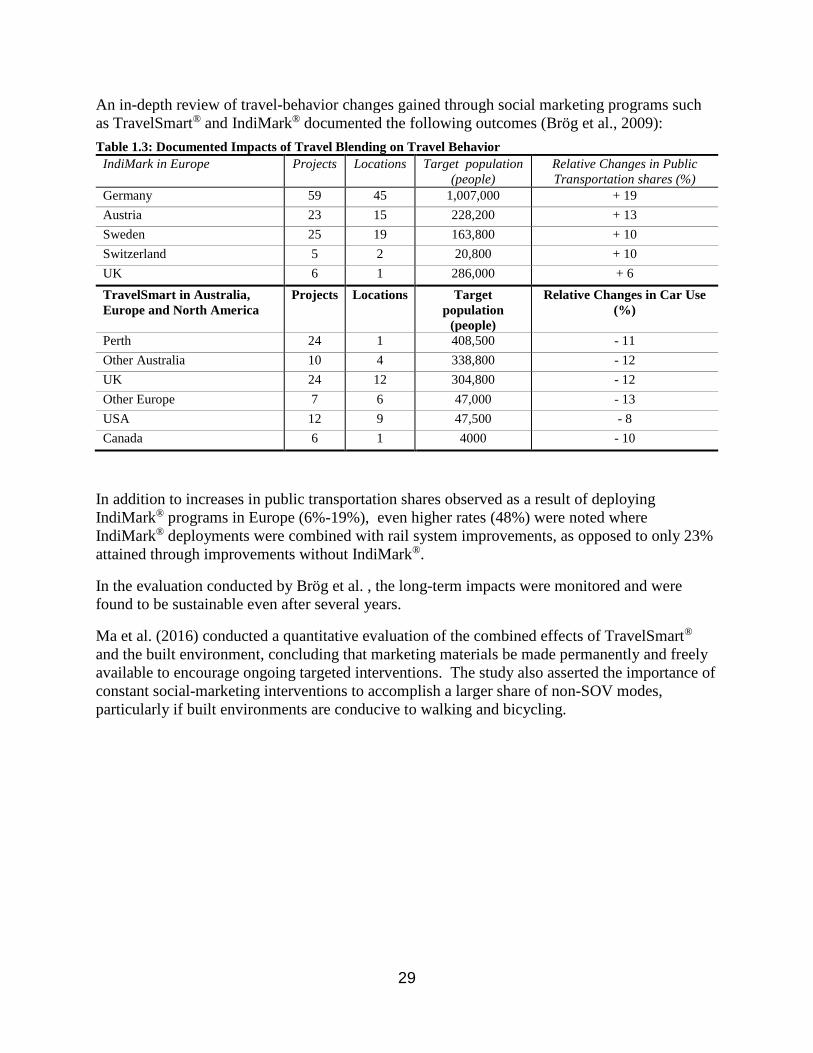
An in-depth review of travel-behavior changes gained through social marketing programs such as TravelSmart® and IndiMark® documented the following outcomes (Brög et al., 2009): Table 1.3: Documented Impacts of Travel Blending on Travel Behavior
IndiMark in Europe Projects Locations Target population (people)
Relative Changes in Public Transportation shares (%)
Germany 59 45 1,007,000 + 19 Austria 23 15 228,200 + 13 Sweden 25 19 163,800 + 10 Switzerland 5 2 20,800 + 10 UK 6 1 286,000 + 6 TravelSmart in Australia, Europe and North America
Projects Locations Target population
(people)
Relative Changes in Car Use (%)
Perth 24 1 408,500 - 11 Other Australia 10 4 338,800 - 12 UK 24 12 304,800 - 12 Other Europe 7 6 47,000 - 13 USA 12 9 47,500 - 8 Canada 6 1 4000 - 10
In addition to increases in public transportation shares observed as a result of deploying IndiMark® programs in Europe (6%-19%), even higher rates (48%) were noted where IndiMark® deployments were combined with rail system improvements, as opposed to only 23% attained through improvements without IndiMark®.
In the evaluation conducted by Brög et al. , the long-term impacts were monitored and were found to be sustainable even after several years.
Ma et al. (2016) conducted a quantitative evaluation of the combined effects of TravelSmart® and the built environment, concluding that marketing materials be made permanently and freely available to encourage ongoing targeted interventions. The study also asserted the importance of constant social-marketing interventions to accomplish a larger share of non-SOV modes, particularly if built environments are conducive to walking and bicycling.

30
2.0 EUROPEAN SEGMENT PROJECT The purpose of this study was to explore a consumer market segmentation technique (SEGMENT) successfully used in Europe for its applicability to social marketing campaigns in the United States.
2.1 THE EUROPEAN SEGMENT PROJECT
The European SEGMENT project has developed a replicable and transferable market segmentation model to be used by all of the EU’s 27 member states when designing social marketing campaigns to persuade people to change their travel behavior via TDM (what European’s call “mobility management”) and adopt more energy-efficient forms of transport (Intelligent Energy Europe, 2015). The SEGMENT project (2015) suggests the following benefits of a segmented approach:
• “The act of thinking about target groups will itself make a different to the way in which mobility management [transportation demand management] campaigns are designed even before any data is collected. The act of thinking about different target groups and their specific needs and lifestyle characteristics will aid the creative dialogue around the initiatives and key messages being developed for the campaign.
• The collection of rich contextual data adds new insightful information to existing knowledge about mobility patterns and public perceptions and motivations.
• The data collected about baseline travel behavior and attitudes – and any subsequent segments – can be a powerful political tool. Survey data is likely to identify a significant minority or even majority of people who are dissatisfied with their current transport options and are likely to respond well to increased provision or incentivizing to change behavior.”
The SEGMENT project analyzed over 10,000 responses to comprehensive attitudinal surveys containing over 100 questions to generate eight main attitudinal segments useful for the design of mobility social marketing campaigns. The eight audience segments include devoted drivers, image improvers, malcontented motorists, active aspirers, practical travelers, car contemplators, public transport dependents, and car-free choosers. Additional analysis produced 18 “golden questions” representing the smallest number of survey questions required to reproduce the eight market segments (Intelligent Energy Europe, 2015). A short list of golden questions is beneficial to quickly and accurately place individuals into differing segments to target messages and strategies, and utilize resources effectively.
The SEGMENT project concluded that most of their eight segments can be detected in all locations (27 EU member states); however, the proportion to which each segment is represented in each partner city differs. Additionally, the SEGMENT project analysis identified key dimensions of diversity across attitudinal groups which enabled a core set of attitudinal questions to be identified; from these different dimensions, the golden questions were produced (see Figure 2.1). The key issues found to discriminate the most between different people and determine the degree to which they are likely to use different modes of transport included:
• Whether or not a person currently has regular use of a car to drive. • How likely a non-car driver is to drive in the next 12 months. • How much driving is enjoyed and is seen to be a route to self-expression.

31
• How much a person sees themselves as a cyclist, bus user or pedestrian. • How much cycling, walking or bus use is enjoyed. • How much a person feels they should walk of cycle to keep fit.
Figure 2.1: The SEGMENT project golden questions
Q1 Have you driven a car or van in the past 12 months?
Q2: For most journeys, I would rather use the car than any other form of transport
Q3: I like to drive just for the fun of it
Q4: I am not interested in reducing my car use
Q5: Driving gives me a way to express myself
[strongly disagree; disagree; neither/nor; agree; strongly agree]
Q6: How likely are you to drive in the next 12 months?
[very unlikely; quite unlikely; neither/nor; fairly likely; very
likely]
Yes No
Q7: I am not the kind of person who rides a bicycle
Q8: I feel I should cycle more to keep fit
Q9: I find cycling stressful
Q10: Cycling can be the quickest way to travel around
Q11: I like travelling by bicycle
Q12: I am not the kind of person that likes to walk a lot
Q13: I feel I should walk more to keep fit
Q14: I like travelling by walking Q15: I am not the kind of person to use the bus
Q16: In general, I would rather cycle than use the bus
Q17: I feel a moral obligation to reduce my emissions of greenhouse gases
Q18: People should be allowed to use their cars as much as they like
[strongly disagree; disagree; neither/nor; agree; strongly agree]
32
2.1.1 SEGMENT Profiles
The SEGMENT project generated eight attitudinal segments listed below excerpted from Anable and Wright (2013 Annex 2).
1. “Devoted Drivers” were not convinced that other modes are realistic alternatives and therefore primarily used their cars for travel.
2. “Image Improvers” did not want any restrictions on driving, nonetheless somewhat concerned for the environment.
3. “Malcontented Motorists” found driving stressful and desired the reduction of car use, but found the alternatives not practical for their travel needs.
4. “Active Aspirers” were motivated by environmental awareness, and prefer walking and cycling to public transportation in short trips when trying to reduce car use.
5. “Practical Travelers” used cars for efficiency and practicality and had little tendency to change their habits.
6. “Car Contemplators” aspired to be car owners, desiring the freedom and independence driving offers.
7. “Public Transport Dependents” were not anti-car mode, had little interest in environmental issues, and were frustrated with transit service.
8. “Car-free Choosers” were conscientiously using healthy modes of transportation and deeply concerned about environmental issues.
2.1.2 SEGMENT Case Examples
Case studies that document the SEGMENT project can be found at http://www.eltis.org/discover/case-studies

33
3.0 METHODOLOGY
3.1 SURVEY DESIGN
The study utilized the same set of survey questions used by the European SEGMENT project. These questions came from the Health Care Facilities Questionnaire (Appendix A) conducted in London Borough of Hounslow (London Borough of Hounslow, 2011), adjusted for differences in the two metric systems. A major difference between this study and the European SEGMENT project is that to determine drivers/non-drivers for this study, respondents were asked how frequently they have driven a car/truck/van in the past 12 months (instead of asking “Have you driven in the past 12 months?”). Respondents who have driven less than one day per week were classified as non-drivers.
Most questions on the survey inquired about participants’ attitudes towards different modes of travel and were scored on a Likert scale from 1 to 5 (Strongly Disagree to Strongly Agree). In addition to the European questions, 22 additional questions were added to the survey that were thought would better separate the segments based on U.S. travel patterns (e.g., questions related to Uber/Lyft, telework, etc.). Of those 22 questions, six were given to drivers and the other 16 were given to both drivers and non-drivers. The list of additional questions is presented in Appendix B.
The survey was carried out in Florida, Oregon, and Virginia using panel data from Qualtrics, an online survey company. Participants were required to be 18 years or older, be employed part time or full time, and not have any physical or mental disability that prohibits them from driving/traveling independently. Additionally, quotas were placed on the data to mimic the demographics of commuters in the United States (e.g., age groups and gender).
A total of 2,882 responses were recorded with 1,197 respondents from Florida, 840 respondents from Oregon, and 895 respondents from Virginia. The data consists of 13.2% under 25 years old, 43.3% 25-44 years old, 43.5% over 45, 53% male, and 47% female. Safeguards were applied to protect against counterfeit responses such as response duration. After a soft launch, the median length to complete the survey was 13.9 minutes. Any response that was shorter than one-third of this median length was terminated. Respondents who gave the same answer across all questions were also removed. The filtered data set had 1,889 responses with 248 classified as non-drivers (99 from Florida, 76 from Oregon, and 73 from Virginia) and 1,641 classified as drivers (552 from Florida, 551 from Oregon, and 558 from Virginia).
3.2 METHODOLOGY FOR STATISTICAL ANALYSIS
Two phases of analysis with identical steps and methodologies were carried out. The first phase used only the questions taken from the European questionnaire, and the second phase included the 22 additional questions. By doing this, observations regarding how similar the two populations were in the first phase, and whether the additional questions help better identify the U.S. segments in the second phase, were able to be made.

34
The methodologies applied by Anable and Wright (2013) were followed closely . First, all questions in each group (62/78 questions for non-drivers and 73/90 questions for drivers) were used for clustering analysis to establish the segments. Hierarchical clustering using Wards’ criterion was first applied to observe the structure of the data and to identify the potential numbers of clusters (Murtagh & Legendre, 2014); this was done with method “Ward.D2” in R. To help determine the best number of clusters to obtain stable results, the Dendrogram, the Elbow plot (Ketchen & Shook, 1996), and the AIC/BIC plot were observed. The interpretations of these graphs are summarized in Appendix C for readers without a background in statistics. The AIC/BIC scores were computed as described by Friedman et al. (2001) and plotted against the number of clusters (Friedman, Hastie, & Tibshirani, 2001). Next, the clusters’ mean values obtained from hierarchical clustering was used to initiate the K-means procedure to obtain the final cluster solution. The reason for this second step is that hierarchical clustering using Wards’ criterion does not conserve the space and thus may end up with a suboptimal solution.
Next, linear discriminant analysis was used to obtain a small set of questions, referred to as golden questions, to be used to predict cluster membership. First, a forward stepwise selection algorithm was used to find the variables that separate the clusters the most, based on the Wilk’s Lambda criterion. This was performed by the greedy.wilks function in the R package “klaR.” Next, this set of questions was used as inputs for linear discriminant analysis to produce the discriminant functions, which can be used to predict cluster membership. Finally, the accuracy (test error) of these discriminant functions was calculated by leave-one-out cross validation (Friedman et al., 2001) and state-wise cross validation (fit the model on two out of three states and predict the left-out state).
Lastly, demographic information was calculated for each group.
35
4.0 RESULTS AND FINDINGS
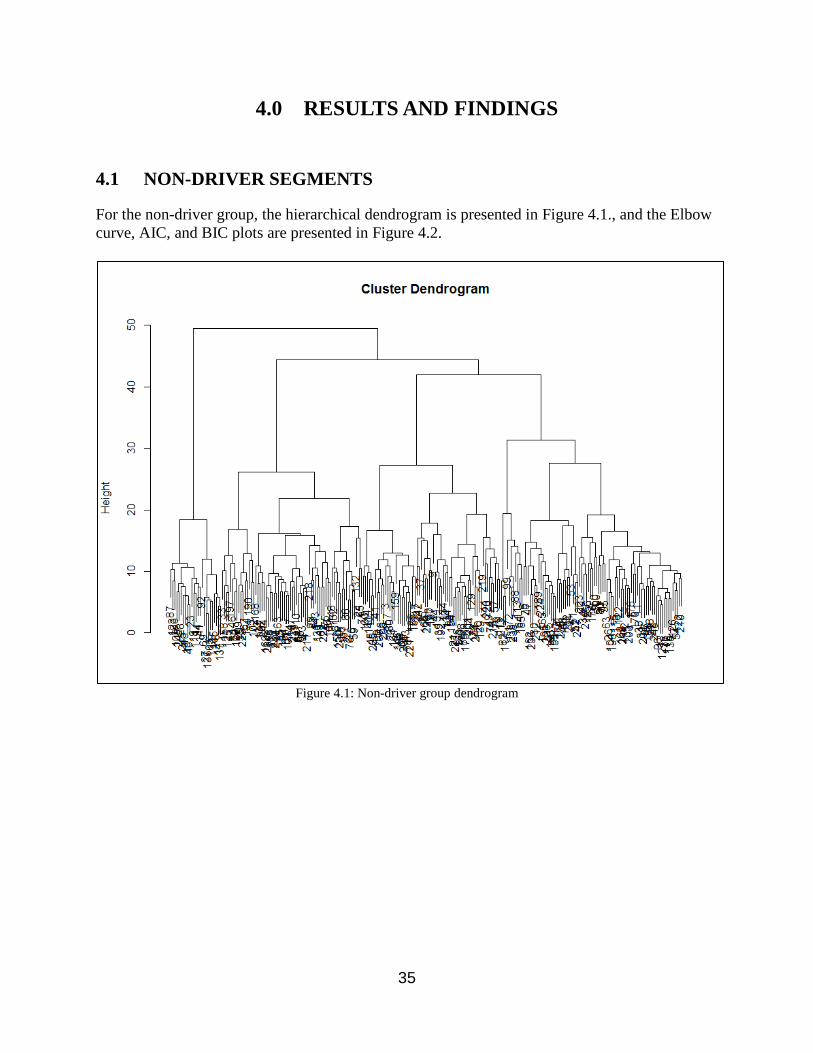
4.1 NON-DRIVER SEGMENTS
For the non-driver group, the hierarchical dendrogram is presented in Figure 4.1., and the Elbow curve, AIC, and BIC plots are presented in Figure 4.2.
Figure 4.1: Non-driver group dendrogram

36
Figure 4.2: Non-driver group Elbow, AIC, and BIC plots
The graphs suggest that the optimal number of clusters is three or four. When observing the average values of responses, it was found that one of these groups responded strongly positively to all questions (about 4 or more on a Likert scale of 1-5). When clustering with five groups, it was found that another group responded strongly negatively to all questions. In reality, it is impossible that anyone would respond positively or negatively to all questions because the questions inquire about both positive and negative attitudes to all modes of transport. Furthermore, these two groups only take small proportions of the sample, 10% and 4%, respectively. Therefore, it was determined that these two groups are not genuine respondents and we removed them from the study. The dendrogram for the purged data is presented in Figure 4.3.

37
Figure 4.3: Non-driver group dendrogram of purged data
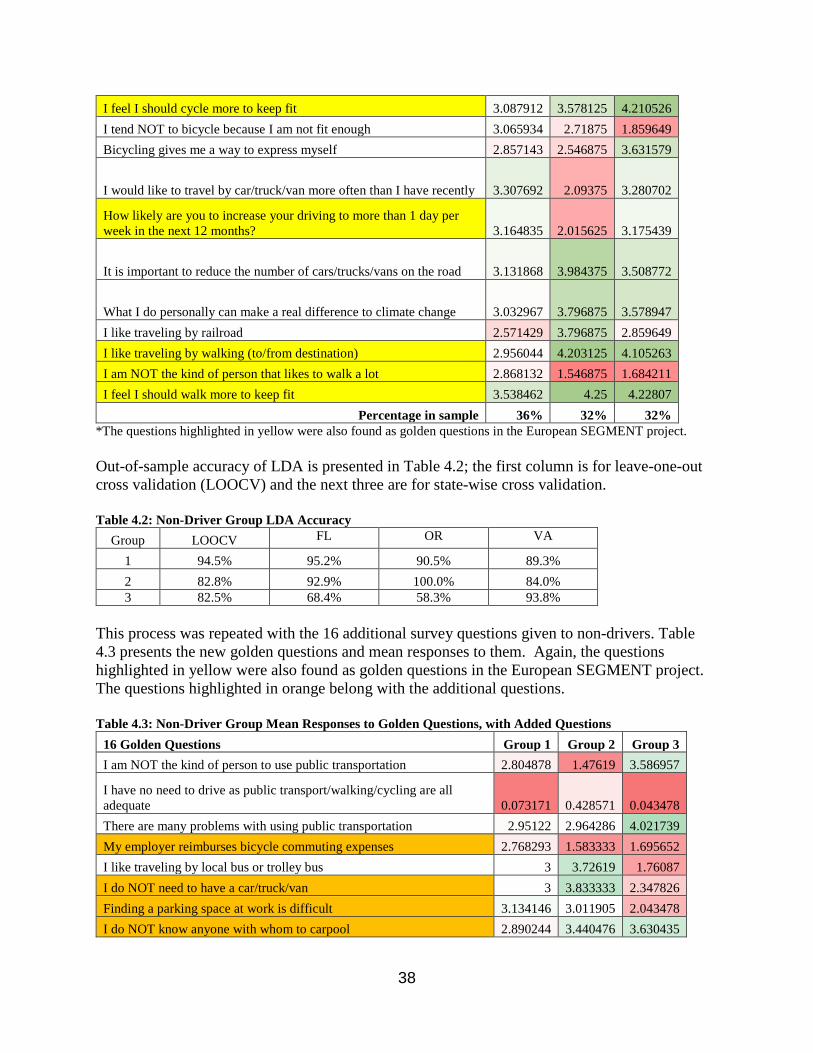
After purging the two uninformative groups, the sample was clustered again with three groups. The sample was split evenly, with 36%, 32%, and 32% of respondents in the three clusters. Linear discriminant analysis (LDA) was then applied to these three clusters. Table 4.1 presents the mean responses of each group to the golden questions. The questions highlighted in yellow were also found as golden questions in the European SEGMENT project. In the following tables, an average answer ranges from 1 (strongly disagree) to 5 (stongly agree). The green and red shading of the cells indicate how close an answer is to 1 (strongly disagree) or 5 (stongly agree); the darker red shade indicates that the answer is closer to 1, and the darker green shade indicates that the answer is closer to 5. White cells indicate that the average score is neutral. For example, in response to the question “I am NOT the kind of person to use public transportation”, Cluster 1 slightly agrees with an average score of 3.25, Cluster 2 strongly disagrees with an average score of 1.39, and Cluster 3 slightly disagrees with an average score of 2.29 as depicted in Table 4.1. Table 4.1: Non-Driver Group Mean Responses to Golden Questions
16 Golden Questions Cluster 1
Cluster 2
Cluster 3
I am NOT the kind of person to use public transportation 3.252747 1.390625 2.298246 I find traveling by public transportation stressful 3.307692 2.3125 3.508772 Public transportation can be the quickest way to get around 2.692308 3.5 2.350877 I am NOT the kind of person who rides a bicycle 3.131868 3.125 1.561404 Bicycling is a very healthy way to travel around 3.483516 4.125 4.298246
38
I feel I should cycle more to keep fit 3.087912 3.578125 4.210526 I tend NOT to bicycle because I am not fit enough 3.065934 2.71875 1.859649 Bicycling gives me a way to express myself 2.857143 2.546875 3.631579
I would like to travel by car/truck/van more often than I have recently 3.307692 2.09375 3.280702
How likely are you to increase your driving to more than 1 day per week in the next 12 months? 3.164835 2.015625 3.175439
It is important to reduce the number of cars/trucks/vans on the road 3.131868 3.984375 3.508772
What I do personally can make a real difference to climate change 3.032967 3.796875 3.578947 I like traveling by railroad 2.571429 3.796875 2.859649 I like traveling by walking (to/from destination) 2.956044 4.203125 4.105263 I am NOT the kind of person that likes to walk a lot 2.868132 1.546875 1.684211 I feel I should walk more to keep fit 3.538462 4.25 4.22807
Percentage in sample 36% 32% 32% *The questions highlighted in yellow were also found as golden questions in the European SEGMENT project. Out-of-sample accuracy of LDA is presented in Table 4.2; the first column is for leave-one-out cross validation (LOOCV) and the next three are for state-wise cross validation. Table 4.2: Non-Driver Group LDA Accuracy
Group LOOCV FL OR VA
1 94.5% 95.2% 90.5% 89.3% 2 82.8% 92.9% 100.0% 84.0% 3 82.5% 68.4% 58.3% 93.8%
This process was repeated with the 16 additional survey questions given to non-drivers. Table 4.3 presents the new golden questions and mean responses to them. Again, the questions highlighted in yellow were also found as golden questions in the European SEGMENT project. The questions highlighted in orange belong with the additional questions. Table 4.3: Non-Driver Group Mean Responses to Golden Questions, with Added Questions
16 Golden Questions Group 1 Group 2 Group 3 I am NOT the kind of person to use public transportation 2.804878 1.47619 3.586957
I have no need to drive as public transport/walking/cycling are all adequate 0.073171 0.428571 0.043478 There are many problems with using public transportation 2.95122 2.964286 4.021739 My employer reimburses bicycle commuting expenses 2.768293 1.583333 1.695652 I like traveling by local bus or trolley bus 3 3.72619 1.76087 I do NOT need to have a car/truck/van 3 3.833333 2.347826 Finding a parking space at work is difficult 3.134146 3.011905 2.043478 I do NOT know anyone with whom to carpool 2.890244 3.440476 3.630435
39
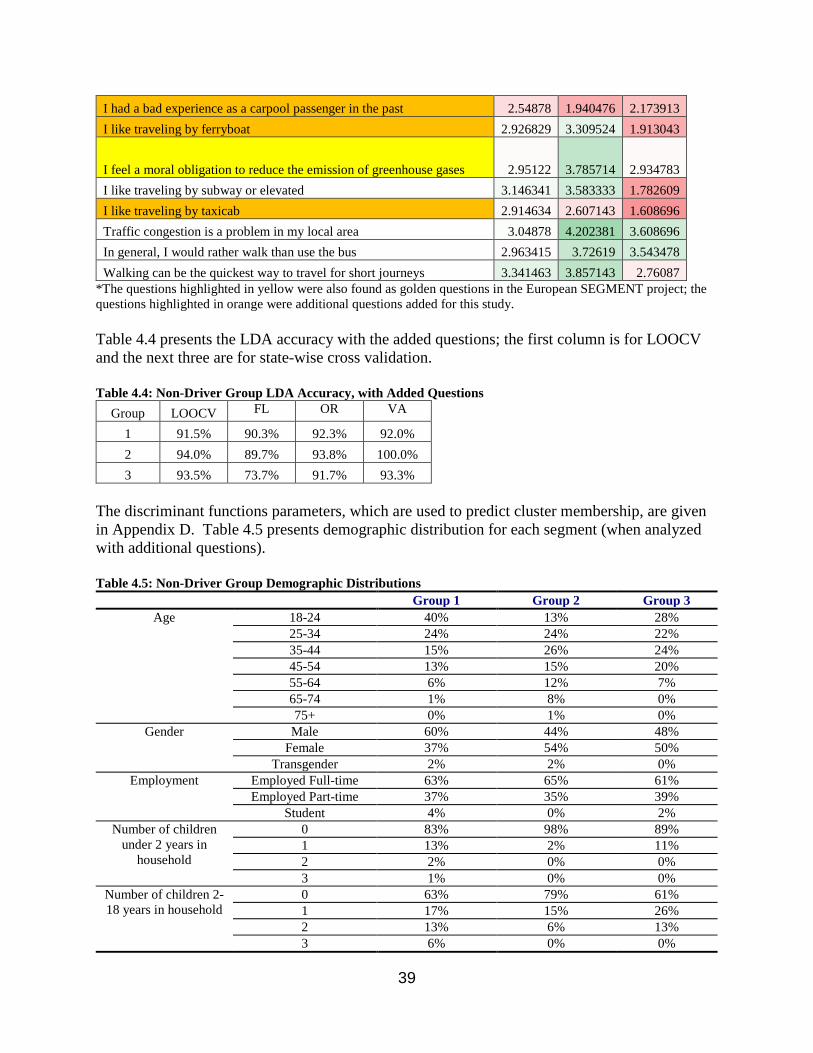
I had a bad experience as a carpool passenger in the past 2.54878 1.940476 2.173913 I like traveling by ferryboat 2.926829 3.309524 1.913043
I feel a moral obligation to reduce the emission of greenhouse gases 2.95122 3.785714 2.934783 I like traveling by subway or elevated 3.146341 3.583333 1.782609 I like traveling by taxicab 2.914634 2.607143 1.608696 Traffic congestion is a problem in my local area 3.04878 4.202381 3.608696 In general, I would rather walk than use the bus 2.963415 3.72619 3.543478 Walking can be the quickest way to travel for short journeys 3.341463 3.857143 2.76087
*The questions highlighted in yellow were also found as golden questions in the European SEGMENT project; the questions highlighted in orange were additional questions added for this study. Table 4.4 presents the LDA accuracy with the added questions; the first column is for LOOCV and the next three are for state-wise cross validation. Table 4.4: Non-Driver Group LDA Accuracy, with Added Questions
Group LOOCV FL OR VA
1 91.5% 90.3% 92.3% 92.0% 2 94.0% 89.7% 93.8% 100.0% 3 93.5% 73.7% 91.7% 93.3%
The discriminant functions parameters, which are used to predict cluster membership, are given in Appendix D. Table 4.5 presents demographic distribution for each segment (when analyzed with additional questions). Table 4.5: Non-Driver Group Demographic Distributions
Group 1 Group 2 Group 3 Age 18-24 40% 13% 28%
25-34 24% 24% 22% 35-44 15% 26% 24% 45-54 13% 15% 20% 55-64 6% 12% 7% 65-74 1% 8% 0% 75+ 0% 1% 0%
Gender Male 60% 44% 48% Female 37% 54% 50%
Transgender 2% 2% 0% Employment Employed Full-time 63% 65% 61%
Employed Part-time 37% 35% 39% Student 4% 0% 2%
Number of children under 2 years in
household
0 83% 98% 89% 1 13% 2% 11% 2 2% 0% 0% 3 1% 0% 0%
Number of children 2-18 years in household
0 63% 79% 61% 1 17% 15% 26% 2 13% 6% 13% 3 6% 0% 0%
40
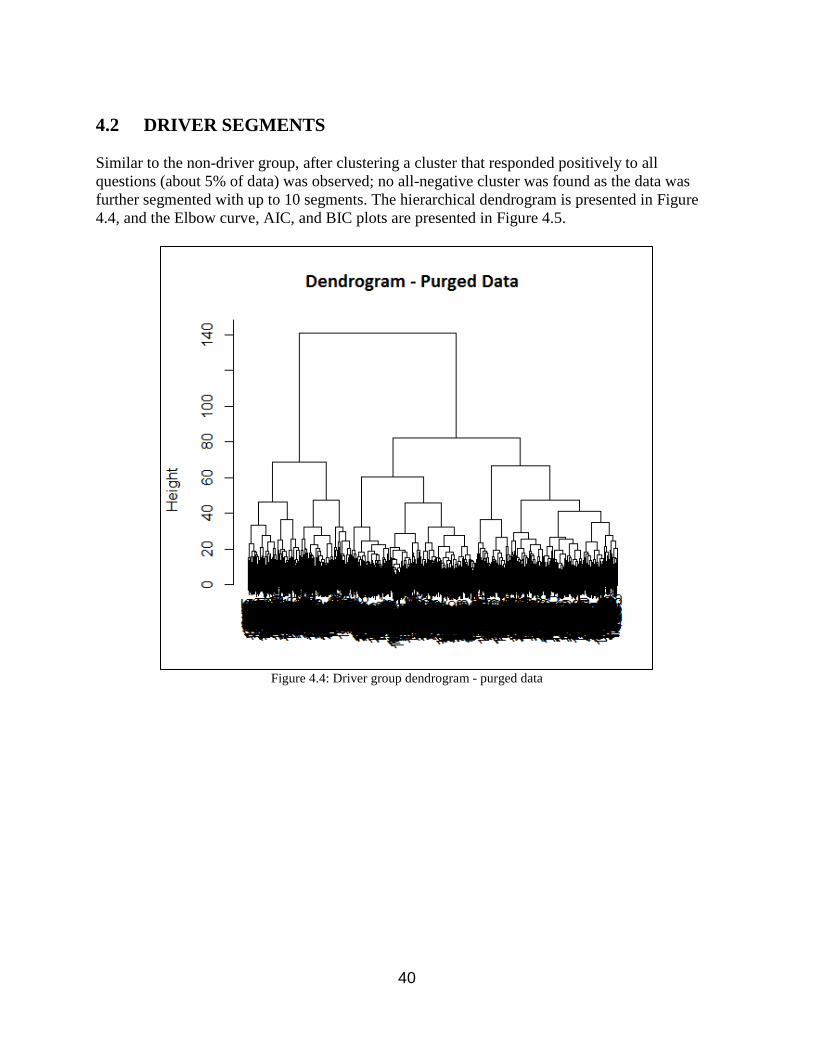
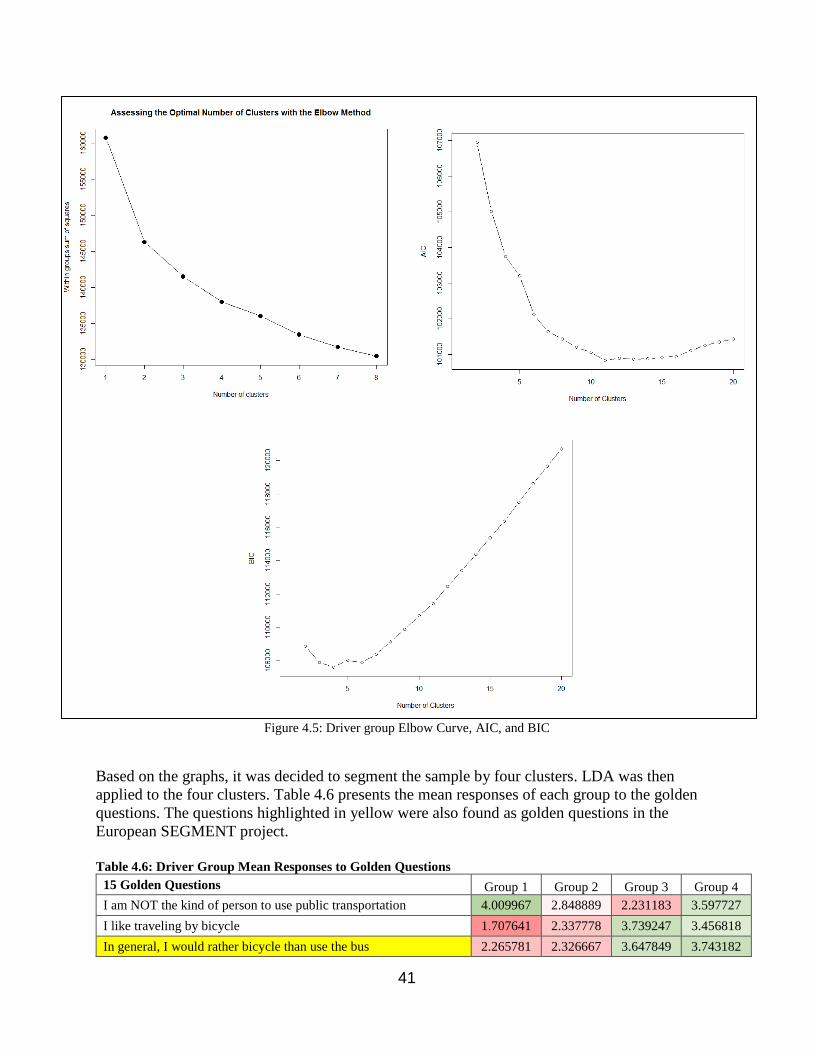
4.2 DRIVER SEGMENTS Similar to the non-driver group, after clustering a cluster that responded positively to all questions (about 5% of data) was observed; no all-negative cluster was found as the data was further segmented with up to 10 segments. The hierarchical dendrogram is presented in Figure 4.4, and the Elbow curve, AIC, and BIC plots are presented in Figure 4.5.
Figure 4.4: Driver group dendrogram - purged data
41
Figure 4.5: Driver group Elbow Curve, AIC, and BIC
Based on the graphs, it was decided to segment the sample by four clusters. LDA was then applied to the four clusters. Table 4.6 presents the mean responses of each group to the golden questions. The questions highlighted in yellow were also found as golden questions in the European SEGMENT project. Table 4.6: Driver Group Mean Responses to Golden Questions
15 Golden Questions Group 1 Group 2 Group 3 Group 4 I am NOT the kind of person to use public transportation 4.009967 2.848889 2.231183 3.597727 I like traveling by bicycle 1.707641 2.337778 3.739247 3.456818 In general, I would rather bicycle than use the bus 2.265781 2.326667 3.647849 3.743182
42
I am NOT the kind of person who rides a bicycle 3.684385 3.551111 1.991935 2.170455
It is important to reduce the number of cars/trucks/vans on the road 2.621262 3.531111 4.094086 3.168182
I am NOT interested in reducing my car/truck/van use 4.093023 2.882222 2.155914 3.434091 If I could, I would gladly do without a car/truck/van 1.461794 2.651111 3.376344 2.070455
People should be allowed to use their cars/trucks/vans as much as they like 4.431894 3.593333 3.349462 4.206818
I feel a moral obligation to reduce the emission of greenhouse gases 2.352159 3.322222 3.983871 2.979545
I like traveling by streetcar or trolley car 1.408638 2.833333 3.188172 2.361364 I like traveling by subway or elevated 1.461794 2.971111 3.30914 2.543182 I like traveling by taxicab 1.491694 2.535556 2.69086 2.290909 Traffic problems will reduce if I drive less 2.013289 2.971111 3.38172 2.515909 I like traveling by walking (to/from destination) 2.315615 3.335556 4.134409 3.697727 Walking provides freedom and flexibility 3.491694 3.564444 4.255376 3.922727
Percentage in sample 19% 29% 24% 28% *The questions highlighted in yellow were also found as Golden Questions in the European SEGMENT project. Out-of-sample accuracy of LDA is presented in Table 4.7; the first column is for LOOCV and the next three are for state-wise cross validation. Table 4.7: Driver Group LDA Accuracy
Group LOOCV FL OR VA
1 84.4% 91.1% 75.3% 85.4% 2 85.6% 81.0% 84.3% 89.1% 3 83.3% 87.2% 87.3% 75.9% 4 79.5% 80.6% 82.4% 78.5%
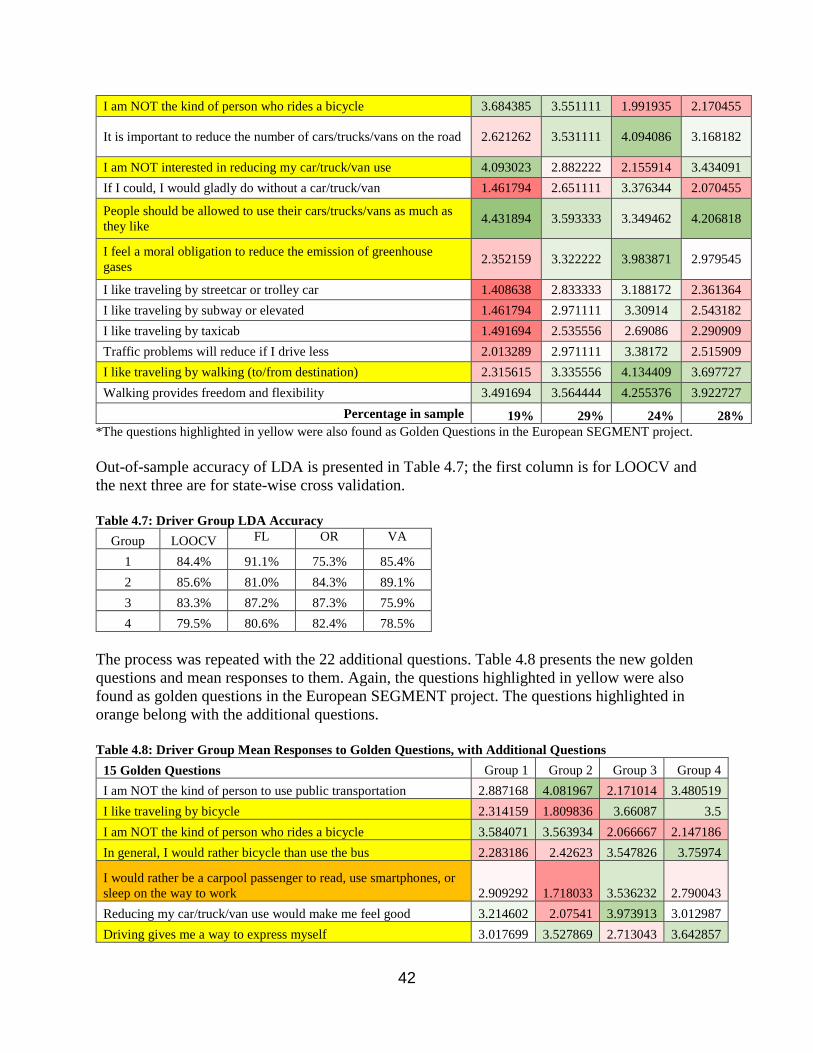
The process was repeated with the 22 additional questions. Table 4.8 presents the new golden questions and mean responses to them. Again, the questions highlighted in yellow were also found as golden questions in the European SEGMENT project. The questions highlighted in orange belong with the additional questions. Table 4.8: Driver Group Mean Responses to Golden Questions, with Additional Questions
15 Golden Questions Group 1 Group 2 Group 3 Group 4 I am NOT the kind of person to use public transportation 2.887168 4.081967 2.171014 3.480519 I like traveling by bicycle 2.314159 1.809836 3.66087 3.5 I am NOT the kind of person who rides a bicycle 3.584071 3.563934 2.066667 2.147186 In general, I would rather bicycle than use the bus 2.283186 2.42623 3.547826 3.75974
I would rather be a carpool passenger to read, use smartphones, or sleep on the way to work 2.909292 1.718033 3.536232 2.790043 Reducing my car/truck/van use would make me feel good 3.214602 2.07541 3.973913 3.012987 Driving gives me a way to express myself 3.017699 3.527869 2.713043 3.642857
43
If I could, I would gladly do without a car/truck/van 2.595133 1.409836 3.44058 2.201299
People should be allowed to use their cars/trucks/vans as much as they like 3.654867 4.436066 3.281159 4.149351 I like traveling by ferryboat 3.053097 1.878689 3.423188 2.876623
I feel a moral obligation to reduce the emission of greenhouse gases 3.252212 2.321311 4.02029 3.101732
Environmental threats such as global warming have been exaggerated 2.544248 3.311475 1.733333 2.779221 I like traveling by streetcar or trolley car 2.789823 1.409836 3.228986 2.4329 I like traveling by walking (to/from destination) 3.272124 2.422951 4.130435 3.735931 I tend NOT to walk much because I am not fit enough 2.502212 2.242623 1.684058 1.991342
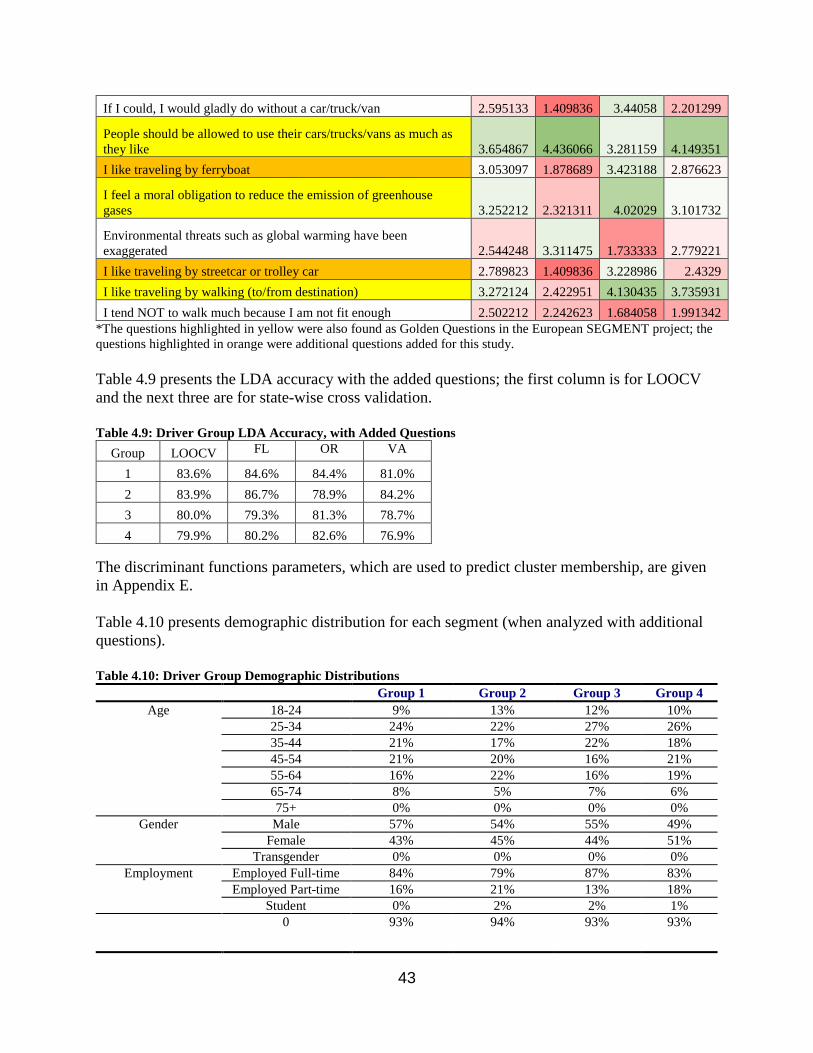
*The questions highlighted in yellow were also found as Golden Questions in the European SEGMENT project; the questions highlighted in orange were additional questions added for this study. Table 4.9 presents the LDA accuracy with the added questions; the first column is for LOOCV and the next three are for state-wise cross validation. Table 4.9: Driver Group LDA Accuracy, with Added Questions
Group LOOCV FL OR VA
1 83.6% 84.6% 84.4% 81.0% 2 83.9% 86.7% 78.9% 84.2% 3 80.0% 79.3% 81.3% 78.7% 4 79.9% 80.2% 82.6% 76.9%
The discriminant functions parameters, which are used to predict cluster membership, are given in Appendix E. Table 4.10 presents demographic distribution for each segment (when analyzed with additional questions). Table 4.10: Driver Group Demographic Distributions
Group 1 Group 2 Group 3 Group 4 Age 18-24 9% 13% 12% 10%
25-34 24% 22% 27% 26% 35-44 21% 17% 22% 18% 45-54 21% 20% 16% 21% 55-64 16% 22% 16% 19% 65-74 8% 5% 7% 6% 75+ 0% 0% 0% 0%
Gender Male 57% 54% 55% 49% Female 43% 45% 44% 51%
Transgender 0% 0% 0% 0% Employment Employed Full-time 84% 79% 87% 83%
Employed Part-time 16% 21% 13% 18% Student 0% 2% 2% 1%
0 93% 94% 93% 93%
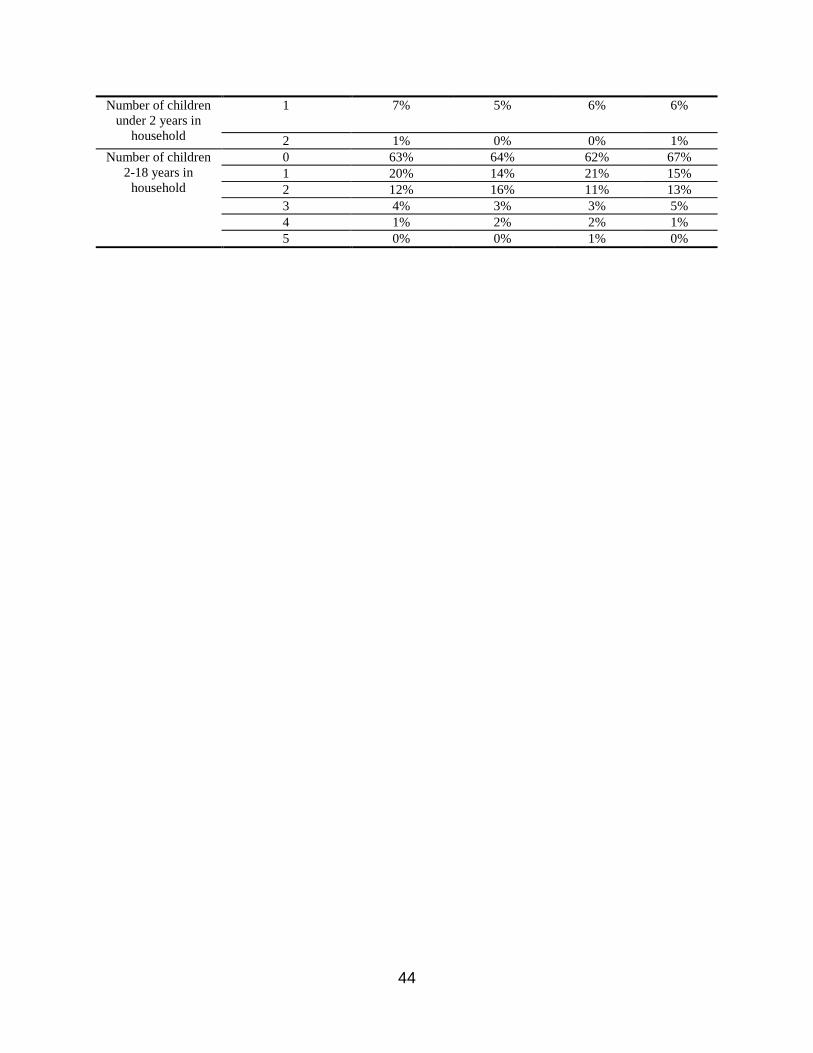
44
Number of children under 2 years in
household
1 7% 5% 6% 6%
2 1% 0% 0% 1% Number of children
2-18 years in household
0 63% 64% 62% 67% 1 20% 14% 21% 15% 2 12% 16% 11% 13% 3 4% 3% 3% 5% 4 1% 2% 2% 1% 5 0% 0% 1% 0%
45
5.0 DISCUSSION
5.1 FINDINGS For the non-drivers group, when only the questions from the European SEGMENT project were included, the results are quite similar to the European study. About half of the golden questions are the same as the ones identified by Anable and Wright (2013). Among the three non-driver segments, the attitudes of segment 3 are nearly identical to the European project’s Car-Free Chooser group, and those of segment 2 are quite similar to the European project’s Public Transport Dependent group. Instead of the European project’s Car Contemplators group, the third group in this study (group 1) responded relatively neutrally to most transport modes. When including the 16 additional questions to the process, it was observed that most of the European golden questions were removed and replaced by some of the additional questions added in this study. Furthermore, LDA’s prediction accuracy increases significantly. This confirms the belief that the additional questions help classify the non-driver segments better in the United States. The segments’ profiles change only slightly with the additional questions. For the drivers group, when only the questions from the European SEGMENT project were included, the results are also quite similar. About half of the golden questions are the same. Based on the mean responses, it is observed that this study’s segments 1, 2, 3, 4 are similar to the European project’s segments of Devoted Drivers, Image Improvers, Active Aspirers, and Practical Travelers, respectively. When including the 22 additional questions to the process, three of those were identified as important golden questions, but the LDA accuracy unexpectedly drops slightly. This happens because the added questions increase dimensionality and change the Euclidean distances and, therefore, the 15 golden questions can explain a smaller proportion of variation than before. Interestingly, in the non-drivers case, the additional questions were strong enough to offset dimensionality and further increase prediction power. The fact that many of them became golden questions complements this belief. The discriminant functions provided in Appendix D and E can be used in the future to inexpensively segment any population for social marketing purposes. However, uses of these functions outside of the surveyed areas should be carried out with caution because citizens in different areas may have significantly different attitudes in transport. 5.2 SEGMENTS PROFILING Based on the mean responses of each group to all of the survey questions, the following group profiles have been constructed. 5.2.1 Non-driver groups Groups 1 through 3, as denoted in the results, are the non-driver groups and can be described as follows.
46
5.2.1.1 Group 1 – Open-minded and Practical Travelers This group somewhat likes driving or traveling by car, truck, or van as a passenger. They also believe that people should be allowed to use their cars, trucks, or vans as much as they like. However, they are also open-minded about other modes of transportation. They have positive attitudes towards walking and biking and are aware of the health benefits from walking and biking. They understand that society is facing environmental problems, but do not have a strong drive to act on this situation. They do not like or dislike other modes of transportation such as bus, train, ferryboat, or subway.
5.2.1.2 Group 2 – Car-free Choosers (same as European Segment) This group does not feel the need to own a car as they believe that public transportation, walking, and cycling are adequate for their daily life. They also think that owning a car, truck, or van is expensive, and therefore do not have any incentive to invest in them. As a result, they are unlikely to increase their driving frequency. However, they still enjoy traveling in a car, truck, or van as a passenger. They also have positive attitudes towards many types of public transportation such as bus, train, ferryboat, or subway. They love walking and biking and strongly believe that walking and biking are very healthy. They also pay a lot of attention to the environmental problems that society is facing and strongly believe that global warming is not an exaggerated threat. If this group dislikes any mode of transportation, it might be motorcycle.
5.2.1.3 Group 3 – Car Contemplators (same as European Segment) This group loves traveling by car, truck, or van, whether they are driving or not. They do not like traveling by public transportation such as bus, train, ferryboat, or subway because they think that they are both slow and stressful. They believe that owning a car, truck, or van is a sign of success and they provide status and prestige to the owner. As a result, they feel that people should be allowed to drive as much as they would like. They do not like biking or walking as a way to get to places, but are aware of the health benefits. They are also aware of environmental problems and do not believe that global warming and climate change threats have been exaggerated. However, they do not feel that they need to personally act to solve these problems. 5.2.2 Driver Groups Group 4 through 7, as denoted in the results, are the driver groups and can be described as follows.
5.2.2.1 Group 4 - Malcontented Motorists & Non-biker This group likes driving, but not as much as the car lovers and devoted drivers do. They agree that it is important to reduce the number of cars, trucks, and vans on the road due to traffic noise and pollution. They also feel responsible about environmental problems and do not believe that climate change and global warming have been exaggerated. They somewhat believe that reducing car usage can help stop climate change. Nevertheless, they do not enjoy public transportation because driving is faster. Therefore, they do not have many options besides
47
driving. A distinctive feature of this group is that they dislike bicycles and motorcycles, even though they acknowledge the health benefits of bicycling.
5.2.2.2 Group 5 – Car Lovers / Devoted Drivers (same as European Segment) This group really loves to drive and does not want to cut down their car/truck/van use, and believes that there is no realistic alternative to driving. They believe that driving is a way to express themselves. As a result, they strongly believe that people should be allowed to use their car, truck, or van as much as they like. They have very negative attitudes towards biking and walking even though they understand the health benefits. They also have very negative attitudes towards any kind of public transportation and believe that cars, trucks, and vans are faster,cheaper and safer. However, they do not think that they are too dependent on cars, trucks, and vans. They also do not enjoy carpooling. They do not agree that cars, trucks, or vans create noise and odor nuisance or lead to an unhealthy lifestyle. Regarding environmental issues and climate change, this group somewhat believes that environmental threats have been exaggerated.
5.2.2.3 Group 6 – Active Aspirer (same as European Segment) This group does not enjoy driving as much as people in other groups and would gladly cut down their car, truck, or van use if they could. They believe that driving is quicker than transportation but not cheaper because owning a car, truck, or van is expensive. They do not like traveling by taxicab and motorcycle. They have positive attitudes toward public transportation such as bus, subway, railroad, and ferryboat. They also enjoy biking and walking and highly appreciate the health benefits. They are highly aware of environmental responsibilities and climate change and would like to act on them. Therefore, this group believes that it is important to reduce the number of cars, trucks, and vans due to traffic noise and odor, and to solve environmental issues. If this group has to use a car to get to work, they would like to carpool.
5.2.2.4 Group 7 – Open-minded Car Lovers Just like the Car Lovers/Devoted Drivers group, this group really loves to drive, does not want to cut down their car, truck or van use, and believes that there is no realistic alternative to driving. They strongly believe that people should be allowed to use their car/truck/van as much as they like and think that driving is a way to express themselves. Since they believe that driving is cheaper and quicker, they have unfavorable views toward public transportation. Nevertheless, they still like traveling by walking and biking and highly appreciate the health benefits. Despite their love for driving, this group feels responsible about environmental issues and does not believe that climate change and global warming have been exaggerated. Therefore, they think that it is important to reduce the number of car/truck/vans because of traffic noise and odor. This group is also open to carpooling.
5.3 SEGMENT REPRESENTATION BY STATE
The distribution of each of the seven segments (three non-driver and four driver) are shown in Figure 5.1. As viewable in this figure, the representation of the seven segments varies by state. Florida (FL) has the largest number of segments 3, 5 and 7, which are the Car Contemplators,

48
Car Lovers/Devoted Drivers, and Open-minded Car Lovers, respectively. Oregon (OR) has the largest number of segments 2 and 6, which are the Car-free Choosers and Active Aspirers, respectively. Finally, Virginia (VA) has the largest number of segments 1 and 4, which are the Open-minded and Practical Travelers and Malcontented Motorists, respectively.
Figure 5.1: Distribution of segments by state
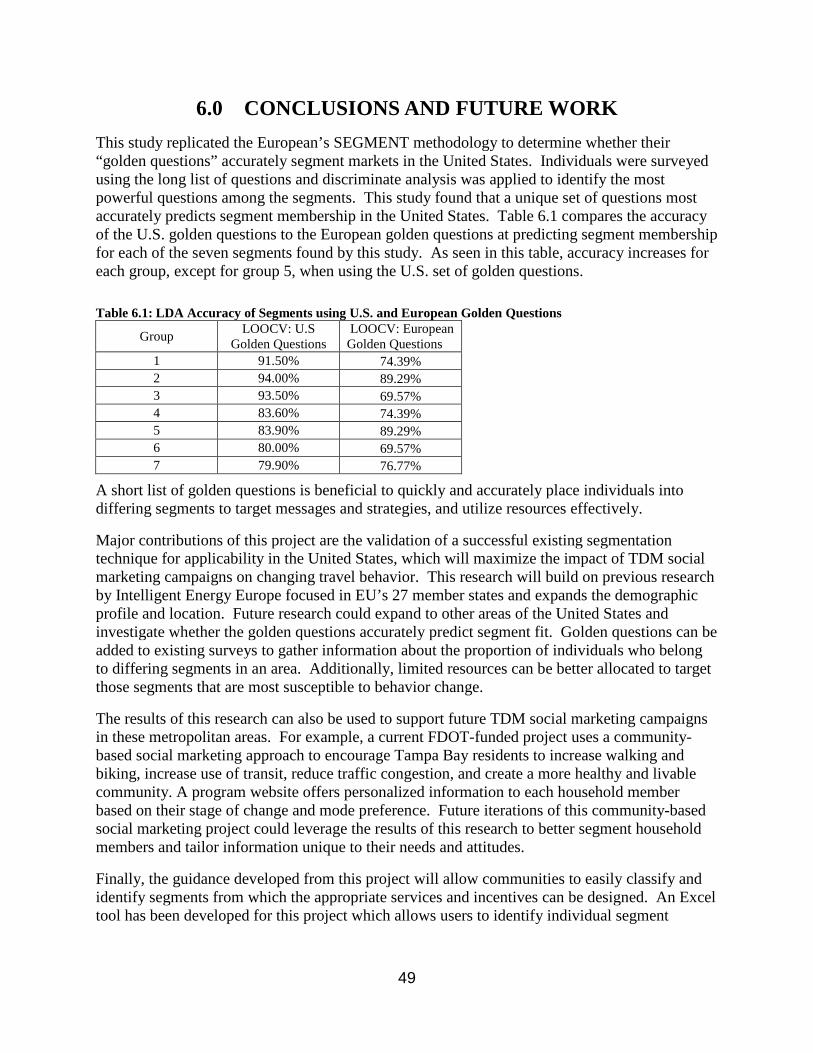
49
6.0 CONCLUSIONS AND FUTURE WORK This study replicated the European’s SEGMENT methodology to determine whether their “golden questions” accurately segment markets in the United States. Individuals were surveyed using the long list of questions and discriminate analysis was applied to identify the most powerful questions among the segments. This study found that a unique set of questions most accurately predicts segment membership in the United States. Table 6.1 compares the accuracy of the U.S. golden questions to the European golden questions at predicting segment membership for each of the seven segments found by this study. As seen in this table, accuracy increases for each group, except for group 5, when using the U.S. set of golden questions. Table 6.1: LDA Accuracy of Segments using U.S. and European Golden Questions
Group LOOCV: U.S Golden Questions
LOOCV: European Golden Questions
1 91.50% 74.39% 2 94.00% 89.29% 3 93.50% 69.57% 4 83.60% 74.39% 5 83.90% 89.29% 6 80.00% 69.57% 7 79.90% 76.77%
A short list of golden questions is beneficial to quickly and accurately place individuals into differing segments to target messages and strategies, and utilize resources effectively.
Major contributions of this project are the validation of a successful existing segmentation technique for applicability in the United States, which will maximize the impact of TDM social marketing campaigns on changing travel behavior. This research will build on previous research by Intelligent Energy Europe focused in EU’s 27 member states and expands the demographic profile and location. Future research could expand to other areas of the United States and investigate whether the golden questions accurately predict segment fit. Golden questions can be added to existing surveys to gather information about the proportion of individuals who belong to differing segments in an area. Additionally, limited resources can be better allocated to target those segments that are most susceptible to behavior change.
The results of this research can also be used to support future TDM social marketing campaigns in these metropolitan areas. For example, a current FDOT-funded project uses a community-based social marketing approach to encourage Tampa Bay residents to increase walking and biking, increase use of transit, reduce traffic congestion, and create a more healthy and livable community. A program website offers personalized information to each household member based on their stage of change and mode preference. Future iterations of this community-based social marketing project could leverage the results of this research to better segment household members and tailor information unique to their needs and attitudes.
Finally, the guidance developed from this project will allow communities to easily classify and identify segments from which the appropriate services and incentives can be designed. An Excel tool has been developed for this project which allows users to identify individual segment
50
membership based on responses to the golden questions. These golden questions should reduce the cost, if not the need, for custom segmentation studies. The Excel prediction tool is available at https://pdxscholar.library.pdx.edu/trec_data/2/. The objective of this tool is to provide transit agencies, transportation demand management (TDM) professionals, and others with a tool to predict market segment membership of individuals. This tool includes: the “golden question” survey questions that can be added to existing surveys to predict segment membership of each individual taking the survey; data sheets that can be used to enter the collected survey data; calculations to obtain the predicted segment membership of respondents; and descriptions of the seven driver and non-driver segments.

51
7.0 REFERENCES J. Allen, D. Vallone, E. Vargyas, C. Healton. The truth® Campaign: Using Countermarketing to Reduce Youth Smoking. Jones and Bartlett Publishers, LLC. (2010): 195–215. Accessed October 14, 2016, http://samples.jbpub.com/9780763753771/53771_CH10_FINAL.pdf
J. Anable, “Complacent Car Addicts’ Or ‘Aspiring Environmentalists’? Identifying Travel Behaviour Segments Using Attitude Theory.” Transport Policy, 12.1 (2005): 65–78.
J. Anable and S. Wright. Golden Questions and Social Marketing Guidance Report. SEGMENT Work Package 7. 2013.
A. Andreasen. "Marketing Social Marketing in the Social Change Marketplace." Journal of Public Policy & Marketing 21.1 (2002): 3-13.
W. Brög, E. Erl, I. Ker, J. Ryle, and R. Wall. “Evaluation of Voluntary Travel Behavior Change: Experiences from Three Continents.” Transport Policy 16 (2009): 281–292.
C.A. Bryant. “Social Marketing: A New Approach to Improved Patient Care.” Primary Care Update - for OB/GYNS 7.4 (2000): 161-167.
N. Davies. “What are the Ingredients of Successful Travel Behavioral Change Campaigns?” Transport Policy 24 (2012): 19-29.
J. Dill and N. McNeil. “Four Types Of Cyclists? Examining A Typology To Better Understand Bicycling Behavior and Potential” Annual Meeting of the Transportation Research Board, Washington, DC. January (2013).
R. Elmore-Yalch. “A Handbook: Using Market Segmentation to Increase Transit Ridership.” Transit Cooperative Research Program Report 36, Washington (DC): National Academy Press. (1998).
R. Elmore-Yalch. “A Handbook: Integrating Market Research into Transit Management.” Transit Cooperative Research Program Report 37, Washington (DC): National Academy Press. (1998).
W. D. Evans, S. Price, and S. Blahut. “Evaluating the truth® Brand.” Journal of Health Communication 10.2 (2005):181–92.
M. C. Farrelly, C. G. Healton, K. C. Davis, P. Messeri, J. C. Hersey, and M. L. Haviland, “Getting To The Truth: Evaluating National Tobacco Countermarketing Campaigns.” American Journal of Public Health 92.6 (2002): 901–907.
R. Geller. “Four Types of Cyclists.” Portland Bureau of Transportation, Portland, Oregon, 2006. https://www.portlandoregon.gov/transportation/44597?a=237507article/264746.
D.M. Gray and B. Bean. “Can social marketing segmentation initiatives be used to increase household electricity conservation?” Journal of Nonprofit & Public Sector Marketing 23.3 (2011): 262-305.
52
Intelligent Energy Europe. The SEGMENT Toolkit: Resources for Creating Segmented Marketing Campaigns for Sustainable Transport. Segmented Marketing for Energy Efficient Transportation. Intelligent Energy Europe. (2015). Accessed October 31, 2016, http://www.segmentproject.eu/hounslow/segment.nsf/Files/SFF-318/$file/Deliverable%207-8.3%20Social%20Marketing%20Toolkit.pdf
International Social Marketing Association, European Social Marketing Association, and Australian Association of Social Marketing. Consensus Definition of Social Marketing. (2013). accessed October 13, 2016 http://www.i-socialmarketing.org/assets/social_marketing_definition.pdf
K.S. Lawrence. “Section 1. Understanding Social Marketing: Encouraging Adoption and Use of Valued Products and Practices.” Community Tool Box Chapter 45. Social Marketing of Successful Components of the Initiative. University of Kansas Work Group for Community Health and Development. (2015). Accessed October 14, 2016, from the Community Tool Box: http://ctb.ku.edu/en/sustain/social-marketing/overview/main.
N. Lee and P. Kotler. Quick Reference Guide: Social Marketing - Influencing Behaviors for Good. Source: Social Marketing: Influencing Behaviors for Good, Fourth Edition, SAGE (2011).
E. McGovern. "Transport Behavior: A Role for Social Marketing Revised." Social Marketing: Advances in Research and Theory, ed. Debra Z. Basil and Walter W. Wymer. Binghamton, NY: The Haworth Press. (2007).
E. McGovern. “Social Marketing Applications And Transportation Demand Management: An Information Instrument For The 21st Century.” Journal of Public Transportation, 8.5 (2005): 1‐24.
F. McLeay and D. Oglethorpe. “Social Marketing, Parental Purchasing Decisions, and Unhealthy Food in Developing Counties: A Nigerian Typology.” Journal of Consumer Behavior 12.3 (2013): 232-242.
National Social Marketing Centre (NSMC). Big Pocket Guide to Using Social Marketing for Behavior Change. NSMC England, UK. (2011). Accessed October 13, 2016, http://www.thensmc.com/sites/default/files/Big_pocket_guide_2011.pdf
“Nielsen PRIZM.” Accessed December 20, 2016, https://segmentationsolutions.nielsen.com/mybestsegments/Default.jsp?ID=70
L. Schuster, K. Kubacki and S. Rundle-Thiele. “A Theoretical Approach to Segmenting Children's Walking Behavior.” Young Consumers Insight and Ideas for Responsible Marketers 16.2 (2015): 159-171.
C. Schweiger “Real-Time Bus Arrival Information Systems.” Transit Cooperative Research Program Synthesis No. 48. Washington DC: Transportation Research Board of the National Academies.(2003).

53
“Strategic Business Insights, US Framework and VALS Types.” Accessed January 15, 2017, http://www.strategicbusinessinsights.com/vals/ustypes.shtml
G. Walsh, L.M. Hassan, E. Shie, J.C. Andrews, and G. Hastings. “Segmentation in Social Marketing: Insights From The European Union’s Multi-Country, Anti-Smoking Campaign.” European Journal of Marketing, 4.7/8, (2010): 1140-1164.
“Weinreich Communications.” Accessed October 31, 2016, http://www.social-marketing.com/index.html

54
8.0 APPENDICES

A-1
APPENDIX A
SEGMENT QUESTIONNAIRE
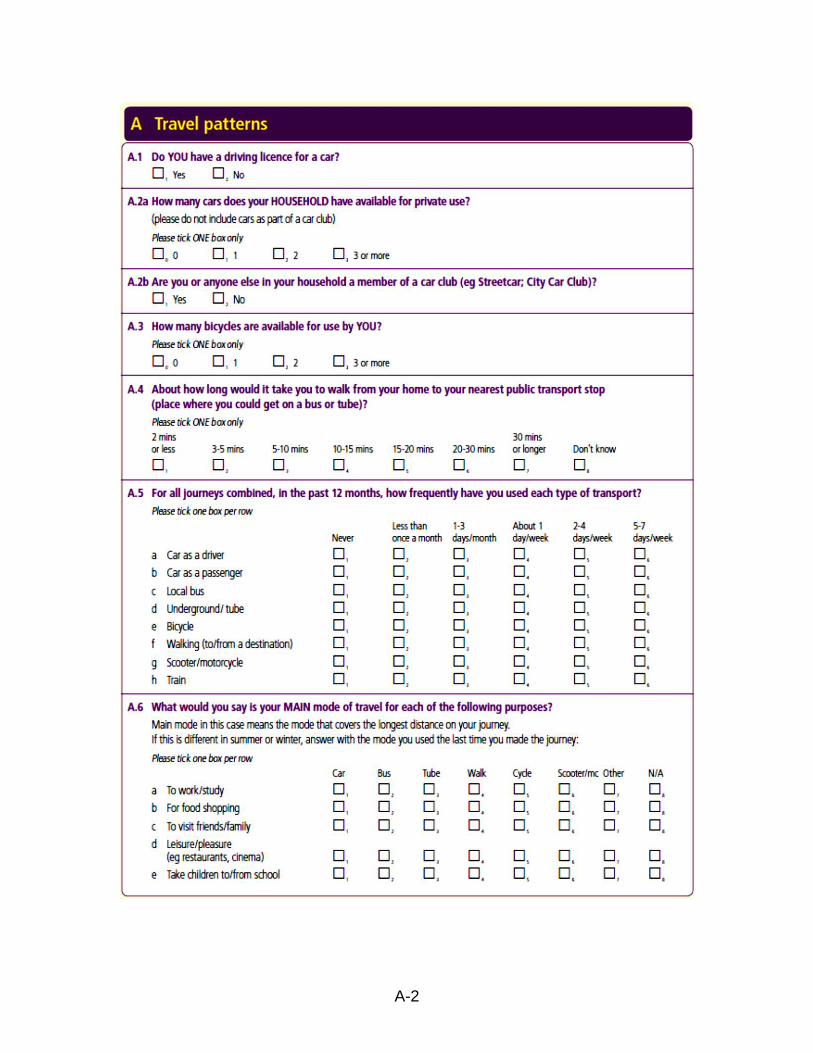
A-2
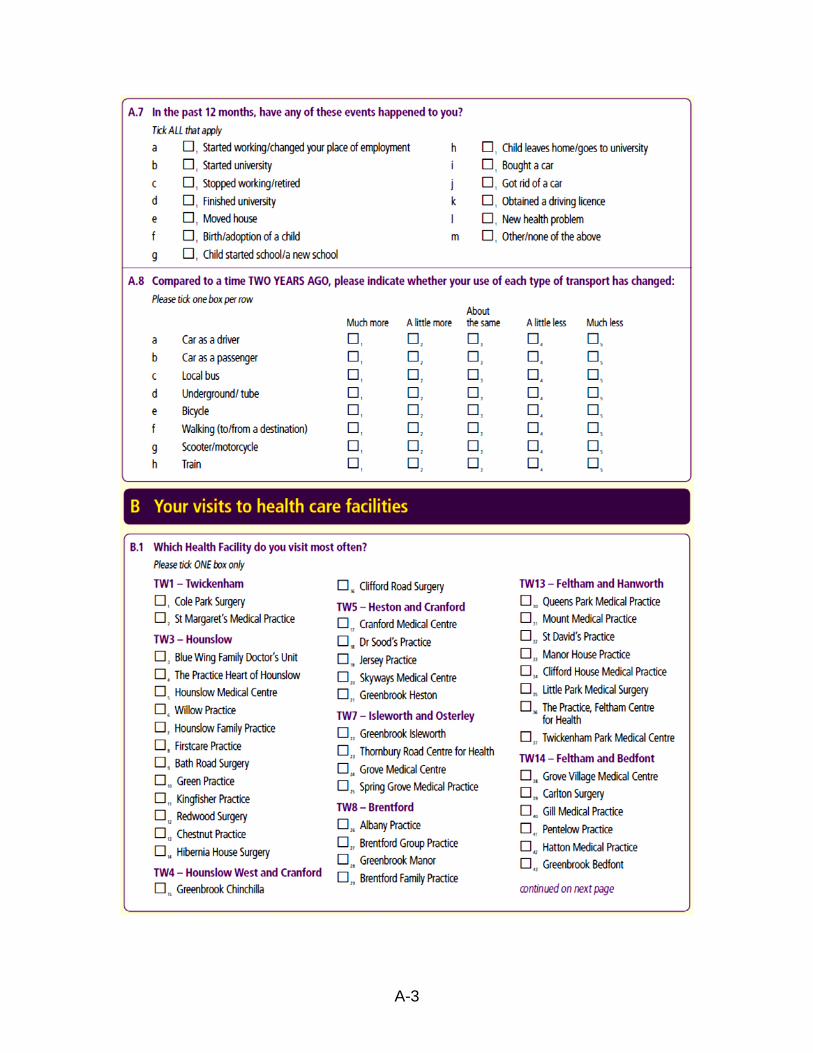
A-3
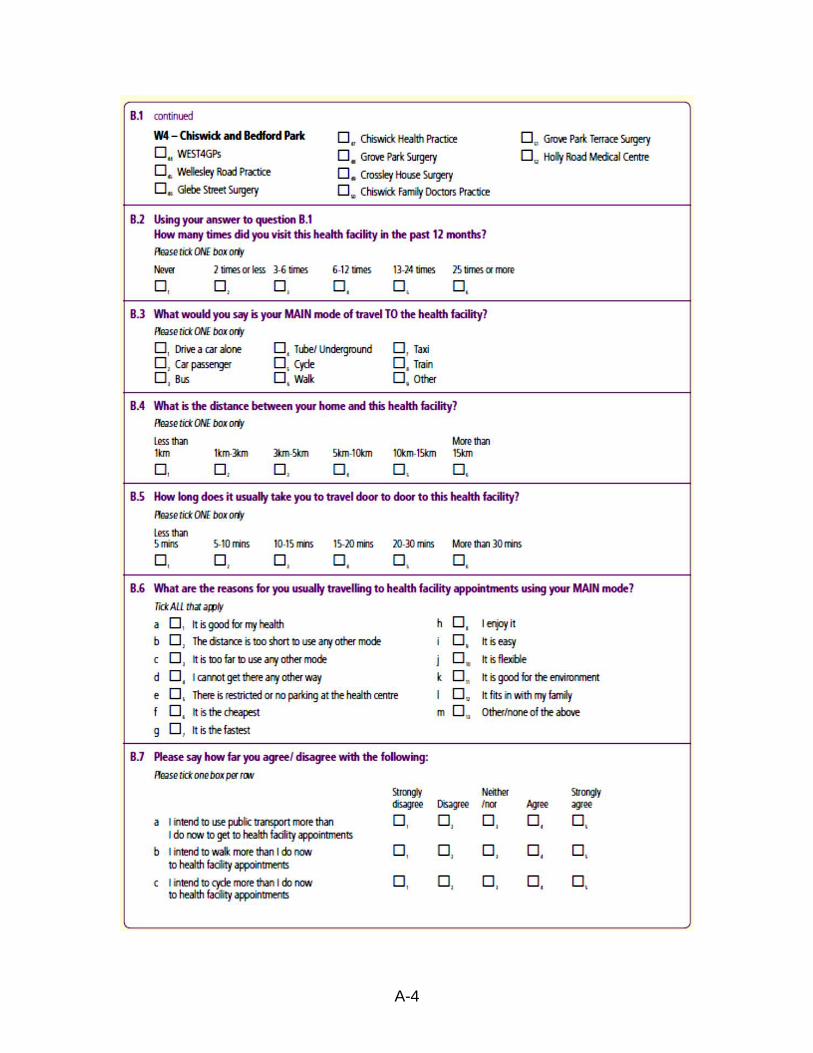
A-4

A-5
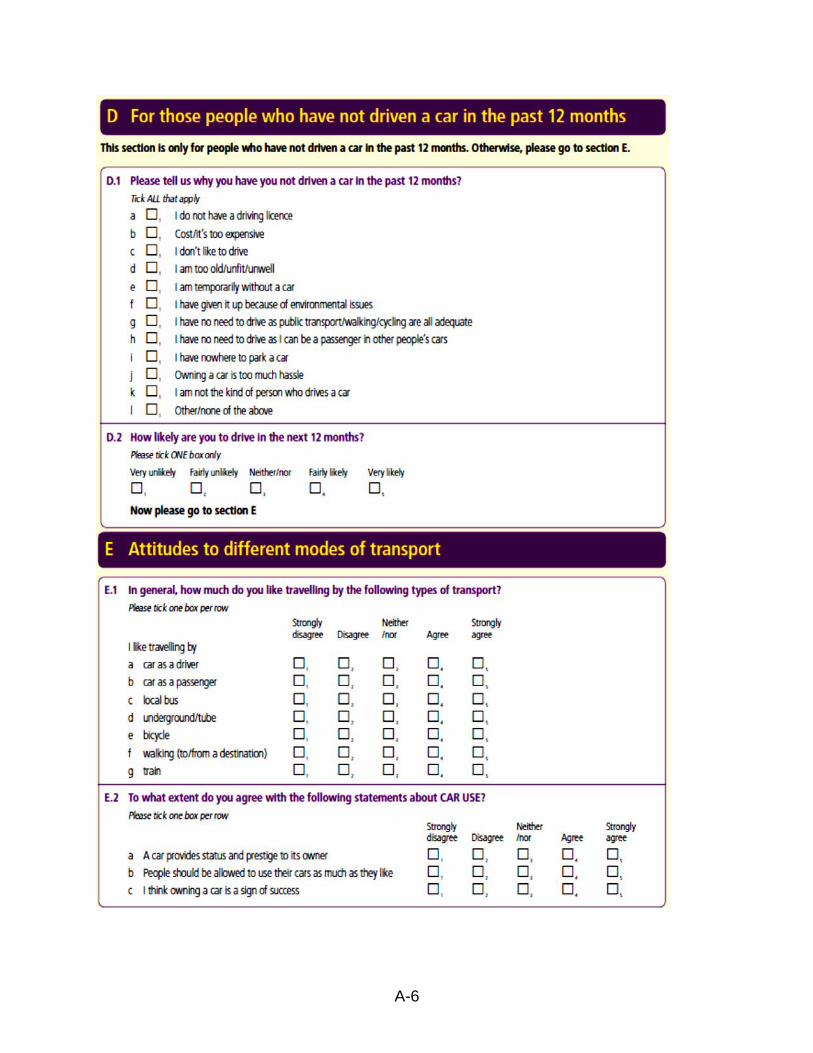
A-6
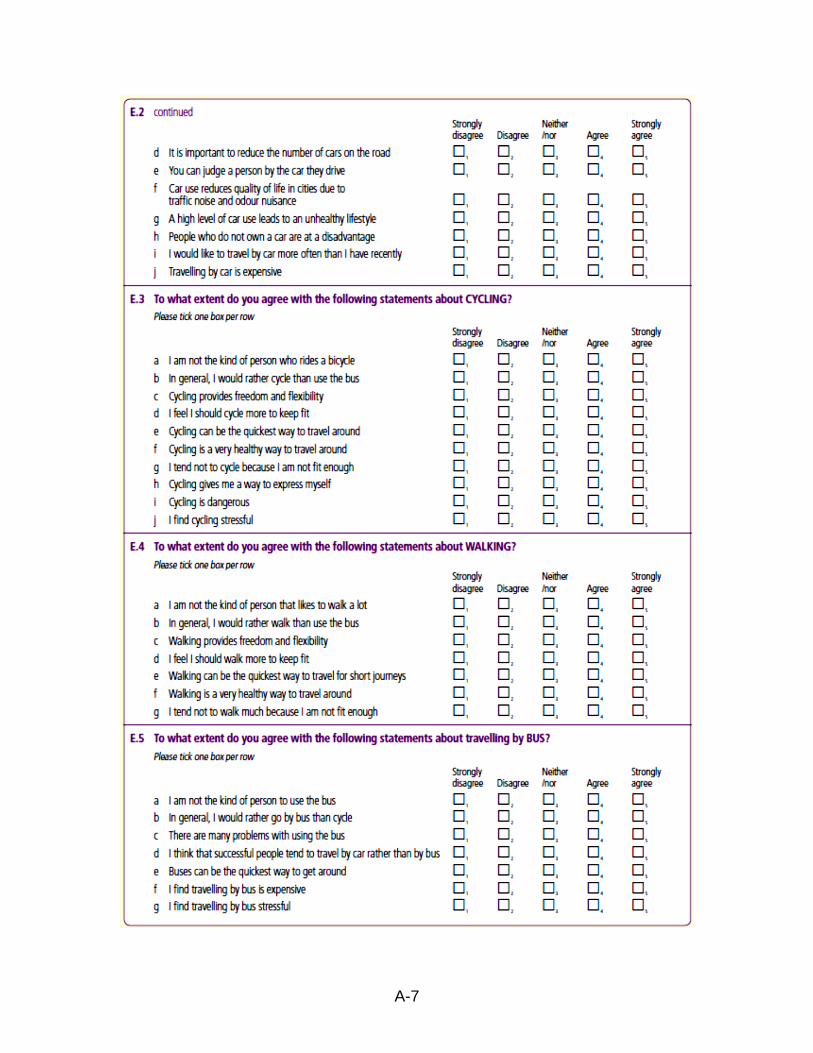
A-7

A-8
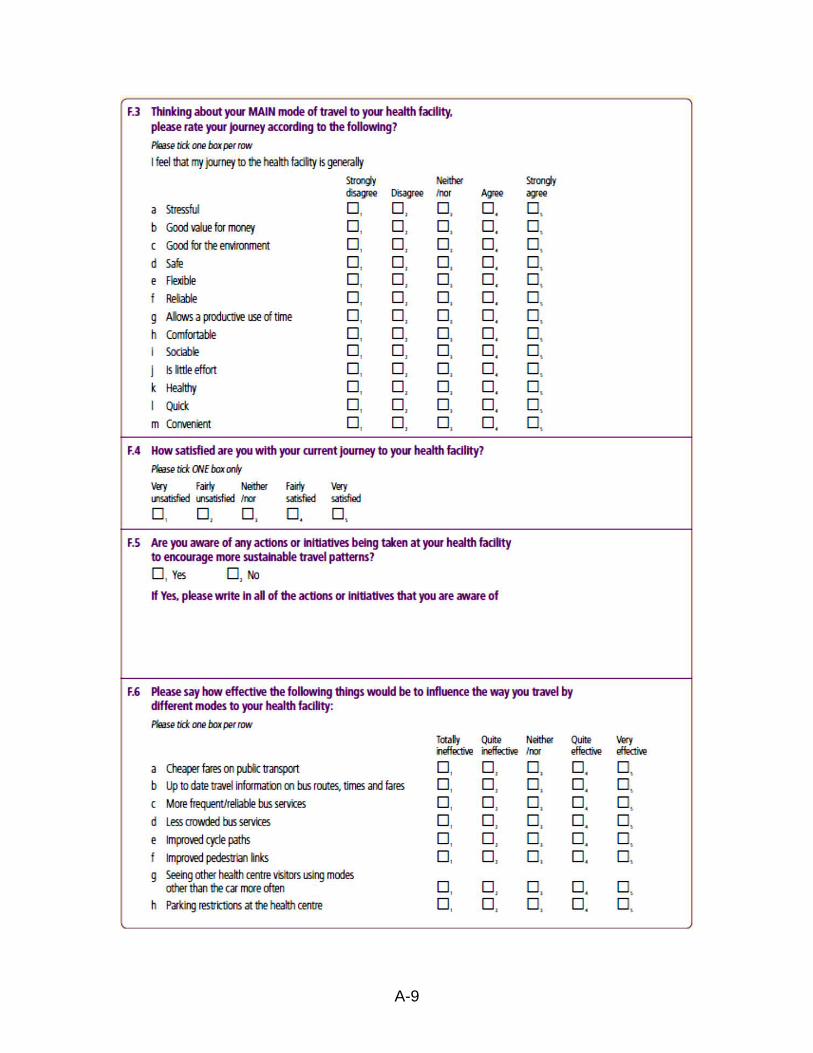
A-9
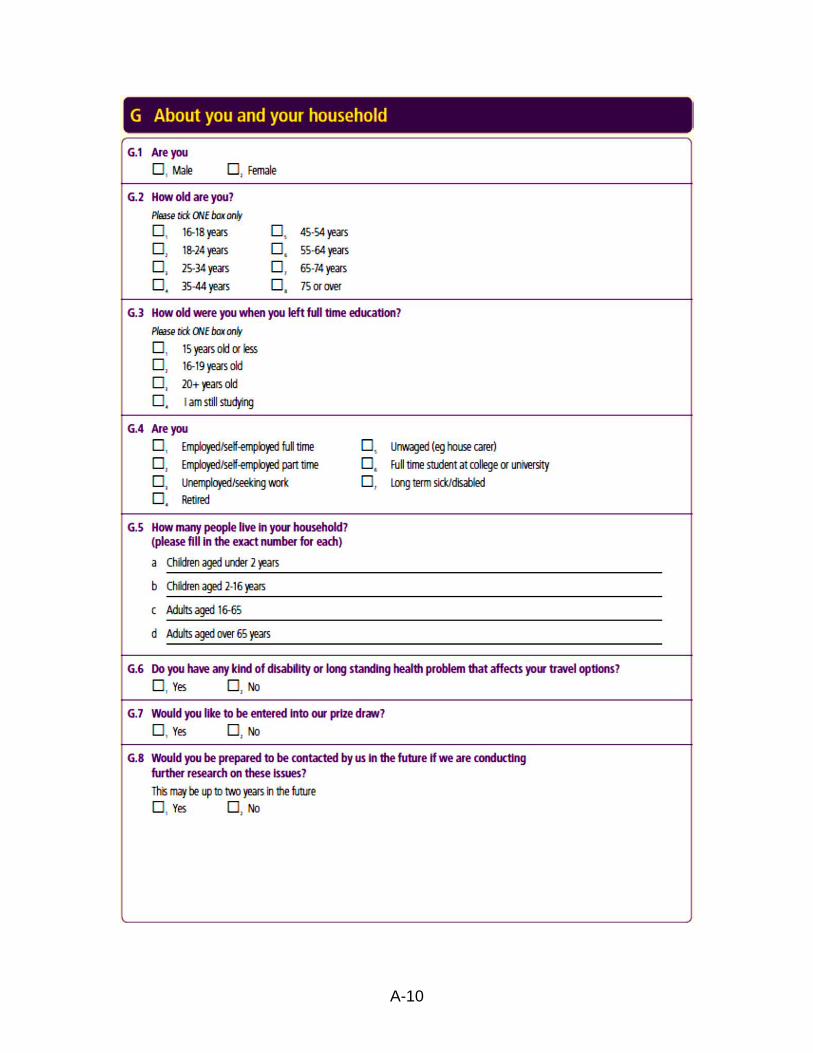
A-10
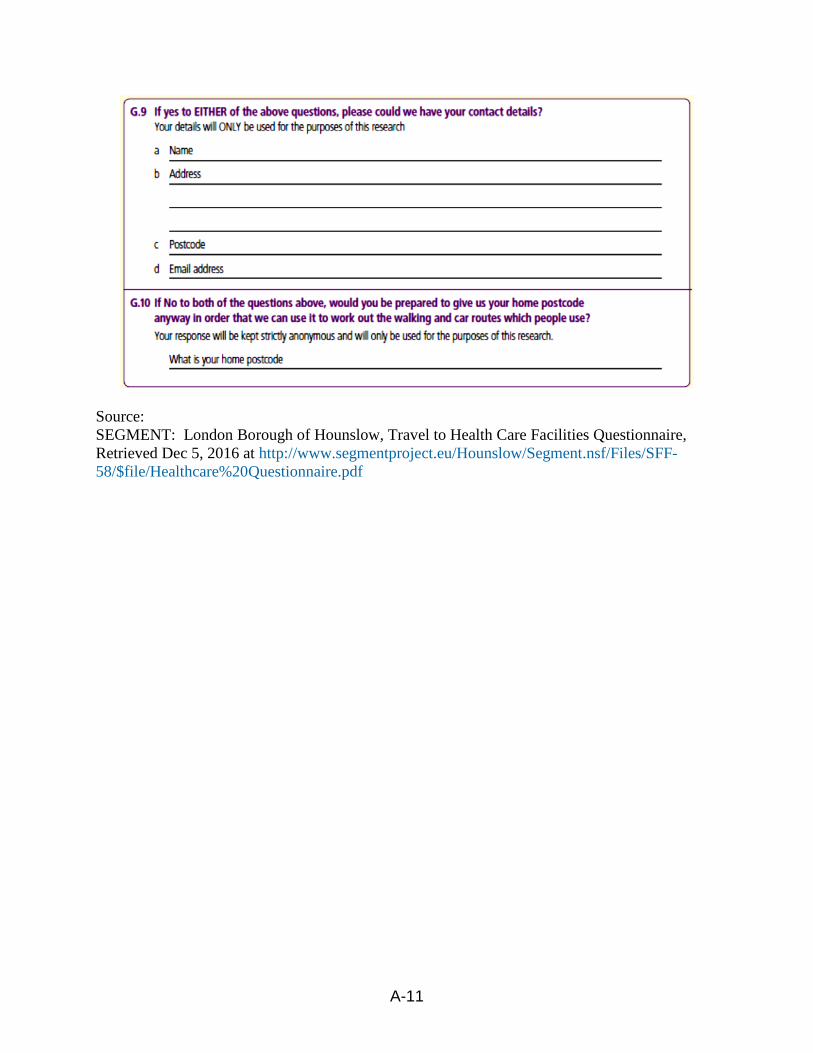
A-11
Source: SEGMENT: London Borough of Hounslow, Travel to Health Care Facilities Questionnaire, Retrieved Dec 5, 2016 at http://www.segmentproject.eu/Hounslow/Segment.nsf/Files/SFF-58/$file/Healthcare%20Questionnaire.pdf

A-12
APPENDIX B
ADDITIONAL QUESTIONS
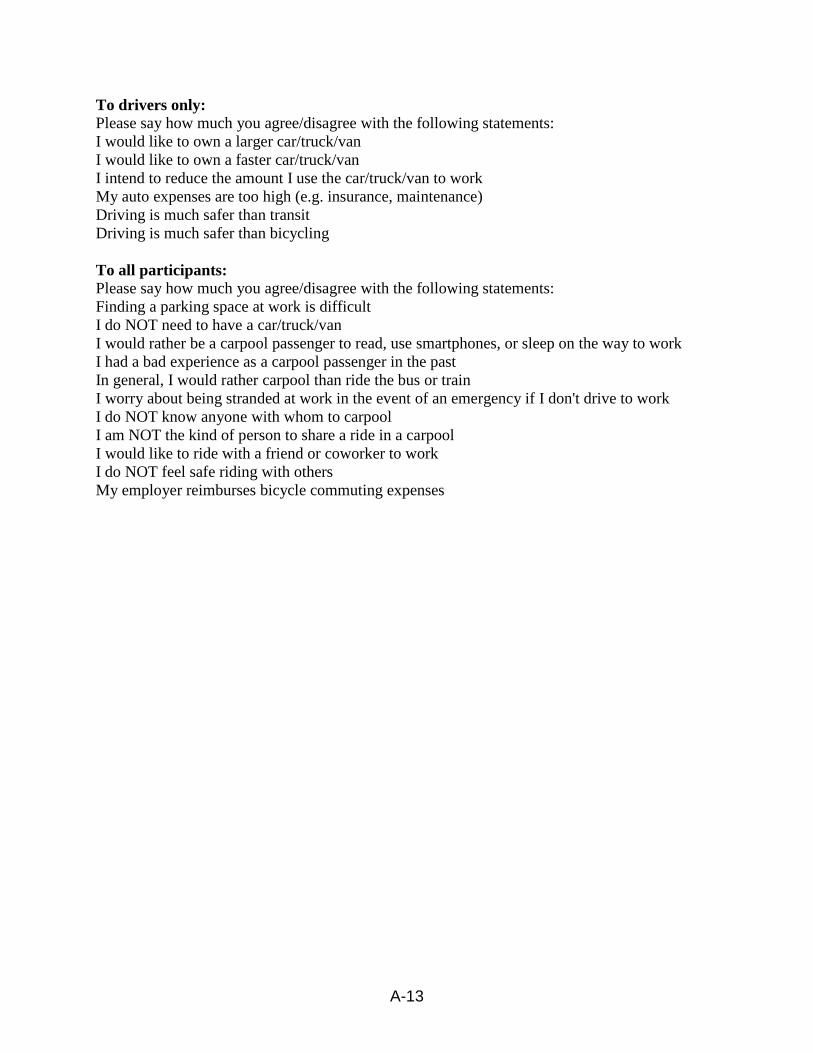
A-13
To drivers only: Please say how much you agree/disagree with the following statements: I would like to own a larger car/truck/van I would like to own a faster car/truck/van I intend to reduce the amount I use the car/truck/van to work My auto expenses are too high (e.g. insurance, maintenance) Driving is much safer than transit Driving is much safer than bicycling To all participants: Please say how much you agree/disagree with the following statements: Finding a parking space at work is difficult I do NOT need to have a car/truck/van I would rather be a carpool passenger to read, use smartphones, or sleep on the way to work I had a bad experience as a carpool passenger in the past In general, I would rather carpool than ride the bus or train I worry about being stranded at work in the event of an emergency if I don't drive to work I do NOT know anyone with whom to carpool I am NOT the kind of person to share a ride in a carpool I would like to ride with a friend or coworker to work I do NOT feel safe riding with others My employer reimburses bicycle commuting expenses
A-14
APPENDIX C
SUMMARIES OF STATISTICAL METHODS
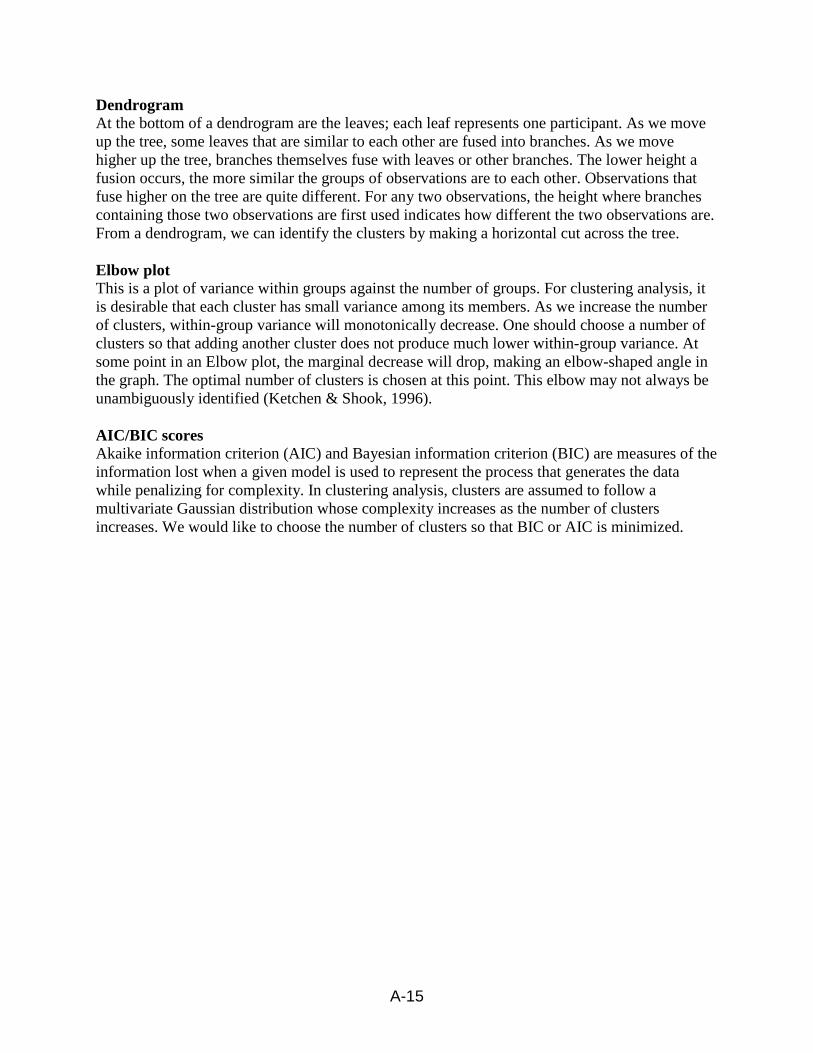
A-15
Dendrogram At the bottom of a dendrogram are the leaves; each leaf represents one participant. As we move up the tree, some leaves that are similar to each other are fused into branches. As we move higher up the tree, branches themselves fuse with leaves or other branches. The lower height a fusion occurs, the more similar the groups of observations are to each other. Observations that fuse higher on the tree are quite different. For any two observations, the height where branches containing those two observations are first used indicates how different the two observations are. From a dendrogram, we can identify the clusters by making a horizontal cut across the tree. Elbow plot This is a plot of variance within groups against the number of groups. For clustering analysis, it is desirable that each cluster has small variance among its members. As we increase the number of clusters, within-group variance will monotonically decrease. One should choose a number of clusters so that adding another cluster does not produce much lower within-group variance. At some point in an Elbow plot, the marginal decrease will drop, making an elbow-shaped angle in the graph. The optimal number of clusters is chosen at this point. This elbow may not always be unambiguously identified (Ketchen & Shook, 1996). AIC/BIC scores Akaike information criterion (AIC) and Bayesian information criterion (BIC) are measures of the information lost when a given model is used to represent the process that generates the data while penalizing for complexity. In clustering analysis, clusters are assumed to follow a multivariate Gaussian distribution whose complexity increases as the number of clusters increases. We would like to choose the number of clusters so that BIC or AIC is minimized.

A-16
APPENDIX D
DISCRIMINATE FUNCTIONS FOR NON-DRIVERS
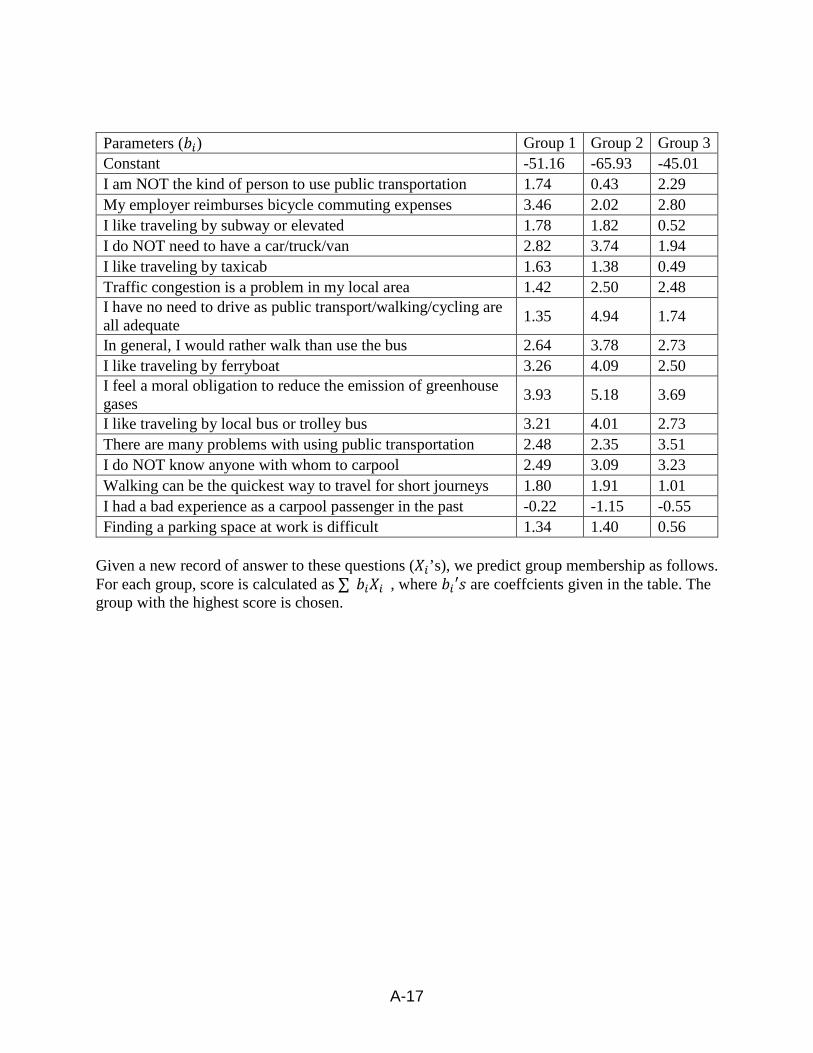
A-17
Parameters (𝑏𝑏𝑖𝑖) Group 1 Group 2 Group 3 Constant -51.16 -65.93 -45.01 I am NOT the kind of person to use public transportation 1.74 0.43 2.29 My employer reimburses bicycle commuting expenses 3.46 2.02 2.80 I like traveling by subway or elevated 1.78 1.82 0.52 I do NOT need to have a car/truck/van 2.82 3.74 1.94 I like traveling by taxicab 1.63 1.38 0.49 Traffic congestion is a problem in my local area 1.42 2.50 2.48 I have no need to drive as public transport/walking/cycling are all adequate 1.35 4.94 1.74
In general, I would rather walk than use the bus 2.64 3.78 2.73 I like traveling by ferryboat 3.26 4.09 2.50 I feel a moral obligation to reduce the emission of greenhouse gases 3.93 5.18 3.69
I like traveling by local bus or trolley bus 3.21 4.01 2.73 There are many problems with using public transportation 2.48 2.35 3.51 I do NOT know anyone with whom to carpool 2.49 3.09 3.23 Walking can be the quickest way to travel for short journeys 1.80 1.91 1.01 I had a bad experience as a carpool passenger in the past -0.22 -1.15 -0.55 Finding a parking space at work is difficult 1.34 1.40 0.56
Given a new record of answer to these questions (𝑋𝑋𝑖𝑖’s), we predict group membership as follows. For each group, score is calculated as ∑(𝑏𝑏𝑖𝑖𝑋𝑋𝑖𝑖), where 𝑏𝑏𝑖𝑖′𝑠𝑠 are coeffcients given in the table. The group with the highest score is chosen.

A-18
APPENDIX E
DISCRIMINATE FUNCTIONS FOR DRIVERS
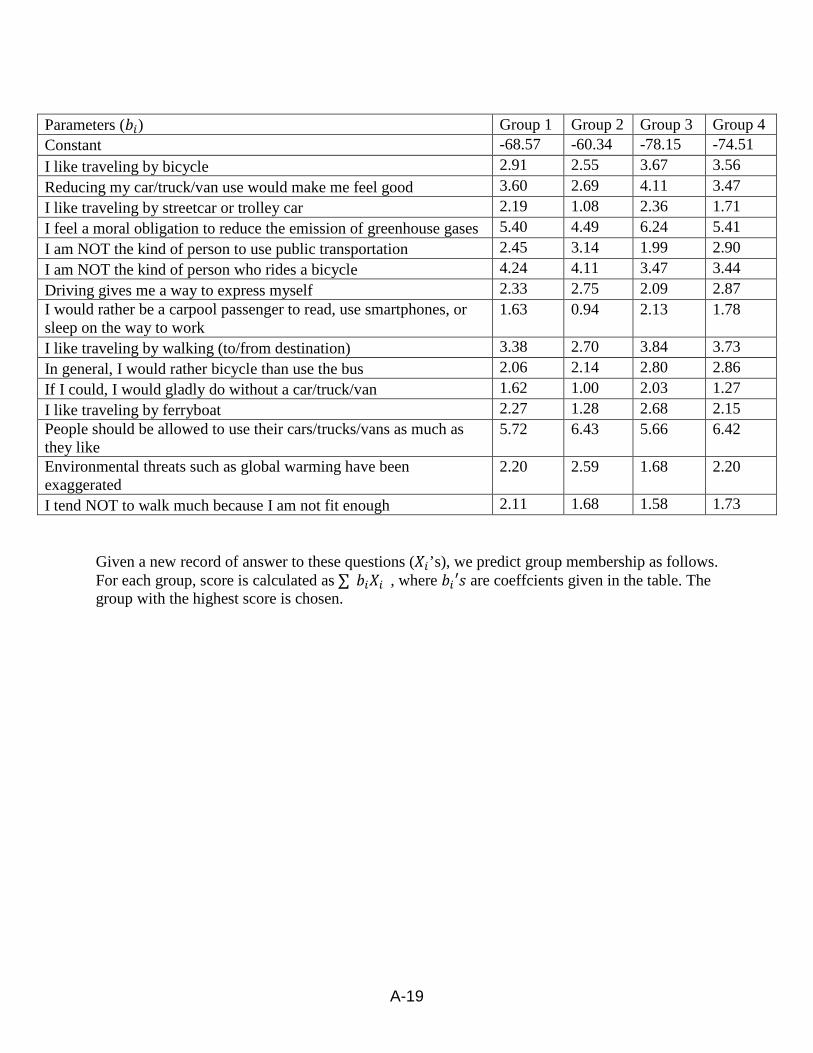
A-19
Parameters (𝑏𝑏𝑖𝑖) Group 1 Group 2 Group 3 Group 4 Constant -68.57 -60.34 -78.15 -74.51 I like traveling by bicycle 2.91 2.55 3.67 3.56 Reducing my car/truck/van use would make me feel good 3.60 2.69 4.11 3.47 I like traveling by streetcar or trolley car 2.19 1.08 2.36 1.71 I feel a moral obligation to reduce the emission of greenhouse gases 5.40 4.49 6.24 5.41 I am NOT the kind of person to use public transportation 2.45 3.14 1.99 2.90 I am NOT the kind of person who rides a bicycle 4.24 4.11 3.47 3.44 Driving gives me a way to express myself 2.33 2.75 2.09 2.87 I would rather be a carpool passenger to read, use smartphones, or sleep on the way to work
1.63 0.94 2.13 1.78
I like traveling by walking (to/from destination) 3.38 2.70 3.84 3.73 In general, I would rather bicycle than use the bus 2.06 2.14 2.80 2.86 If I could, I would gladly do without a car/truck/van 1.62 1.00 2.03 1.27 I like traveling by ferryboat 2.27 1.28 2.68 2.15 People should be allowed to use their cars/trucks/vans as much as they like
5.72 6.43 5.66 6.42
Environmental threats such as global warming have been exaggerated
2.20 2.59 1.68 2.20
I tend NOT to walk much because I am not fit enough 2.11 1.68 1.58 1.73
Given a new record of answer to these questions (𝑋𝑋𝑖𝑖’s), we predict group membership as follows. For each group, score is calculated as ∑(𝑏𝑏𝑖𝑖𝑋𝑋𝑖𝑖), where 𝑏𝑏𝑖𝑖′𝑠𝑠 are coeffcients given in the table. The group with the highest score is chosen.

Transportation Research and Education Center
Portland State University
1900 S.W. Fourth Ave., Suite 175
Portland, OR 97201


![SRDA: Generating Instance Segmentation Annotation Via ......that does detection, segmentation, and classification in sequence. Li et al. [21] combined a segment proposal system and](https://img.pdfslide.us/doc/110x75/601bd013b6e5737d1c38f4b4/srda-generating-instance-segmentation-annotation-via-that-does-detection.jpg)

![Comparison of Traditional Image Segmentation Techniques ... · image segmentation, by interpreting image features as linguistic variables[19] and using fuzzy if-then rules to segment](https://img.pdfslide.us/doc/110x75/5fc6f119691fc05f59529b1c/comparison-of-traditional-image-segmentation-techniques-image-segmentation.jpg)


![[08] Segmentation - University of Cambridge · Segmentation An Alternative to Paging Implementing Segments Segment Table Lookup Algorithm Protection and Sharing Sharing Subtleties](https://img.pdfslide.us/doc/110x75/5f39aba5f20ace3148435170/08-segmentation-university-of-cambridge-segmentation-an-alternative-to-paging.jpg)


![Temporal Segmentation of Group Motion using Gaussian … · Temporal Segmentation of Group Motion using Gaussian Mixture Models [←] •In the first step each individual time segment](https://img.pdfslide.us/doc/110x75/5d141fac88c993b5158cf02d/temporal-segmentation-of-group-motion-using-gaussian-temporal-segmentation-of.jpg)