Embed Size (px)
Citation preview
IENG 578
Cost Estimation of a GE Blender using SEER‐DFM
Team Leader: Lavanya Nyayapathi [email protected] Members: Sri Harsha Chintala [email protected] Vimala Goli [email protected] Bjorn Olof Jonsson [email protected] Navya Reddy Lenkala [email protected]
11/17/2008
Submitted to
Dr. Robert Creese
Department of Industrial and Management Systems Engineering West Virginia University, Morgantown
SEER‐DFM Model for a GE‐BLENDER Page 2
Abstract Seer‐DFM software was used to find the basic cost estimate of a GE blender. A bottom’s up approach was used to breakdown the work elements into sub assemblies and hierarchy of modules. The software demands appropriate values for parameters like tool amortization, material yield, operators’ experience, etc. The risk analysis is performed by changing the production quantities on the average system cost.
The procedure adopted here involves breaking down the blender into 2 subassemblies. The weight of every element in the sub‐assembly was determined and its volume was estimated. This data is entered into the software to develop the estimate of costs. Once the data has been validated, the software will give a basic as well as detailed estimate of the cost of the blender and of all its elements. The risk analysis, cost analysis, production cost, labor cost for individual elements and sub assemblies is also generated by the software.
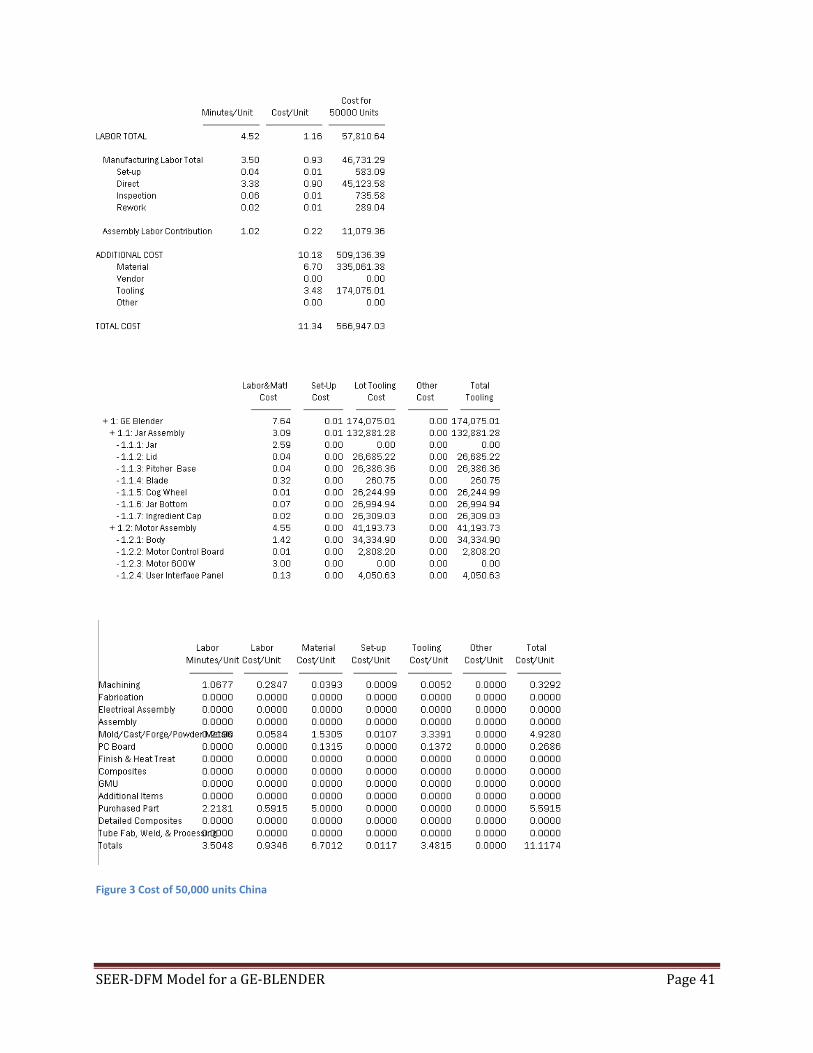
The cost that SEER‐DFM estimates for the blender is $11.34 for 50,000 production units. This cost varies as the production units’ change. It also varies with the country of manufacturing. The GE‐Blender was made in China and hence the estimate in this report is made with China as the country of production and hence its labor rate at $16/hour.
The conclusions and risk analysis gives a detailed estimate of the price of the blender at different production quantities in both USA and China.
SEER‐DFM Model for a GE‐BLENDER Page 3
Table of Contents Abstract ..................................................................................................................................................... 1
1 Introduction ........................................................................................................................................... 4
1.1 What is SEER‐DFM: ......................................................................................................................... 4
1.2 Problem description: ....................................................................................................................... 4
2 Procedure ............................................................................................................................................... 5
2.1 General factors ................................................................................................................................ 7
2.2 Model Hierarchy ............................................................................................................................. 7
2.3 Lid .................................................................................................................................................... 8
2.4 Ingredient cap ............................................................................................................................... 10
2.5 Jar .................................................................................................................................................. 11
2.6 Pitcher base ................................................................................................................................... 12
2.7 Jar bottom/Blade holder ............................................................................................................... 13
2.8 Cog Wheel ..................................................................................................................................... 14
2.9 Blade ............................................................................................................................................. 15
2.10 Body ............................................................................................................................................ 16
2.11 Motor .......................................................................................................................................... 17
2.12 User Interface Panel .................................................................................................................... 18
2.13 Motor Control Board ................................................................................................................... 19
3 Results .................................................................................................................................................. 21
3.1 Graphs and Charts ......................................................................................................................... 22
4 Conclusions and Risk Analysis .............................................................................................................. 25
SEER‐DFM Model for a GE‐BLENDER Page 4
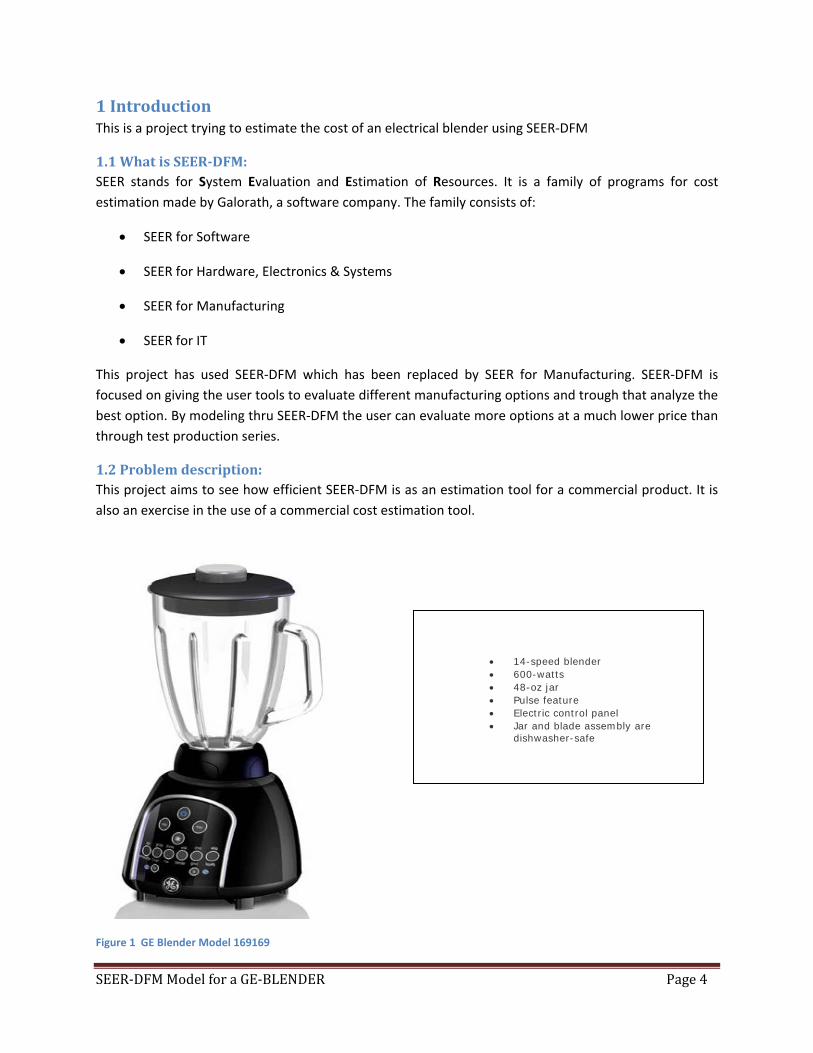
1 Introduction This is a project trying to estimate the cost of an electrical blender using SEER‐DFM
1.1 What is SEERDFM: SEER stands for System Evaluation and Estimation of Resources. It is a family of programs for cost estimation made by Galorath, a software company. The family consists of:
• SEER for Software
• SEER for Hardware, Electronics & Systems
• SEER for Manufacturing
• SEER for IT
This project has used SEER‐DFM which has been replaced by SEER for Manufacturing. SEER‐DFM is focused on giving the user tools to evaluate different manufacturing options and trough that analyze the best option. By modeling thru SEER‐DFM the user can evaluate more options at a much lower price than through test production series.
1.2 Problem description: This project aims to see how efficient SEER‐DFM is as an estimation tool for a commercial product. It is also an exercise in the use of a commercial cost estimation tool.
Figure 1 GE Blender Model 169169
• 14-speed blender • 600-watts • 48-oz jar • Pulse feature • Electric control panel • Jar and blade assembly are
dishwasher-safe
SEER‐DF
2 ProceThe produwith a spimeans thablender w
Figure 2 Sch
The prodquantity o50,000 unfactors fo
Each comapproxim
Table 1 Com
S.No 1 2 3 4 5 6 7 8 9 10
11
M Model for
edure uct chosen fonning blade mat the producwas dissemble
hematic estimat
uction quantof every elemnits of blendr the part ass
mponent waating them as
mponent Weight
Compo Li
IngredieJa
PitcheJar bottom/b
Cog wBla
User intControl
Bo
Mo
a GE‐BLEND
or this projectmade to spin ct is electro‐med into compo
ting breakdown
tity of the bment in the asers. Every esembly contri
as weighed s made from
t and Volume m
onent d ent cap ar r base blade holder wheel de terface l board dy
tor
DER
t is a GE 14‐spby an electric
mechanic andonents in ord
structure
lender assemssembly is 50element was ibution were
and measurthe basic sha
measurements
weight lb 0.29563990.04894263.43612480.09942850.09832620.00705480.0546746
0.1250.068
0.1764
1.875
peed Blender c motor. The incorporatesder to estimat
mbly is consi,000 units as considered tgiven.
red for dimapes.
volume cubic feet0.00338260.00073270.01100830.00151680.00110929.913E‐050.00010953.39E‐054.238E‐050.0026906
0.074
sold by Wal‐motor is cons several mante the cost. A
dered to be every part isto be the pa
ensions. The
Mart. It is bastrolled by a cnufacturing prAs shown in F
50,000 units required forart of assemb
e volume w
Pag
sically a largecircuit board. rocesses. Theigure 2.
s. The produr the productibly and henc
was estimate
ge 5
e jar This e
uction ion of ce the
ed by
SEER‐DFM Model for a GE‐BLENDER Page 6
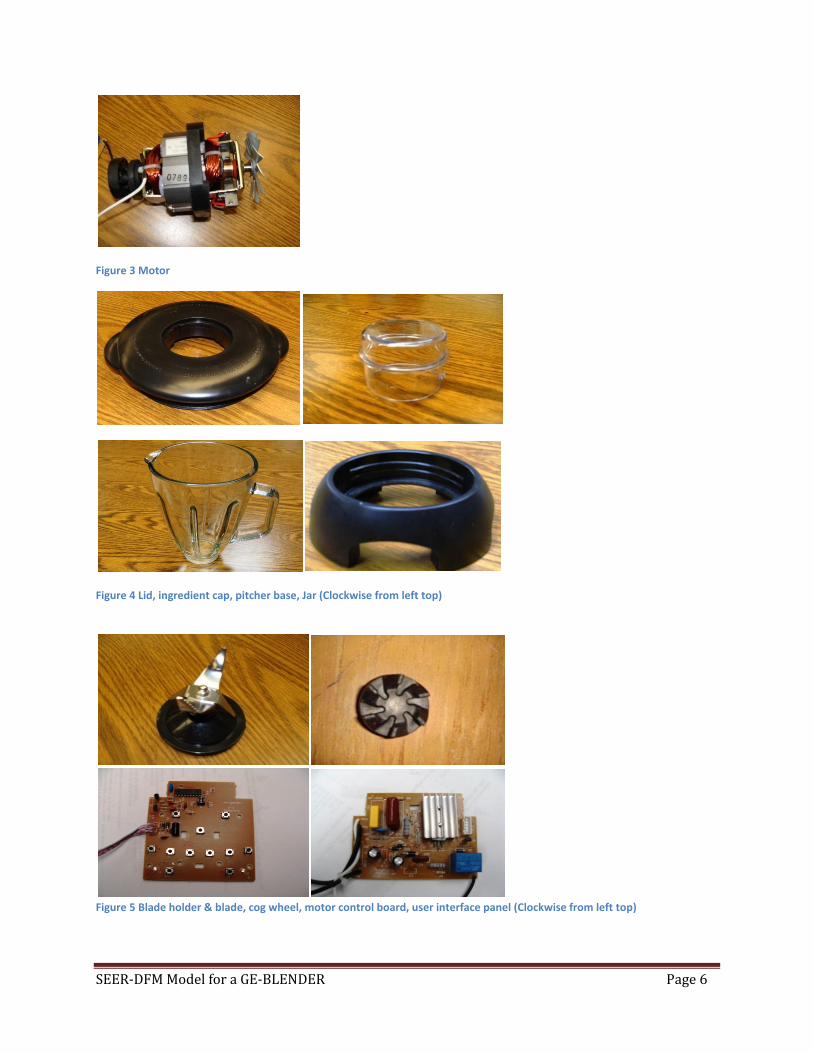
Figure 3 Motor
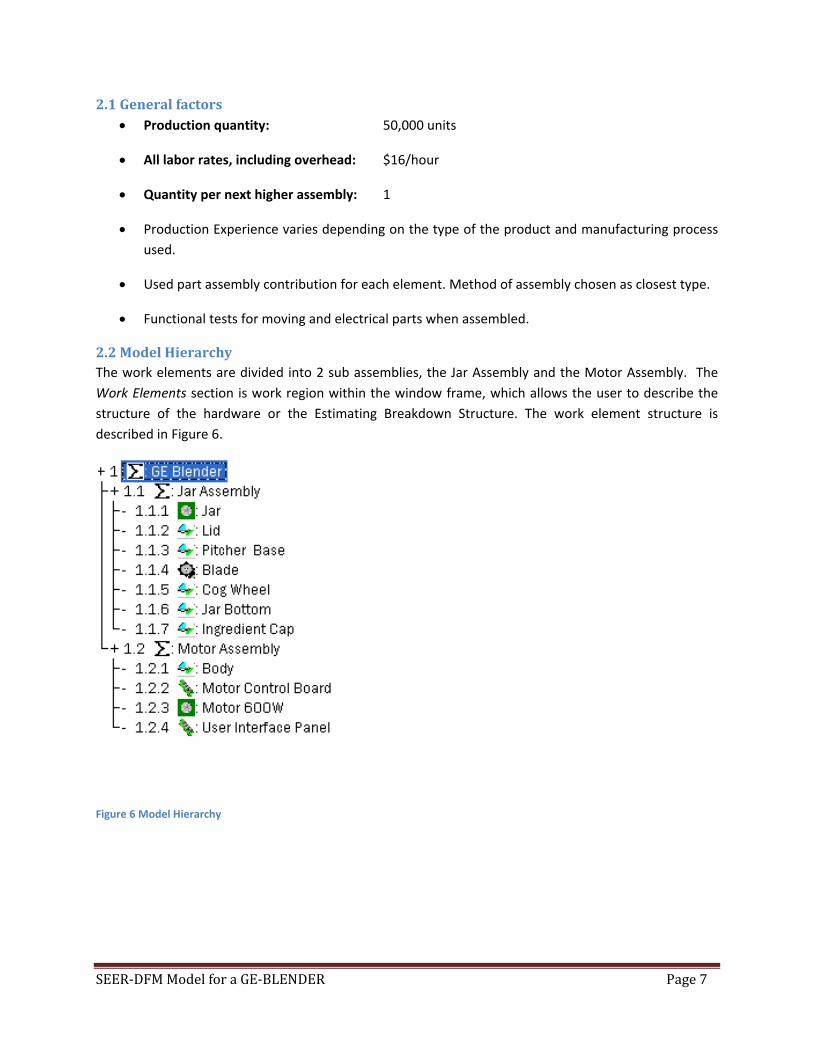
Figure 4 Lid, ingredient cap, pitcher base, Jar (Clockwise from left top)
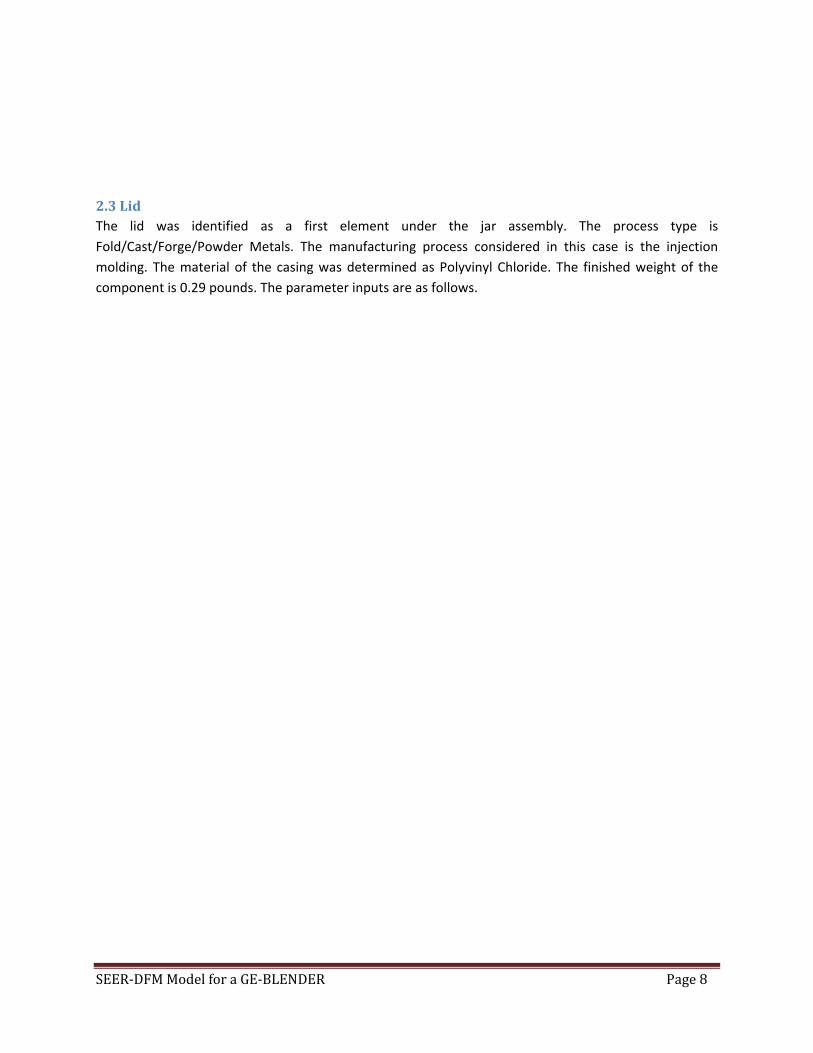
Figure 5 Blade holder & blade, cog wheel, motor control board, user interface panel (Clockwise from left top)
SEER‐DFM Model for a GE‐BLENDER Page 7
2.1 General factors • Production quantity: 50,000 units
• All labor rates, including overhead: $16/hour
• Quantity per next higher assembly: 1
• Production Experience varies depending on the type of the product and manufacturing process used.
• Used part assembly contribution for each element. Method of assembly chosen as closest type.
• Functional tests for moving and electrical parts when assembled.
2.2 Model Hierarchy The work elements are divided into 2 sub assemblies, the Jar Assembly and the Motor Assembly. The Work Elements section is work region within the window frame, which allows the user to describe the structure of the hardware or the Estimating Breakdown Structure. The work element structure is described in Figure 6.
Figure 6 Model Hierarchy
SEER‐DFM Model for a GE‐BLENDER Page 8
2.3 Lid The lid was identified as a first element under the jar assembly. The process type is Fold/Cast/Forge/Powder Metals. The manufacturing process considered in this case is the injection molding. The material of the casing was determined as Polyvinyl Chloride. The finished weight of the component is 0.29 pounds. The parameter inputs are as follows.
SEER‐DFM Model for a GE‐BLENDER Page 9
SEER‐DFM Model for a GE‐BLENDER Page 10
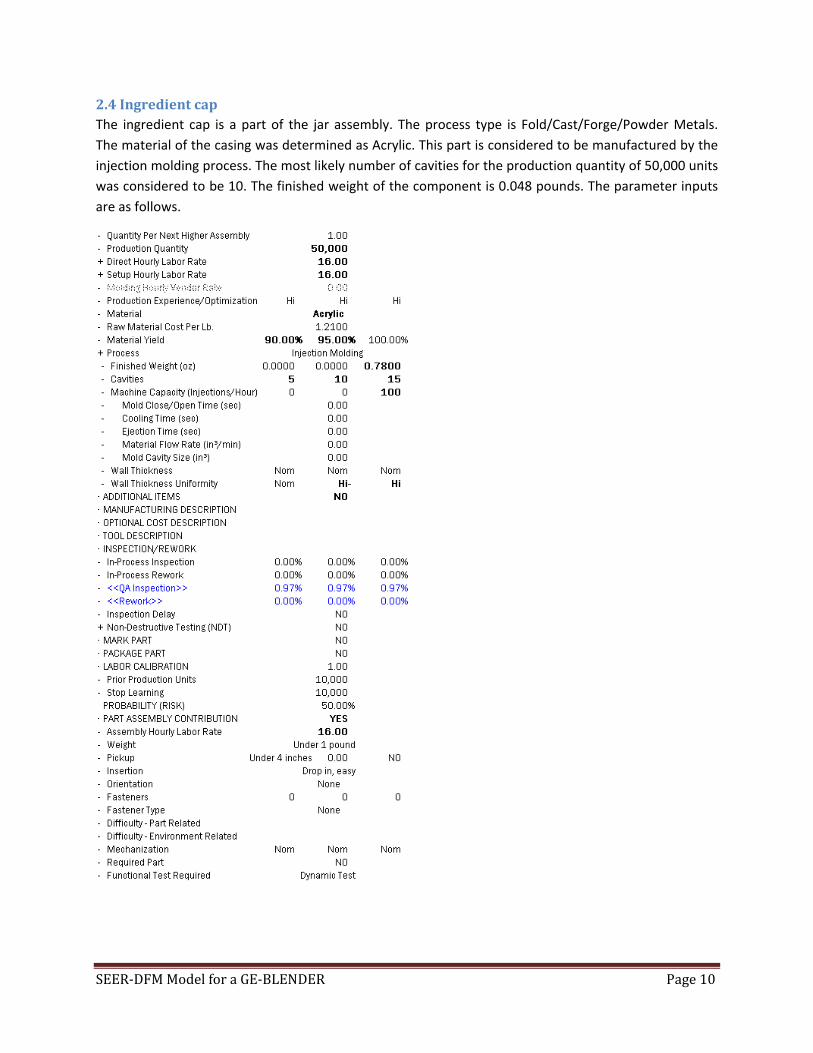
2.4 Ingredient cap The ingredient cap is a part of the jar assembly. The process type is Fold/Cast/Forge/Powder Metals. The material of the casing was determined as Acrylic. This part is considered to be manufactured by the injection molding process. The most likely number of cavities for the production quantity of 50,000 units was considered to be 10. The finished weight of the component is 0.048 pounds. The parameter inputs are as follows.
SEER‐DFM Model for a GE‐BLENDER Page 11
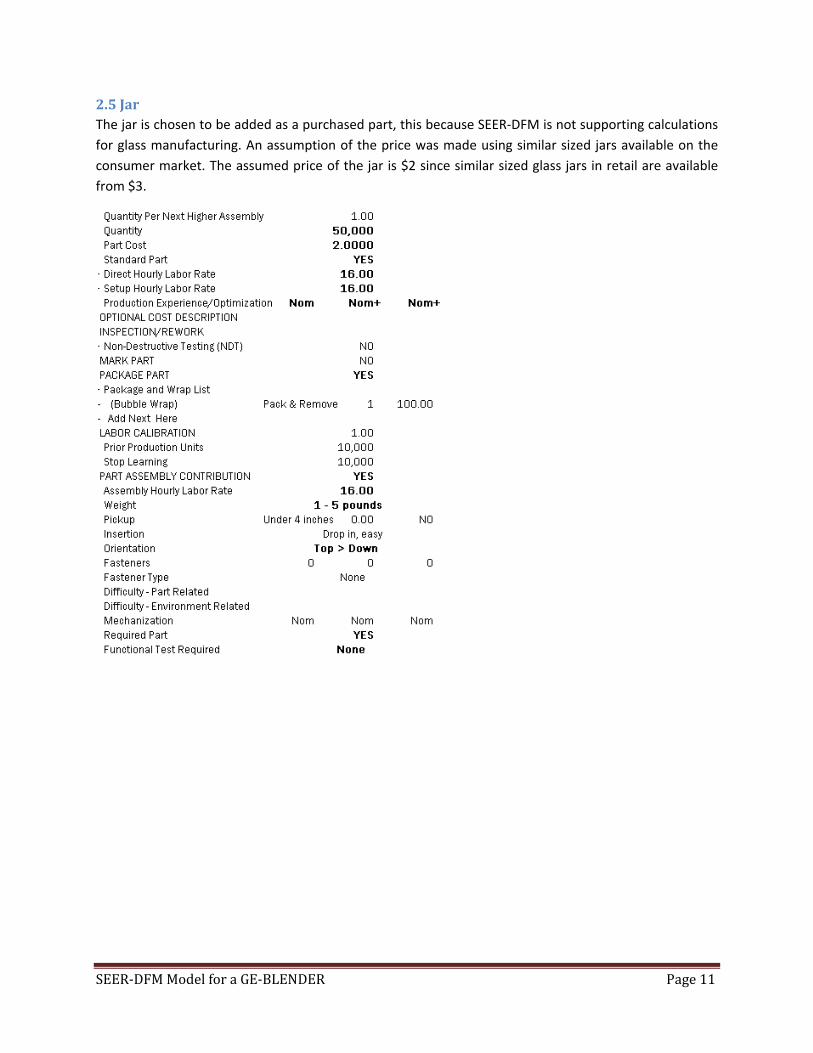
2.5 Jar The jar is chosen to be added as a purchased part, this because SEER‐DFM is not supporting calculations for glass manufacturing. An assumption of the price was made using similar sized jars available on the consumer market. The assumed price of the jar is $2 since similar sized glass jars in retail are available from $3.
SEER‐DFM Model for a GE‐BLENDER Page 12
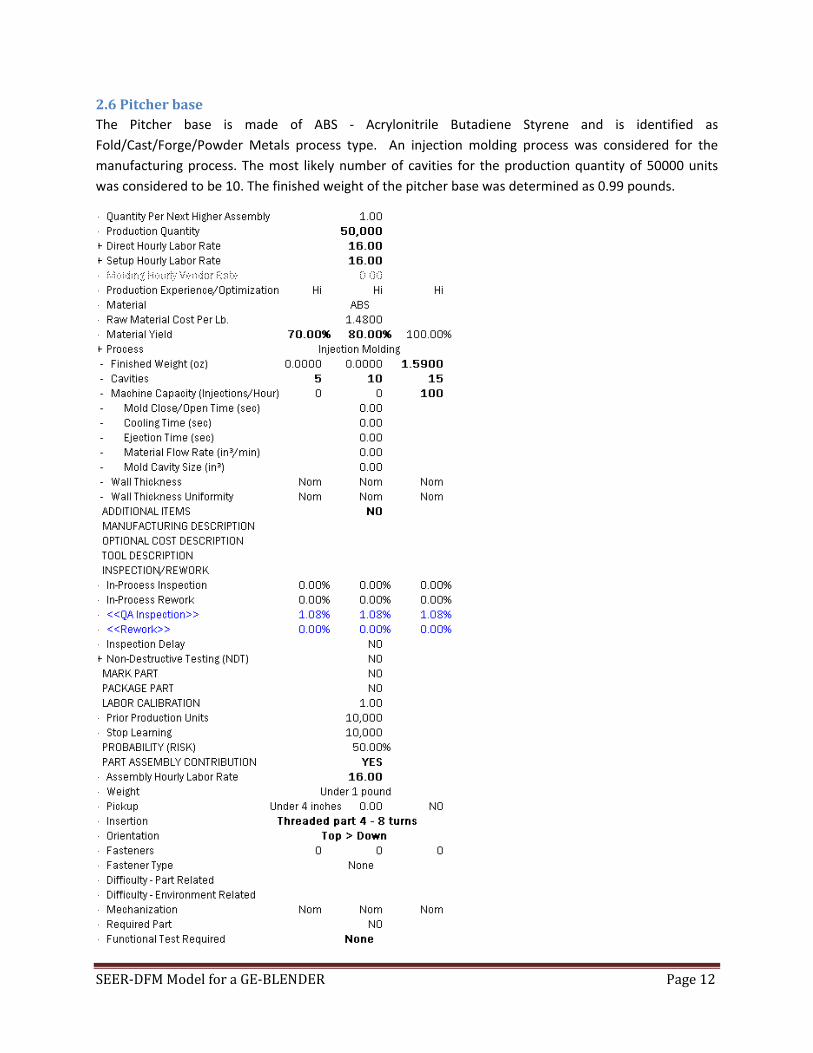
2.6 Pitcher base The Pitcher base is made of ABS ‐ Acrylonitrile Butadiene Styrene and is identified as Fold/Cast/Forge/Powder Metals process type. An injection molding process was considered for the manufacturing process. The most likely number of cavities for the production quantity of 50000 units was considered to be 10. The finished weight of the pitcher base was determined as 0.99 pounds.
SEER‐DFM Model for a GE‐BLENDER Page 13
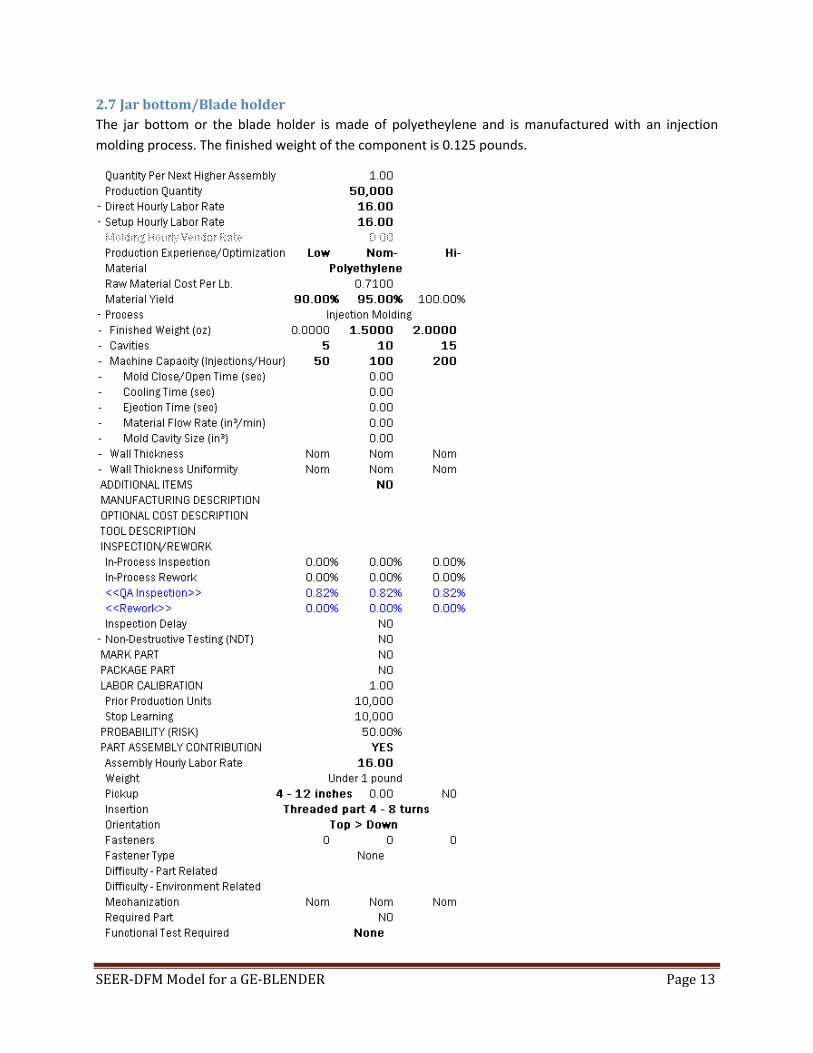
2.7 Jar bottom/Blade holder The jar bottom or the blade holder is made of polyetheylene and is manufactured with an injection molding process. The finished weight of the component is 0.125 pounds.
SEER‐DFM Model for a GE‐BLENDER Page 14
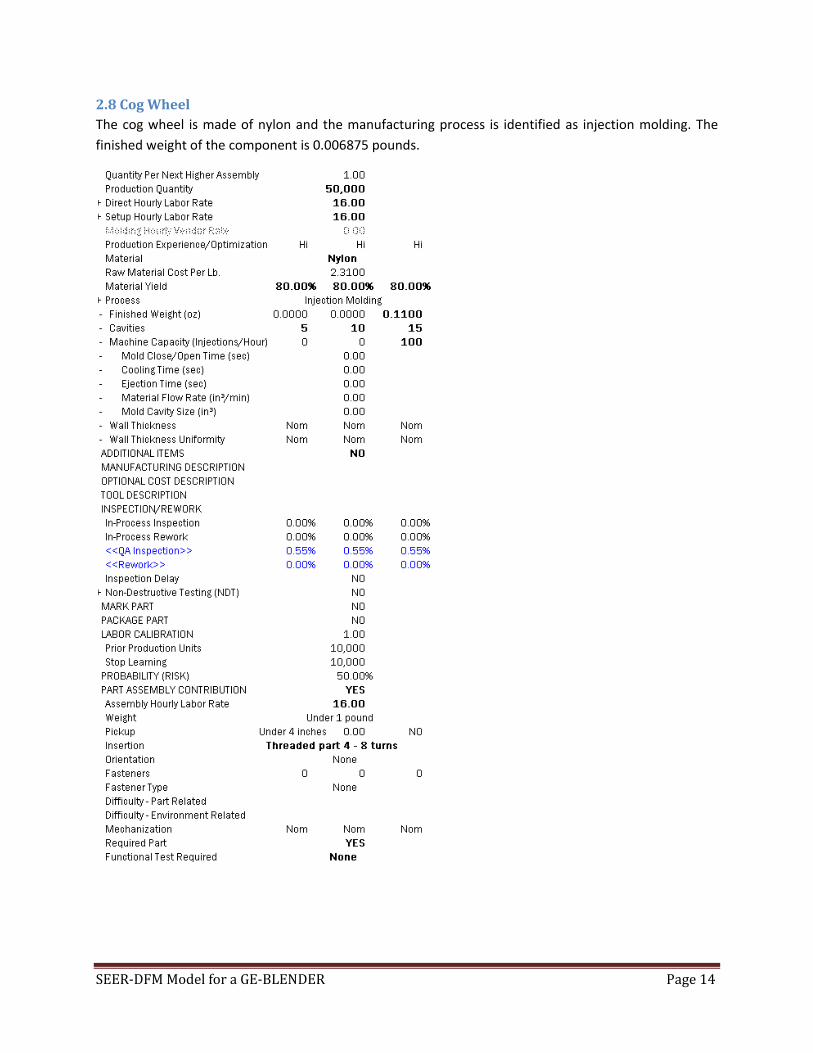
2.8 Cog Wheel The cog wheel is made of nylon and the manufacturing process is identified as injection molding. The finished weight of the component is 0.006875 pounds.
SEER‐DFM Model for a GE‐BLENDER Page 15
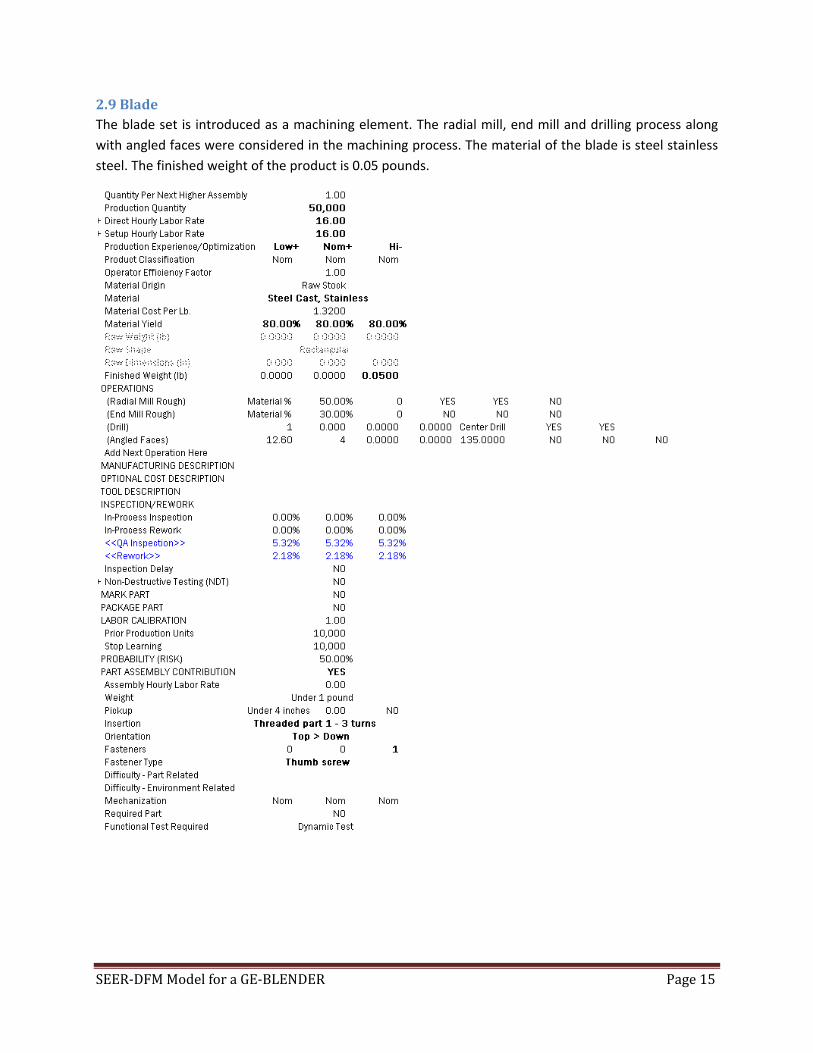
2.9 Blade The blade set is introduced as a machining element. The radial mill, end mill and drilling process along with angled faces were considered in the machining process. The material of the blade is steel stainless steel. The finished weight of the product is 0.05 pounds.
SEER‐DFM Model for a GE‐BLENDER Page 16
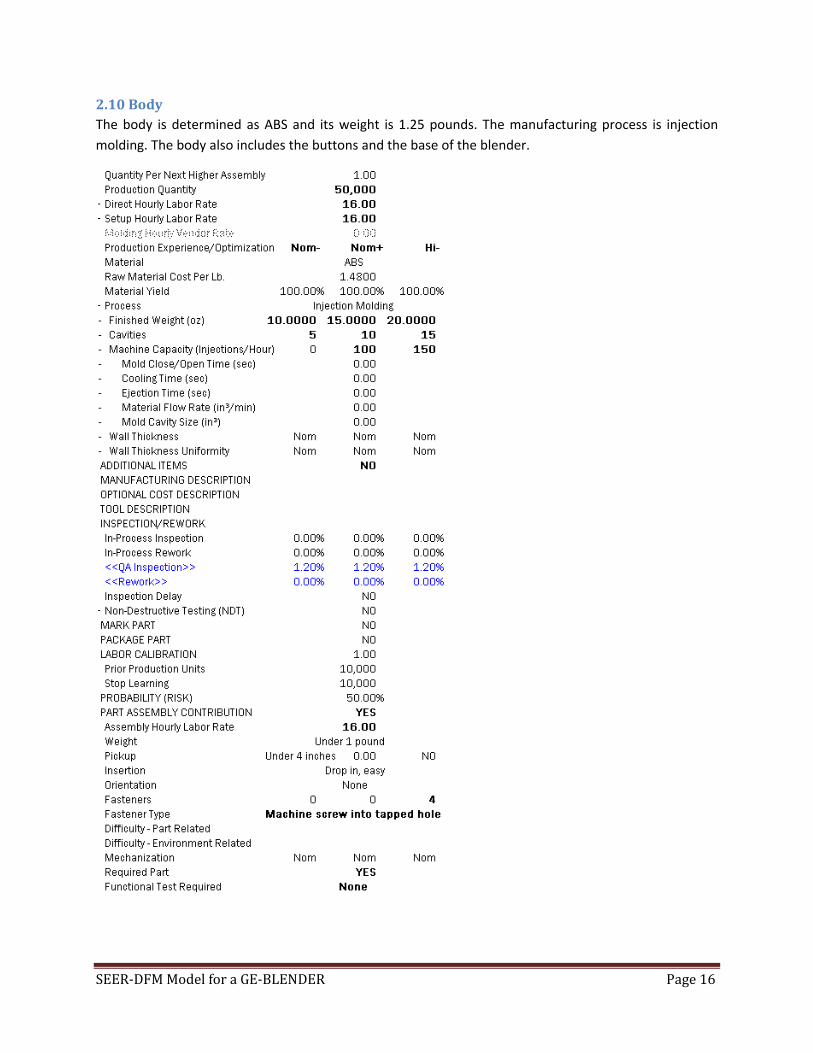
2.10 Body The body is determined as ABS and its weight is 1.25 pounds. The manufacturing process is injection molding. The body also includes the buttons and the base of the blender.
SEER‐DFM Model for a GE‐BLENDER Page 17
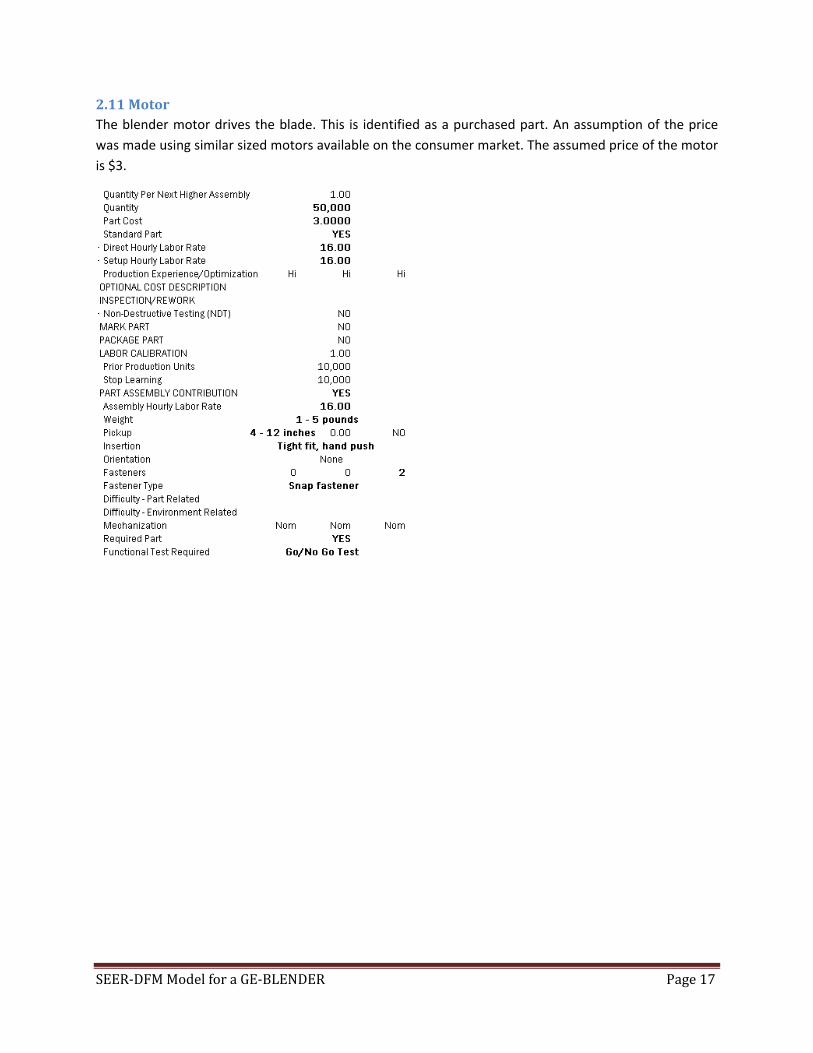
2.11 Motor The blender motor drives the blade. This is identified as a purchased part. An assumption of the price was made using similar sized motors available on the consumer market. The assumed price of the motor is $3.
SEER‐DFM Model for a GE‐BLENDER Page 18
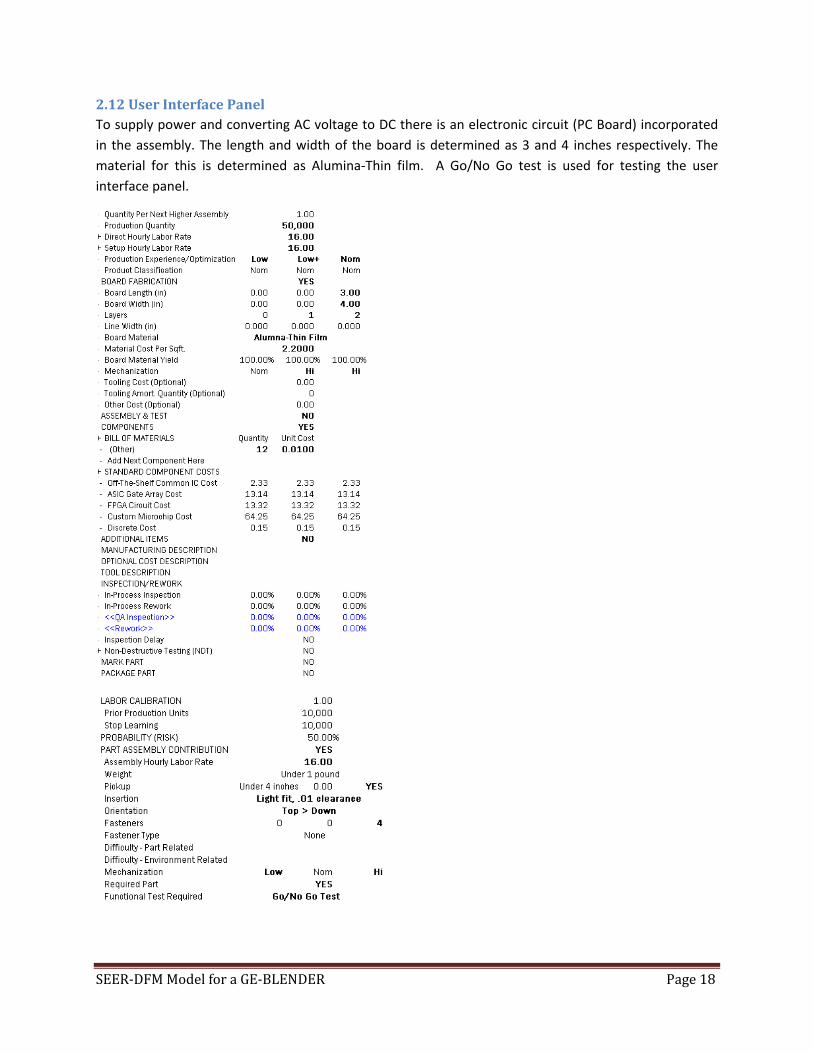
2.12 User Interface Panel To supply power and converting AC voltage to DC there is an electronic circuit (PC Board) incorporated in the assembly. The length and width of the board is determined as 3 and 4 inches respectively. The material for this is determined as Alumina‐Thin film. A Go/No Go test is used for testing the user interface panel.
SEER‐DFM Model for a GE‐BLENDER Page 19
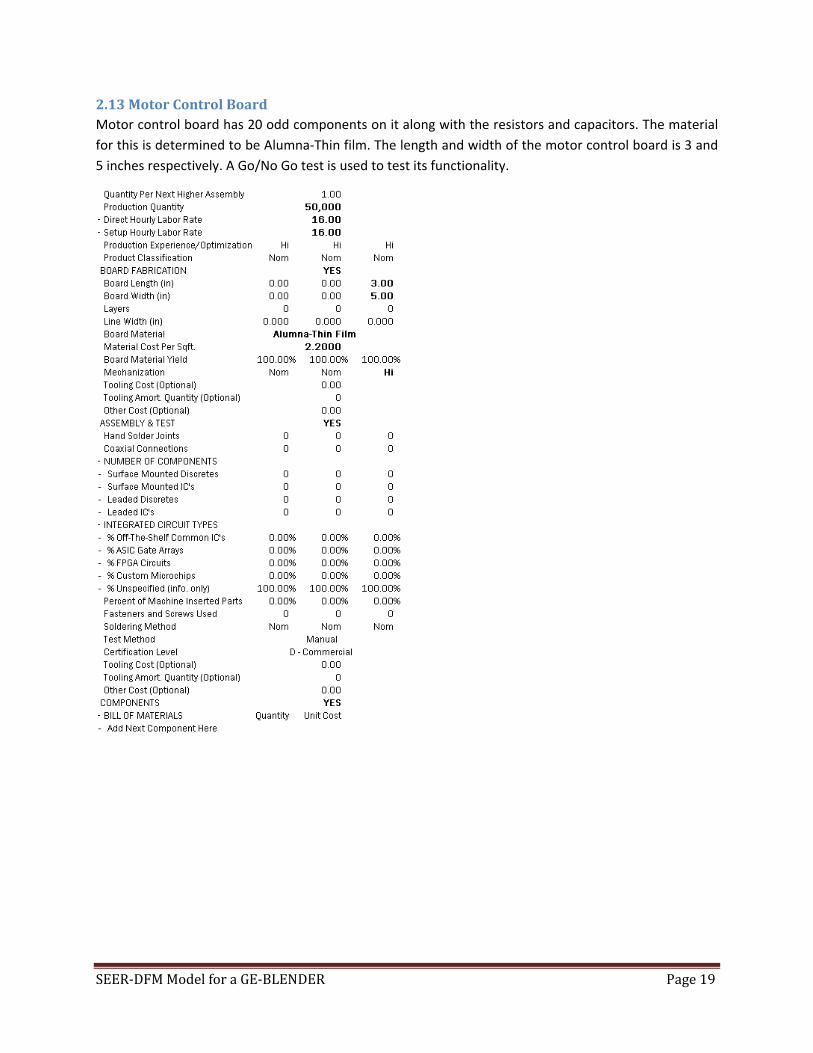
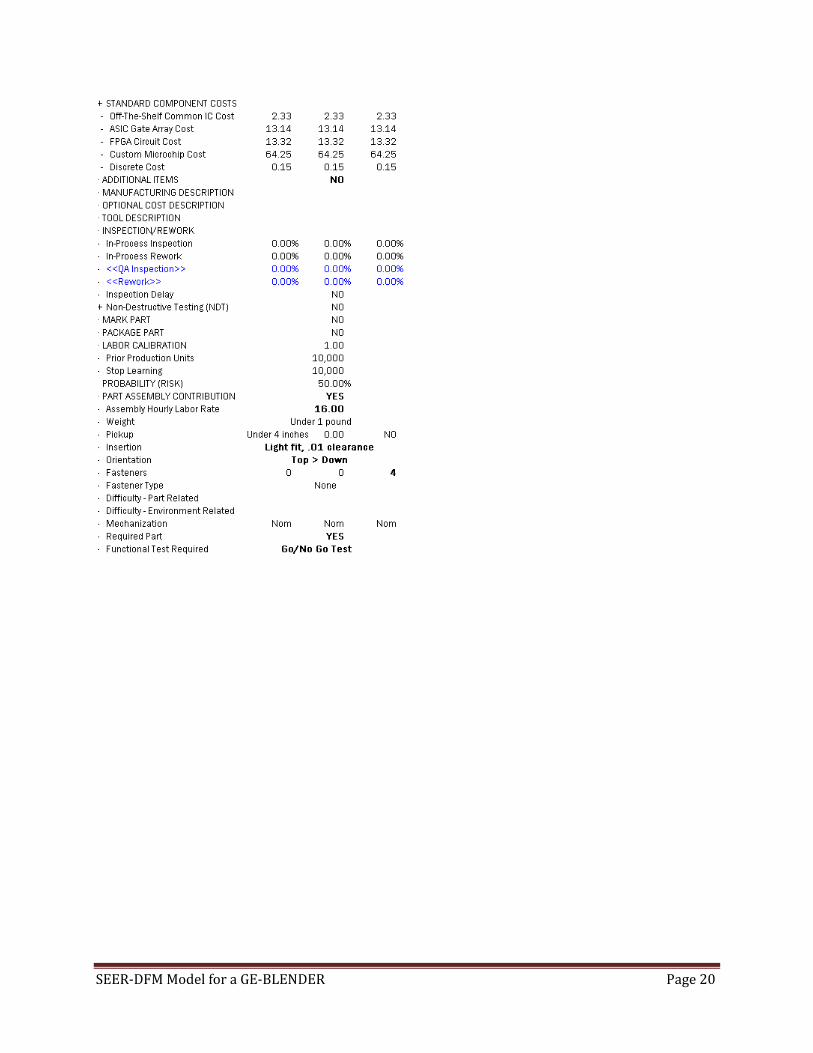
2.13 Motor Control Board Motor control board has 20 odd components on it along with the resistors and capacitors. The material for this is determined to be Alumna‐Thin film. The length and width of the motor control board is 3 and 5 inches respectively. A Go/No Go test is used to test its functionality.
SEER‐DFM Model for a GE‐BLENDER Page 20
SEER‐DFM Model for a GE‐BLENDER Page 21
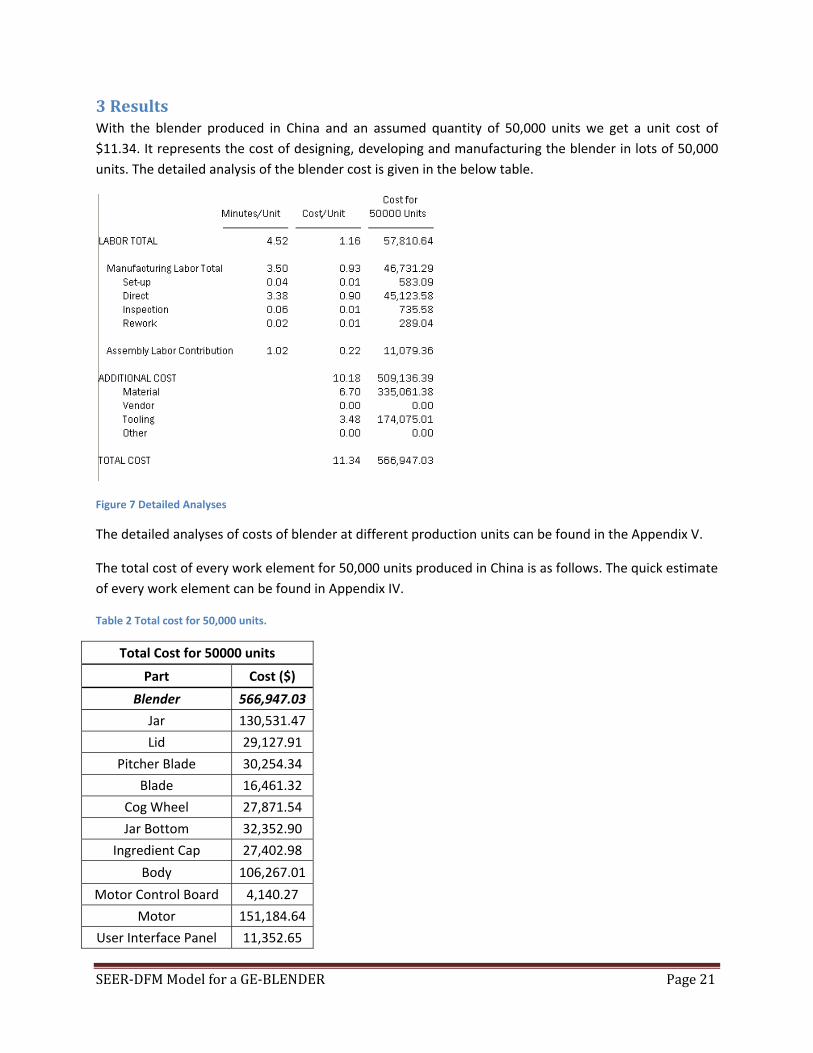
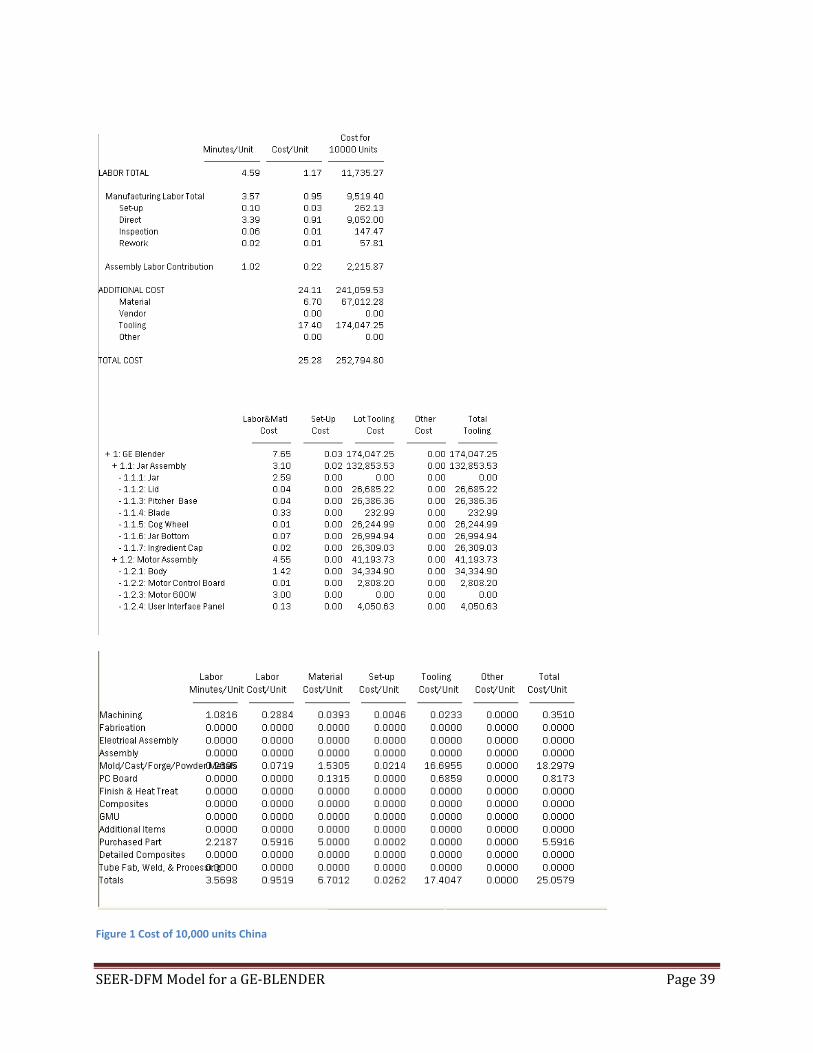
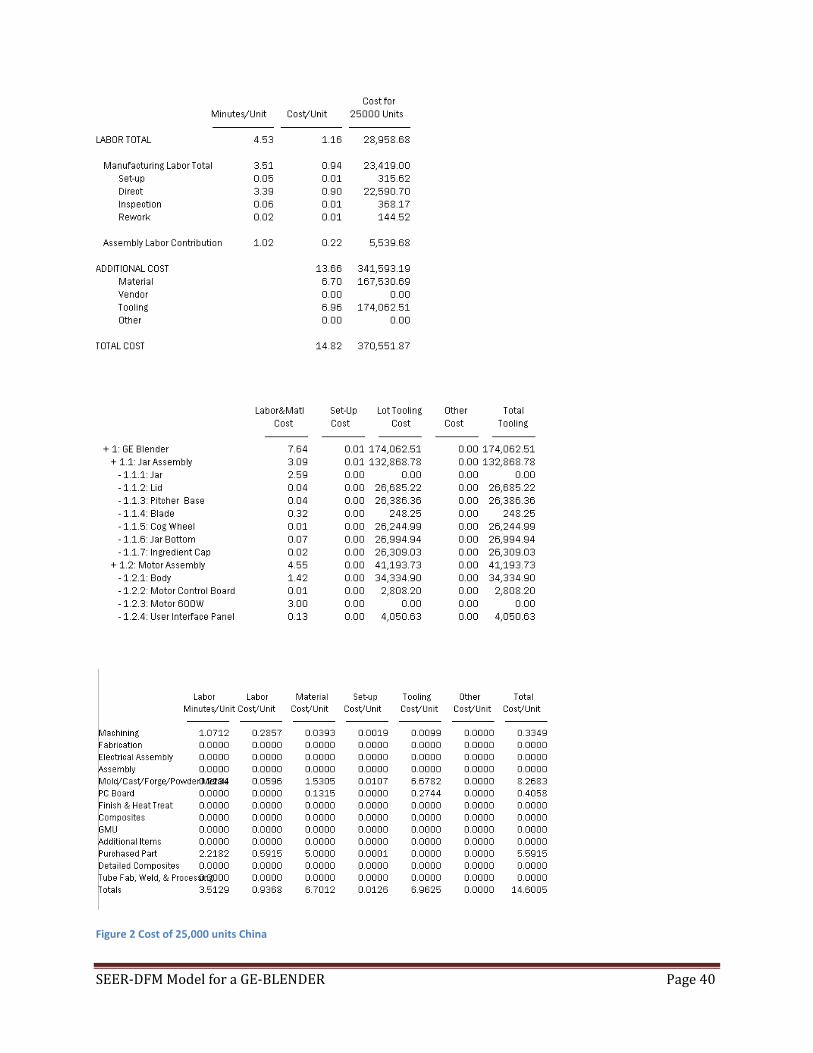
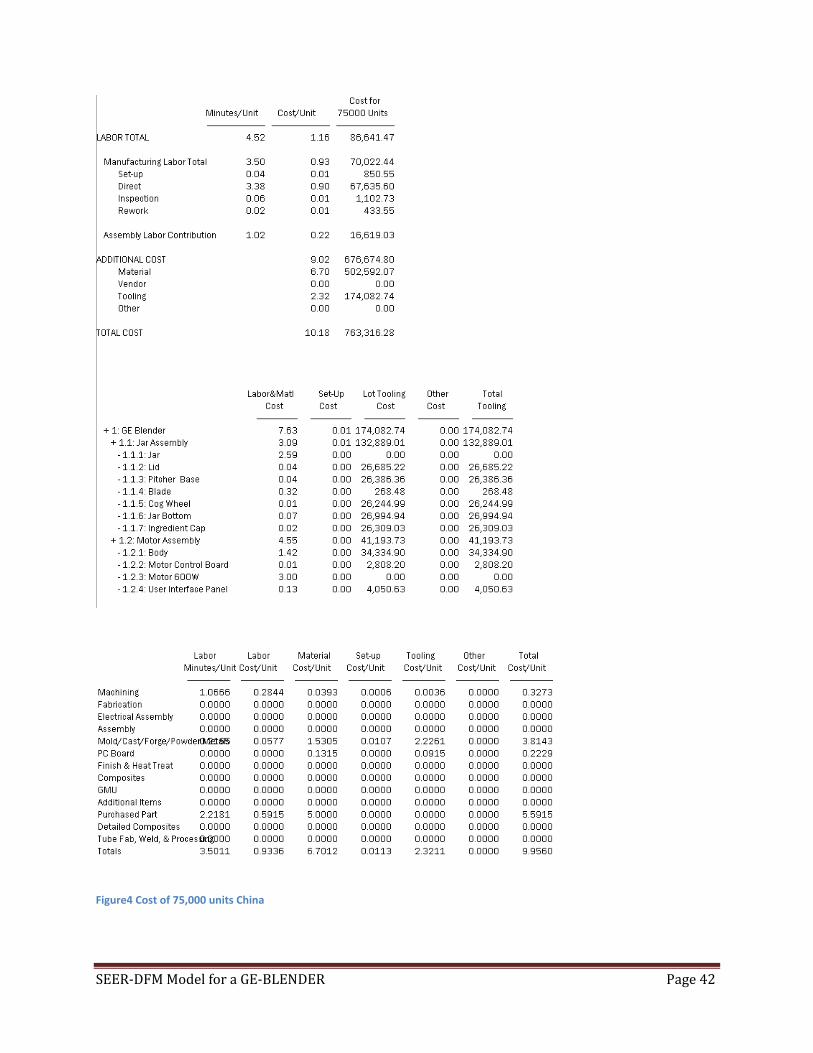
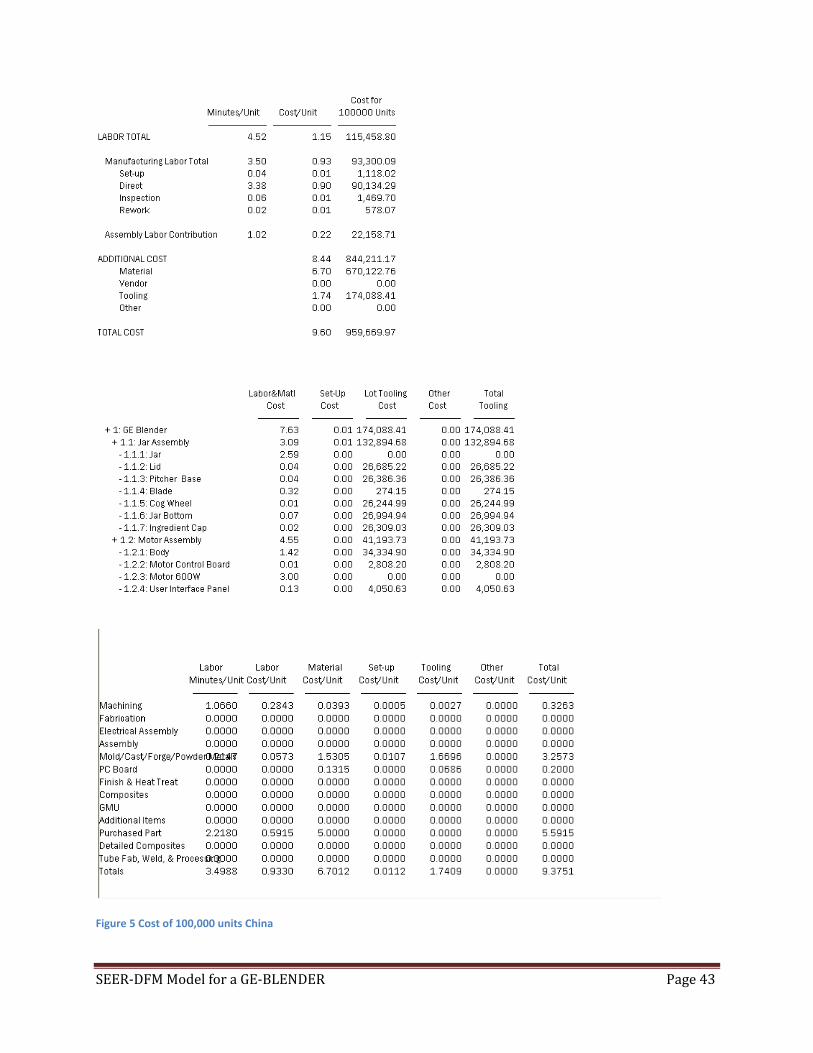
3 Results With the blender produced in China and an assumed quantity of 50,000 units we get a unit cost of $11.34. It represents the cost of designing, developing and manufacturing the blender in lots of 50,000 units. The detailed analysis of the blender cost is given in the below table.
Figure 7 Detailed Analyses
The detailed analyses of costs of blender at different production units can be found in the Appendix V.
The total cost of every work element for 50,000 units produced in China is as follows. The quick estimate of every work element can be found in Appendix IV.
Table 2 Total cost for 50,000 units.
Total Cost for 50000 units
Part Cost ($)
Blender 566,947.03
Jar 130,531.47
Lid 29,127.91
Pitcher Blade 30,254.34
Blade 16,461.32
Cog Wheel 27,871.54
Jar Bottom 32,352.90
Ingredient Cap 27,402.98
Body 106,267.01
Motor Control Board 4,140.27
Motor 151,184.64
User Interface Panel 11,352.65
SEER‐DF
3.1 Grap
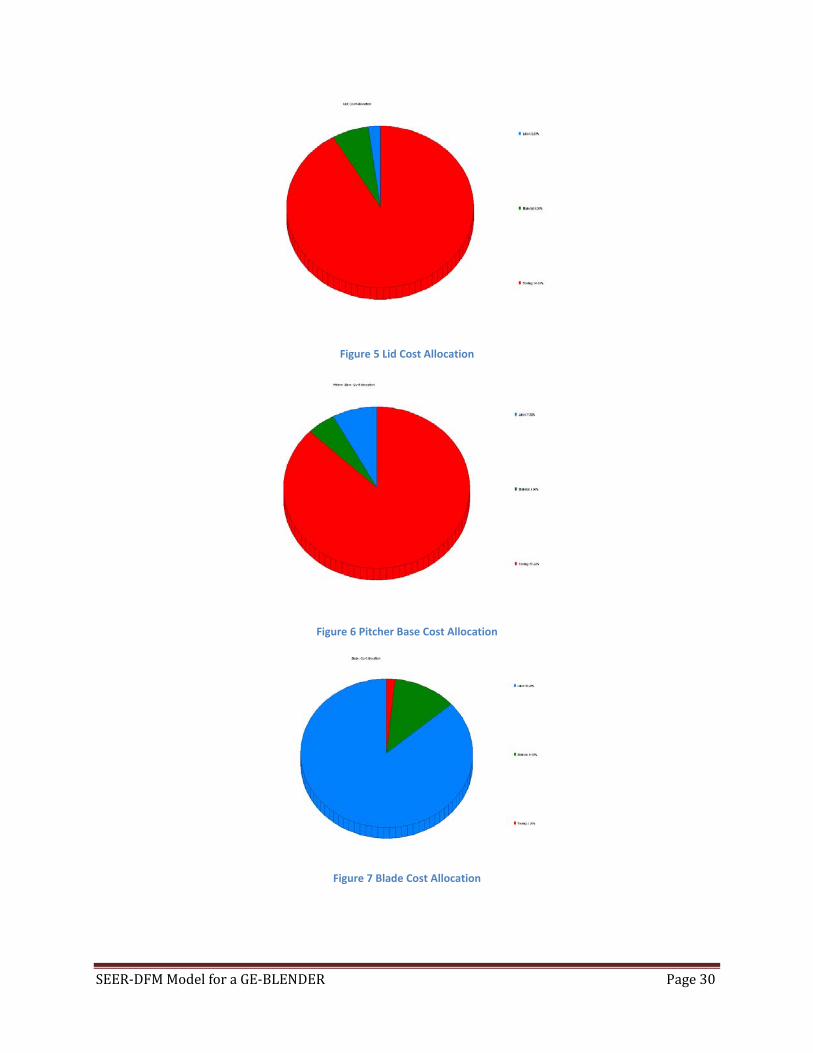
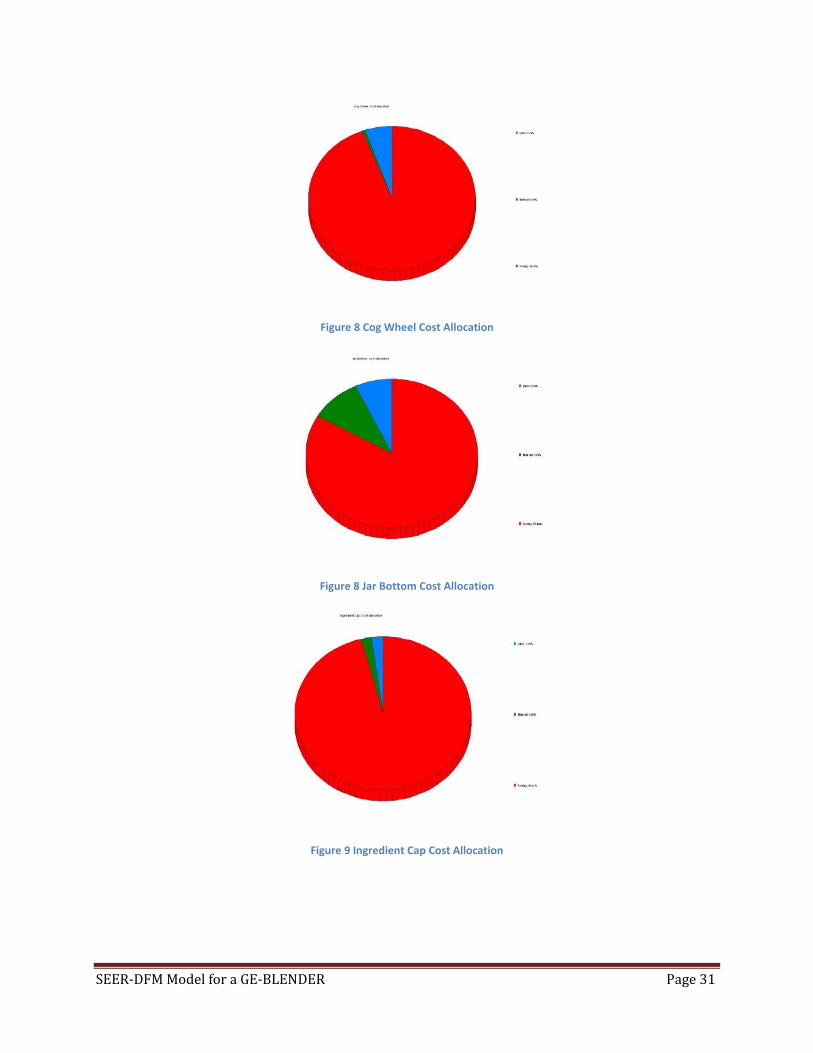
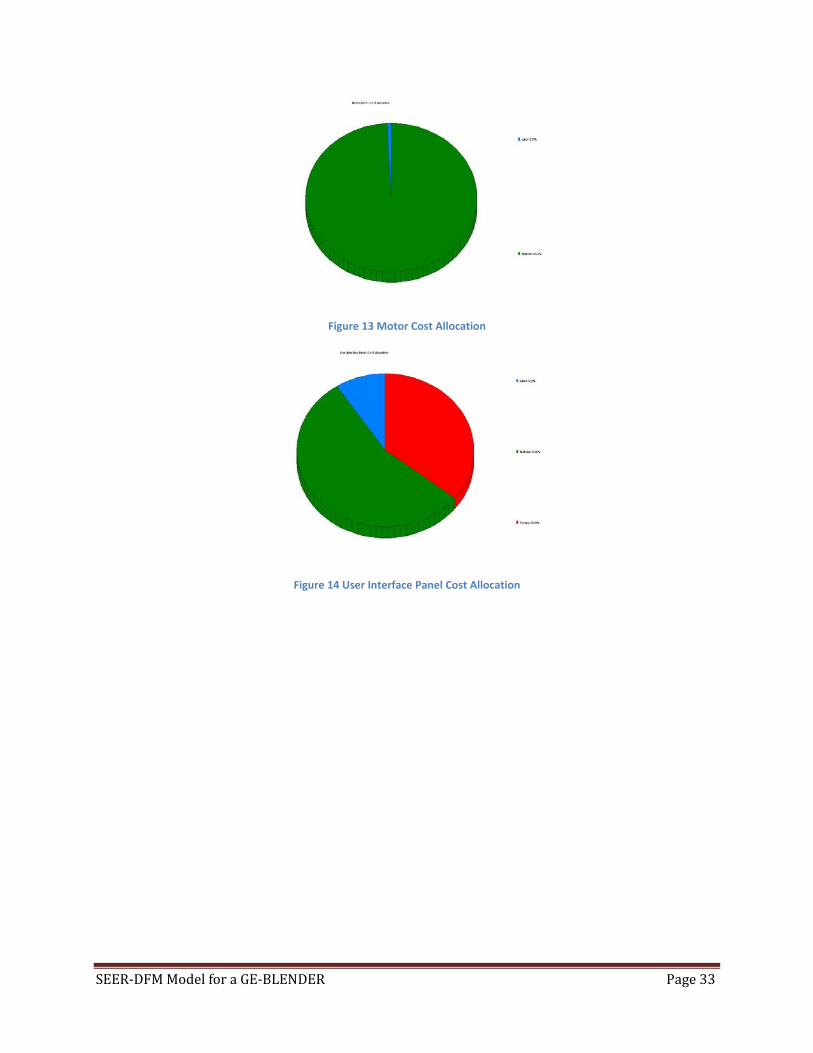
Cost AlloThe SEER‐The Cost A
Figure 8 Cos
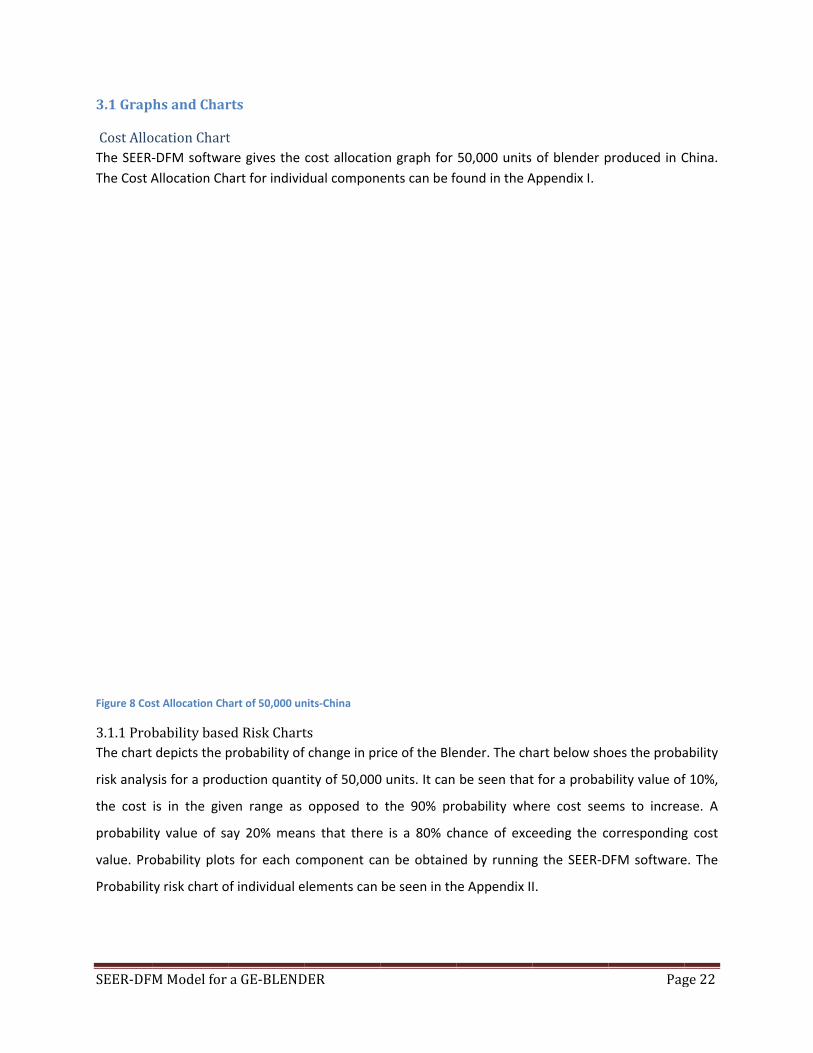
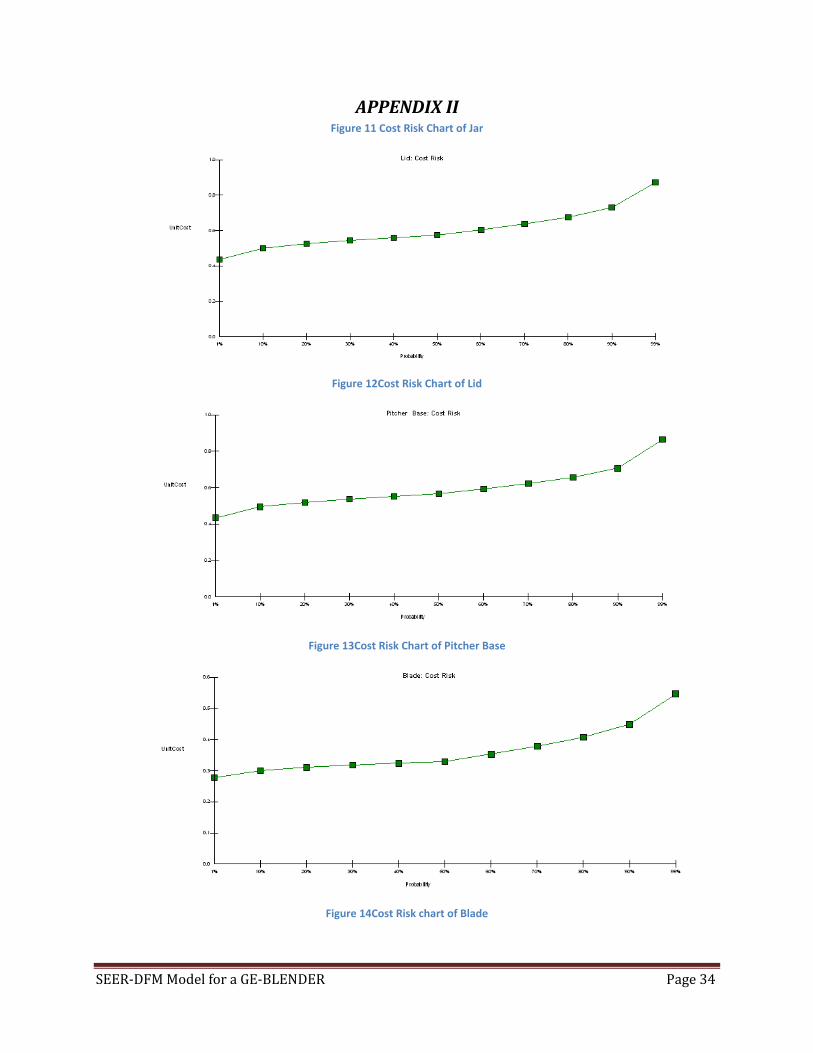
3.1.1 ProbThe chart
risk analy
the cost
probabilit
value. Pro
Probabilit
M Model for
hs and Char
ocation Chart‐DFM softwaAllocation Ch
st Allocation Ch
bability base depicts the p
sis for a prod
is in the giv
ty value of sa
obability plot
ty risk chart o
a GE‐BLEND
rts
t re gives the art for individ
art of 50,000 un
ed Risk Chartprobability of
duction quant
en range as
ay 20% mean
ts for each co
of individual e
DER
cost allocatiodual compon
nits‐China
ts f change in pr
tity of 50,000
opposed to
ns that there
omponent ca
elements can
on graph for ents can be fo
rice of the Ble
0 units. It can
the 90% pro
e is a 80% ch
an be obtaine
be seen in th
50,000 units ound in the A
ender. The ch
be seen that
obability whe
hance of exce
ed by running
he Appendix I
of blender pAppendix I.
art below sho
t for a probab
ere cost see
eeding the c
g the SEER‐D
I.
Pag
produced in C
oes the proba
bility value of
ms to increa
orresponding
DFM software
ge 22
China.
ability
f 10%,
ase. A
g cost
e. The
SEER‐DFM Model for a GE‐BLENDER Page 23
Figure 9 Probability Risk Chart
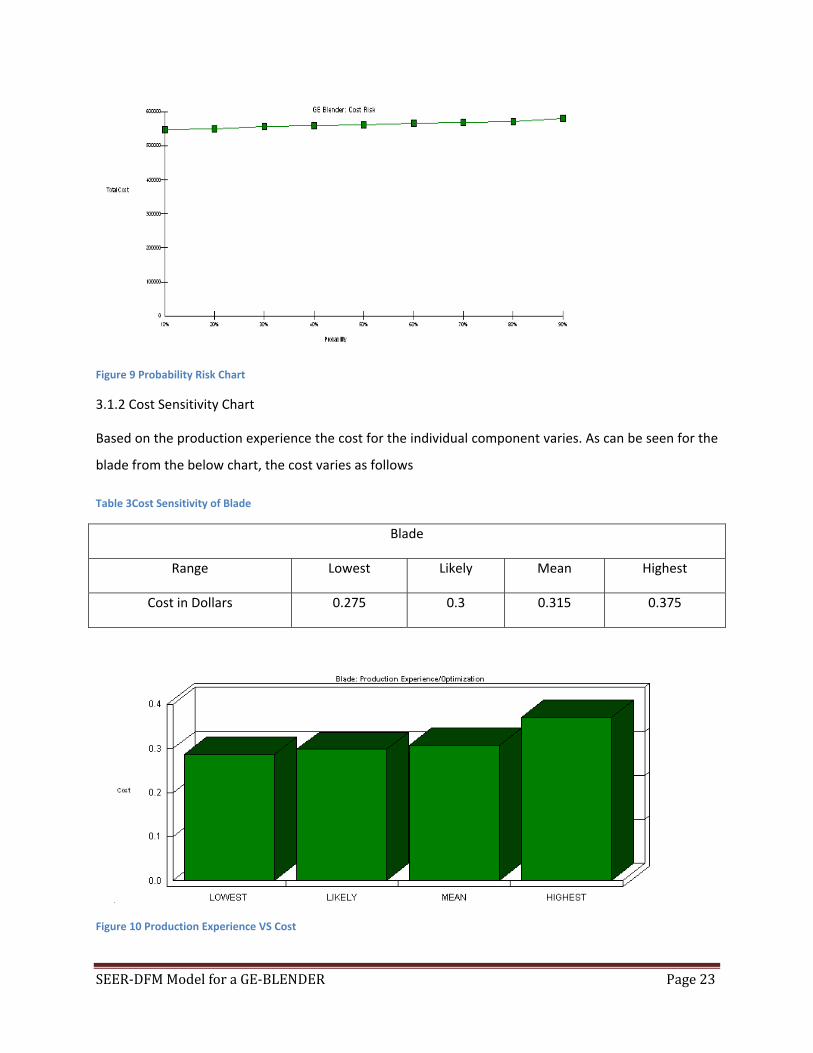
3.1.2 Cost Sensitivity Chart
Based on the production experience the cost for the individual component varies. As can be seen for the
blade from the below chart, the cost varies as follows
Table 3Cost Sensitivity of Blade
Blade
Range Lowest Likely Mean Highest
Cost in Dollars 0.275 0.3 0.315 0.375
Figure 10 Production Experience VS Cost
SEER‐DF
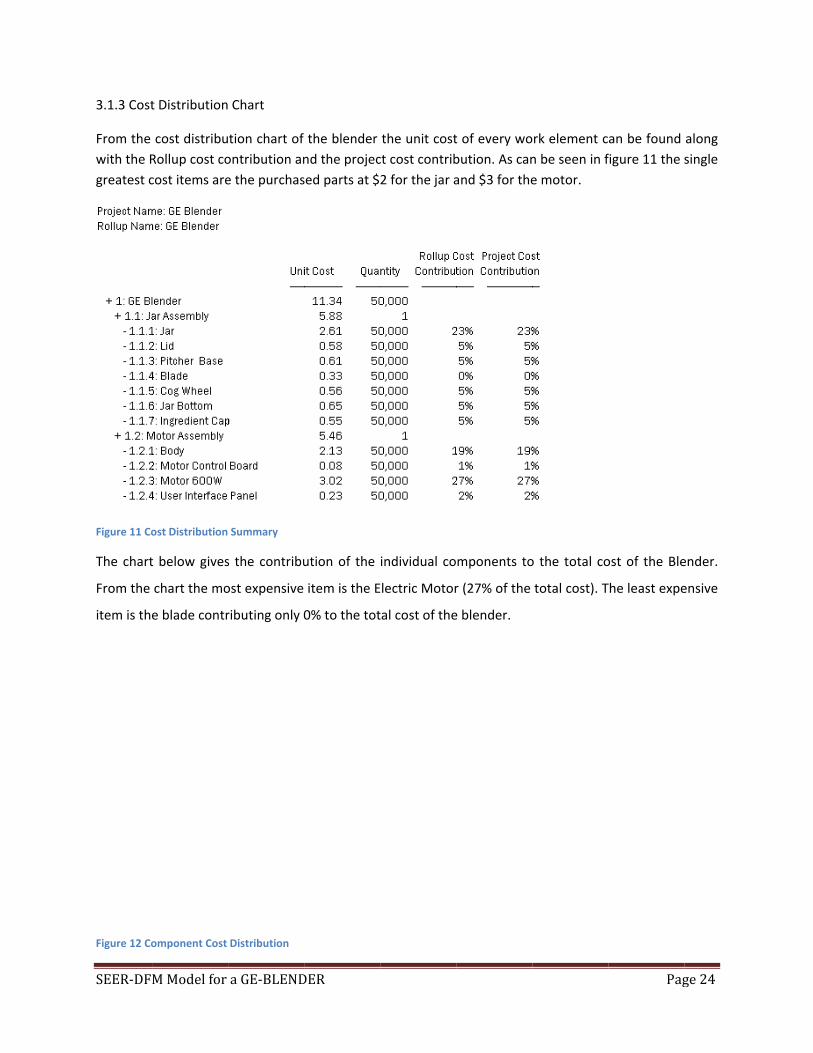
3.1.3 Cost
From the with the Rgreatest c
Figure 11 Co
The chart
From the
item is the
Figure 12 Co
M Model for
t Distribution
cost distribuRollup cost cocost items are
ost Distribution
t below gives
chart the mo
e blade contr
omponent Cost
a GE‐BLEND
Chart
tion chart of ontribution ane the purchas
Summary
s the contribu
ost expensive
ributing only 0
Distribution
DER
the blender nd the projecsed parts at $
ution of the
item is the E
0% to the tot
the unit costct cost contrib2 for the jar a
individual co
Electric Motor
tal cost of the
t of every wobution. As canand $3 for the
mponents to
r (27% of the
e blender.
rk element cn be seen in fe motor.
o the total co
total cost). T
Pag
an be found figure 11 the s
ost of the Ble
The least expe
ge 24
along single
ender.
ensive
SEER‐DFM Model for a GE‐BLENDER Page 25
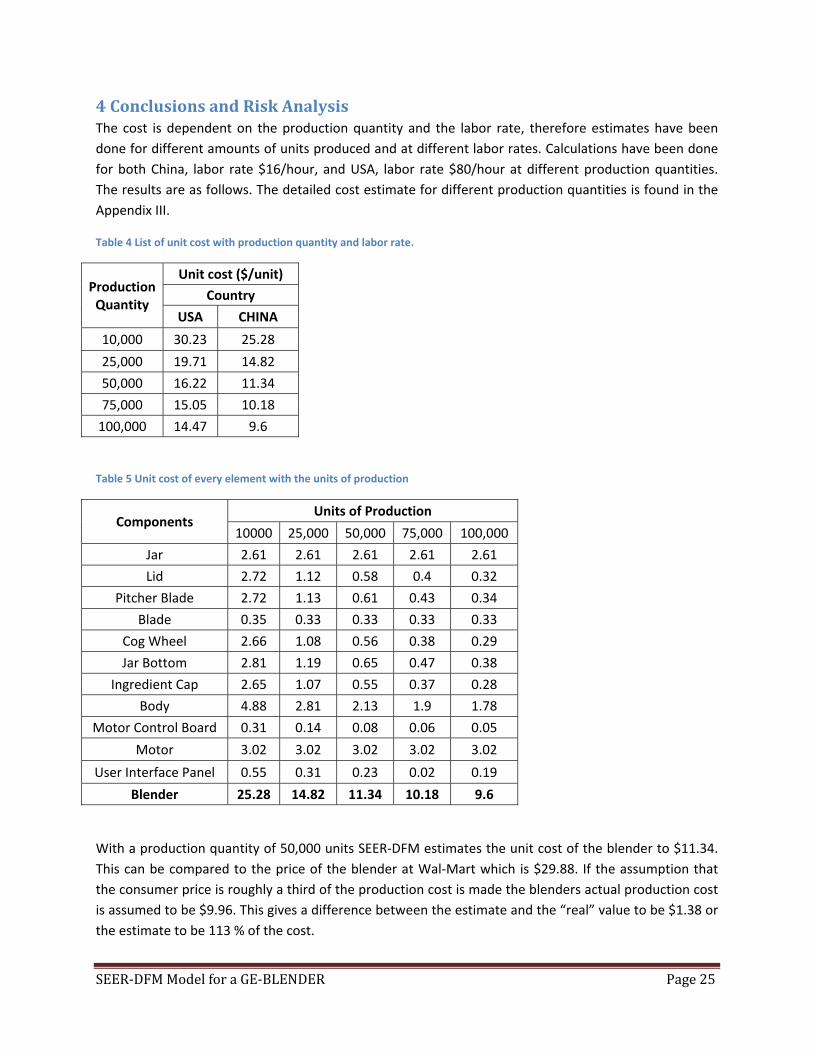
4 Conclusions and Risk Analysis The cost is dependent on the production quantity and the labor rate, therefore estimates have been done for different amounts of units produced and at different labor rates. Calculations have been done for both China, labor rate $16/hour, and USA, labor rate $80/hour at different production quantities. The results are as follows. The detailed cost estimate for different production quantities is found in the Appendix III.
Table 4 List of unit cost with production quantity and labor rate.
Production Quantity
Unit cost ($/unit)
Country
USA CHINA
10,000 30.23 25.28
25,000 19.71 14.82
50,000 16.22 11.34
75,000 15.05 10.18
100,000 14.47 9.6
Table 5 Unit cost of every element with the units of production
Components Units of Production
10000 25,000 50,000 75,000 100,000
Jar 2.61 2.61 2.61 2.61 2.61
Lid 2.72 1.12 0.58 0.4 0.32
Pitcher Blade 2.72 1.13 0.61 0.43 0.34
Blade 0.35 0.33 0.33 0.33 0.33
Cog Wheel 2.66 1.08 0.56 0.38 0.29
Jar Bottom 2.81 1.19 0.65 0.47 0.38
Ingredient Cap 2.65 1.07 0.55 0.37 0.28
Body 4.88 2.81 2.13 1.9 1.78
Motor Control Board 0.31 0.14 0.08 0.06 0.05
Motor 3.02 3.02 3.02 3.02 3.02
User Interface Panel 0.55 0.31 0.23 0.02 0.19
Blender 25.28 14.82 11.34 10.18 9.6
With a production quantity of 50,000 units SEER‐DFM estimates the unit cost of the blender to $11.34. This can be compared to the price of the blender at Wal‐Mart which is $29.88. If the assumption that the consumer price is roughly a third of the production cost is made the blenders actual production cost is assumed to be $9.96. This gives a difference between the estimate and the “real” value to be $1.38 or the estimate to be 113 % of the cost.
SEER‐DFM Model for a GE‐BLENDER Page 26
The reasons for the assumption of a market price three times the production are many. The product needs packaging, shipping and handling to reach the store. Every step in the hierarchy of distribution also involves and adds costs to the product. It is not only the store that shares the difference between production cost and consumer price. In this case, the blender is bought at Wal‐Mart which are famous for low overheads and though negotiations with suppliers. This could mean that we are underestimating the production cost with a third of the consumer price. The production cost could as well be a bit higher.
There are several ways to explain this difference, and it is due to many reasons. The following are some of many:
• Real production cost unknown
• Production quantity unknown
• Production methods etc. unknown
• Inputs in SEER‐DFM estimations
• SEER as a model not perfect
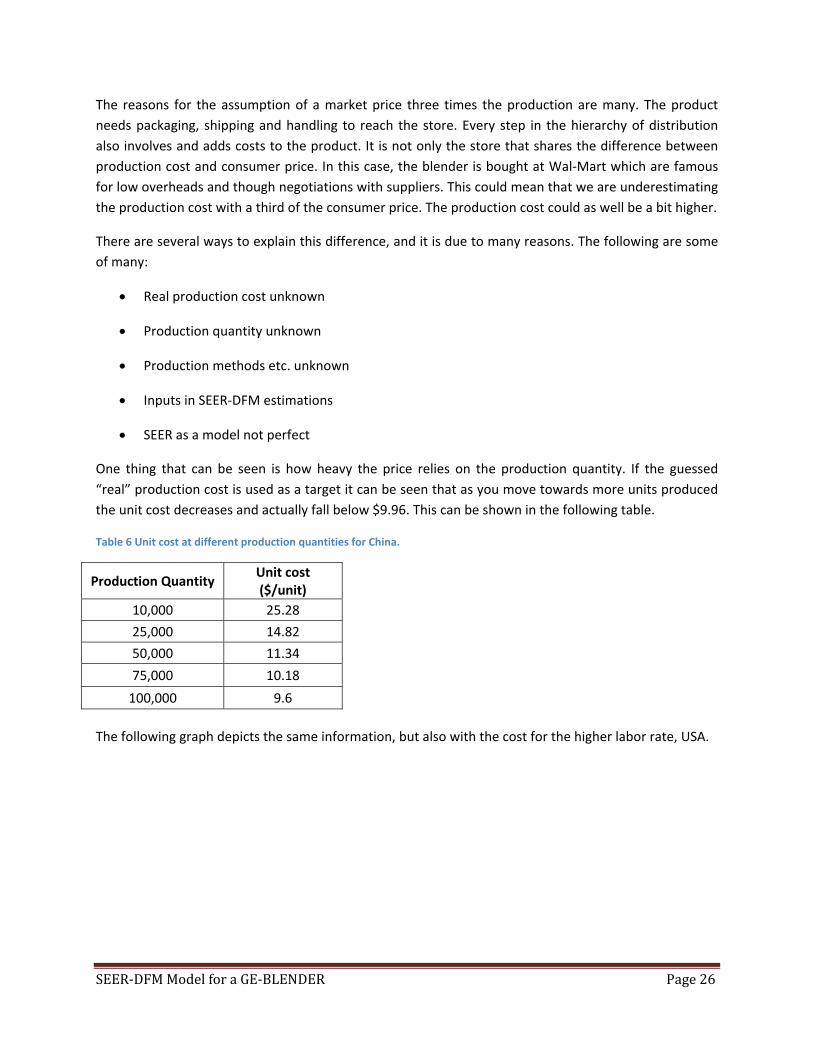
One thing that can be seen is how heavy the price relies on the production quantity. If the guessed “real” production cost is used as a target it can be seen that as you move towards more units produced the unit cost decreases and actually fall below $9.96. This can be shown in the following table.
Table 6 Unit cost at different production quantities for China.
Production Quantity Unit cost ($/unit)
10,000 25.28
25,000 14.82
50,000 11.34
75,000 10.18
100,000 9.6 The following graph depicts the same information, but also with the cost for the higher labor rate, USA.
SEER‐DF
Figure 6 Un
As can beinvestmenthe same part of th
One way t
Table 7 Cos
Par
Blen
Li
Pitche
Bla
Cog W
Jar Bo
Ingredie
Bo
Motor Con
User Interf
Ja
Mo This tablefactors cothe largesincludes t
If the conare the ja
M Model for
it cost plotted a
e seen the unts required degree of aue unit cost pe
to see how th
ts of 50,000 uni
rts
nder
d
r Base
ade
Wheel
ottom
ent Cap
dy
ntrol Board
face Panel
ar
otor
e shows howontribution tost part of thethe labor and
tribution of tr, motor, and
a GE‐BLEND
against producti
unit cost dropare more or utomation is aer unit since m
he costs are d
ts produced in C
Labor cost
1.16
0.01
0.05
0.28
0.03
0.04
0.01
0.05
0.02
0.02
0.61
0.09
w the costs ao the total cose material cotooling costs
the different d the body i.e
DER
ion quantity.
ps with an inless the samassumed. So,more units ar
distributed is
China for the dif
C
Material cost 6.7
0.04
0.03
0.04
0.002688
0.06
0.01
1.39
0.01
0.13
2
3
are distributest of the prodst and of thes for the subc
parts are con. the main pla
ncreased proe no matter the molds are sharing the
to look at the
fferent part divi
Cost per Part
Tooling cost 3.48
0.53
0.53
0.01
0.52
0.54
0.53
0.69
0.06
0.08
0
0
ed between duct. As can be total cost aontractor del
nsidered it is astic casing.
oduction quaof the amounnd other fixee investments
e costs for the
ided in to labor,
t
Labor cost %
10.23
0.09
0.44
2.47
0.26
0.35
0.09
0.44
0.18
0.18
5.38
0.79
the differentbe seen the ps well. This islivering the p
seen that the
ntity. This is nt of units prd investments.
e consisting u
, material and to
Material Cost % 59.08
0.35
0.26
0.35
0.02
0.53
0.09
12.26
0.09
1.15
17.64
26.46
t parts. The purchased pars expected siarts.
e three major
Pag
natural sincroduced as lots become a
units.
ooling costs.
Tooling C%
30.69
4.67
4.67
0.09
4.59
4.76
4.67
6.08
0.53
0.71
0.00
0.00
percentage irts contributeince that cos
r cost compo
ge 27
ce the ong as lesser
Cost
9
is the e with t also
nents
SEER‐DFM Model for a GE‐BLENDER Page 28
Going back to Table 4 the unit cost is more in USA compared to China as the labor cost are higher in USA. This leads to a higher cost for the product if it is made in the USA. It is likely that there is more automation involved in USA production plants than in China which might contribute to a lower cost on high volume products i.e. if the product is to be produced in USA a higher automation level is required to get a competitive production cost.
SEER‐DFM Model for a GE‐BLENDER Page 29
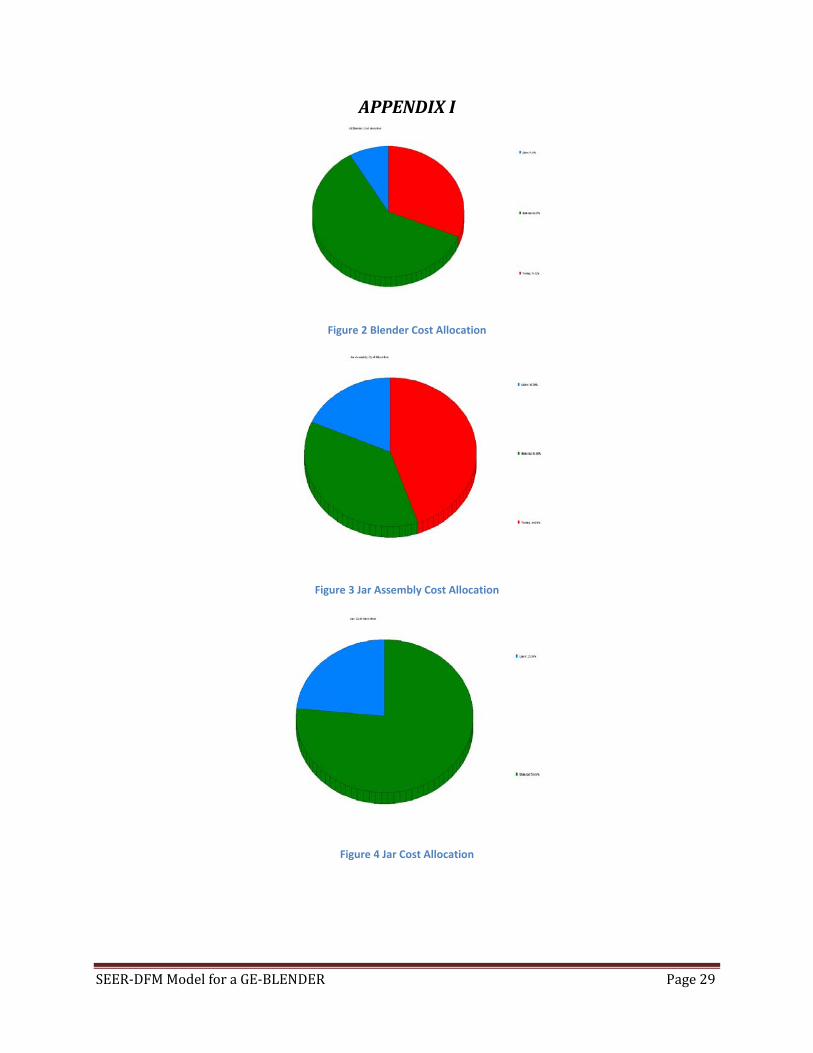
APPENDIX I
Figure 2 Blender Cost Allocation
Figure 3 Jar Assembly Cost Allocation
Figure 4 Jar Cost Allocation
SEER‐DFM Model for a GE‐BLENDER Page 30
Figure 5 Lid Cost Allocation
Figure 6 Pitcher Base Cost Allocation
Figure 7 Blade Cost Allocation
SEER‐DFM Model for a GE‐BLENDER Page 31
Figure 8 Cog Wheel Cost Allocation
Figure 8 Jar Bottom Cost Allocation
Figure 9 Ingredient Cap Cost Allocation

SEER‐DFM Model for a GE‐BLENDER Page 32
Figure 10 Motor Assembly Cost Allocation
Figure 10 Body Cost Allocation
Figure 12 Motor Control Board Cost Allocation
SEER‐DFM Model for a GE‐BLENDER Page 33
Figure 13 Motor Cost Allocation
Figure 14 User Interface Panel Cost Allocation
SEER‐DFM Model for a GE‐BLENDER Page 34
APPENDIX II Figure 11 Cost Risk Chart of Jar
Figure 12Cost Risk Chart of Lid
Figure 13Cost Risk Chart of Pitcher Base
Figure 14Cost Risk chart of Blade
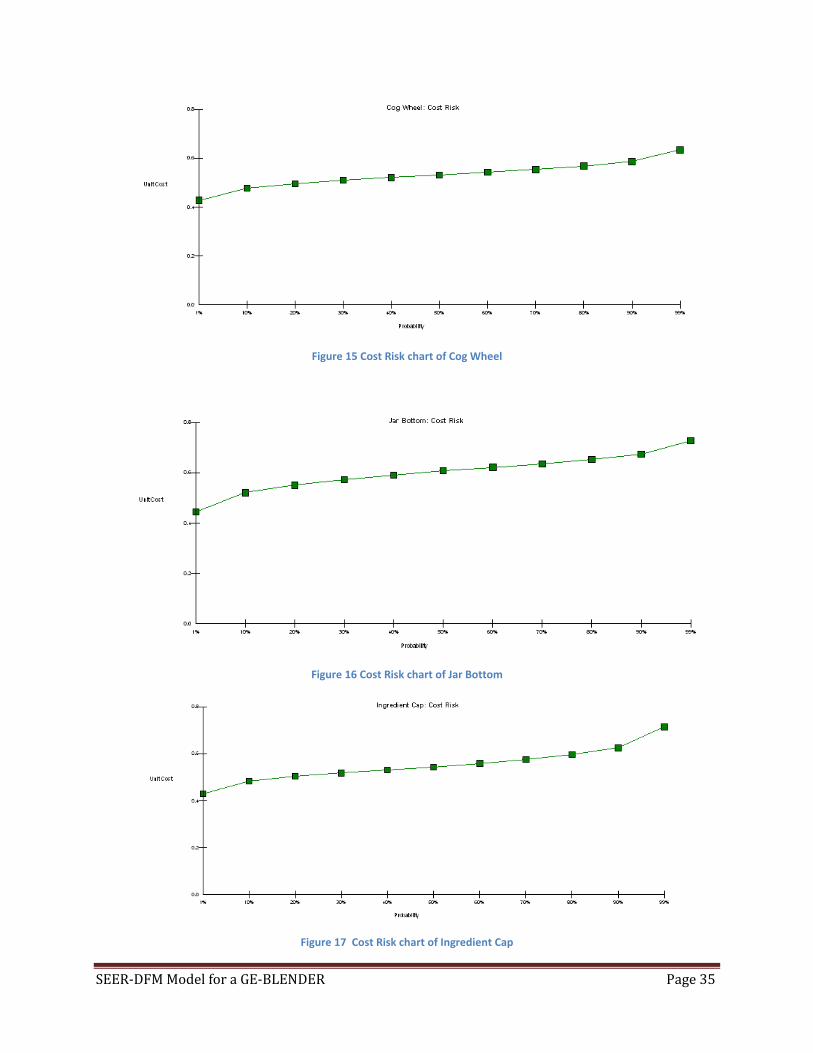
SEER‐DFM Model for a GE‐BLENDER Page 35
Figure 15 Cost Risk chart of Cog Wheel
Figure 16 Cost Risk chart of Jar Bottom
Figure 17 Cost Risk chart of Ingredient Cap
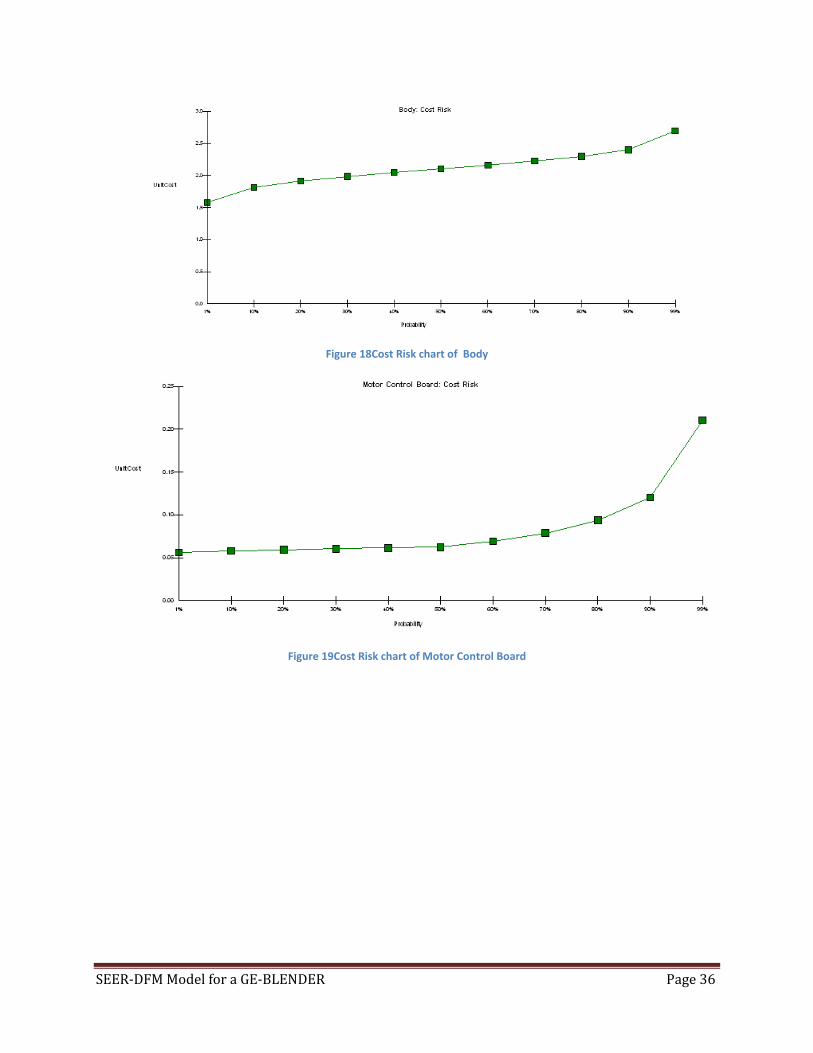
SEER‐DFM Model for a GE‐BLENDER Page 36
Figure 18Cost Risk chart of Body
Figure 19Cost Risk chart of Motor Control Board
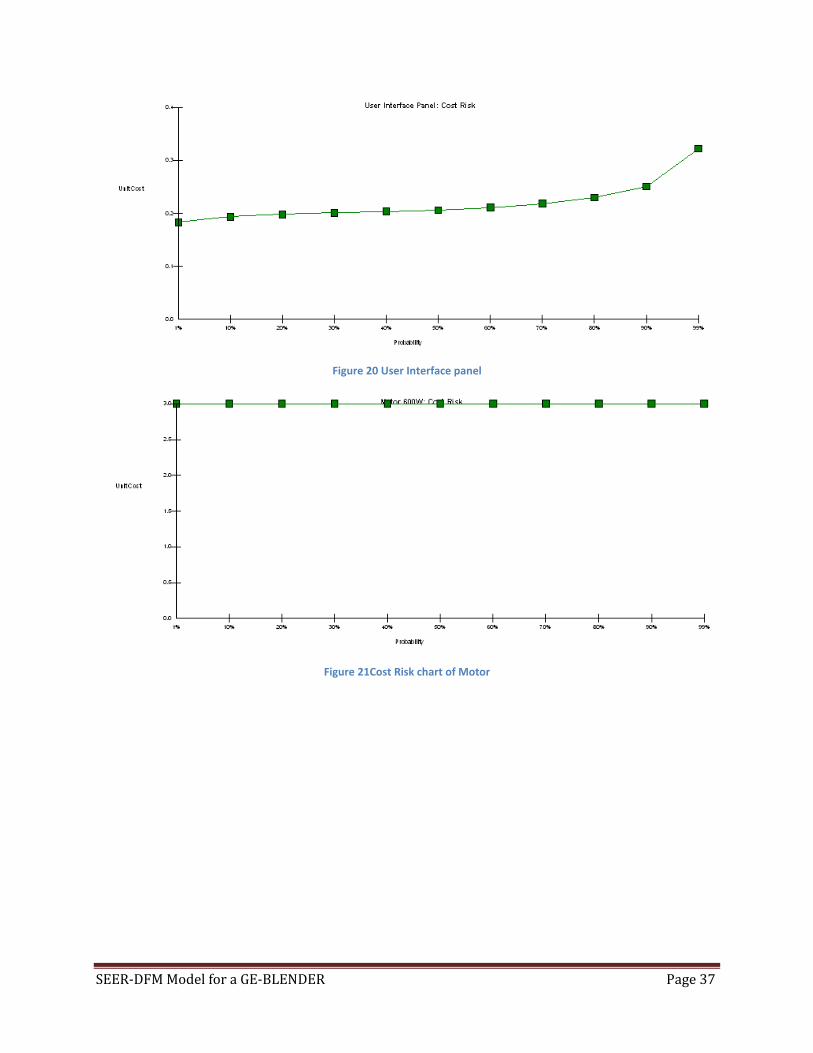
SEER‐DFM Model for a GE‐BLENDER Page 37
Figure 20 User Interface panel
Figure 21Cost Risk chart of Motor
SEER‐DFM Model for a GE‐BLENDER Page 38
APPENDIX III
SEER‐DFM Model for a GE‐BLENDER Page 39
Figure 1 Cost of 10,000 units China
SEER‐DFM Model for a GE‐BLENDER Page 40
Figure 2 Cost of 25,000 units China
SEER‐DFM Model for a GE‐BLENDER Page 41
Figure 3 Cost of 50,000 units China
SEER‐DFM Model for a GE‐BLENDER Page 42
Figure4 Cost of 75,000 units China
SEER‐DFM Model for a GE‐BLENDER Page 43
Figure 5 Cost of 100,000 units China
SEER‐DFM Model for a GE‐BLENDER Page 44
APPENDIX IV
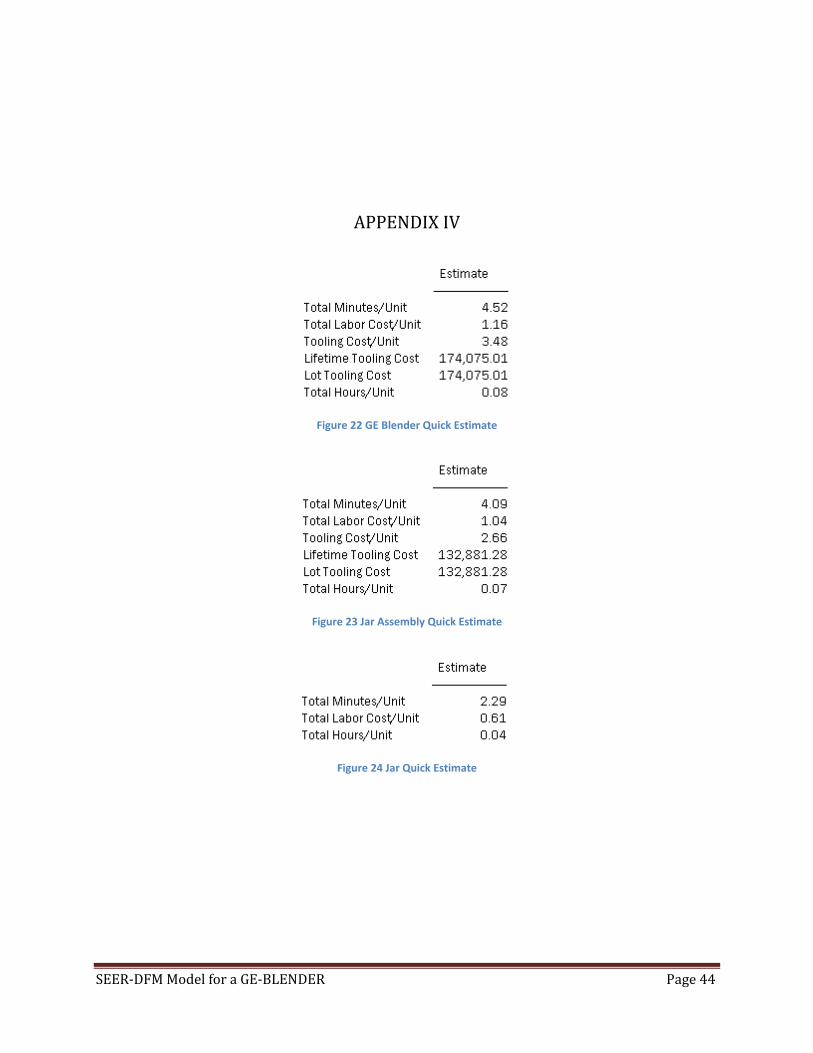
Figure 22 GE Blender Quick Estimate
Figure 23 Jar Assembly Quick Estimate
Figure 24 Jar Quick Estimate
SEER‐DFM Model for a GE‐BLENDER Page 45
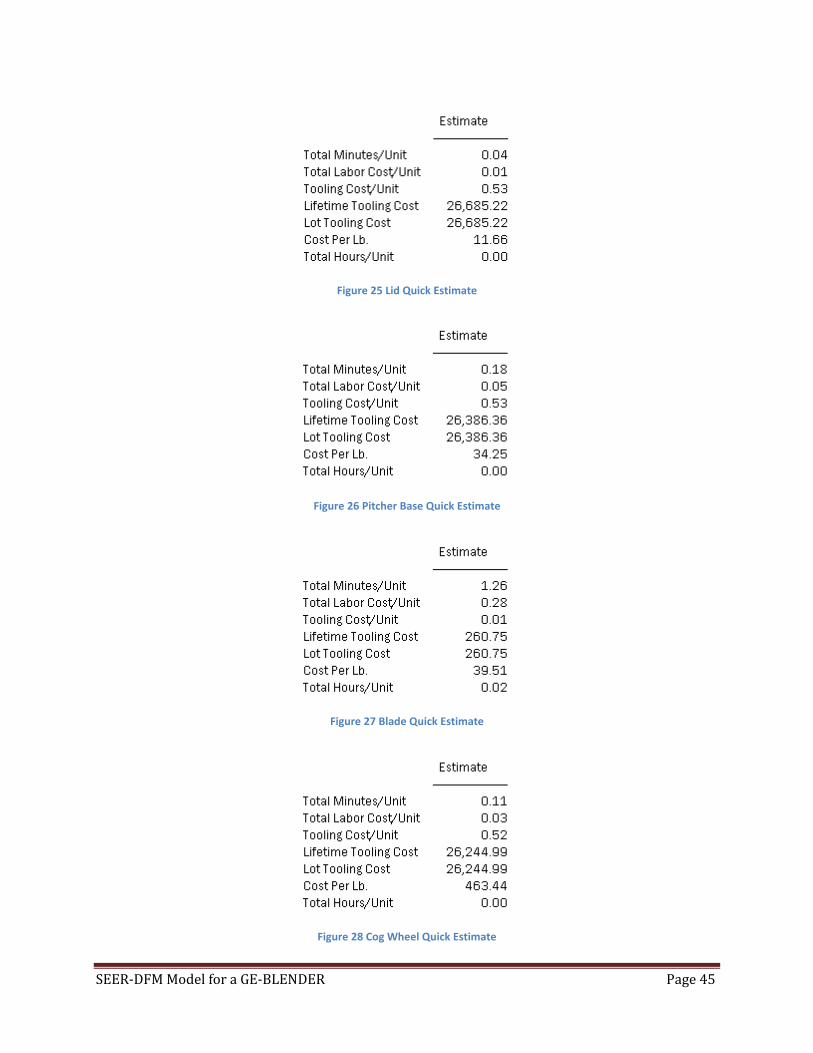
Figure 25 Lid Quick Estimate
Figure 26 Pitcher Base Quick Estimate
Figure 27 Blade Quick Estimate
Figure 28 Cog Wheel Quick Estimate
SEER‐DFM Model for a GE‐BLENDER Page 46
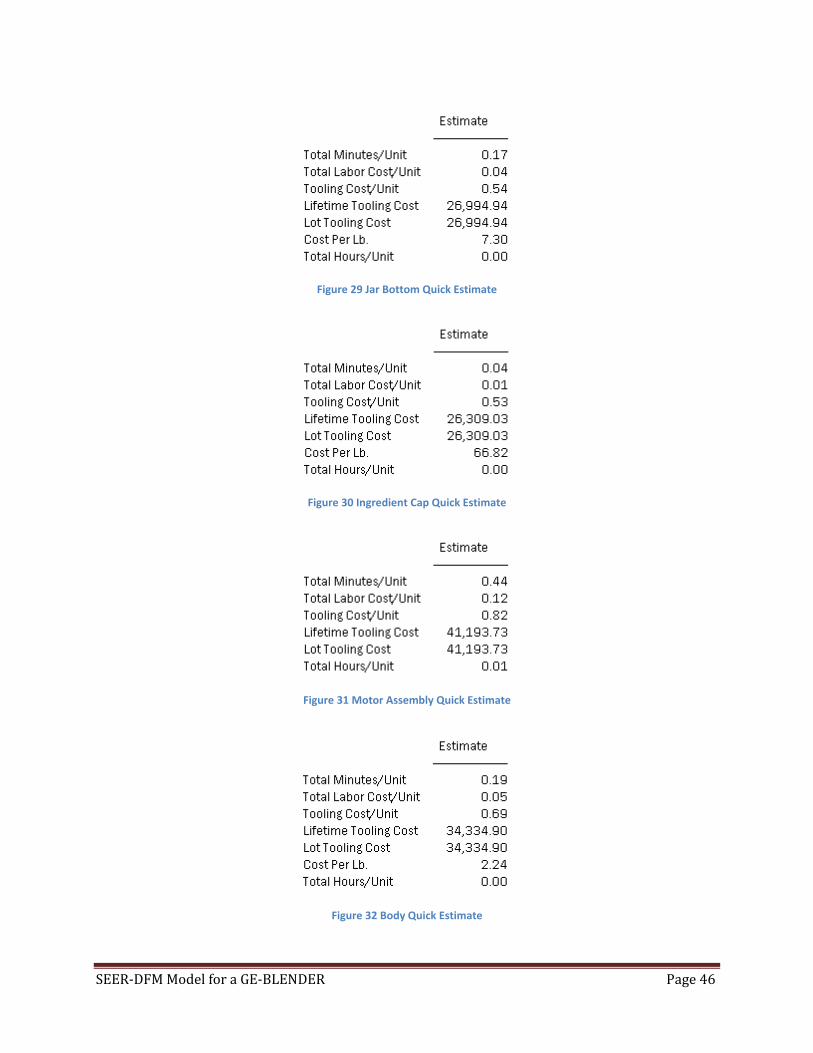
Figure 29 Jar Bottom Quick Estimate
Figure 30 Ingredient Cap Quick Estimate
Figure 31 Motor Assembly Quick Estimate
Figure 32 Body Quick Estimate
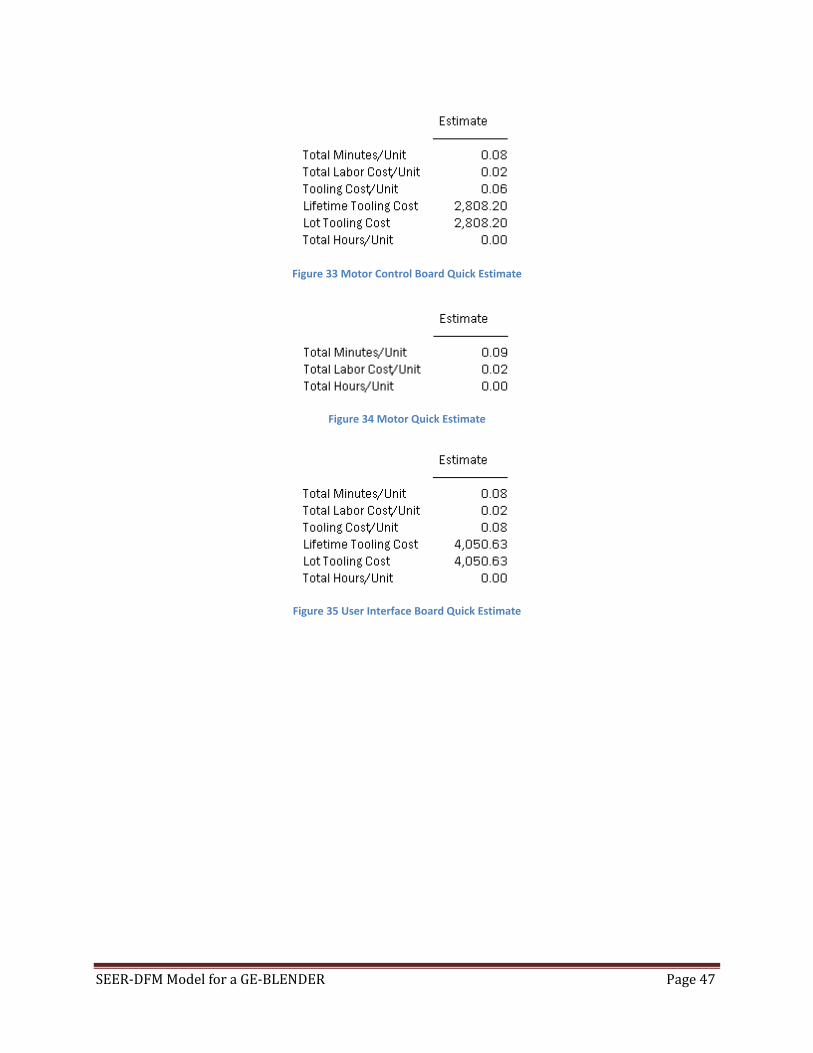
SEER‐DFM Model for a GE‐BLENDER Page 47
Figure 33 Motor Control Board Quick Estimate
Figure 34 Motor Quick Estimate
Figure 35 User Interface Board Quick Estimate
SEER‐DFM Model for a GE‐BLENDER Page 48
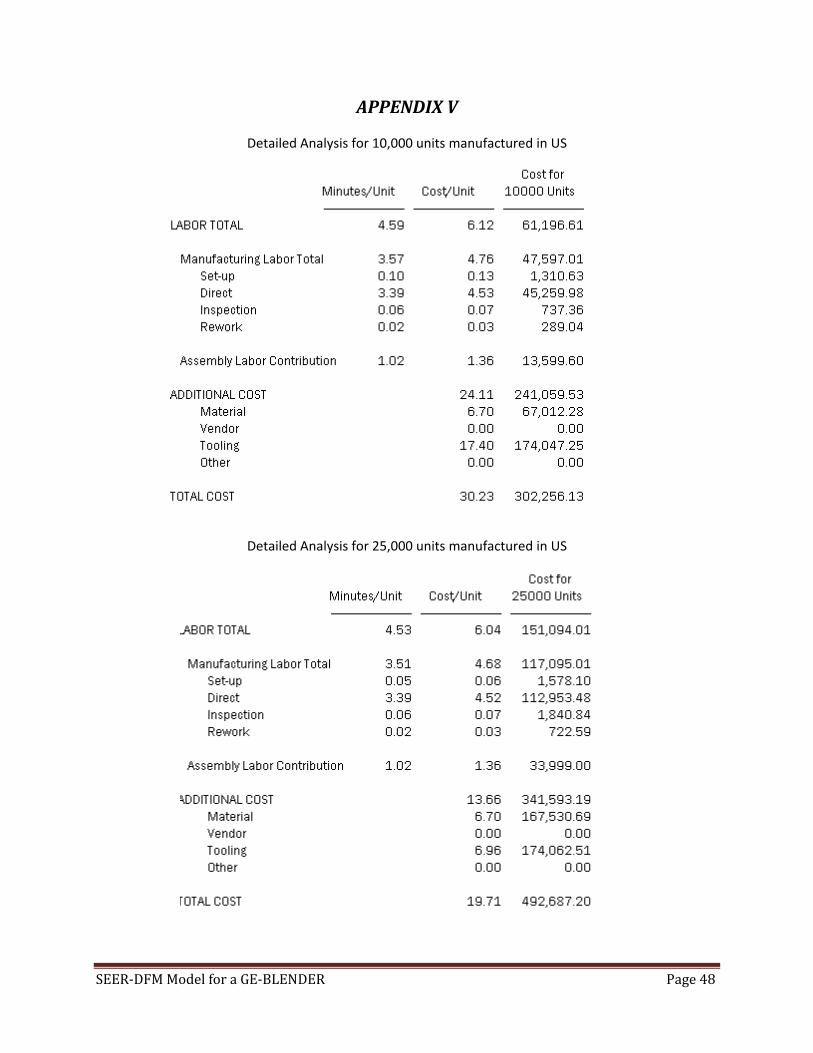
APPENDIX V
Detailed Analysis for 10,000 units manufactured in US
Detailed Analysis for 25,000 units manufactured in US
SEER‐DFM Model for a GE‐BLENDER Page 49
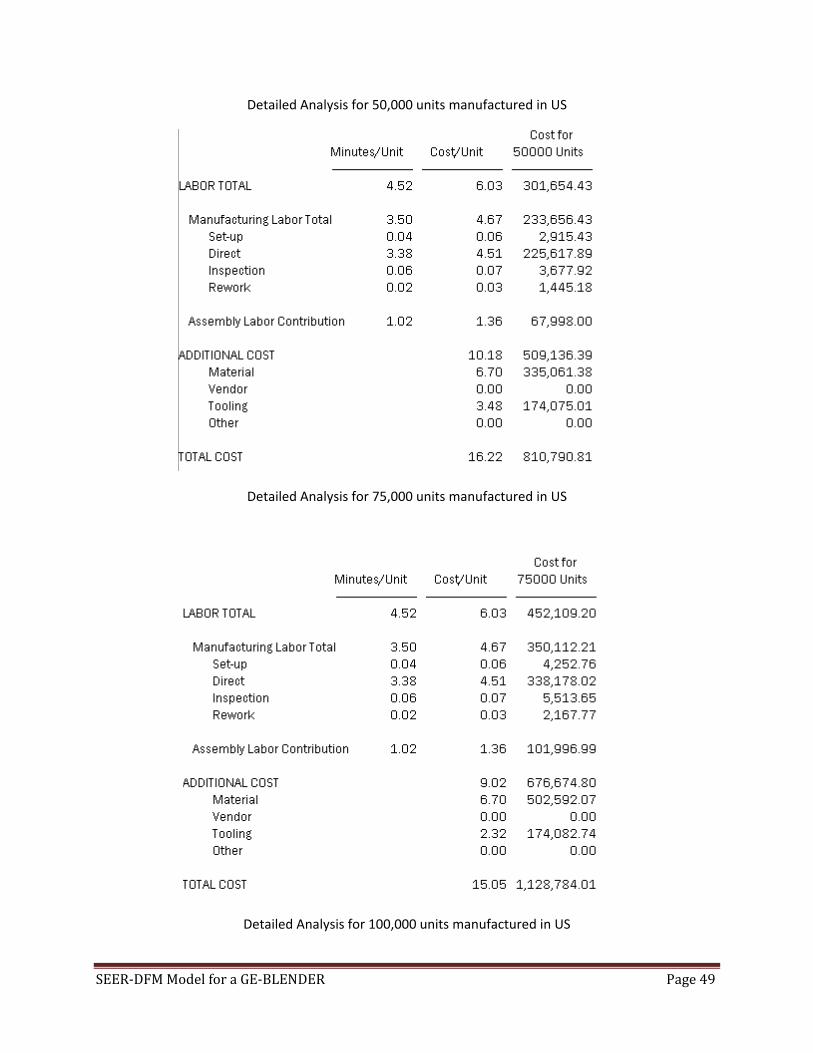
Detailed Analysis for 50,000 units manufactured in US
Detailed Analysis for 75,000 units manufactured in US
Detailed Analysis for 100,000 units manufactured in US
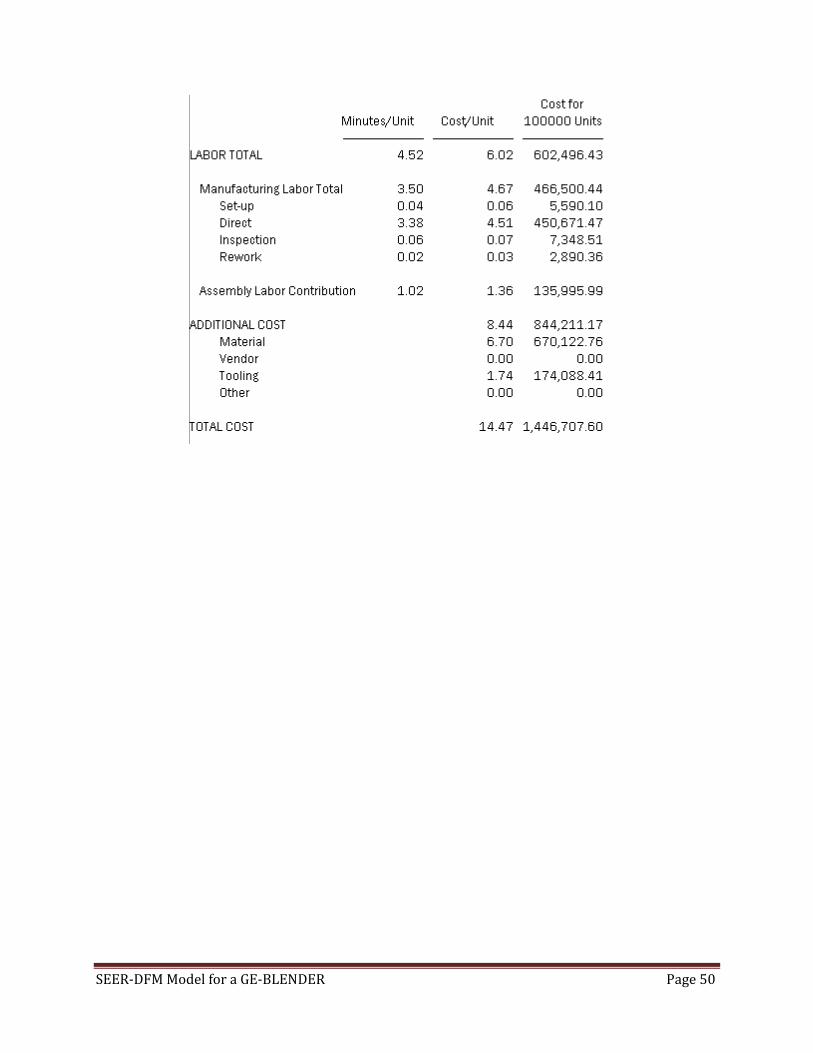
SEER‐DFM Model for a GE‐BLENDER Page 50