Embed Size (px)
Citation preview
SEE
R C
ancer Statistics Review
1975-2009N
ational Cancer Institute
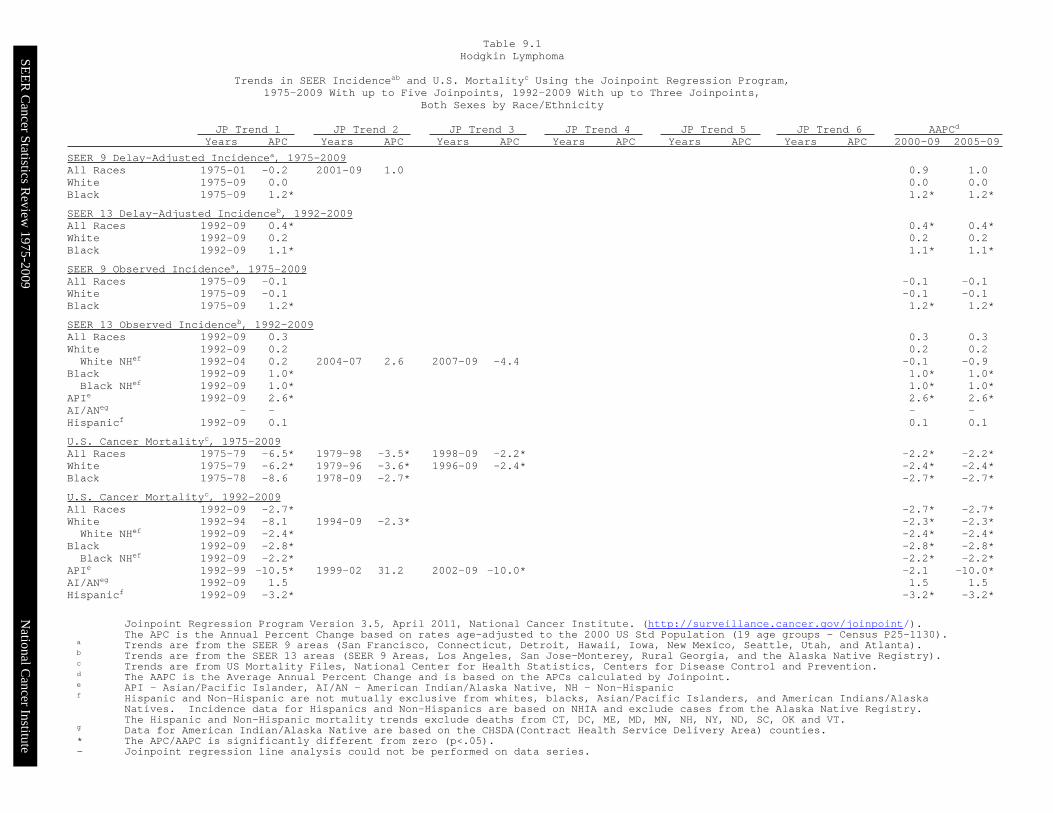
Joinpoint Regression Program Version 3.5, April 2011, National Cancer Institute. (http://surveillance.cancer.gov/joinpoint/).The APC is the Annual Percent Change based on rates age-adjusted to the 2000 US Std Population (19 age groups - Census P25-1130).
a Trends are from the SEER 9 areas (San Francisco, Connecticut, Detroit, Hawaii, Iowa, New Mexico, Seattle, Utah, and Atlanta).b Trends are from the SEER 13 areas (SEER 9 Areas, Los Angeles, San Jose-Monterey, Rural Georgia, and the Alaska Native Registry).c Trends are from US Mortality Files, National Center for Health Statistics, Centers for Disease Control and Prevention.d The AAPC is the Average Annual Percent Change and is based on the APCs calculated by Joinpoint.e API - Asian/Pacific Islander, AI/AN - American Indian/Alaska Native, NH - Non-Hispanicf Hispanic and Non-Hispanic are not mutually exclusive from whites, blacks, Asian/Pacific Islanders, and American Indians/Alaska
Natives. Incidence data for Hispanics and Non-Hispanics are based on NHIA and exclude cases from the Alaska Native Registry.The Hispanic and Non-Hispanic mortality trends exclude deaths from CT, DC, ME, MD, MN, NH, NY, ND, SC, OK and VT.
g Data for American Indian/Alaska Native are based on the CHSDA(Contract Health Service Delivery Area) counties.* The APC/AAPC is significantly different from zero (p<.05).- Joinpoint regression line analysis could not be performed on data series.
JP Trend 1 JP Trend 2 JP Trend 3 JP Trend 4 JP Trend 5 JP Trend 6 AAPCd Years APC Years APC Years APC Years APC Years APC Years APC 2000-09 2005-09
SEER 9 Delay-Adjusted Incidencea, 1975-2009All Races 1975-01 -0.2 2001-09 1.0 0.9 1.0White 1975-09 0.0 0.0 0.0Black 1975-09 1.2* 1.2* 1.2*
SEER 13 Delay-Adjusted Incidenceb, 1992-2009All Races 1992-09 0.4* 0.4* 0.4*White 1992-09 0.2 0.2 0.2Black 1992-09 1.1* 1.1* 1.1*
SEER 9 Observed Incidencea, 1975-2009All Races 1975-09 -0.1 -0.1 -0.1White 1975-09 -0.1 -0.1 -0.1Black 1975-09 1.2* 1.2* 1.2*
SEER 13 Observed Incidenceb, 1992-2009All Races 1992-09 0.3 0.3 0.3White 1992-09 0.2 0.2 0.2White NHef 1992-04 0.2 2004-07 2.6 2007-09 -4.4 -0.1 -0.9
Black 1992-09 1.0* 1.0* 1.0*Black NHef 1992-09 1.0* 1.0* 1.0*
APIe 1992-09 2.6* 2.6* 2.6*AI/ANeg - - - -Hispanicf 1992-09 0.1 0.1 0.1
U.S. Cancer Mortalityc, 1975-2009All Races 1975-79 -6.5* 1979-98 -3.5* 1998-09 -2.2* -2.2* -2.2*White 1975-79 -6.2* 1979-96 -3.6* 1996-09 -2.4* -2.4* -2.4*Black 1975-78 -8.6 1978-09 -2.7* -2.7* -2.7*
U.S. Cancer Mortalityc, 1992-2009All Races 1992-09 -2.7* -2.7* -2.7*White 1992-94 -8.1 1994-09 -2.3* -2.3* -2.3*White NHef 1992-09 -2.4* -2.4* -2.4*
Black 1992-09 -2.8* -2.8* -2.8*Black NHef 1992-09 -2.2* -2.2* -2.2*
APIe 1992-99 -10.5* 1999-02 31.2 2002-09 -10.0* -2.1 -10.0*AI/ANeg 1992-09 1.5 1.5 1.5Hispanicf 1992-09 -3.2* -3.2* -3.2*
Table 9.1Hodgkin Lymphoma
Trends in SEER Incidenceab and U.S. Mortalityc Using the Joinpoint Regression Program,1975-2009 With up to Five Joinpoints, 1992-2009 With up to Three Joinpoints,
Both Sexes by Race/Ethnicity

SEE
R C
ancer Statistics Review
1975-2009N
ational Cancer Institute
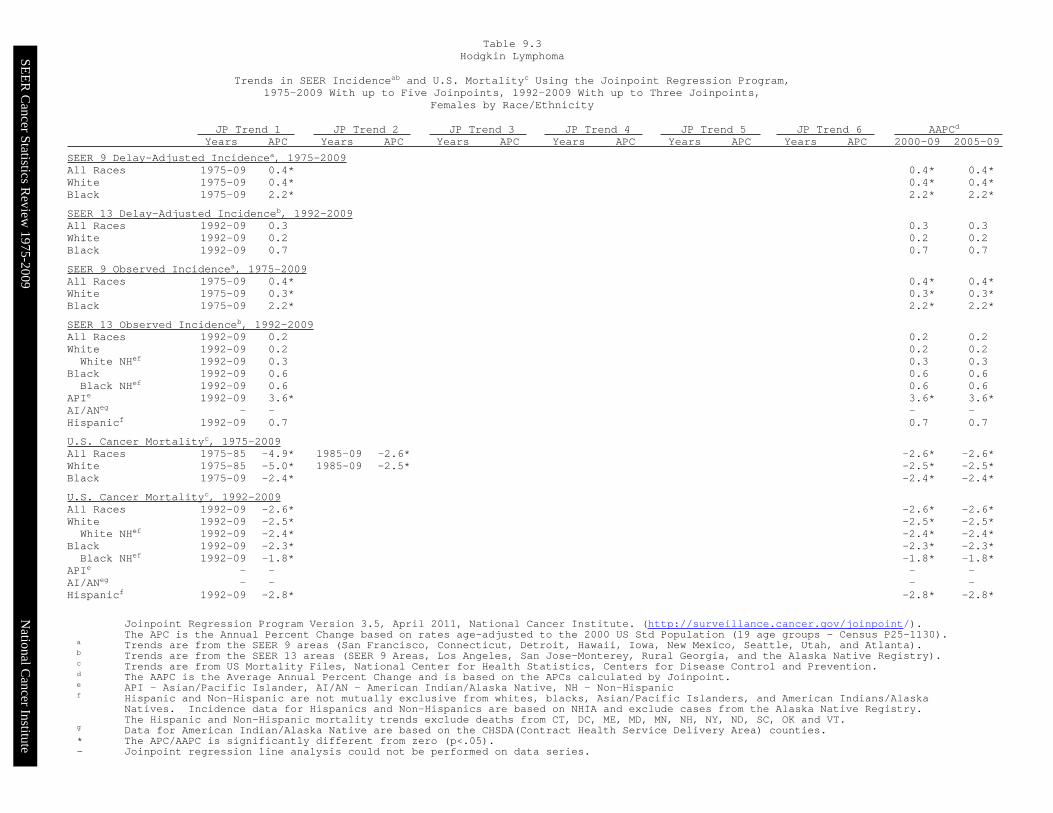
Joinpoint Regression Program Version 3.5, April 2011, National Cancer Institute. (http://surveillance.cancer.gov/joinpoint/).The APC is the Annual Percent Change based on rates age-adjusted to the 2000 US Std Population (19 age groups - Census P25-1130).
a Trends are from the SEER 9 areas (San Francisco, Connecticut, Detroit, Hawaii, Iowa, New Mexico, Seattle, Utah, and Atlanta).b Trends are from the SEER 13 areas (SEER 9 Areas, Los Angeles, San Jose-Monterey, Rural Georgia, and the Alaska Native Registry).c Trends are from US Mortality Files, National Center for Health Statistics, Centers for Disease Control and Prevention.d The AAPC is the Average Annual Percent Change and is based on the APCs calculated by Joinpoint.e API - Asian/Pacific Islander, AI/AN - American Indian/Alaska Native, NH - Non-Hispanicf Hispanic and Non-Hispanic are not mutually exclusive from whites, blacks, Asian/Pacific Islanders, and American Indians/Alaska
Natives. Incidence data for Hispanics and Non-Hispanics are based on NHIA and exclude cases from the Alaska Native Registry.The Hispanic and Non-Hispanic mortality trends exclude deaths from CT, DC, ME, MD, MN, NH, NY, ND, SC, OK and VT.
g Data for American Indian/Alaska Native are based on the CHSDA(Contract Health Service Delivery Area) counties.* The APC/AAPC is significantly different from zero (p<.05).- Joinpoint regression line analysis could not be performed on data series.
JP Trend 1 JP Trend 2 JP Trend 3 JP Trend 4 JP Trend 5 JP Trend 6 AAPCd Years APC Years APC Years APC Years APC Years APC Years APC 2000-09 2005-09
SEER 9 Delay-Adjusted Incidencea, 1975-2009All Races 1975-01 -0.7* 2001-09 1.3 1.0 1.3White 1975-09 -0.4* -0.4* -0.4*Black 1975-09 0.6 0.6 0.6
SEER 13 Delay-Adjusted Incidenceb, 1992-2009All Races 1992-09 0.4 0.4 0.4White 1992-09 0.2 0.2 0.2Black 1992-09 1.3* 1.3* 1.3*
SEER 9 Observed Incidencea, 1975-2009All Races 1975-09 -0.4* -0.4* -0.4*White 1975-09 -0.4* -0.4* -0.4*Black 1975-09 0.5 0.5 0.5
SEER 13 Observed Incidenceb, 1992-2009All Races 1992-09 0.3 0.3 0.3White 1992-09 0.2 0.2 0.2White NHef 1992-09 0.4 0.4 0.4
Black 1992-09 1.2* 1.2* 1.2*Black NHef 1992-09 1.2* 1.2* 1.2*
APIe 1992-09 1.7 1.7 1.7AI/ANeg - - - -Hispanicf 1992-09 -0.4 -0.4 -0.4
U.S. Cancer Mortalityc, 1975-2009All Races 1975-97 -4.0* 1997-09 -2.3* -2.3* -2.3*White 1975-96 -4.1* 1996-09 -2.3* -2.3* -2.3*Black 1975-09 -3.2* -3.2* -3.2*
U.S. Cancer Mortalityc, 1992-2009All Races 1992-94 -10.8 1994-09 -2.3* -2.3* -2.3*White 1992-94 -11.1 1994-09 -2.2* -2.2* -2.2*White NHef 1992-09 -2.5* -2.5* -2.5*
Black 1992-09 -3.3* -3.3* -3.3*Black NHef 1992-09 -2.8* -2.8* -2.8*
APIe 1992-09 -3.9* -3.9* -3.9*AI/ANeg - - - -Hispanicf 1992-09 -3.4* -3.4* -3.4*
Table 9.2Hodgkin Lymphoma
Trends in SEER Incidenceab and U.S. Mortalityc Using the Joinpoint Regression Program,1975-2009 With up to Five Joinpoints, 1992-2009 With up to Three Joinpoints,
Males by Race/Ethnicity
SEE
R C
ancer Statistics Review
1975-2009N
ational Cancer Institute
Joinpoint Regression Program Version 3.5, April 2011, National Cancer Institute. (http://surveillance.cancer.gov/joinpoint/).The APC is the Annual Percent Change based on rates age-adjusted to the 2000 US Std Population (19 age groups - Census P25-1130).
a Trends are from the SEER 9 areas (San Francisco, Connecticut, Detroit, Hawaii, Iowa, New Mexico, Seattle, Utah, and Atlanta).b Trends are from the SEER 13 areas (SEER 9 Areas, Los Angeles, San Jose-Monterey, Rural Georgia, and the Alaska Native Registry).c Trends are from US Mortality Files, National Center for Health Statistics, Centers for Disease Control and Prevention.d The AAPC is the Average Annual Percent Change and is based on the APCs calculated by Joinpoint.e API - Asian/Pacific Islander, AI/AN - American Indian/Alaska Native, NH - Non-Hispanicf Hispanic and Non-Hispanic are not mutually exclusive from whites, blacks, Asian/Pacific Islanders, and American Indians/Alaska
Natives. Incidence data for Hispanics and Non-Hispanics are based on NHIA and exclude cases from the Alaska Native Registry.The Hispanic and Non-Hispanic mortality trends exclude deaths from CT, DC, ME, MD, MN, NH, NY, ND, SC, OK and VT.
g Data for American Indian/Alaska Native are based on the CHSDA(Contract Health Service Delivery Area) counties.* The APC/AAPC is significantly different from zero (p<.05).- Joinpoint regression line analysis could not be performed on data series.
JP Trend 1 JP Trend 2 JP Trend 3 JP Trend 4 JP Trend 5 JP Trend 6 AAPCd Years APC Years APC Years APC Years APC Years APC Years APC 2000-09 2005-09
SEER 9 Delay-Adjusted Incidencea, 1975-2009All Races 1975-09 0.4* 0.4* 0.4*White 1975-09 0.4* 0.4* 0.4*Black 1975-09 2.2* 2.2* 2.2*
SEER 13 Delay-Adjusted Incidenceb, 1992-2009All Races 1992-09 0.3 0.3 0.3White 1992-09 0.2 0.2 0.2Black 1992-09 0.7 0.7 0.7
SEER 9 Observed Incidencea, 1975-2009All Races 1975-09 0.4* 0.4* 0.4*White 1975-09 0.3* 0.3* 0.3*Black 1975-09 2.2* 2.2* 2.2*
SEER 13 Observed Incidenceb, 1992-2009All Races 1992-09 0.2 0.2 0.2White 1992-09 0.2 0.2 0.2White NHef 1992-09 0.3 0.3 0.3
Black 1992-09 0.6 0.6 0.6Black NHef 1992-09 0.6 0.6 0.6
APIe 1992-09 3.6* 3.6* 3.6*AI/ANeg - - - -Hispanicf 1992-09 0.7 0.7 0.7
U.S. Cancer Mortalityc, 1975-2009All Races 1975-85 -4.9* 1985-09 -2.6* -2.6* -2.6*White 1975-85 -5.0* 1985-09 -2.5* -2.5* -2.5*Black 1975-09 -2.4* -2.4* -2.4*
U.S. Cancer Mortalityc, 1992-2009All Races 1992-09 -2.6* -2.6* -2.6*White 1992-09 -2.5* -2.5* -2.5*White NHef 1992-09 -2.4* -2.4* -2.4*
Black 1992-09 -2.3* -2.3* -2.3*Black NHef 1992-09 -1.8* -1.8* -1.8*
APIe - - - -AI/ANeg - - - -Hispanicf 1992-09 -2.8* -2.8* -2.8*
Table 9.3Hodgkin Lymphoma
Trends in SEER Incidenceab and U.S. Mortalityc Using the Joinpoint Regression Program,1975-2009 With up to Five Joinpoints, 1992-2009 With up to Three Joinpoints,
Females by Race/Ethnicity
SEE
R C
ancer Statistics Review
1975-2009N
ational Cancer Institute
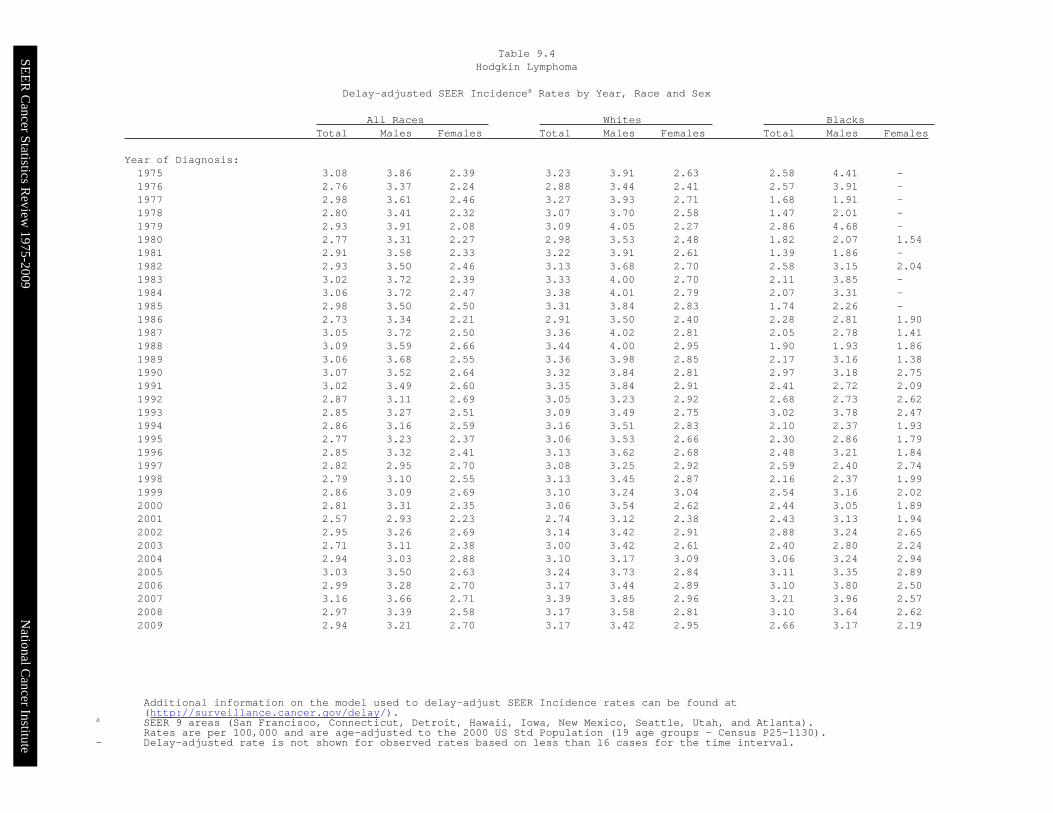
Additional information on the model used to delay-adjust SEER Incidence rates can be found at(http://surveillance.cancer.gov/delay/).
a SEER 9 areas (San Francisco, Connecticut, Detroit, Hawaii, Iowa, New Mexico, Seattle, Utah, and Atlanta).Rates are per 100,000 and are age-adjusted to the 2000 US Std Population (19 age groups - Census P25-1130).
- Delay-adjusted rate is not shown for observed rates based on less than 16 cases for the time interval.
All Races Whites Blacks Total Males Females Total Males Females Total Males Females
Year of Diagnosis:1975 3.08 3.86 2.39 3.23 3.91 2.63 2.58 4.41 -1976 2.76 3.37 2.24 2.88 3.44 2.41 2.57 3.91 -1977 2.98 3.61 2.46 3.27 3.93 2.71 1.68 1.91 -1978 2.80 3.41 2.32 3.07 3.70 2.58 1.47 2.01 -1979 2.93 3.91 2.08 3.09 4.05 2.27 2.86 4.68 -1980 2.77 3.31 2.27 2.98 3.53 2.48 1.82 2.07 1.541981 2.91 3.58 2.33 3.22 3.91 2.61 1.39 1.86 -1982 2.93 3.50 2.46 3.13 3.68 2.70 2.58 3.15 2.041983 3.02 3.72 2.39 3.33 4.00 2.70 2.11 3.85 -1984 3.06 3.72 2.47 3.38 4.01 2.79 2.07 3.31 -1985 2.98 3.50 2.50 3.31 3.84 2.83 1.74 2.26 -1986 2.73 3.34 2.21 2.91 3.50 2.40 2.28 2.81 1.901987 3.05 3.72 2.50 3.36 4.02 2.81 2.05 2.78 1.411988 3.09 3.59 2.66 3.44 4.00 2.95 1.90 1.93 1.861989 3.06 3.68 2.55 3.36 3.98 2.85 2.17 3.16 1.381990 3.07 3.52 2.64 3.32 3.84 2.81 2.97 3.18 2.751991 3.02 3.49 2.60 3.35 3.84 2.91 2.41 2.72 2.091992 2.87 3.11 2.69 3.05 3.23 2.92 2.68 2.73 2.621993 2.85 3.27 2.51 3.09 3.49 2.75 3.02 3.78 2.471994 2.86 3.16 2.59 3.16 3.51 2.83 2.10 2.37 1.931995 2.77 3.23 2.37 3.06 3.53 2.66 2.30 2.86 1.791996 2.85 3.32 2.41 3.13 3.62 2.68 2.48 3.21 1.841997 2.82 2.95 2.70 3.08 3.25 2.92 2.59 2.40 2.741998 2.79 3.10 2.55 3.13 3.45 2.87 2.16 2.37 1.991999 2.86 3.09 2.69 3.10 3.24 3.04 2.54 3.16 2.022000 2.81 3.31 2.35 3.06 3.54 2.62 2.44 3.05 1.892001 2.57 2.93 2.23 2.74 3.12 2.38 2.43 3.13 1.942002 2.95 3.26 2.69 3.14 3.42 2.91 2.88 3.24 2.652003 2.71 3.11 2.38 3.00 3.42 2.61 2.40 2.80 2.242004 2.94 3.03 2.88 3.10 3.17 3.09 3.06 3.24 2.942005 3.03 3.50 2.63 3.24 3.73 2.84 3.11 3.35 2.892006 2.99 3.28 2.70 3.17 3.44 2.89 3.10 3.80 2.502007 3.16 3.66 2.71 3.39 3.85 2.96 3.21 3.96 2.572008 2.97 3.39 2.58 3.17 3.58 2.81 3.10 3.64 2.622009 2.94 3.21 2.70 3.17 3.42 2.95 2.66 3.17 2.19
Table 9.4Hodgkin Lymphoma
Delay-adjusted SEER Incidencea Rates by Year, Race and Sex
SEE
R C
ancer Statistics Review
1975-2009N
ational Cancer Institute
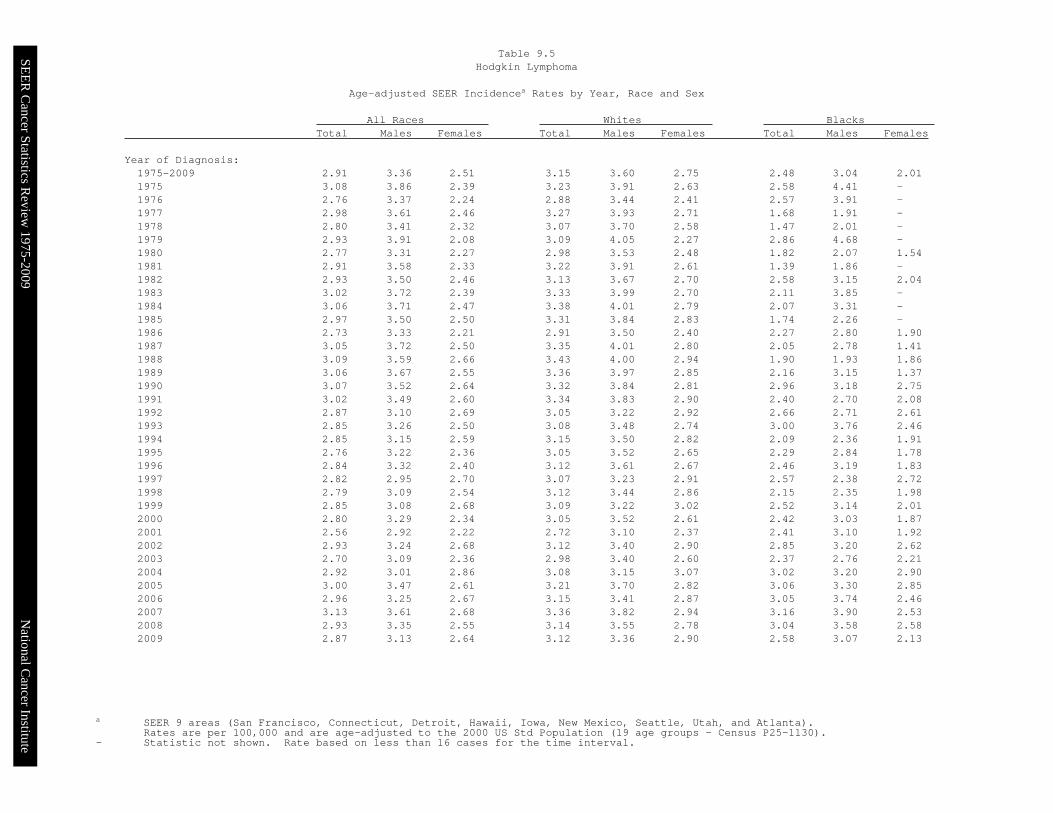
a SEER 9 areas (San Francisco, Connecticut, Detroit, Hawaii, Iowa, New Mexico, Seattle, Utah, and Atlanta).Rates are per 100,000 and are age-adjusted to the 2000 US Std Population (19 age groups - Census P25-1130).
- Statistic not shown. Rate based on less than 16 cases for the time interval.
All Races Whites Blacks Total Males Females Total Males Females Total Males Females
Year of Diagnosis:1975-2009 2.91 3.36 2.51 3.15 3.60 2.75 2.48 3.04 2.011975 3.08 3.86 2.39 3.23 3.91 2.63 2.58 4.41 -1976 2.76 3.37 2.24 2.88 3.44 2.41 2.57 3.91 -1977 2.98 3.61 2.46 3.27 3.93 2.71 1.68 1.91 -1978 2.80 3.41 2.32 3.07 3.70 2.58 1.47 2.01 -1979 2.93 3.91 2.08 3.09 4.05 2.27 2.86 4.68 -1980 2.77 3.31 2.27 2.98 3.53 2.48 1.82 2.07 1.541981 2.91 3.58 2.33 3.22 3.91 2.61 1.39 1.86 -1982 2.93 3.50 2.46 3.13 3.67 2.70 2.58 3.15 2.041983 3.02 3.72 2.39 3.33 3.99 2.70 2.11 3.85 -1984 3.06 3.71 2.47 3.38 4.01 2.79 2.07 3.31 -1985 2.97 3.50 2.50 3.31 3.84 2.83 1.74 2.26 -1986 2.73 3.33 2.21 2.91 3.50 2.40 2.27 2.80 1.901987 3.05 3.72 2.50 3.35 4.01 2.80 2.05 2.78 1.411988 3.09 3.59 2.66 3.43 4.00 2.94 1.90 1.93 1.861989 3.06 3.67 2.55 3.36 3.97 2.85 2.16 3.15 1.371990 3.07 3.52 2.64 3.32 3.84 2.81 2.96 3.18 2.751991 3.02 3.49 2.60 3.34 3.83 2.90 2.40 2.70 2.081992 2.87 3.10 2.69 3.05 3.22 2.92 2.66 2.71 2.611993 2.85 3.26 2.50 3.08 3.48 2.74 3.00 3.76 2.461994 2.85 3.15 2.59 3.15 3.50 2.82 2.09 2.36 1.911995 2.76 3.22 2.36 3.05 3.52 2.65 2.29 2.84 1.781996 2.84 3.32 2.40 3.12 3.61 2.67 2.46 3.19 1.831997 2.82 2.95 2.70 3.07 3.23 2.91 2.57 2.38 2.721998 2.79 3.09 2.54 3.12 3.44 2.86 2.15 2.35 1.981999 2.85 3.08 2.68 3.09 3.22 3.02 2.52 3.14 2.012000 2.80 3.29 2.34 3.05 3.52 2.61 2.42 3.03 1.872001 2.56 2.92 2.22 2.72 3.10 2.37 2.41 3.10 1.922002 2.93 3.24 2.68 3.12 3.40 2.90 2.85 3.20 2.622003 2.70 3.09 2.36 2.98 3.40 2.60 2.37 2.76 2.212004 2.92 3.01 2.86 3.08 3.15 3.07 3.02 3.20 2.902005 3.00 3.47 2.61 3.21 3.70 2.82 3.06 3.30 2.852006 2.96 3.25 2.67 3.15 3.41 2.87 3.05 3.74 2.462007 3.13 3.61 2.68 3.36 3.82 2.94 3.16 3.90 2.532008 2.93 3.35 2.55 3.14 3.55 2.78 3.04 3.58 2.582009 2.87 3.13 2.64 3.12 3.36 2.90 2.58 3.07 2.13
Table 9.5Hodgkin Lymphoma
Age-adjusted SEER Incidencea Rates by Year, Race and Sex
SEE
R C
ancer Statistics Review
1975-2009N
ational Cancer Institute
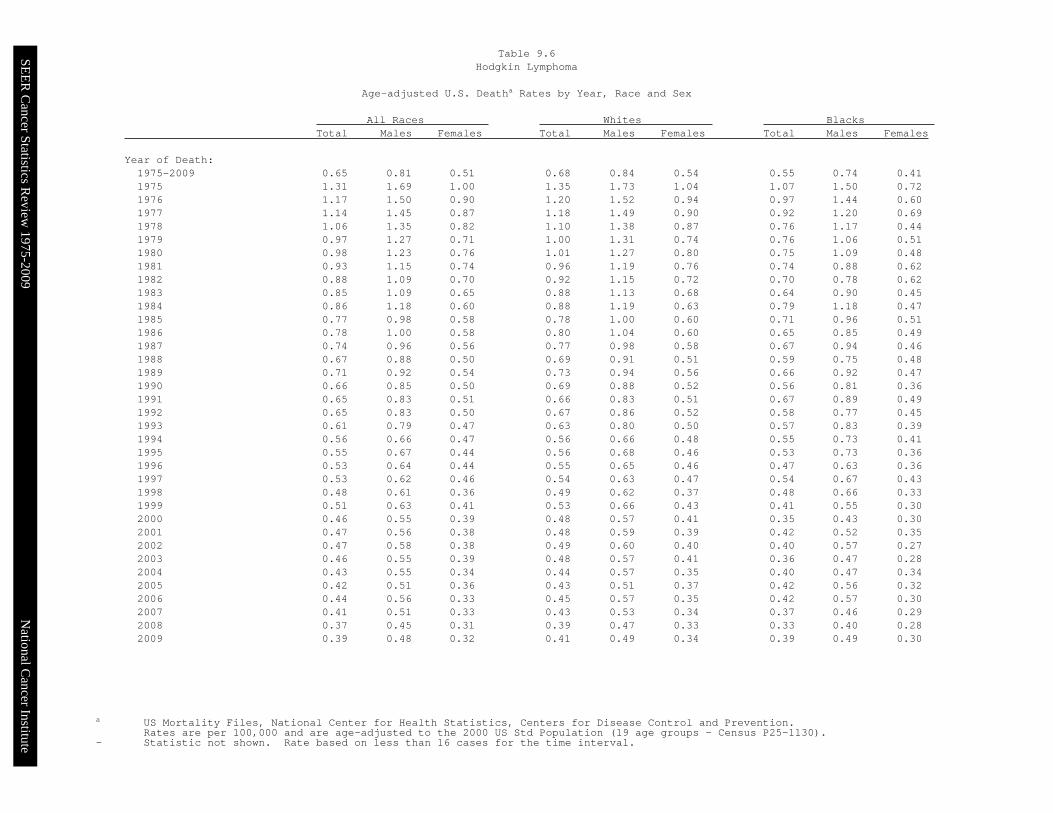
a US Mortality Files, National Center for Health Statistics, Centers for Disease Control and Prevention.Rates are per 100,000 and are age-adjusted to the 2000 US Std Population (19 age groups - Census P25-1130).
- Statistic not shown. Rate based on less than 16 cases for the time interval.
All Races Whites Blacks Total Males Females Total Males Females Total Males Females
Year of Death:1975-2009 0.65 0.81 0.51 0.68 0.84 0.54 0.55 0.74 0.411975 1.31 1.69 1.00 1.35 1.73 1.04 1.07 1.50 0.721976 1.17 1.50 0.90 1.20 1.52 0.94 0.97 1.44 0.601977 1.14 1.45 0.87 1.18 1.49 0.90 0.92 1.20 0.691978 1.06 1.35 0.82 1.10 1.38 0.87 0.76 1.17 0.441979 0.97 1.27 0.71 1.00 1.31 0.74 0.76 1.06 0.511980 0.98 1.23 0.76 1.01 1.27 0.80 0.75 1.09 0.481981 0.93 1.15 0.74 0.96 1.19 0.76 0.74 0.88 0.621982 0.88 1.09 0.70 0.92 1.15 0.72 0.70 0.78 0.621983 0.85 1.09 0.65 0.88 1.13 0.68 0.64 0.90 0.451984 0.86 1.18 0.60 0.88 1.19 0.63 0.79 1.18 0.471985 0.77 0.98 0.58 0.78 1.00 0.60 0.71 0.96 0.511986 0.78 1.00 0.58 0.80 1.04 0.60 0.65 0.85 0.491987 0.74 0.96 0.56 0.77 0.98 0.58 0.67 0.94 0.461988 0.67 0.88 0.50 0.69 0.91 0.51 0.59 0.75 0.481989 0.71 0.92 0.54 0.73 0.94 0.56 0.66 0.92 0.471990 0.66 0.85 0.50 0.69 0.88 0.52 0.56 0.81 0.361991 0.65 0.83 0.51 0.66 0.83 0.51 0.67 0.89 0.491992 0.65 0.83 0.50 0.67 0.86 0.52 0.58 0.77 0.451993 0.61 0.79 0.47 0.63 0.80 0.50 0.57 0.83 0.391994 0.56 0.66 0.47 0.56 0.66 0.48 0.55 0.73 0.411995 0.55 0.67 0.44 0.56 0.68 0.46 0.53 0.73 0.361996 0.53 0.64 0.44 0.55 0.65 0.46 0.47 0.63 0.361997 0.53 0.62 0.46 0.54 0.63 0.47 0.54 0.67 0.431998 0.48 0.61 0.36 0.49 0.62 0.37 0.48 0.66 0.331999 0.51 0.63 0.41 0.53 0.66 0.43 0.41 0.55 0.302000 0.46 0.55 0.39 0.48 0.57 0.41 0.35 0.43 0.302001 0.47 0.56 0.38 0.48 0.59 0.39 0.42 0.52 0.352002 0.47 0.58 0.38 0.49 0.60 0.40 0.40 0.57 0.272003 0.46 0.55 0.39 0.48 0.57 0.41 0.36 0.47 0.282004 0.43 0.55 0.34 0.44 0.57 0.35 0.40 0.47 0.342005 0.42 0.51 0.36 0.43 0.51 0.37 0.42 0.56 0.322006 0.44 0.56 0.33 0.45 0.57 0.35 0.42 0.57 0.302007 0.41 0.51 0.33 0.43 0.53 0.34 0.37 0.46 0.292008 0.37 0.45 0.31 0.39 0.47 0.33 0.33 0.40 0.282009 0.39 0.48 0.32 0.41 0.49 0.34 0.39 0.49 0.30
Table 9.6Hodgkin Lymphoma
Age-adjusted U.S. Deatha Rates by Year, Race and Sex
SEE
R C
ancer Statistics Review
1975-2009N
ational Cancer Institute
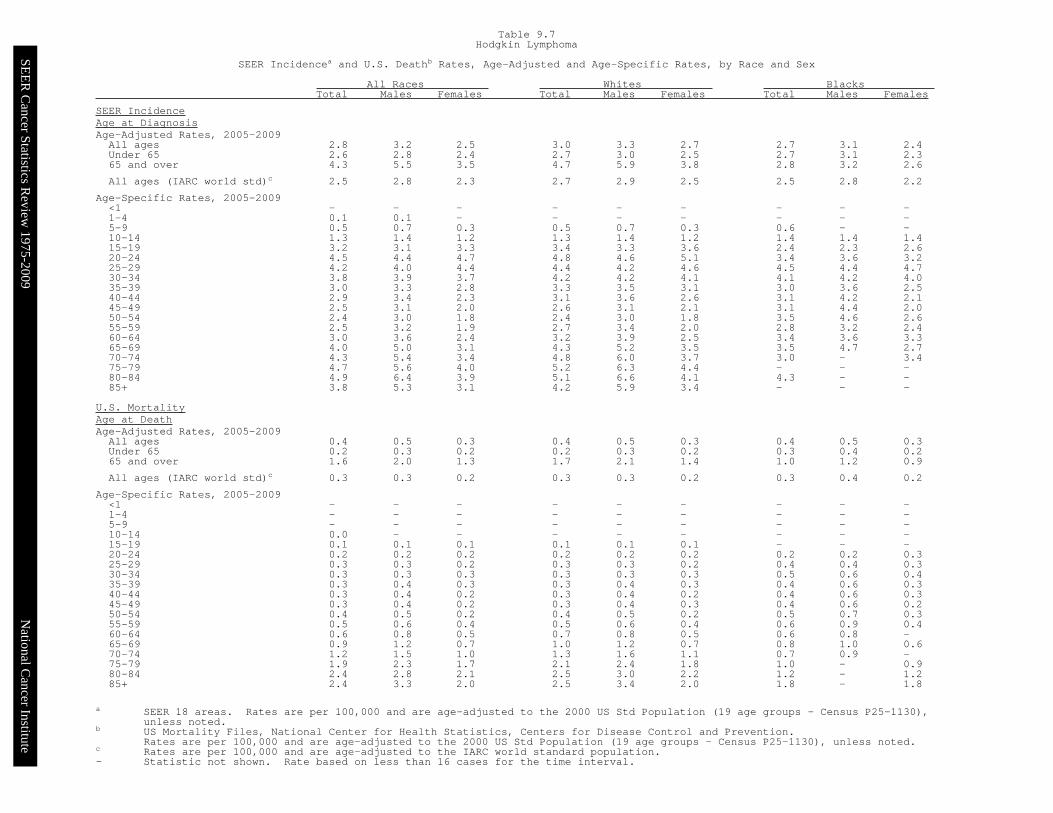
a SEER 18 areas. Rates are per 100,000 and are age-adjusted to the 2000 US Std Population (19 age groups - Census P25-1130),unless noted.
b US Mortality Files, National Center for Health Statistics, Centers for Disease Control and Prevention.Rates are per 100,000 and are age-adjusted to the 2000 US Std Population (19 age groups - Census P25-1130), unless noted.
c Rates are per 100,000 and are age-adjusted to the IARC world standard population.- Statistic not shown. Rate based on less than 16 cases for the time interval.
All Races Whites Blacks Total Males Females Total Males Females Total Males Females
SEER IncidenceAge at DiagnosisAge-Adjusted Rates, 2005-2009All ages 2.8 3.2 2.5 3.0 3.3 2.7 2.7 3.1 2.4Under 65 2.6 2.8 2.4 2.7 3.0 2.5 2.7 3.1 2.365 and over 4.3 5.5 3.5 4.7 5.9 3.8 2.8 3.2 2.6
All ages (IARC world std)c 2.5 2.8 2.3 2.7 2.9 2.5 2.5 2.8 2.2
Age-Specific Rates, 2005-2009<1 - - - - - - - - -1-4 0.1 0.1 - - - - - - -5-9 0.5 0.7 0.3 0.5 0.7 0.3 0.6 - -10-14 1.3 1.4 1.2 1.3 1.4 1.2 1.4 1.4 1.415-19 3.2 3.1 3.3 3.4 3.3 3.6 2.4 2.3 2.620-24 4.5 4.4 4.7 4.8 4.6 5.1 3.4 3.6 3.225-29 4.2 4.0 4.4 4.4 4.2 4.6 4.5 4.4 4.730-34 3.8 3.9 3.7 4.2 4.2 4.1 4.1 4.2 4.035-39 3.0 3.3 2.8 3.3 3.5 3.1 3.0 3.6 2.540-44 2.9 3.4 2.3 3.1 3.6 2.6 3.1 4.2 2.145-49 2.5 3.1 2.0 2.6 3.1 2.1 3.1 4.4 2.050-54 2.4 3.0 1.8 2.4 3.0 1.8 3.5 4.6 2.655-59 2.5 3.2 1.9 2.7 3.4 2.0 2.8 3.2 2.460-64 3.0 3.6 2.4 3.2 3.9 2.5 3.4 3.6 3.365-69 4.0 5.0 3.1 4.3 5.2 3.5 3.5 4.7 2.770-74 4.3 5.4 3.4 4.8 6.0 3.7 3.0 - 3.475-79 4.7 5.6 4.0 5.2 6.3 4.4 - - -80-84 4.9 6.4 3.9 5.1 6.6 4.1 4.3 - -85+ 3.8 5.3 3.1 4.2 5.9 3.4 - - -
U.S. MortalityAge at DeathAge-Adjusted Rates, 2005-2009All ages 0.4 0.5 0.3 0.4 0.5 0.3 0.4 0.5 0.3Under 65 0.2 0.3 0.2 0.2 0.3 0.2 0.3 0.4 0.265 and over 1.6 2.0 1.3 1.7 2.1 1.4 1.0 1.2 0.9
All ages (IARC world std)c 0.3 0.3 0.2 0.3 0.3 0.2 0.3 0.4 0.2
Age-Specific Rates, 2005-2009<1 - - - - - - - - -1-4 - - - - - - - - -5-9 - - - - - - - - -10-14 0.0 - - - - - - - -15-19 0.1 0.1 0.1 0.1 0.1 0.1 - - -20-24 0.2 0.2 0.2 0.2 0.2 0.2 0.2 0.2 0.325-29 0.3 0.3 0.2 0.3 0.3 0.2 0.4 0.4 0.330-34 0.3 0.3 0.3 0.3 0.3 0.3 0.5 0.6 0.435-39 0.3 0.4 0.3 0.3 0.4 0.3 0.4 0.6 0.340-44 0.3 0.4 0.2 0.3 0.4 0.2 0.4 0.6 0.345-49 0.3 0.4 0.2 0.3 0.4 0.3 0.4 0.6 0.250-54 0.4 0.5 0.2 0.4 0.5 0.2 0.5 0.7 0.355-59 0.5 0.6 0.4 0.5 0.6 0.4 0.6 0.9 0.460-64 0.6 0.8 0.5 0.7 0.8 0.5 0.6 0.8 -65-69 0.9 1.2 0.7 1.0 1.2 0.7 0.8 1.0 0.670-74 1.2 1.5 1.0 1.3 1.6 1.1 0.7 0.9 -75-79 1.9 2.3 1.7 2.1 2.4 1.8 1.0 - 0.980-84 2.4 2.8 2.1 2.5 3.0 2.2 1.2 - 1.285+ 2.4 3.3 2.0 2.5 3.4 2.0 1.8 - 1.8
Table 9.7Hodgkin Lymphoma
SEER Incidencea and U.S. Deathb Rates, Age-Adjusted and Age-Specific Rates, by Race and Sex
SEE
R C
ancer Statistics Review
1975-2009N
ational Cancer Institute
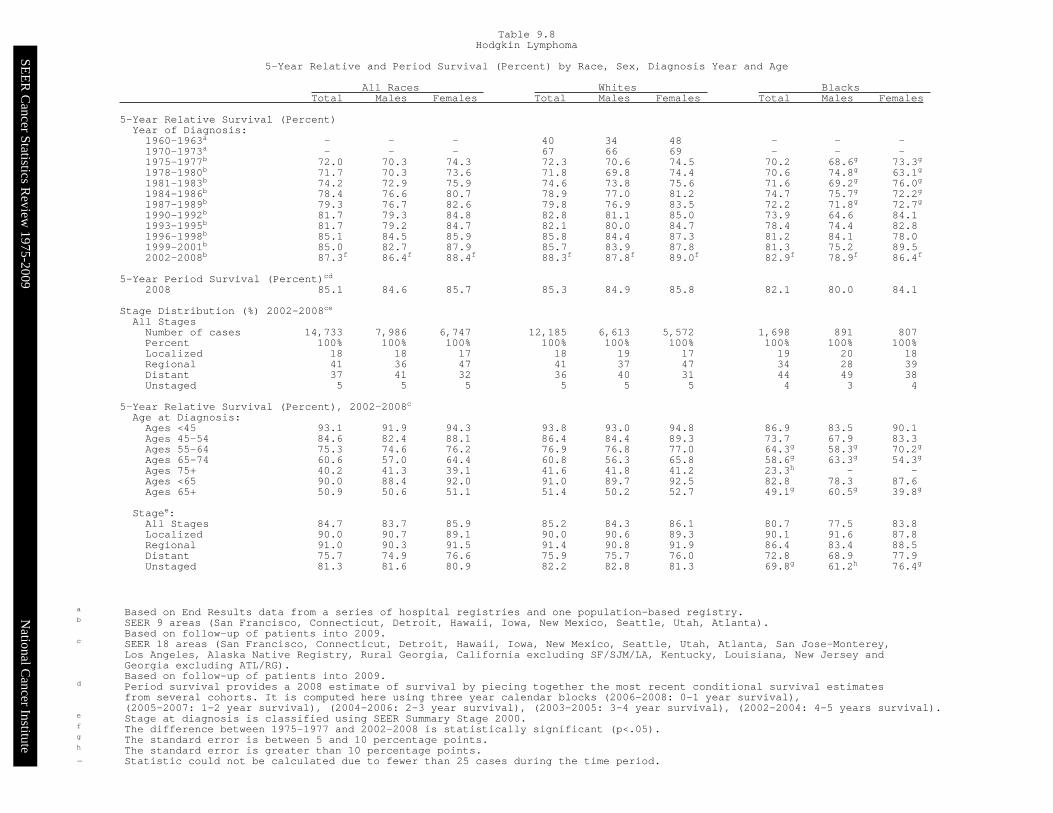
a Based on End Results data from a series of hospital registries and one population-based registry.b SEER 9 areas (San Francisco, Connecticut, Detroit, Hawaii, Iowa, New Mexico, Seattle, Utah, Atlanta).
Based on follow-up of patients into 2009.c SEER 18 areas (San Francisco, Connecticut, Detroit, Hawaii, Iowa, New Mexico, Seattle, Utah, Atlanta, San Jose-Monterey,
Los Angeles, Alaska Native Registry, Rural Georgia, California excluding SF/SJM/LA, Kentucky, Louisiana, New Jersey andGeorgia excluding ATL/RG).Based on follow-up of patients into 2009.
d Period survival provides a 2008 estimate of survival by piecing together the most recent conditional survival estimatesfrom several cohorts. It is computed here using three year calendar blocks (2006-2008: 0-1 year survival),(2005-2007: 1-2 year survival), (2004-2006: 2-3 year survival), (2003-2005: 3-4 year survival), (2002-2004: 4-5 years survival).
e Stage at diagnosis is classified using SEER Summary Stage 2000.f The difference between 1975-1977 and 2002-2008 is statistically significant (p<.05).g The standard error is between 5 and 10 percentage points.h The standard error is greater than 10 percentage points.- Statistic could not be calculated due to fewer than 25 cases during the time period.
All Races Whites Blacks Total Males Females Total Males Females Total Males Females
5-Year Relative Survival (Percent)Year of Diagnosis:1960-1963a - - - 40 34 48 - - -1970-1973a - - - 67 66 69 - - -1975-1977b 72.0 70.3 74.3 72.3 70.6 74.5 70.2 68.6g 73.3g
1978-1980b 71.7 70.3 73.6 71.8 69.8 74.4 70.6 74.8g 63.1g
1981-1983b 74.2 72.9 75.9 74.6 73.8 75.6 71.6 69.2g 76.0g
1984-1986b 78.4 76.6 80.7 78.9 77.0 81.2 74.7 75.7g 72.2g
1987-1989b 79.3 76.7 82.6 79.8 76.9 83.5 72.2 71.8g 72.7g
1990-1992b 81.7 79.3 84.8 82.8 81.1 85.0 73.9 64.6 84.11993-1995b 81.7 79.2 84.7 82.1 80.0 84.7 78.4 74.4 82.81996-1998b 85.1 84.5 85.9 85.8 84.4 87.3 81.2 84.1 78.01999-2001b 85.0 82.7 87.9 85.7 83.9 87.8 81.3 75.2 89.52002-2008b 87.3f 86.4f 88.4f 88.3f 87.8f 89.0f 82.9f 78.9f 86.4f
5-Year Period Survival (Percent)cd
2008 85.1 84.6 85.7 85.3 84.9 85.8 82.1 80.0 84.1
Stage Distribution (%) 2002-2008ce
All StagesNumber of cases 14,733 7,986 6,747 12,185 6,613 5,572 1,698 891 807Percent 100% 100% 100% 100% 100% 100% 100% 100% 100%Localized 18 18 17 18 19 17 19 20 18Regional 41 36 47 41 37 47 34 28 39Distant 37 41 32 36 40 31 44 49 38Unstaged 5 5 5 5 5 5 4 3 4
5-Year Relative Survival (Percent), 2002-2008c
Age at Diagnosis:Ages <45 93.1 91.9 94.3 93.8 93.0 94.8 86.9 83.5 90.1Ages 45-54 84.6 82.4 88.1 86.4 84.4 89.3 73.7 67.9 83.3Ages 55-64 75.3 74.6 76.2 76.9 76.8 77.0 64.3g 58.3g 70.2g
Ages 65-74 60.6 57.0 64.4 60.8 56.3 65.8 58.6g 63.3g 54.3g
Ages 75+ 40.2 41.3 39.1 41.6 41.8 41.2 23.3h - -Ages <65 90.0 88.4 92.0 91.0 89.7 92.5 82.8 78.3 87.6Ages 65+ 50.9 50.6 51.1 51.4 50.2 52.7 49.1g 60.5g 39.8g
Stagee:All Stages 84.7 83.7 85.9 85.2 84.3 86.1 80.7 77.5 83.8Localized 90.0 90.7 89.1 90.0 90.6 89.3 90.1 91.6 87.8Regional 91.0 90.3 91.5 91.4 90.8 91.9 86.4 83.4 88.5Distant 75.7 74.9 76.6 75.9 75.7 76.0 72.8 68.9 77.9Unstaged 81.3 81.6 80.9 82.2 82.8 81.3 69.8g 61.2h 76.4g
Table 9.8Hodgkin Lymphoma
5-Year Relative and Period Survival (Percent) by Race, Sex, Diagnosis Year and Age
SEE
R C
ancer Statistics Review
1975-2009N
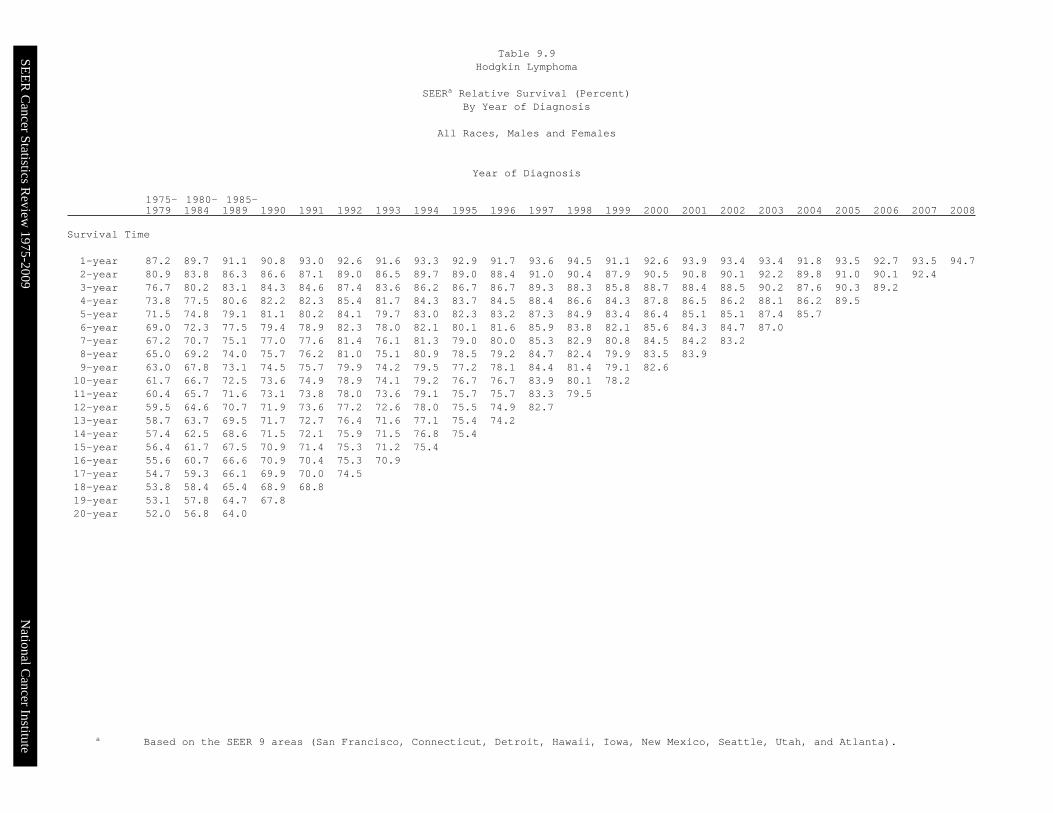
ational Cancer Institute a Based on the SEER 9 areas (San Francisco, Connecticut, Detroit, Hawaii, Iowa, New Mexico, Seattle, Utah, and Atlanta).
1975- 1980- 1985-1979 1984 1989 1990 1991 1992 1993 1994 1995 1996 1997 1998 1999 2000 2001 2002 2003 2004 2005 2006 2007 2008
Survival Time
1-year 87.2 89.7 91.1 90.8 93.0 92.6 91.6 93.3 92.9 91.7 93.6 94.5 91.1 92.6 93.9 93.4 93.4 91.8 93.5 92.7 93.5 94.72-year 80.9 83.8 86.3 86.6 87.1 89.0 86.5 89.7 89.0 88.4 91.0 90.4 87.9 90.5 90.8 90.1 92.2 89.8 91.0 90.1 92.43-year 76.7 80.2 83.1 84.3 84.6 87.4 83.6 86.2 86.7 86.7 89.3 88.3 85.8 88.7 88.4 88.5 90.2 87.6 90.3 89.24-year 73.8 77.5 80.6 82.2 82.3 85.4 81.7 84.3 83.7 84.5 88.4 86.6 84.3 87.8 86.5 86.2 88.1 86.2 89.55-year 71.5 74.8 79.1 81.1 80.2 84.1 79.7 83.0 82.3 83.2 87.3 84.9 83.4 86.4 85.1 85.1 87.4 85.76-year 69.0 72.3 77.5 79.4 78.9 82.3 78.0 82.1 80.1 81.6 85.9 83.8 82.1 85.6 84.3 84.7 87.07-year 67.2 70.7 75.1 77.0 77.6 81.4 76.1 81.3 79.0 80.0 85.3 82.9 80.8 84.5 84.2 83.28-year 65.0 69.2 74.0 75.7 76.2 81.0 75.1 80.9 78.5 79.2 84.7 82.4 79.9 83.5 83.99-year 63.0 67.8 73.1 74.5 75.7 79.9 74.2 79.5 77.2 78.1 84.4 81.4 79.1 82.610-year 61.7 66.7 72.5 73.6 74.9 78.9 74.1 79.2 76.7 76.7 83.9 80.1 78.211-year 60.4 65.7 71.6 73.1 73.8 78.0 73.6 79.1 75.7 75.7 83.3 79.512-year 59.5 64.6 70.7 71.9 73.6 77.2 72.6 78.0 75.5 74.9 82.713-year 58.7 63.7 69.5 71.7 72.7 76.4 71.6 77.1 75.4 74.214-year 57.4 62.5 68.6 71.5 72.1 75.9 71.5 76.8 75.415-year 56.4 61.7 67.5 70.9 71.4 75.3 71.2 75.416-year 55.6 60.7 66.6 70.9 70.4 75.3 70.917-year 54.7 59.3 66.1 69.9 70.0 74.518-year 53.8 58.4 65.4 68.9 68.819-year 53.1 57.8 64.7 67.820-year 52.0 56.8 64.0
Table 9.9Hodgkin Lymphoma
SEERa Relative Survival (Percent)By Year of Diagnosis
All Races, Males and Females
Year of Diagnosis

SEE
R C
ancer Statistics Review
1975-2009N
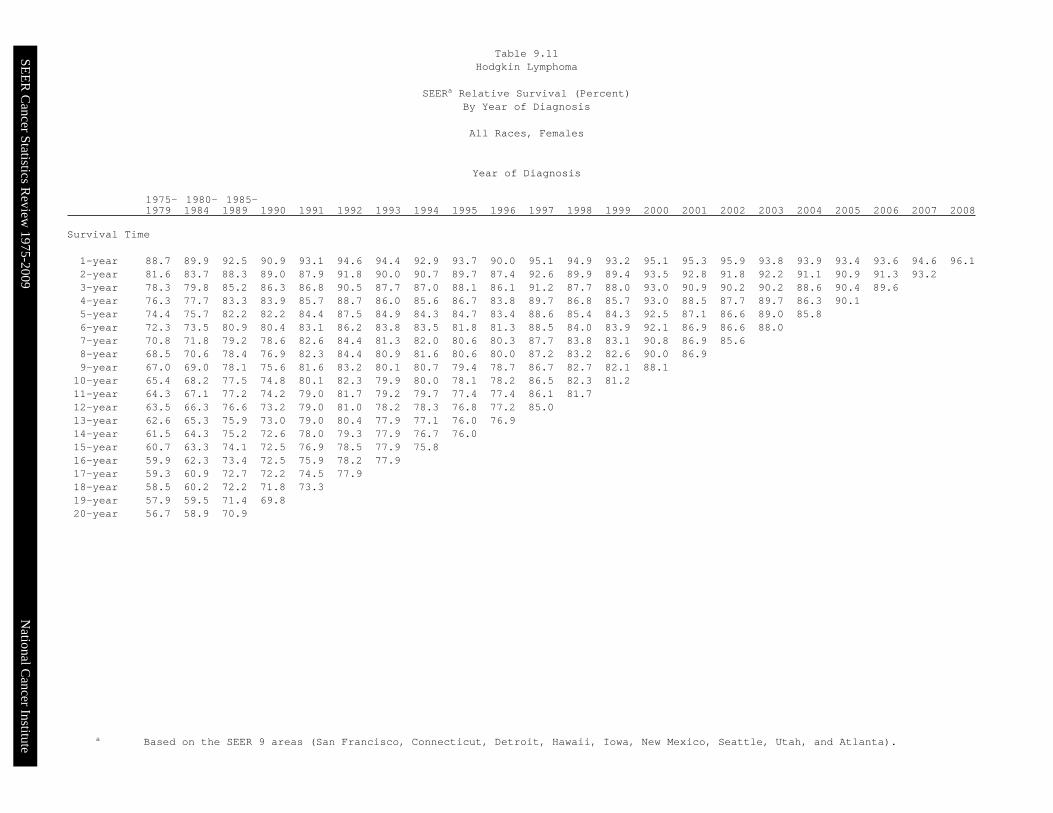
ational Cancer Institute a Based on the SEER 9 areas (San Francisco, Connecticut, Detroit, Hawaii, Iowa, New Mexico, Seattle, Utah, and Atlanta).
1975- 1980- 1985-1979 1984 1989 1990 1991 1992 1993 1994 1995 1996 1997 1998 1999 2000 2001 2002 2003 2004 2005 2006 2007 2008
Survival Time
1-year 86.1 89.6 90.0 90.7 93.0 90.9 89.3 93.6 92.2 92.9 92.1 94.2 89.3 90.8 92.9 91.0 93.0 89.7 93.6 91.9 92.6 93.52-year 80.4 83.8 84.8 84.7 86.4 86.4 83.5 88.8 88.6 89.1 89.5 90.9 86.5 88.4 89.2 88.5 92.2 88.4 91.1 89.1 91.63-year 75.5 80.4 81.5 82.6 82.8 84.6 80.2 85.6 85.4 87.1 87.5 88.8 83.8 85.4 86.4 86.9 90.1 86.7 90.2 88.84-year 72.0 77.4 78.5 80.7 79.7 82.4 77.9 83.1 81.3 85.1 87.0 86.4 82.8 83.7 85.0 84.8 86.8 85.9 88.95-year 69.4 74.1 76.6 80.2 76.8 80.8 75.3 81.9 80.5 83.0 86.0 84.4 82.5 81.9 83.5 83.7 86.0 85.66-year 66.6 71.5 74.8 78.6 75.7 78.7 72.9 80.8 78.8 81.8 83.6 83.5 80.4 80.9 82.0 82.9 86.07-year 64.5 69.8 71.9 75.7 73.5 78.6 71.7 80.5 77.6 79.7 82.9 82.1 78.6 80.0 81.6 81.08-year 62.5 68.2 70.4 74.7 71.3 77.5 70.3 80.3 76.5 78.6 82.3 81.6 77.5 78.8 81.29-year 60.0 67.0 69.2 73.5 71.0 76.9 69.1 78.5 75.4 77.5 82.2 80.2 76.2 78.610-year 58.9 65.6 68.5 72.5 70.5 75.7 69.1 78.4 75.4 75.5 81.3 78.1 75.111-year 57.5 64.7 67.1 72.1 69.7 74.5 68.7 78.3 74.3 74.3 80.7 77.512-year 56.4 63.3 66.0 70.7 69.2 73.5 67.7 77.6 74.3 72.7 80.313-year 55.8 62.5 64.3 70.4 67.8 72.7 66.0 77.2 74.3 72.114-year 54.4 61.2 63.4 70.4 67.5 72.7 65.7 77.0 74.315-year 53.2 60.4 62.1 69.6 67.0 72.2 65.0 74.916-year 52.4 59.4 61.2 69.4 66.0 72.2 64.617-year 51.2 58.1 60.7 67.9 66.0 71.318-year 50.2 56.9 60.0 66.7 65.319-year 49.5 56.5 59.4 66.120-year 48.5 55.2 58.5
Table 9.10Hodgkin Lymphoma
SEERa Relative Survival (Percent)By Year of Diagnosis
All Races, Males
Year of Diagnosis
SEE
R C
ancer Statistics Review
1975-2009N
ational Cancer Institute a Based on the SEER 9 areas (San Francisco, Connecticut, Detroit, Hawaii, Iowa, New Mexico, Seattle, Utah, and Atlanta).
1975- 1980- 1985-1979 1984 1989 1990 1991 1992 1993 1994 1995 1996 1997 1998 1999 2000 2001 2002 2003 2004 2005 2006 2007 2008
Survival Time
1-year 88.7 89.9 92.5 90.9 93.1 94.6 94.4 92.9 93.7 90.0 95.1 94.9 93.2 95.1 95.3 95.9 93.8 93.9 93.4 93.6 94.6 96.12-year 81.6 83.7 88.3 89.0 87.9 91.8 90.0 90.7 89.7 87.4 92.6 89.9 89.4 93.5 92.8 91.8 92.2 91.1 90.9 91.3 93.23-year 78.3 79.8 85.2 86.3 86.8 90.5 87.7 87.0 88.1 86.1 91.2 87.7 88.0 93.0 90.9 90.2 90.2 88.6 90.4 89.64-year 76.3 77.7 83.3 83.9 85.7 88.7 86.0 85.6 86.7 83.8 89.7 86.8 85.7 93.0 88.5 87.7 89.7 86.3 90.15-year 74.4 75.7 82.2 82.2 84.4 87.5 84.9 84.3 84.7 83.4 88.6 85.4 84.3 92.5 87.1 86.6 89.0 85.86-year 72.3 73.5 80.9 80.4 83.1 86.2 83.8 83.5 81.8 81.3 88.5 84.0 83.9 92.1 86.9 86.6 88.07-year 70.8 71.8 79.2 78.6 82.6 84.4 81.3 82.0 80.6 80.3 87.7 83.8 83.1 90.8 86.9 85.68-year 68.5 70.6 78.4 76.9 82.3 84.4 80.9 81.6 80.6 80.0 87.2 83.2 82.6 90.0 86.99-year 67.0 69.0 78.1 75.6 81.6 83.2 80.1 80.7 79.4 78.7 86.7 82.7 82.1 88.110-year 65.4 68.2 77.5 74.8 80.1 82.3 79.9 80.0 78.1 78.2 86.5 82.3 81.211-year 64.3 67.1 77.2 74.2 79.0 81.7 79.2 79.7 77.4 77.4 86.1 81.712-year 63.5 66.3 76.6 73.2 79.0 81.0 78.2 78.3 76.8 77.2 85.013-year 62.6 65.3 75.9 73.0 79.0 80.4 77.9 77.1 76.0 76.914-year 61.5 64.3 75.2 72.6 78.0 79.3 77.9 76.7 76.015-year 60.7 63.3 74.1 72.5 76.9 78.5 77.9 75.816-year 59.9 62.3 73.4 72.5 75.9 78.2 77.917-year 59.3 60.9 72.7 72.2 74.5 77.918-year 58.5 60.2 72.2 71.8 73.319-year 57.9 59.5 71.4 69.820-year 56.7 58.9 70.9
Table 9.11Hodgkin Lymphoma
SEERa Relative Survival (Percent)By Year of Diagnosis
All Races, Females
Year of Diagnosis
SEE
R C
ancer Statistics Review
1975-2009N
ational Cancer Institute
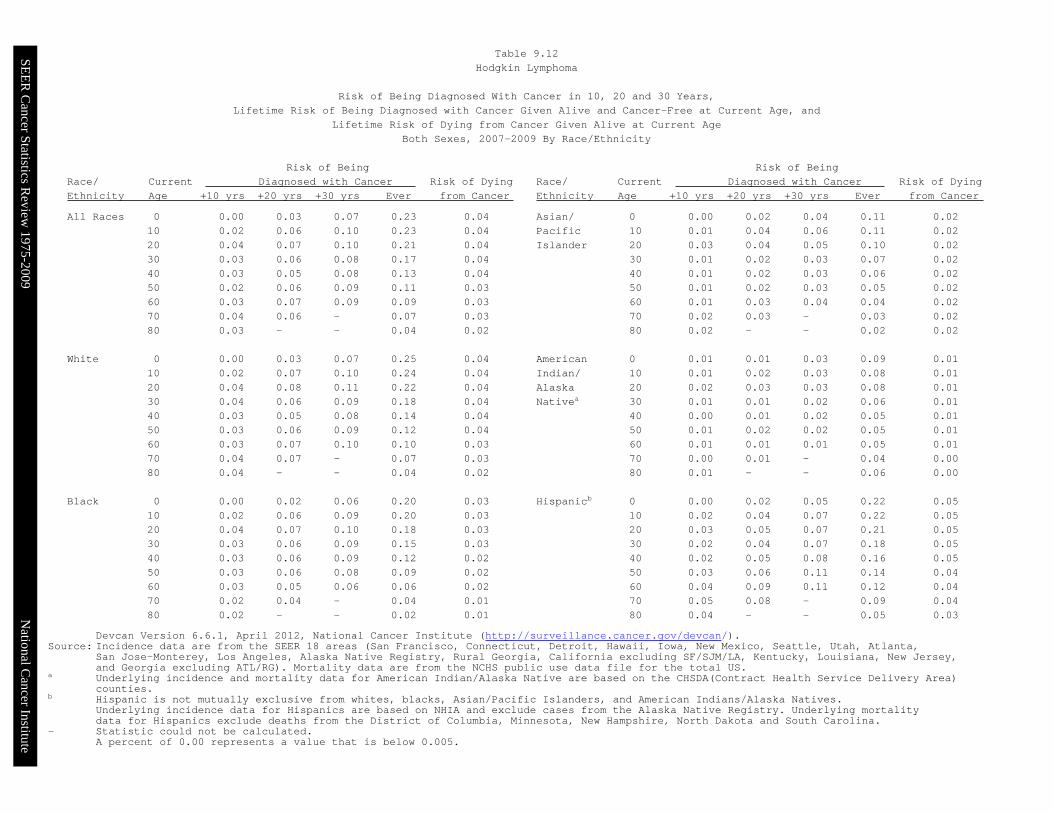
Devcan Version 6.6.1, April 2012, National Cancer Institute (http://surveillance.cancer.gov/devcan/).Source: Incidence data are from the SEER 18 areas (San Francisco, Connecticut, Detroit, Hawaii, Iowa, New Mexico, Seattle, Utah, Atlanta,
San Jose-Monterey, Los Angeles, Alaska Native Registry, Rural Georgia, California excluding SF/SJM/LA, Kentucky, Louisiana, New Jersey,and Georgia excluding ATL/RG). Mortality data are from the NCHS public use data file for the total US.
a Underlying incidence and mortality data for American Indian/Alaska Native are based on the CHSDA(Contract Health Service Delivery Area)counties.
b Hispanic is not mutually exclusive from whites, blacks, Asian/Pacific Islanders, and American Indians/Alaska Natives.Underlying incidence data for Hispanics are based on NHIA and exclude cases from the Alaska Native Registry. Underlying mortalitydata for Hispanics exclude deaths from the District of Columbia, Minnesota, New Hampshire, North Dakota and South Carolina.
- Statistic could not be calculated.A percent of 0.00 represents a value that is below 0.005.
Risk of Being Risk of Being
Race/ Current Diagnosed with Cancer Risk of Dying Race/ Current Diagnosed with Cancer Risk of Dying
Ethnicity Age +10 yrs +20 yrs +30 yrs Ever from Cancer Ethnicity Age +10 yrs +20 yrs +30 yrs Ever from Cancer
All Races 0 0.00 0.03 0.07 0.23 0.04 Asian/ 0 0.00 0.02 0.04 0.11 0.02
10 0.02 0.06 0.10 0.23 0.04 Pacific 10 0.01 0.04 0.06 0.11 0.02
20 0.04 0.07 0.10 0.21 0.04 Islander 20 0.03 0.04 0.05 0.10 0.02
30 0.03 0.06 0.08 0.17 0.04 30 0.01 0.02 0.03 0.07 0.02
40 0.03 0.05 0.08 0.13 0.04 40 0.01 0.02 0.03 0.06 0.02
50 0.02 0.06 0.09 0.11 0.03 50 0.01 0.02 0.03 0.05 0.02
60 0.03 0.07 0.09 0.09 0.03 60 0.01 0.03 0.04 0.04 0.02
70 0.04 0.06 - 0.07 0.03 70 0.02 0.03 - 0.03 0.02
80 0.03 - - 0.04 0.02 80 0.02 - - 0.02 0.02
White 0 0.00 0.03 0.07 0.25 0.04 American 0 0.01 0.01 0.03 0.09 0.01
10 0.02 0.07 0.10 0.24 0.04 Indian/ 10 0.01 0.02 0.03 0.08 0.01
20 0.04 0.08 0.11 0.22 0.04 Alaska 20 0.02 0.03 0.03 0.08 0.01
30 0.04 0.06 0.09 0.18 0.04 Nativea 30 0.01 0.01 0.02 0.06 0.01
40 0.03 0.05 0.08 0.14 0.04 40 0.00 0.01 0.02 0.05 0.01
50 0.03 0.06 0.09 0.12 0.04 50 0.01 0.02 0.02 0.05 0.01
60 0.03 0.07 0.10 0.10 0.03 60 0.01 0.01 0.01 0.05 0.01
70 0.04 0.07 - 0.07 0.03 70 0.00 0.01 - 0.04 0.00
80 0.04 - - 0.04 0.02 80 0.01 - - 0.06 0.00
Black 0 0.00 0.02 0.06 0.20 0.03 Hispanicb 0 0.00 0.02 0.05 0.22 0.05
10 0.02 0.06 0.09 0.20 0.03 10 0.02 0.04 0.07 0.22 0.05
20 0.04 0.07 0.10 0.18 0.03 20 0.03 0.05 0.07 0.21 0.05
30 0.03 0.06 0.09 0.15 0.03 30 0.02 0.04 0.07 0.18 0.05
40 0.03 0.06 0.09 0.12 0.02 40 0.02 0.05 0.08 0.16 0.05
50 0.03 0.06 0.08 0.09 0.02 50 0.03 0.06 0.11 0.14 0.04
60 0.03 0.05 0.06 0.06 0.02 60 0.04 0.09 0.11 0.12 0.04
70 0.02 0.04 - 0.04 0.01 70 0.05 0.08 - 0.09 0.04
80 0.02 - - 0.02 0.01 80 0.04 - - 0.05 0.03
Table 9.12
Hodgkin Lymphoma
Risk of Being Diagnosed With Cancer in 10, 20 and 30 Years,
Lifetime Risk of Being Diagnosed with Cancer Given Alive and Cancer-Free at Current Age, and
Lifetime Risk of Dying from Cancer Given Alive at Current Age
Both Sexes, 2007-2009 By Race/Ethnicity
SEE
R C
ancer Statistics Review
1975-2009N
ational Cancer Institute
Devcan Version 6.6.1, April 2012, National Cancer Institute (http://surveillance.cancer.gov/devcan/).Source: Incidence data are from the SEER 18 areas (San Francisco, Connecticut, Detroit, Hawaii, Iowa, New Mexico, Seattle, Utah, Atlanta,
San Jose-Monterey, Los Angeles, Alaska Native Registry, Rural Georgia, California excluding SF/SJM/LA, Kentucky, Louisiana, New Jersey,and Georgia excluding ATL/RG). Mortality data are from the NCHS public use data file for the total US.
a Underlying incidence and mortality data for American Indian/Alaska Native are based on the CHSDA(Contract Health Service Delivery Area)counties.
b Hispanic is not mutually exclusive from whites, blacks, Asian/Pacific Islanders, and American Indians/Alaska Natives.Underlying incidence data for Hispanics are based on NHIA and exclude cases from the Alaska Native Registry. Underlying mortalitydata for Hispanics exclude deaths from the District of Columbia, Minnesota, New Hampshire, North Dakota and South Carolina.
- Statistic could not be calculated.A percent of 0.00 represents a value that is below 0.005.
Risk of Being Risk of Being
Race/ Current Diagnosed with Cancer Risk of Dying Race/ Current Diagnosed with Cancer Risk of Dying
Ethnicity Age +10 yrs +20 yrs +30 yrs Ever from Cancer Ethnicity Age +10 yrs +20 yrs +30 yrs Ever from Cancer
All Races 0 0.00 0.03 0.07 0.25 0.04 Asian/ 0 0.00 0.02 0.05 0.13 0.03
10 0.02 0.06 0.10 0.25 0.04 Pacific 10 0.02 0.05 0.06 0.13 0.03
20 0.04 0.08 0.11 0.23 0.04 Islander 20 0.03 0.04 0.06 0.11 0.03
30 0.04 0.07 0.10 0.19 0.04 30 0.01 0.03 0.03 0.08 0.03
40 0.03 0.06 0.10 0.16 0.04 40 0.01 0.02 0.04 0.07 0.03
50 0.03 0.07 0.10 0.13 0.04 50 0.01 0.03 0.04 0.06 0.03
60 0.04 0.08 0.10 0.11 0.04 60 0.02 0.04 0.05 0.05 0.03
70 0.05 0.08 - 0.08 0.03 70 0.02 0.03 - 0.03 0.02
80 0.04 - - 0.05 0.02 80 0.02 - - 0.02 0.02
White 0 0.00 0.03 0.07 0.27 0.05 American 0 0.01 0.01 0.03 0.06 0.02
10 0.02 0.06 0.10 0.26 0.05 Indian/ 10 0.01 0.03 0.03 0.05 0.02
20 0.04 0.08 0.11 0.24 0.05 Alaska 20 0.02 0.03 0.03 0.05 0.02
30 0.04 0.07 0.10 0.20 0.05 Nativea 30 0.01 0.01 0.03 0.03 0.02
40 0.03 0.06 0.10 0.17 0.04 40 0.00 0.02 0.02 0.02 0.02
50 0.03 0.07 0.11 0.14 0.04 50 0.02 0.02 0.02 0.02 0.02
60 0.04 0.09 0.11 0.11 0.04 60 0.00 0.00 0.00 0.00 0.02
70 0.05 0.08 - 0.09 0.03 70 0.00 0.00 - 0.00 0.00
80 0.04 - - 0.05 0.02 80 0.00 - - 0.00 0.00
Black 0 0.00 0.02 0.06 0.22 0.03 Hispanicb 0 0.01 0.02 0.05 0.24 0.06
10 0.02 0.06 0.09 0.22 0.03 10 0.02 0.04 0.06 0.24 0.06
20 0.04 0.08 0.12 0.20 0.03 20 0.03 0.05 0.07 0.22 0.06
30 0.04 0.08 0.12 0.16 0.03 30 0.02 0.05 0.08 0.20 0.06
40 0.04 0.08 0.11 0.13 0.03 40 0.02 0.05 0.09 0.18 0.05
50 0.04 0.07 0.08 0.09 0.02 50 0.03 0.07 0.12 0.16 0.05
60 0.03 0.05 0.06 0.06 0.02 60 0.04 0.10 0.13 0.14 0.05
70 0.02 0.04 - 0.04 0.01 70 0.07 0.11 - 0.11 0.05
80 0.03 - - 0.03 0.01 80 0.05 - - 0.06 0.03
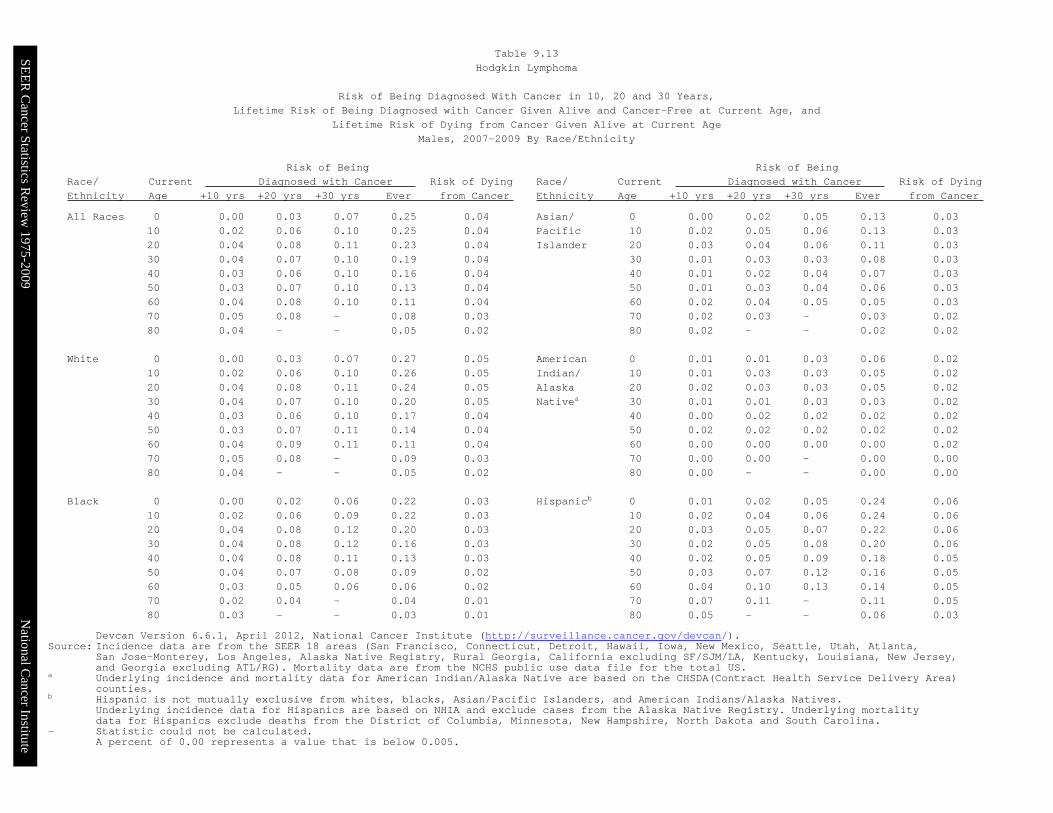
Table 9.13
Hodgkin Lymphoma
Risk of Being Diagnosed With Cancer in 10, 20 and 30 Years,
Lifetime Risk of Being Diagnosed with Cancer Given Alive and Cancer-Free at Current Age, and
Lifetime Risk of Dying from Cancer Given Alive at Current Age
Males, 2007-2009 By Race/Ethnicity

SEE
R C
ancer Statistics Review
1975-2009N
ational Cancer Institute
Devcan Version 6.6.1, April 2012, National Cancer Institute (http://surveillance.cancer.gov/devcan/).Source: Incidence data are from the SEER 18 areas (San Francisco, Connecticut, Detroit, Hawaii, Iowa, New Mexico, Seattle, Utah, Atlanta,
San Jose-Monterey, Los Angeles, Alaska Native Registry, Rural Georgia, California excluding SF/SJM/LA, Kentucky, Louisiana, New Jersey,and Georgia excluding ATL/RG). Mortality data are from the NCHS public use data file for the total US.
a Underlying incidence and mortality data for American Indian/Alaska Native are based on the CHSDA(Contract Health Service Delivery Area)counties.
b Hispanic is not mutually exclusive from whites, blacks, Asian/Pacific Islanders, and American Indians/Alaska Natives.Underlying incidence data for Hispanics are based on NHIA and exclude cases from the Alaska Native Registry. Underlying mortalitydata for Hispanics exclude deaths from the District of Columbia, Minnesota, New Hampshire, North Dakota and South Carolina.
- Statistic could not be calculated.A percent of 0.00 represents a value that is below 0.005.
Risk of Being Risk of Being
Race/ Current Diagnosed with Cancer Risk of Dying Race/ Current Diagnosed with Cancer Risk of Dying
Ethnicity Age +10 yrs +20 yrs +30 yrs Ever from Cancer Ethnicity Age +10 yrs +20 yrs +30 yrs Ever from Cancer
All Races 0 0.00 0.03 0.07 0.21 0.04 Asian/ 0 0.00 0.01 0.04 0.10 0.02
10 0.02 0.07 0.10 0.21 0.04 Pacific 10 0.01 0.04 0.05 0.10 0.02
20 0.04 0.07 0.10 0.19 0.04 Islander 20 0.02 0.04 0.05 0.09 0.02
30 0.03 0.05 0.07 0.14 0.03 30 0.01 0.02 0.03 0.07 0.02
40 0.02 0.04 0.07 0.11 0.03 40 0.01 0.02 0.02 0.05 0.02
50 0.02 0.05 0.07 0.09 0.03 50 0.01 0.02 0.03 0.04 0.02
60 0.03 0.06 0.08 0.08 0.03 60 0.01 0.02 0.04 0.04 0.01
70 0.03 0.05 - 0.06 0.03 70 0.01 0.03 - 0.03 0.01
80 0.03 - - 0.03 0.02 80 0.02 - - 0.02 0.01
White 0 0.00 0.03 0.07 0.23 0.04 American 0 0.01 0.01 0.03 0.11 0.00
10 0.03 0.07 0.11 0.23 0.04 Indian/ 10 0.01 0.02 0.03 0.11 0.00
20 0.05 0.08 0.10 0.20 0.04 Alaska 20 0.02 0.02 0.03 0.10 0.00
30 0.03 0.06 0.08 0.15 0.04 Nativea 30 0.01 0.02 0.02 0.09 0.00
40 0.02 0.04 0.07 0.12 0.03 40 0.01 0.01 0.02 0.08 0.00
50 0.02 0.05 0.08 0.10 0.03 50 0.00 0.01 0.01 0.07 0.00
60 0.03 0.06 0.08 0.08 0.03 60 0.01 0.01 0.02 0.08 0.00
70 0.04 0.06 - 0.06 0.03 70 0.00 0.01 - 0.07 0.00
80 0.03 - - 0.03 0.02 80 0.02 - - 0.10 0.00
Black 0 0.00 0.02 0.06 0.18 0.03 Hispanicb 0 0.00 0.02 0.05 0.21 0.04
10 0.02 0.06 0.09 0.19 0.03 10 0.02 0.05 0.07 0.21 0.04
20 0.04 0.07 0.09 0.17 0.03 20 0.03 0.05 0.07 0.19 0.04
30 0.03 0.05 0.07 0.13 0.02 30 0.02 0.04 0.06 0.16 0.04
40 0.02 0.04 0.07 0.10 0.02 40 0.02 0.04 0.07 0.14 0.04
50 0.02 0.05 0.07 0.09 0.02 50 0.02 0.06 0.10 0.12 0.04
60 0.03 0.05 0.06 0.07 0.02 60 0.04 0.08 0.10 0.10 0.04
70 0.02 0.04 - 0.04 0.02 70 0.04 0.06 - 0.07 0.03
80 0.02 - - 0.02 0.01 80 0.03 - - 0.04 0.02
Table 9.14
Hodgkin Lymphoma
Risk of Being Diagnosed With Cancer in 10, 20 and 30 Years,
Lifetime Risk of Being Diagnosed with Cancer Given Alive and Cancer-Free at Current Age, and
Lifetime Risk of Dying from Cancer Given Alive at Current Age
Females, 2007-2009 By Race/Ethnicity
SEER Cancer Statistics Review 1975-2009 National Cancer Institute
The AAPC is the Average Annual Percent Change over the time interval. The AAPCs are calculated bythe Joinpoint Regression Program Version 3.5, April 2011, National Cancer Institute.
- Statistic not shown. Rate based on less than 16 cases for the time interval.Trend based on less than 10 cases for at least one year within the time interval.
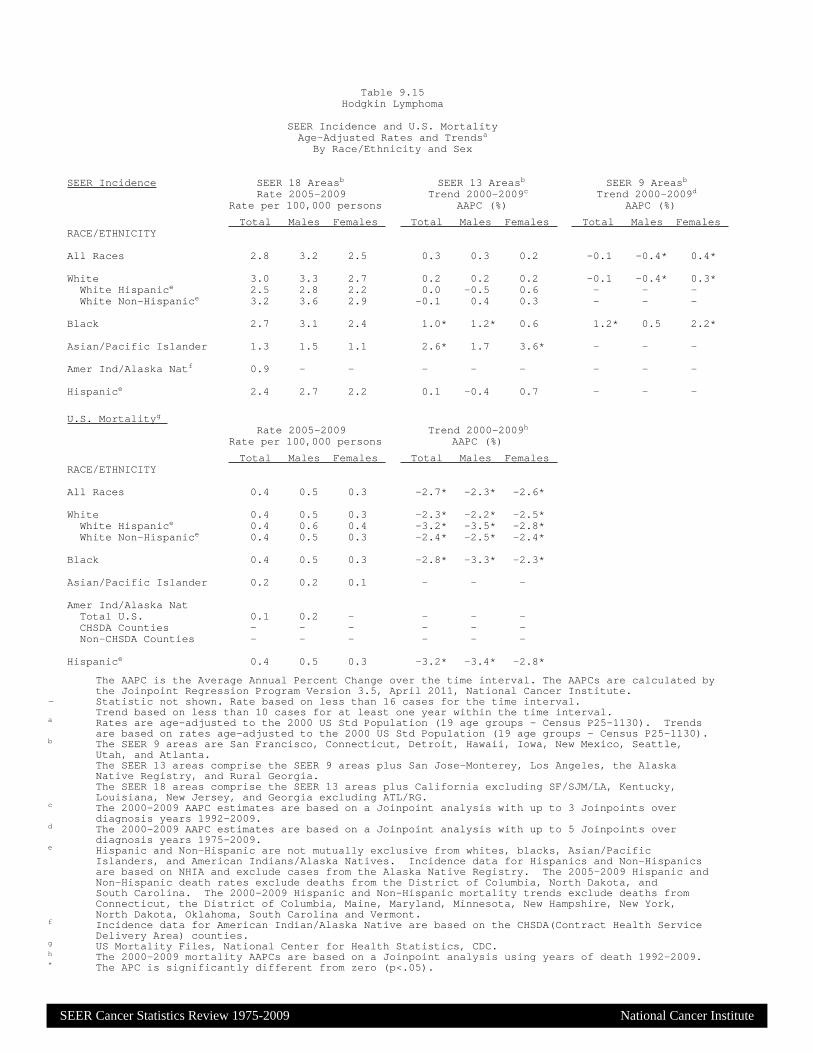
a Rates are age-adjusted to the 2000 US Std Population (19 age groups - Census P25-1130). Trendsare based on rates age-adjusted to the 2000 US Std Population (19 age groups - Census P25-1130).
b The SEER 9 areas are San Francisco, Connecticut, Detroit, Hawaii, Iowa, New Mexico, Seattle,Utah, and Atlanta.The SEER 13 areas comprise the SEER 9 areas plus San Jose-Monterey, Los Angeles, the AlaskaNative Registry, and Rural Georgia.The SEER 18 areas comprise the SEER 13 areas plus California excluding SF/SJM/LA, Kentucky,Louisiana, New Jersey, and Georgia excluding ATL/RG.
c The 2000-2009 AAPC estimates are based on a Joinpoint analysis with up to 3 Joinpoints overdiagnosis years 1992-2009.
d The 2000-2009 AAPC estimates are based on a Joinpoint analysis with up to 5 Joinpoints overdiagnosis years 1975-2009.
e Hispanic and Non-Hispanic are not mutually exclusive from whites, blacks, Asian/PacificIslanders, and American Indians/Alaska Natives. Incidence data for Hispanics and Non-Hispanicsare based on NHIA and exclude cases from the Alaska Native Registry. The 2005-2009 Hispanic andNon-Hispanic death rates exclude deaths from the District of Columbia, North Dakota, andSouth Carolina. The 2000-2009 Hispanic and Non-Hispanic mortality trends exclude deaths fromConnecticut, the District of Columbia, Maine, Maryland, Minnesota, New Hampshire, New York,North Dakota, Oklahoma, South Carolina and Vermont.
f Incidence data for American Indian/Alaska Native are based on the CHSDA(Contract Health ServiceDelivery Area) counties.
g US Mortality Files, National Center for Health Statistics, CDC.h The 2000-2009 mortality AAPCs are based on a Joinpoint analysis using years of death 1992-2009.* The APC is significantly different from zero (p<.05).
SEER Incidence SEER 18 Areasb SEER 13 Areasb SEER 9 Areasb
Rate 2005-2009 Trend 2000-2009c Trend 2000-2009d
Rate per 100,000 persons AAPC (%) AAPC (%)
Total Males Females Total Males Females Total Males Females RACE/ETHNICITY
All Races 2.8 3.2 2.5 0.3 0.3 0.2 -0.1 -0.4* 0.4*
White 3.0 3.3 2.7 0.2 0.2 0.2 -0.1 -0.4* 0.3*White Hispanice 2.5 2.8 2.2 0.0 -0.5 0.6 - - -White Non-Hispanice 3.2 3.6 2.9 -0.1 0.4 0.3 - - -
Black 2.7 3.1 2.4 1.0* 1.2* 0.6 1.2* 0.5 2.2*
Asian/Pacific Islander 1.3 1.5 1.1 2.6* 1.7 3.6* - - -
Amer Ind/Alaska Natf 0.9 - - - - - - - -
Hispanice 2.4 2.7 2.2 0.1 -0.4 0.7 - - -
U.S. Mortalityg Rate 2005-2009 Trend 2000-2009h
Rate per 100,000 persons AAPC (%)
Total Males Females Total Males FemalesRACE/ETHNICITY
All Races 0.4 0.5 0.3 -2.7* -2.3* -2.6*
White 0.4 0.5 0.3 -2.3* -2.2* -2.5*White Hispanice 0.4 0.6 0.4 -3.2* -3.5* -2.8*White Non-Hispanice 0.4 0.5 0.3 -2.4* -2.5* -2.4*
Black 0.4 0.5 0.3 -2.8* -3.3* -2.3*
Asian/Pacific Islander 0.2 0.2 0.1 - - -
Amer Ind/Alaska NatTotal U.S. 0.1 0.2 - - - -CHSDA Counties - - - - - -Non-CHSDA Counties - - - - - -
Hispanice 0.4 0.5 0.3 -3.2* -3.4* -2.8*
Table 9.15Hodgkin Lymphoma
SEER Incidence and U.S. MortalityAge-Adjusted Rates and Trendsa
By Race/Ethnicity and Sex
SEE
R C
ancer Statistics Review
1975-2009N
ational Cancer Institute
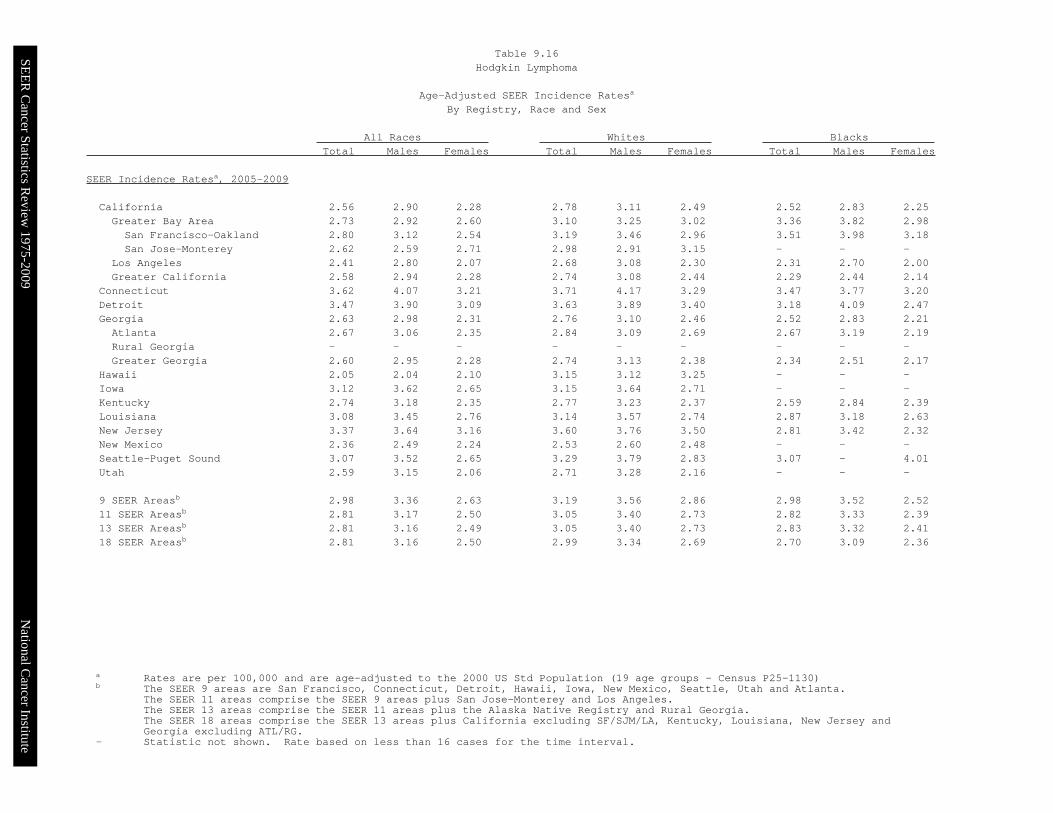
a Rates are per 100,000 and are age-adjusted to the 2000 US Std Population (19 age groups - Census P25-1130)b The SEER 9 areas are San Francisco, Connecticut, Detroit, Hawaii, Iowa, New Mexico, Seattle, Utah and Atlanta.
The SEER 11 areas comprise the SEER 9 areas plus San Jose-Monterey and Los Angeles.The SEER 13 areas comprise the SEER 11 areas plus the Alaska Native Registry and Rural Georgia.The SEER 18 areas comprise the SEER 13 areas plus California excluding SF/SJM/LA, Kentucky, Louisiana, New Jersey andGeorgia excluding ATL/RG.
- Statistic not shown. Rate based on less than 16 cases for the time interval.
All Races Whites Blacks Total Males Females Total Males Females Total Males Females
SEER Incidence Ratesa, 2005-2009
California 2.56 2.90 2.28 2.78 3.11 2.49 2.52 2.83 2.25Greater Bay Area 2.73 2.92 2.60 3.10 3.25 3.02 3.36 3.82 2.98San Francisco-Oakland 2.80 3.12 2.54 3.19 3.46 2.96 3.51 3.98 3.18San Jose-Monterey 2.62 2.59 2.71 2.98 2.91 3.15 - - -
Los Angeles 2.41 2.80 2.07 2.68 3.08 2.30 2.31 2.70 2.00Greater California 2.58 2.94 2.28 2.74 3.08 2.44 2.29 2.44 2.14
Connecticut 3.62 4.07 3.21 3.71 4.17 3.29 3.47 3.77 3.20Detroit 3.47 3.90 3.09 3.63 3.89 3.40 3.18 4.09 2.47Georgia 2.63 2.98 2.31 2.76 3.10 2.46 2.52 2.83 2.21Atlanta 2.67 3.06 2.35 2.84 3.09 2.69 2.67 3.19 2.19Rural Georgia - - - - - - - - -Greater Georgia 2.60 2.95 2.28 2.74 3.13 2.38 2.34 2.51 2.17
Hawaii 2.05 2.04 2.10 3.15 3.12 3.25 - - -Iowa 3.12 3.62 2.65 3.15 3.64 2.71 - - -Kentucky 2.74 3.18 2.35 2.77 3.23 2.37 2.59 2.84 2.39Louisiana 3.08 3.45 2.76 3.14 3.57 2.74 2.87 3.18 2.63New Jersey 3.37 3.64 3.16 3.60 3.76 3.50 2.81 3.42 2.32New Mexico 2.36 2.49 2.24 2.53 2.60 2.48 - - -Seattle-Puget Sound 3.07 3.52 2.65 3.29 3.79 2.83 3.07 - 4.01Utah 2.59 3.15 2.06 2.71 3.28 2.16 - - -
9 SEER Areasb 2.98 3.36 2.63 3.19 3.56 2.86 2.98 3.52 2.5211 SEER Areasb 2.81 3.17 2.50 3.05 3.40 2.73 2.82 3.33 2.3913 SEER Areasb 2.81 3.16 2.49 3.05 3.40 2.73 2.83 3.32 2.4118 SEER Areasb 2.81 3.16 2.50 2.99 3.34 2.69 2.70 3.09 2.36
Table 9.16Hodgkin Lymphoma
Age-Adjusted SEER Incidence Ratesa
By Registry, Race and Sex
SEE
R C
ancer Statistics Review
1975-2009N
ational Cancer Institute
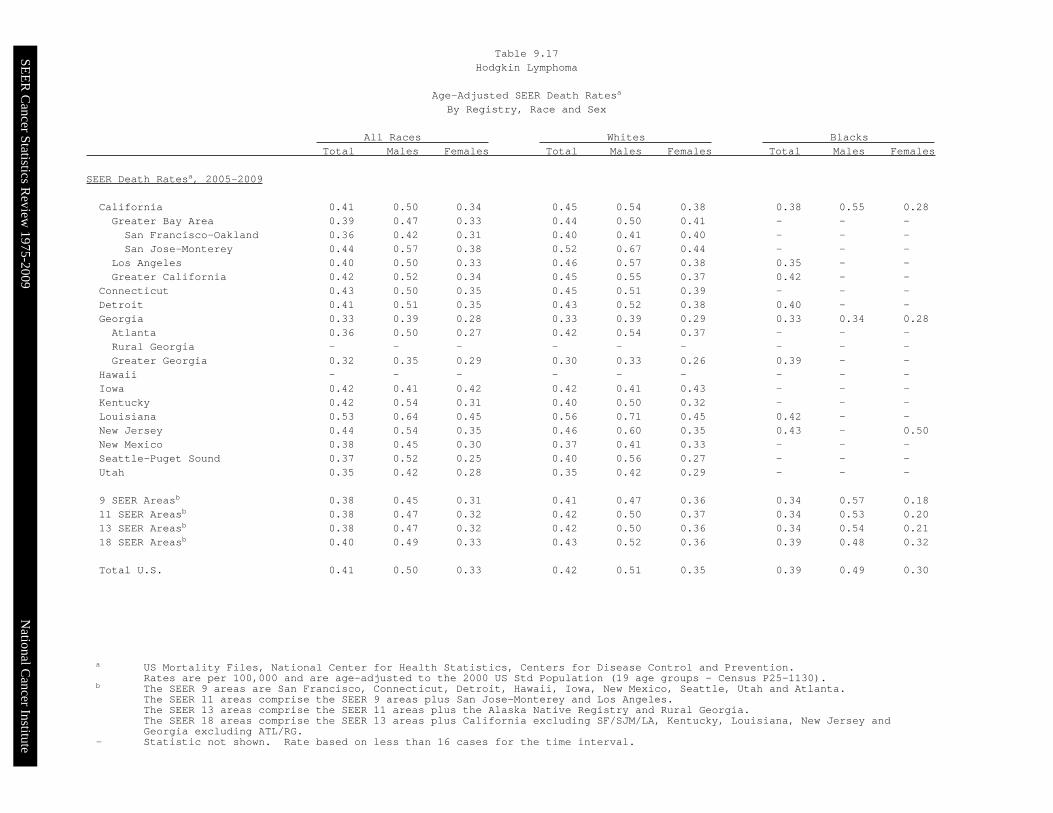
a US Mortality Files, National Center for Health Statistics, Centers for Disease Control and Prevention.Rates are per 100,000 and are age-adjusted to the 2000 US Std Population (19 age groups - Census P25-1130).
b The SEER 9 areas are San Francisco, Connecticut, Detroit, Hawaii, Iowa, New Mexico, Seattle, Utah and Atlanta.The SEER 11 areas comprise the SEER 9 areas plus San Jose-Monterey and Los Angeles.The SEER 13 areas comprise the SEER 11 areas plus the Alaska Native Registry and Rural Georgia.The SEER 18 areas comprise the SEER 13 areas plus California excluding SF/SJM/LA, Kentucky, Louisiana, New Jersey andGeorgia excluding ATL/RG.
- Statistic not shown. Rate based on less than 16 cases for the time interval.
All Races Whites Blacks Total Males Females Total Males Females Total Males Females
SEER Death Ratesa, 2005-2009
California 0.41 0.50 0.34 0.45 0.54 0.38 0.38 0.55 0.28Greater Bay Area 0.39 0.47 0.33 0.44 0.50 0.41 - - -San Francisco-Oakland 0.36 0.42 0.31 0.40 0.41 0.40 - - -San Jose-Monterey 0.44 0.57 0.38 0.52 0.67 0.44 - - -
Los Angeles 0.40 0.50 0.33 0.46 0.57 0.38 0.35 - -Greater California 0.42 0.52 0.34 0.45 0.55 0.37 0.42 - -
Connecticut 0.43 0.50 0.35 0.45 0.51 0.39 - - -Detroit 0.41 0.51 0.35 0.43 0.52 0.38 0.40 - -Georgia 0.33 0.39 0.28 0.33 0.39 0.29 0.33 0.34 0.28Atlanta 0.36 0.50 0.27 0.42 0.54 0.37 - - -Rural Georgia - - - - - - - - -Greater Georgia 0.32 0.35 0.29 0.30 0.33 0.26 0.39 - -
Hawaii - - - - - - - - -Iowa 0.42 0.41 0.42 0.42 0.41 0.43 - - -Kentucky 0.42 0.54 0.31 0.40 0.50 0.32 - - -Louisiana 0.53 0.64 0.45 0.56 0.71 0.45 0.42 - -New Jersey 0.44 0.54 0.35 0.46 0.60 0.35 0.43 - 0.50New Mexico 0.38 0.45 0.30 0.37 0.41 0.33 - - -Seattle-Puget Sound 0.37 0.52 0.25 0.40 0.56 0.27 - - -Utah 0.35 0.42 0.28 0.35 0.42 0.29 - - -
9 SEER Areasb 0.38 0.45 0.31 0.41 0.47 0.36 0.34 0.57 0.1811 SEER Areasb 0.38 0.47 0.32 0.42 0.50 0.37 0.34 0.53 0.2013 SEER Areasb 0.38 0.47 0.32 0.42 0.50 0.36 0.34 0.54 0.2118 SEER Areasb 0.40 0.49 0.33 0.43 0.52 0.36 0.39 0.48 0.32
Total U.S. 0.41 0.50 0.33 0.42 0.51 0.35 0.39 0.49 0.30
Table 9.17Hodgkin Lymphoma
Age-Adjusted SEER Death Ratesa
By Registry, Race and Sex
SEER Cancer Statistics Review 1975-2009 National Cancer Institute
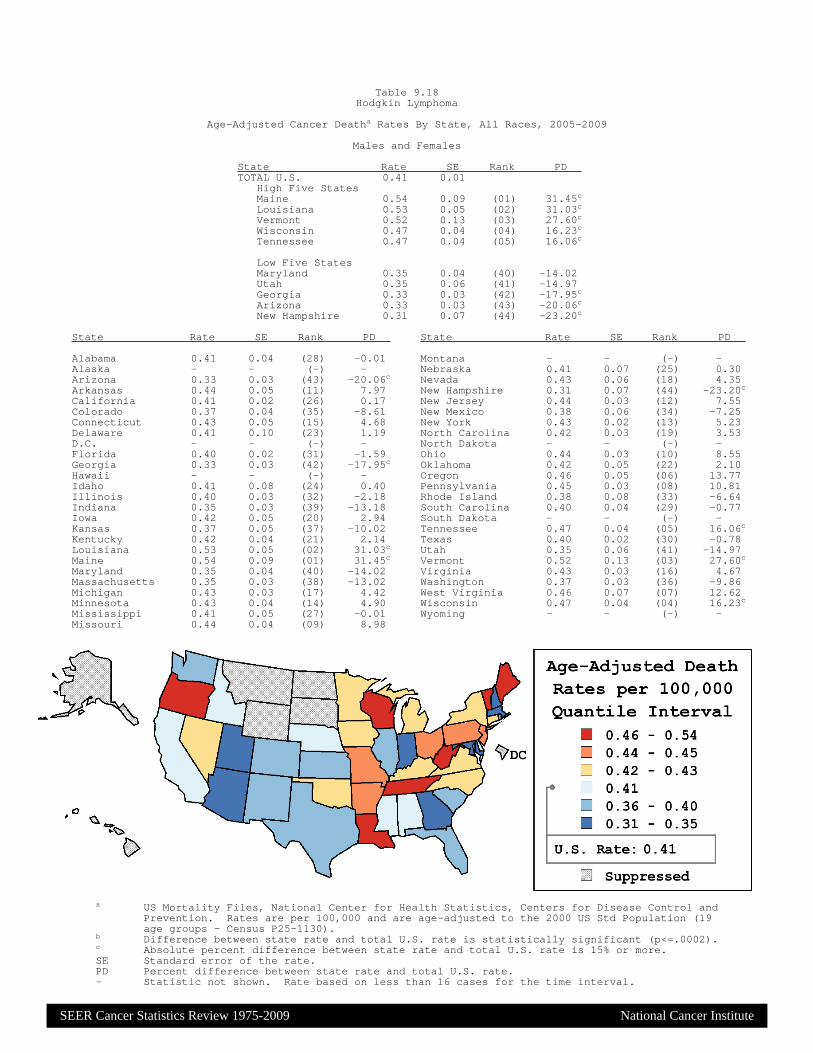
a US Mortality Files, National Center for Health Statistics, Centers for Disease Control andPrevention. Rates are per 100,000 and are age-adjusted to the 2000 US Std Population (19age groups - Census P25-1130).
b Difference between state rate and total U.S. rate is statistically significant (p<=.0002).c Absolute percent difference between state rate and total U.S. rate is 15% or more.SE Standard error of the rate.PD Percent difference between state rate and total U.S. rate.- Statistic not shown. Rate based on less than 16 cases for the time interval.
State Rate SE Rank PD TOTAL U.S. 0.41 0.01
High Five StatesMaine 0.54 0.09 (01) 31.45c
Louisiana 0.53 0.05 (02) 31.03c
Vermont 0.52 0.13 (03) 27.60c
Wisconsin 0.47 0.04 (04) 16.23c
Tennessee 0.47 0.04 (05) 16.06c
Low Five StatesMaryland 0.35 0.04 (40) -14.02Utah 0.35 0.06 (41) -14.97Georgia 0.33 0.03 (42) -17.95c
Arizona 0.33 0.03 (43) -20.06c
New Hampshire 0.31 0.07 (44) -23.20c
State Rate SE Rank PD State Rate SE Rank PD
Alabama 0.41 0.04 (28) -0.01 Montana - - (-) -Alaska - - (-) - Nebraska 0.41 0.07 (25) 0.30Arizona 0.33 0.03 (43) -20.06c Nevada 0.43 0.06 (18) 4.35Arkansas 0.44 0.05 (11) 7.97 New Hampshire 0.31 0.07 (44) -23.20c
California 0.41 0.02 (26) 0.17 New Jersey 0.44 0.03 (12) 7.55Colorado 0.37 0.04 (35) -8.61 New Mexico 0.38 0.06 (34) -7.25Connecticut 0.43 0.05 (15) 4.68 New York 0.43 0.02 (13) 5.23Delaware 0.41 0.10 (23) 1.19 North Carolina 0.42 0.03 (19) 3.53D.C. - - (-) - North Dakota - - (-) -Florida 0.40 0.02 (31) -1.59 Ohio 0.44 0.03 (10) 8.55Georgia 0.33 0.03 (42) -17.95c Oklahoma 0.42 0.05 (22) 2.10Hawaii - - (-) - Oregon 0.46 0.05 (06) 13.77Idaho 0.41 0.08 (24) 0.40 Pennsylvania 0.45 0.03 (08) 10.81Illinois 0.40 0.03 (32) -2.18 Rhode Island 0.38 0.08 (33) -6.64Indiana 0.35 0.03 (39) -13.18 South Carolina 0.40 0.04 (29) -0.77Iowa 0.42 0.05 (20) 2.94 South Dakota - - (-) -Kansas 0.37 0.05 (37) -10.02 Tennessee 0.47 0.04 (05) 16.06c
Kentucky 0.42 0.04 (21) 2.14 Texas 0.40 0.02 (30) -0.78Louisiana 0.53 0.05 (02) 31.03c Utah 0.35 0.06 (41) -14.97Maine 0.54 0.09 (01) 31.45c Vermont 0.52 0.13 (03) 27.60c
Maryland 0.35 0.04 (40) -14.02 Virginia 0.43 0.03 (16) 4.67Massachusetts 0.35 0.03 (38) -13.02 Washington 0.37 0.03 (36) -9.86Michigan 0.43 0.03 (17) 4.42 West Virginia 0.46 0.07 (07) 12.62Minnesota 0.43 0.04 (14) 4.90 Wisconsin 0.47 0.04 (04) 16.23c
Mississippi 0.41 0.05 (27) -0.01 Wyoming - - (-) -Missouri 0.44 0.04 (09) 8.98
Table 9.18Hodgkin Lymphoma
Age-Adjusted Cancer Deatha Rates By State, All Races, 2005-2009
Males and Females
SEER Cancer Statistics Review 1975-2009 National Cancer Institute
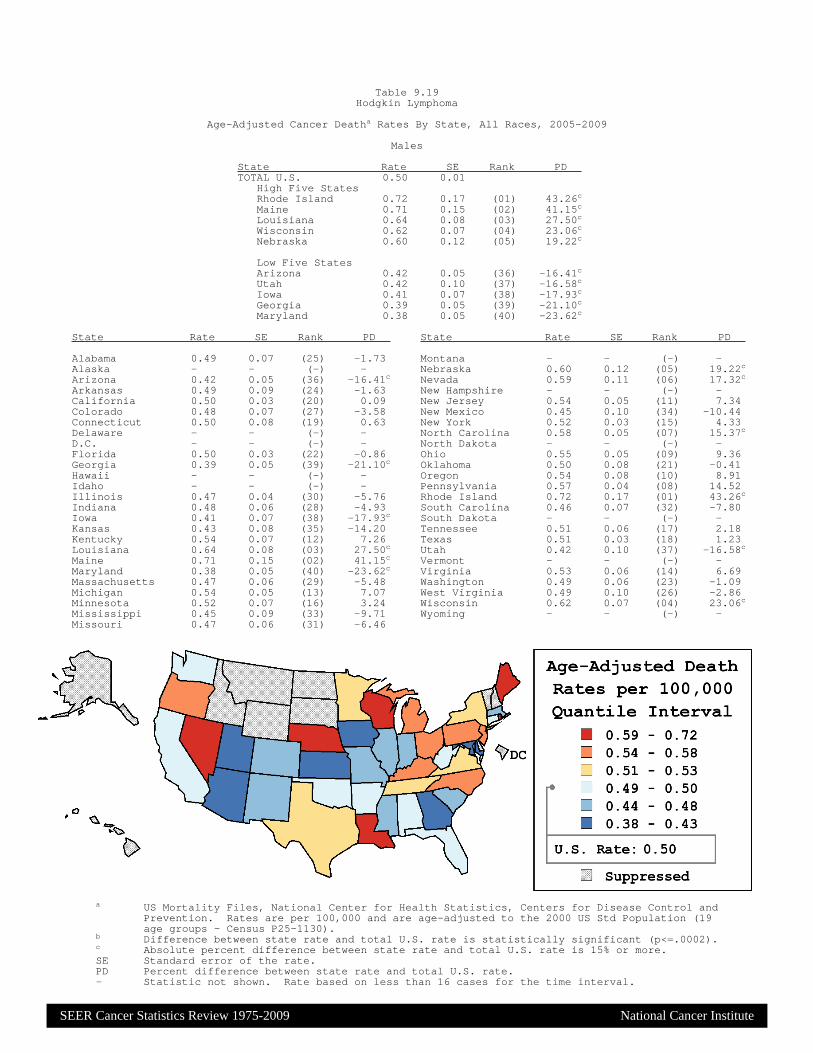
a US Mortality Files, National Center for Health Statistics, Centers for Disease Control andPrevention. Rates are per 100,000 and are age-adjusted to the 2000 US Std Population (19age groups - Census P25-1130).
b Difference between state rate and total U.S. rate is statistically significant (p<=.0002).c Absolute percent difference between state rate and total U.S. rate is 15% or more.SE Standard error of the rate.PD Percent difference between state rate and total U.S. rate.- Statistic not shown. Rate based on less than 16 cases for the time interval.
State Rate SE Rank PD TOTAL U.S. 0.50 0.01
High Five StatesRhode Island 0.72 0.17 (01) 43.26c
Maine 0.71 0.15 (02) 41.15c
Louisiana 0.64 0.08 (03) 27.50c
Wisconsin 0.62 0.07 (04) 23.06c
Nebraska 0.60 0.12 (05) 19.22c
Low Five StatesArizona 0.42 0.05 (36) -16.41c
Utah 0.42 0.10 (37) -16.58c
Iowa 0.41 0.07 (38) -17.93c
Georgia 0.39 0.05 (39) -21.10c
Maryland 0.38 0.05 (40) -23.62c
State Rate SE Rank PD State Rate SE Rank PD
Alabama 0.49 0.07 (25) -1.73 Montana - - (-) -Alaska - - (-) - Nebraska 0.60 0.12 (05) 19.22c
Arizona 0.42 0.05 (36) -16.41c Nevada 0.59 0.11 (06) 17.32c
Arkansas 0.49 0.09 (24) -1.63 New Hampshire - - (-) -California 0.50 0.03 (20) 0.09 New Jersey 0.54 0.05 (11) 7.34Colorado 0.48 0.07 (27) -3.58 New Mexico 0.45 0.10 (34) -10.44Connecticut 0.50 0.08 (19) 0.63 New York 0.52 0.03 (15) 4.33Delaware - - (-) - North Carolina 0.58 0.05 (07) 15.37c
D.C. - - (-) - North Dakota - - (-) -Florida 0.50 0.03 (22) -0.86 Ohio 0.55 0.05 (09) 9.36Georgia 0.39 0.05 (39) -21.10c Oklahoma 0.50 0.08 (21) -0.41Hawaii - - (-) - Oregon 0.54 0.08 (10) 8.91Idaho - - (-) - Pennsylvania 0.57 0.04 (08) 14.52Illinois 0.47 0.04 (30) -5.76 Rhode Island 0.72 0.17 (01) 43.26c
Indiana 0.48 0.06 (28) -4.93 South Carolina 0.46 0.07 (32) -7.80Iowa 0.41 0.07 (38) -17.93c South Dakota - - (-) -Kansas 0.43 0.08 (35) -14.20 Tennessee 0.51 0.06 (17) 2.18Kentucky 0.54 0.07 (12) 7.26 Texas 0.51 0.03 (18) 1.23Louisiana 0.64 0.08 (03) 27.50c Utah 0.42 0.10 (37) -16.58c
Maine 0.71 0.15 (02) 41.15c Vermont - - (-) -Maryland 0.38 0.05 (40) -23.62c Virginia 0.53 0.06 (14) 6.69Massachusetts 0.47 0.06 (29) -5.48 Washington 0.49 0.06 (23) -1.09Michigan 0.54 0.05 (13) 7.07 West Virginia 0.49 0.10 (26) -2.86Minnesota 0.52 0.07 (16) 3.24 Wisconsin 0.62 0.07 (04) 23.06c
Mississippi 0.45 0.09 (33) -9.71 Wyoming - - (-) -Missouri 0.47 0.06 (31) -6.46
Table 9.19Hodgkin Lymphoma
Age-Adjusted Cancer Deatha Rates By State, All Races, 2005-2009
Males
SEER Cancer Statistics Review 1975-2009 National Cancer Institute
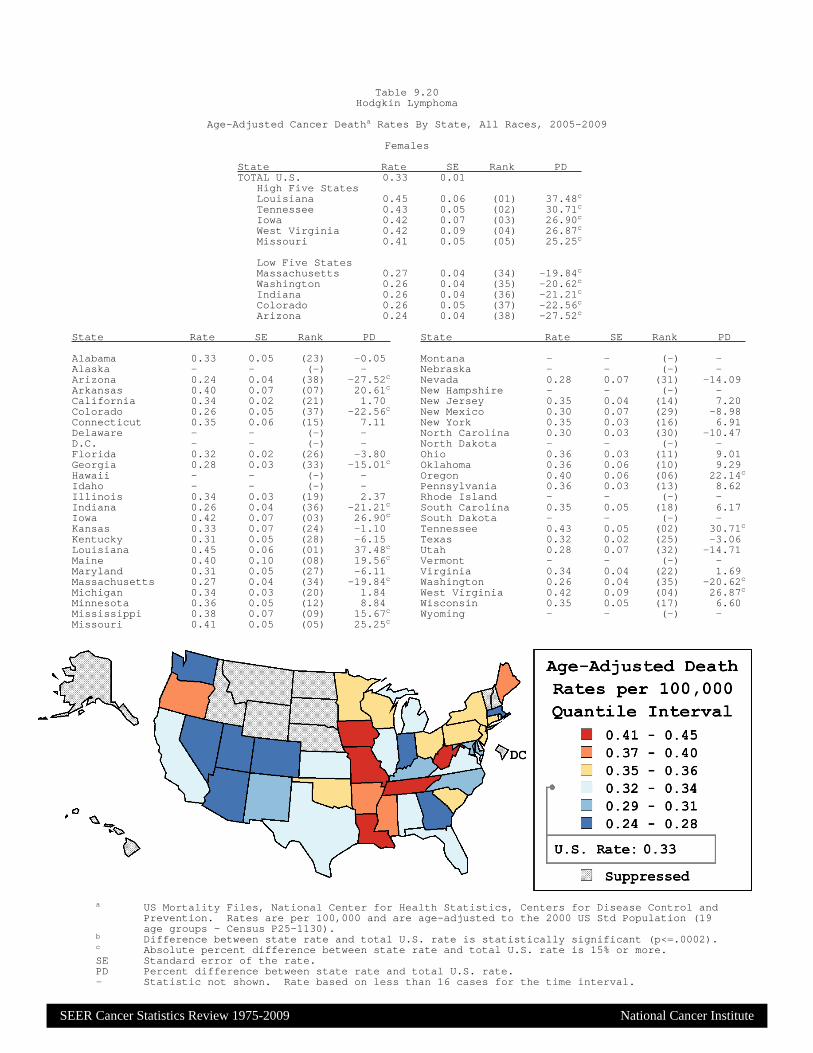
a US Mortality Files, National Center for Health Statistics, Centers for Disease Control andPrevention. Rates are per 100,000 and are age-adjusted to the 2000 US Std Population (19age groups - Census P25-1130).
b Difference between state rate and total U.S. rate is statistically significant (p<=.0002).c Absolute percent difference between state rate and total U.S. rate is 15% or more.SE Standard error of the rate.PD Percent difference between state rate and total U.S. rate.- Statistic not shown. Rate based on less than 16 cases for the time interval.
State Rate SE Rank PD TOTAL U.S. 0.33 0.01
High Five StatesLouisiana 0.45 0.06 (01) 37.48c
Tennessee 0.43 0.05 (02) 30.71c
Iowa 0.42 0.07 (03) 26.90c
West Virginia 0.42 0.09 (04) 26.87c
Missouri 0.41 0.05 (05) 25.25c
Low Five StatesMassachusetts 0.27 0.04 (34) -19.84c
Washington 0.26 0.04 (35) -20.62c
Indiana 0.26 0.04 (36) -21.21c
Colorado 0.26 0.05 (37) -22.56c
Arizona 0.24 0.04 (38) -27.52c
State Rate SE Rank PD State Rate SE Rank PD
Alabama 0.33 0.05 (23) -0.05 Montana - - (-) -Alaska - - (-) - Nebraska - - (-) -Arizona 0.24 0.04 (38) -27.52c Nevada 0.28 0.07 (31) -14.09Arkansas 0.40 0.07 (07) 20.61c New Hampshire - - (-) -California 0.34 0.02 (21) 1.70 New Jersey 0.35 0.04 (14) 7.20Colorado 0.26 0.05 (37) -22.56c New Mexico 0.30 0.07 (29) -8.98Connecticut 0.35 0.06 (15) 7.11 New York 0.35 0.03 (16) 6.91Delaware - - (-) - North Carolina 0.30 0.03 (30) -10.47D.C. - - (-) - North Dakota - - (-) -Florida 0.32 0.02 (26) -3.80 Ohio 0.36 0.03 (11) 9.01Georgia 0.28 0.03 (33) -15.01c Oklahoma 0.36 0.06 (10) 9.29Hawaii - - (-) - Oregon 0.40 0.06 (06) 22.14c
Idaho - - (-) - Pennsylvania 0.36 0.03 (13) 8.62Illinois 0.34 0.03 (19) 2.37 Rhode Island - - (-) -Indiana 0.26 0.04 (36) -21.21c South Carolina 0.35 0.05 (18) 6.17Iowa 0.42 0.07 (03) 26.90c South Dakota - - (-) -Kansas 0.33 0.07 (24) -1.10 Tennessee 0.43 0.05 (02) 30.71c
Kentucky 0.31 0.05 (28) -6.15 Texas 0.32 0.02 (25) -3.06Louisiana 0.45 0.06 (01) 37.48c Utah 0.28 0.07 (32) -14.71Maine 0.40 0.10 (08) 19.56c Vermont - - (-) -Maryland 0.31 0.05 (27) -6.11 Virginia 0.34 0.04 (22) 1.69Massachusetts 0.27 0.04 (34) -19.84c Washington 0.26 0.04 (35) -20.62c
Michigan 0.34 0.03 (20) 1.84 West Virginia 0.42 0.09 (04) 26.87c
Minnesota 0.36 0.05 (12) 8.84 Wisconsin 0.35 0.05 (17) 6.60Mississippi 0.38 0.07 (09) 15.67c Wyoming - - (-) -Missouri 0.41 0.05 (05) 25.25c
Table 9.20Hodgkin Lymphoma
Age-Adjusted Cancer Deatha Rates By State, All Races, 2005-2009
Females
SEE
R C
ancer Statistics Review
1975-2009N
ational Cancer Institute
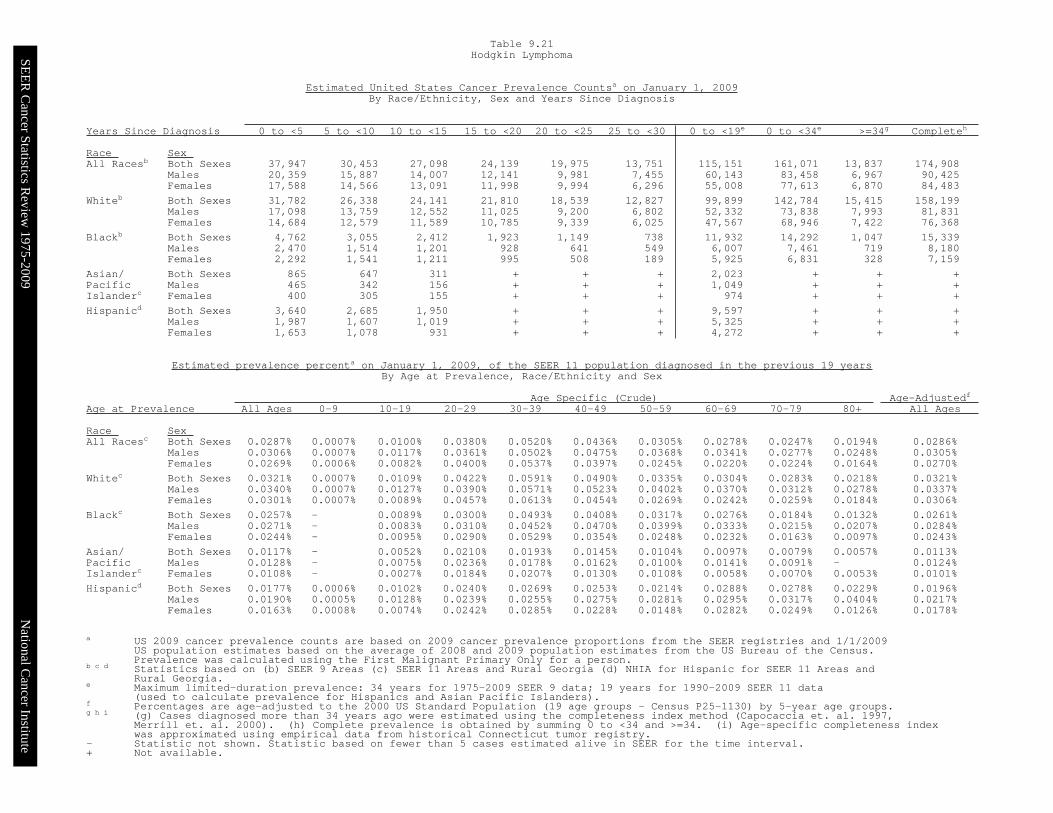
a US 2009 cancer prevalence counts are based on 2009 cancer prevalence proportions from the SEER registries and 1/1/2009US population estimates based on the average of 2008 and 2009 population estimates from the US Bureau of the Census.Prevalence was calculated using the First Malignant Primary Only for a person.
b c d Statistics based on (b) SEER 9 Areas (c) SEER 11 Areas and Rural Georgia (d) NHIA for Hispanic for SEER 11 Areas andRural Georgia.
e Maximum limited-duration prevalence: 34 years for 1975-2009 SEER 9 data; 19 years for 1990-2009 SEER 11 data(used to calculate prevalence for Hispanics and Asian Pacific Islanders).
f Percentages are age-adjusted to the 2000 US Standard Population (19 age groups - Census P25-1130) by 5-year age groups.g h i (g) Cases diagnosed more than 34 years ago were estimated using the completeness index method (Capocaccia et. al. 1997,
Merrill et. al. 2000). (h) Complete prevalence is obtained by summing 0 to <34 and >=34. (i) Age-specific completeness indexwas approximated using empirical data from historical Connecticut tumor registry.
- Statistic not shown. Statistic based on fewer than 5 cases estimated alive in SEER for the time interval.+ Not available.
Years Since Diagnosis 0 to <5 5 to <10 10 to <15 15 to <20 20 to <25 25 to <30 0 to <19e 0 to <34e >=34g Completeh
Race Sex All Racesb Both Sexes 37,947 30,453 27,098 24,139 19,975 13,751 115,151 161,071 13,837 174,908
Males 20,359 15,887 14,007 12,141 9,981 7,455 60,143 83,458 6,967 90,425Females 17,588 14,566 13,091 11,998 9,994 6,296 55,008 77,613 6,870 84,483
Whiteb Both Sexes 31,782 26,338 24,141 21,810 18,539 12,827 99,899 142,784 15,415 158,199Males 17,098 13,759 12,552 11,025 9,200 6,802 52,332 73,838 7,993 81,831Females 14,684 12,579 11,589 10,785 9,339 6,025 47,567 68,946 7,422 76,368
Blackb Both Sexes 4,762 3,055 2,412 1,923 1,149 738 11,932 14,292 1,047 15,339Males 2,470 1,514 1,201 928 641 549 6,007 7,461 719 8,180Females 2,292 1,541 1,211 995 508 189 5,925 6,831 328 7,159
Asian/ Both Sexes 865 647 311 + + + 2,023 + + +Pacific Males 465 342 156 + + + 1,049 + + +Islanderc Females 400 305 155 + + + 974 + + +
Hispanicd Both Sexes 3,640 2,685 1,950 + + + 9,597 + + +Males 1,987 1,607 1,019 + + + 5,325 + + +Females 1,653 1,078 931 + + + 4,272 + + +
Age Specific (Crude) Age-Adjustedf Age at Prevalence All Ages 0-9 10-19 20-29 30-39 40-49 50-59 60-69 70-79 80+ All Ages
Race Sex All Racesc Both Sexes 0.0287% 0.0007% 0.0100% 0.0380% 0.0520% 0.0436% 0.0305% 0.0278% 0.0247% 0.0194% 0.0286%
Males 0.0306% 0.0007% 0.0117% 0.0361% 0.0502% 0.0475% 0.0368% 0.0341% 0.0277% 0.0248% 0.0305%Females 0.0269% 0.0006% 0.0082% 0.0400% 0.0537% 0.0397% 0.0245% 0.0220% 0.0224% 0.0164% 0.0270%
Whitec Both Sexes 0.0321% 0.0007% 0.0109% 0.0422% 0.0591% 0.0490% 0.0335% 0.0304% 0.0283% 0.0218% 0.0321%Males 0.0340% 0.0007% 0.0127% 0.0390% 0.0571% 0.0523% 0.0402% 0.0370% 0.0312% 0.0278% 0.0337%Females 0.0301% 0.0007% 0.0089% 0.0457% 0.0613% 0.0454% 0.0269% 0.0242% 0.0259% 0.0184% 0.0306%
Blackc Both Sexes 0.0257% - 0.0089% 0.0300% 0.0493% 0.0408% 0.0317% 0.0276% 0.0184% 0.0132% 0.0261%Males 0.0271% - 0.0083% 0.0310% 0.0452% 0.0470% 0.0399% 0.0333% 0.0215% 0.0207% 0.0284%Females 0.0244% - 0.0095% 0.0290% 0.0529% 0.0354% 0.0248% 0.0232% 0.0163% 0.0097% 0.0243%
Asian/ Both Sexes 0.0117% - 0.0052% 0.0210% 0.0193% 0.0145% 0.0104% 0.0097% 0.0079% 0.0057% 0.0113%Pacific Males 0.0128% - 0.0075% 0.0236% 0.0178% 0.0162% 0.0100% 0.0141% 0.0091% - 0.0124%Islanderc Females 0.0108% - 0.0027% 0.0184% 0.0207% 0.0130% 0.0108% 0.0058% 0.0070% 0.0053% 0.0101%
Hispanicd Both Sexes 0.0177% 0.0006% 0.0102% 0.0240% 0.0269% 0.0253% 0.0214% 0.0288% 0.0278% 0.0229% 0.0196%Males 0.0190% 0.0005% 0.0128% 0.0239% 0.0255% 0.0275% 0.0281% 0.0295% 0.0317% 0.0404% 0.0217%Females 0.0163% 0.0008% 0.0074% 0.0242% 0.0285% 0.0228% 0.0148% 0.0282% 0.0249% 0.0126% 0.0178%
Table 9.21Hodgkin Lymphoma
Estimated United States Cancer Prevalence Countsa on January 1, 2009By Race/Ethnicity, Sex and Years Since Diagnosis
Estimated prevalence percenta on January 1, 2009, of the SEER 11 population diagnosed in the previous 19 yearsBy Age at Prevalence, Race/Ethnicity and Sex

SEE
R C
ancer Statistics Review
1975-2009N
ational Cancer Institute
The APC is the Annual Percent Change over the time interval.a Morton LM, Turner JJ, Cerhan JR, Linet MS, Treseler PA, Clarke CA, Jack A, Cozen W, Maynadié M, Spinelli JJ, Costantini AS,
Rüdiger T, Scarpa A, Zheng T, Weisenburger DD. Proposed classification of lymphoid neoplasms for epidemiologic research fromthe Pathology Working Group of the International Lymphoma Epidemiology Consortium (InterLymph). Blood. 2007;110:695-708.
b SEER 18 areas (San Francisco, Connecticut, Detroit, Hawaii, Iowa, New Mexico, Seattle, Utah, Atlanta, San Jose-Monterey,Los Angeles, Alaska Native Registry, Rural Georgia, California excluding SF/SJM/LA, Kentucky, Louisiana, New Jersey andGeorgia excluding ATL/RG).
c NOS = Not otherwise specified.* The APC is significantly different from zero (p<.05).- Statistic not shown. Rate based on less than 16 cases for the time interval.
Trend based on less than 10 cases for at least one year within the time interval.
All Ages Ages 0-19 Ages 20-64 Ages 65+
Site Rate Count APC Rate Count APC Rate Count APC Rate Count APC
Lymphoid Neoplasm 35.1 251,928 -0.2 5.8 12,225 0.7 23.5 107,693 -0.6* 155.1 132,010 0.0
1 Hodgkin Lymphoma 2.8 20,498 0.3 1.2 2,562 2.1* 3.2 14,384 -0.3 4.2 3,552 1.5
1(a) Classical Hodgkin lymphoma 2.7 19,606 0.0 1.2 2,431 1.8* 3.1 13,763 -0.6 4.0 3,412 1.1
1(a)1. Lymphocyte-rich/mixed cellularity/ 0.5 3,442 -1.5* 0.1 259 2.5 0.5 2,209 -2.0* 1.1 974 -1.7
lymphocyte-depleted
1(a)1.1 Lymphocyte-rich 0.1 641 2.0 0.0 59 - 0.1 437 0.3 0.2 145 3.6
1(a)1.2 Mixed cellularity 0.3 2,542 -2.5* 0.1 190 -0.4 0.4 1,624 -2.4* 0.9 728 -3.2
1(a)1.3 Lymphocyte-depleted 0.0 259 0.3 - - - 0.0 148 -3.4 0.1 101 -
1(a)2. Nodular sclerosis 1.6 12,040 -1.1* 0.9 1,882 0.9 2.0 8,894 -1.8* 1.5 1,264 0.3
1(a)3. Classical Hodgkin lymphoma, NOSc 0.6 4,124 4.8* 0.1 290 6.9* 0.6 2,660 4.7* 1.4 1,174 4.4
1(b) Nodular lymphocyte predominant 0.1 892 6.9* 0.1 131 6.6* 0.1 621 5.7* 0.2 140 -
Hodgkin Lymphoma
2 Non-Hodgkin lymphoma 31.1 223,232 -0.1 4.5 9,587 0.4 19.7 90,492 -0.4* 144.8 123,153 0.1
3 Composite Hodgkin lymphoma and Non-Hodgkin 0.0 115 -2.3 - - - 0.0 58 - 0.1 55 -
lymphoma
4 Lymphoid neoplasm, NOSc 1.1 8,083 -5.1* 0.0 74 - 0.6 2,759 -6.5* 6.1 5,250 -4.5*
Table 9.22
All Lymphoid Neoplasms With Detailed Hodgkin Lymphoma Subtypesa
SEERb Incidence Rates and Annual Percent Change by Age at Diagnosis
All Races, Both Sexes, 2001-2009
SEE
R C
ancer Statistics Review
1975-2009N
ational Cancer Institute
The APC is the Annual Percent Change over the time interval.a Morton LM, Turner JJ, Cerhan JR, Linet MS, Treseler PA, Clarke CA, Jack A, Cozen W, Maynadié M, Spinelli JJ, Costantini AS,
Rüdiger T, Scarpa A, Zheng T, Weisenburger DD. Proposed classification of lymphoid neoplasms for epidemiologic research fromthe Pathology Working Group of the International Lymphoma Epidemiology Consortium (InterLymph). Blood. 2007;110:695-708.
b SEER 18 areas (San Francisco, Connecticut, Detroit, Hawaii, Iowa, New Mexico, Seattle, Utah, Atlanta, San Jose-Monterey,Los Angeles, Alaska Native Registry, Rural Georgia, California excluding SF/SJM/LA, Kentucky, Louisiana, New Jersey andGeorgia excluding ATL/RG).
c NOS = Not otherwise specified.* The APC is significantly different from zero (p<.05).- Statistic not shown. Rate based on less than 16 cases for the time interval.
Trend based on less than 10 cases for at least one year within the time interval.
All Ages Ages 0-19 Ages 20-64 Ages 65+
Site Rate Count APC Rate Count APC Rate Count APC Rate Count APC
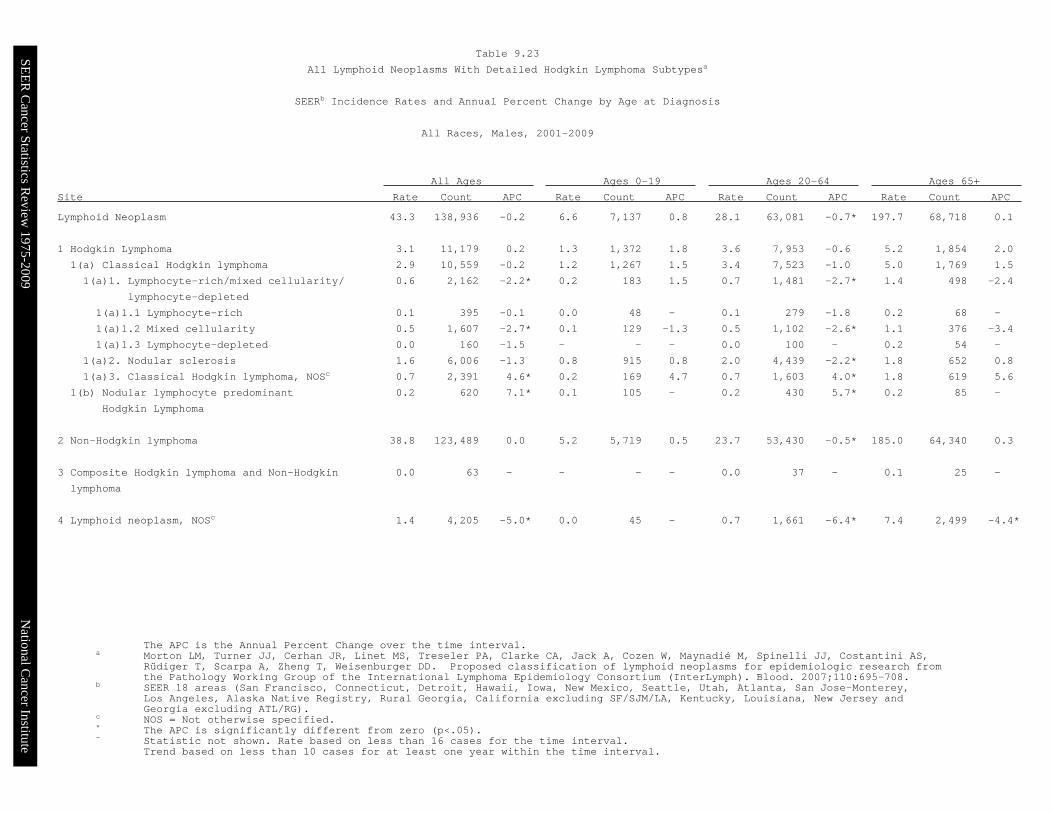
Lymphoid Neoplasm 43.3 138,936 -0.2 6.6 7,137 0.8 28.1 63,081 -0.7* 197.7 68,718 0.1
1 Hodgkin Lymphoma 3.1 11,179 0.2 1.3 1,372 1.8 3.6 7,953 -0.6 5.2 1,854 2.0
1(a) Classical Hodgkin lymphoma 2.9 10,559 -0.2 1.2 1,267 1.5 3.4 7,523 -1.0 5.0 1,769 1.5
1(a)1. Lymphocyte-rich/mixed cellularity/ 0.6 2,162 -2.2* 0.2 183 1.5 0.7 1,481 -2.7* 1.4 498 -2.4
lymphocyte-depleted
1(a)1.1 Lymphocyte-rich 0.1 395 -0.1 0.0 48 - 0.1 279 -1.8 0.2 68 -
1(a)1.2 Mixed cellularity 0.5 1,607 -2.7* 0.1 129 -1.3 0.5 1,102 -2.6* 1.1 376 -3.4
1(a)1.3 Lymphocyte-depleted 0.0 160 -1.5 - - - 0.0 100 - 0.2 54 -
1(a)2. Nodular sclerosis 1.6 6,006 -1.3 0.8 915 0.8 2.0 4,439 -2.2* 1.8 652 0.8
1(a)3. Classical Hodgkin lymphoma, NOSc 0.7 2,391 4.6* 0.2 169 4.7 0.7 1,603 4.0* 1.8 619 5.6
1(b) Nodular lymphocyte predominant 0.2 620 7.1* 0.1 105 - 0.2 430 5.7* 0.2 85 -
Hodgkin Lymphoma
2 Non-Hodgkin lymphoma 38.8 123,489 0.0 5.2 5,719 0.5 23.7 53,430 -0.5* 185.0 64,340 0.3
3 Composite Hodgkin lymphoma and Non-Hodgkin 0.0 63 - - - - 0.0 37 - 0.1 25 -
lymphoma
4 Lymphoid neoplasm, NOSc 1.4 4,205 -5.0* 0.0 45 - 0.7 1,661 -6.4* 7.4 2,499 -4.4*
Table 9.23
All Lymphoid Neoplasms With Detailed Hodgkin Lymphoma Subtypesa
SEERb Incidence Rates and Annual Percent Change by Age at Diagnosis
All Races, Males, 2001-2009

SEE
R C
ancer Statistics Review
1975-2009N
ational Cancer Institute
The APC is the Annual Percent Change over the time interval.a Morton LM, Turner JJ, Cerhan JR, Linet MS, Treseler PA, Clarke CA, Jack A, Cozen W, Maynadié M, Spinelli JJ, Costantini AS,
Rüdiger T, Scarpa A, Zheng T, Weisenburger DD. Proposed classification of lymphoid neoplasms for epidemiologic research fromthe Pathology Working Group of the International Lymphoma Epidemiology Consortium (InterLymph). Blood. 2007;110:695-708.
b SEER 18 areas (San Francisco, Connecticut, Detroit, Hawaii, Iowa, New Mexico, Seattle, Utah, Atlanta, San Jose-Monterey,Los Angeles, Alaska Native Registry, Rural Georgia, California excluding SF/SJM/LA, Kentucky, Louisiana, New Jersey andGeorgia excluding ATL/RG).
c NOS = Not otherwise specified.* The APC is significantly different from zero (p<.05).- Statistic not shown. Rate based on less than 16 cases for the time interval.
Trend based on less than 10 cases for at least one year within the time interval.
All Ages Ages 0-19 Ages 20-64 Ages 65+
Site Rate Count APC Rate Count APC Rate Count APC Rate Count APC
Lymphoid Neoplasm 28.6 112,992 -0.3 4.9 5,088 0.7 19.2 44,612 -0.4 126.1 63,292 -0.3
1 Hodgkin Lymphoma 2.5 9,319 0.5 1.2 1,190 2.3 2.9 6,431 0.0 3.4 1,698 0.9
1(a) Classical Hodgkin lymphoma 2.4 9,047 0.3 1.1 1,164 2.2 2.8 6,240 -0.2 3.3 1,643 0.7
1(a)1. Lymphocyte-rich/mixed cellularity/ 0.3 1,280 -0.3 0.1 76 - 0.3 728 -0.6 1.0 476 -0.9
lymphocyte-depleted
1(a)1.1 Lymphocyte-rich 0.1 246 5.7 - - - 0.1 158 4.4 0.2 77 -
1(a)1.2 Mixed cellularity 0.2 935 -2.2 0.1 61 - 0.2 522 -2.4 0.7 352 -3.0
1(a)1.3 Lymphocyte-depleted 0.0 99 - - - - 0.0 48 - 0.1 47 -
1(a)2. Nodular sclerosis 1.6 6,034 -0.9 0.9 967 1.0 2.0 4,455 -1.4* 1.2 612 -0.2
1(a)3. Classical Hodgkin lymphoma, NOSc 0.5 1,733 5.1* 0.1 121 - 0.5 1,057 5.7* 1.1 555 2.7
1(b) Nodular lymphocyte predominant 0.1 272 6.4* 0.0 26 - 0.1 191 5.9 0.1 55 -
Hodgkin Lymphoma
2 Non-Hodgkin lymphoma 25.2 99,743 -0.2 3.7 3,868 0.2 15.8 37,062 -0.3 117.4 58,813 -0.1
3 Composite Hodgkin lymphoma and Non-Hodgkin 0.0 52 - - - - 0.0 21 - 0.1 30 -
lymphoma
4 Lymphoid neoplasm, NOSc 0.9 3,878 -5.1* 0.0 29 - 0.5 1,098 -6.6* 5.2 2,751 -4.7*
Table 9.24
All Lymphoid Neoplasms With Detailed Hodgkin Lymphoma Subtypesa
SEERb Incidence Rates and Annual Percent Change by Age at Diagnosis
All Races, Females, 2001-2009

SEE
R C
ancer Statistics Review
1975-2009N
ational Cancer Institute
a Morton LM, Turner JJ, Cerhan JR, Linet MS, Treseler PA, Clarke CA, Jack A, Cozen W, Maynadié M, Spinelli JJ, Costantini AS,Rüdiger T, Scarpa A, Zheng T, Weisenburger DD. Proposed classification of lymphoid neoplasms for epidemiologic research fromthe Pathology Working Group of the International Lymphoma Epidemiology Consortium (InterLymph). Blood. 2007;110:695-708.
b SEER 18 areas (San Francisco, Connecticut, Detroit, Hawaii, Iowa, New Mexico, Seattle, Utah, Atlanta, San Jose-Monterey,Los Angeles, Alaska Native Registry, Rural Georgia, California excluding SF/SJM/LA, Kentucky, Louisiana, New Jersey andGeorgia excluding ATL/RG).
c NOS = Not otherwise specified.- Statistic not displayed due to less than 25 cases.
All Ages Ages 0-19 Ages 20-64 Ages 65+
Site Count Percent ( 95% C.I. ) Percent ( 95% C.I. ) Percent ( 95% C.I. ) Percent ( 95% C.I. )
Lymphoid Neoplasm 163,213 66.6 ( 66.3 , 66.9) 87.7 ( 86.9 ,88.4 ) 74.5 ( 74.1 ,74.9 ) 55.5 ( 55.0 ,56.1)
1 Hodgkin Lymphoma 14,733 84.7 ( 84.0 , 85.4) 95.9 ( 94.7 ,96.9 ) 88.9 ( 88.2 ,89.7 ) 50.9 ( 47.8 ,53.9)
1(a) Classical Hodgkin lymphoma 14,107 84.2 ( 83.4 , 84.9) 95.7 ( 94.4 ,96.7 ) 88.6 ( 87.8 ,89.3 ) 49.7 ( 46.6 ,52.7)
1(a)1. Lymphocyte-rich/mixed cellularity/ 2,378 78.6 ( 76.5 , 80.6) 94.1 ( 89.2 ,96.9 ) 85.7 ( 83.5 ,87.6 ) 53.5 ( 47.6 ,59.0)
lymphocyte-depleted
1(a)1.1 Lymphocyte-rich 456 86.3 ( 81.0 , 90.2) 100.0 ( - , - ) 89.5 ( 84.3 ,93.0 ) 67.6 ( 48.9 ,80.8)
1(a)1.2 Mixed cellularity 1,745 78.7 ( 76.2 , 81.0) 92.0 ( 85.5 ,95.7 ) 85.8 ( 83.2 ,88.0 ) 53.8 ( 47.0 ,60.1)
1(a)1.3 Lymphocyte-depleted 177 58.0 ( 49.2 , 65.8) - ( - , - ) 72.3 ( 61.9 ,80.4 ) 24.0 ( 9.4 ,42.2)
1(a)2. Nodular sclerosis 8,952 88.6 ( 87.8 , 89.4) 95.7 ( 94.2 ,96.8 ) 91.0 ( 90.1 ,91.8 ) 51.3 ( 46.0 ,56.2)
1(a)3. Classical Hodgkin lymphoma, NOSc 2,777 74.5 ( 72.4 , 76.4) 96.8 ( 92.8 ,98.6 ) 82.1 ( 79.9 ,84.1 ) 43.9 ( 38.6 ,48.9)
1(b) Nodular lymphocyte predominant 626 96.1 ( 93.2 , 97.8) 100.0 ( - , - ) 97.3 ( 93.7 ,98.9 ) 80.0 ( 61.1 ,90.4)
Hodgkin Lymphoma
2 Non-Hodgkin lymphoma 143,726 65.3 ( 64.9 , 65.6) 85.5 ( 84.6 ,86.4 ) 72.4 ( 72.0 ,72.9 ) 56.3 ( 55.8 ,56.9)
3 Composite Hodgkin lymphoma and Non-Hodgkin 69 60.2 ( 45.2 , 72.4) - ( - , - ) 66.8 ( 48.8 ,79.7 ) 52.2 ( 28.4 ,71.4)
lymphoma
4 Lymphoid neoplasm, NOSc 4,685 48.0 ( 46.2 , 49.9) 80.2 ( 65.3 ,89.2 ) 61.0 ( 58.4 ,63.5 ) 38.8 ( 36.2 ,41.3)
Table 9.25
All Lymphoid Neoplasms With Detailed Hodgkin Lymphoma Subtypesa
SEERb 5-Year Relative Survival (Percent) by Age at Diagnosis
All Races, Both Sexes, 2002-2008
SEE
R C
ancer Statistics Review
1975-2009N
ational Cancer Institute
a Morton LM, Turner JJ, Cerhan JR, Linet MS, Treseler PA, Clarke CA, Jack A, Cozen W, Maynadié M, Spinelli JJ, Costantini AS,Rüdiger T, Scarpa A, Zheng T, Weisenburger DD. Proposed classification of lymphoid neoplasms for epidemiologic research fromthe Pathology Working Group of the International Lymphoma Epidemiology Consortium (InterLymph). Blood. 2007;110:695-708.
b SEER 18 areas (San Francisco, Connecticut, Detroit, Hawaii, Iowa, New Mexico, Seattle, Utah, Atlanta, San Jose-Monterey,Los Angeles, Alaska Native Registry, Rural Georgia, California excluding SF/SJM/LA, Kentucky, Louisiana, New Jersey andGeorgia excluding ATL/RG).
c NOS = Not otherwise specified.- Statistic not displayed due to less than 25 cases.
All Ages Ages 0-19 Ages 20-64 Ages 65+
Site Count Percent ( 95% C.I. ) Percent ( 95% C.I. ) Percent ( 95% C.I. ) Percent ( 95% C.I. )
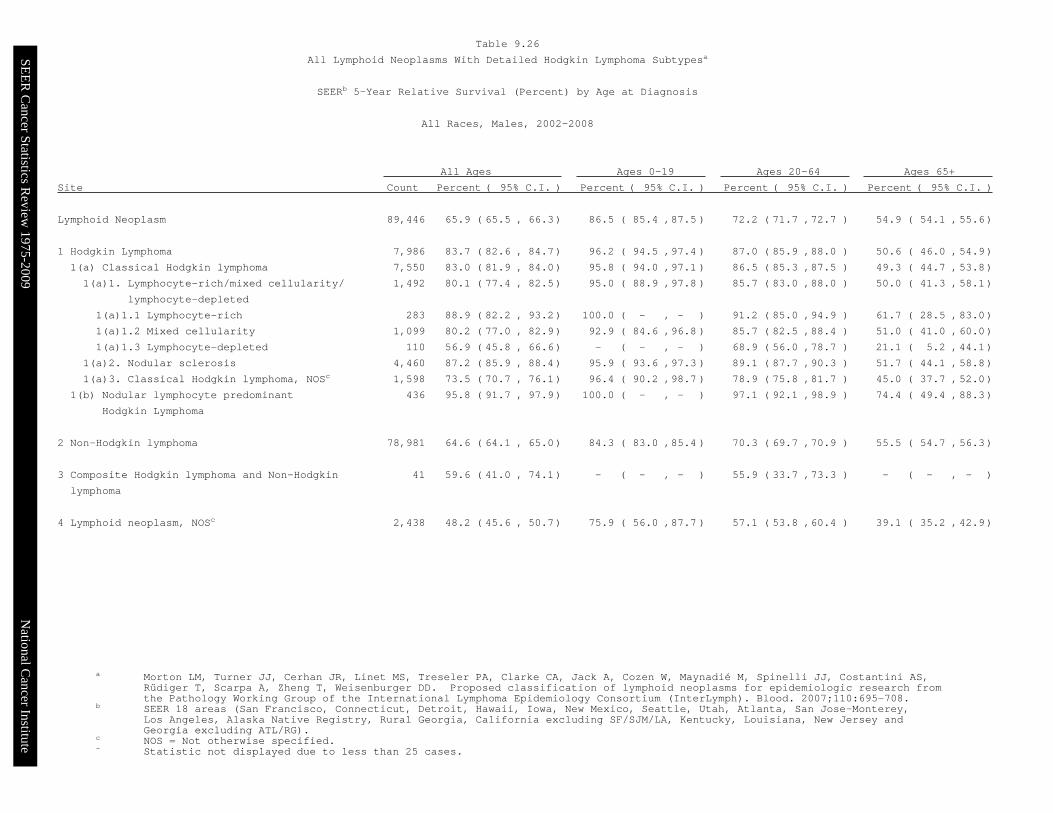
Lymphoid Neoplasm 89,446 65.9 ( 65.5 , 66.3) 86.5 ( 85.4 ,87.5 ) 72.2 ( 71.7 ,72.7 ) 54.9 ( 54.1 ,55.6)
1 Hodgkin Lymphoma 7,986 83.7 ( 82.6 , 84.7) 96.2 ( 94.5 ,97.4 ) 87.0 ( 85.9 ,88.0 ) 50.6 ( 46.0 ,54.9)
1(a) Classical Hodgkin lymphoma 7,550 83.0 ( 81.9 , 84.0) 95.8 ( 94.0 ,97.1 ) 86.5 ( 85.3 ,87.5 ) 49.3 ( 44.7 ,53.8)
1(a)1. Lymphocyte-rich/mixed cellularity/ 1,492 80.1 ( 77.4 , 82.5) 95.0 ( 88.9 ,97.8 ) 85.7 ( 83.0 ,88.0 ) 50.0 ( 41.3 ,58.1)
lymphocyte-depleted
1(a)1.1 Lymphocyte-rich 283 88.9 ( 82.2 , 93.2) 100.0 ( - , - ) 91.2 ( 85.0 ,94.9 ) 61.7 ( 28.5 ,83.0)
1(a)1.2 Mixed cellularity 1,099 80.2 ( 77.0 , 82.9) 92.9 ( 84.6 ,96.8 ) 85.7 ( 82.5 ,88.4 ) 51.0 ( 41.0 ,60.0)
1(a)1.3 Lymphocyte-depleted 110 56.9 ( 45.8 , 66.6) - ( - , - ) 68.9 ( 56.0 ,78.7 ) 21.1 ( 5.2 ,44.1)
1(a)2. Nodular sclerosis 4,460 87.2 ( 85.9 , 88.4) 95.9 ( 93.6 ,97.3 ) 89.1 ( 87.7 ,90.3 ) 51.7 ( 44.1 ,58.8)
1(a)3. Classical Hodgkin lymphoma, NOSc 1,598 73.5 ( 70.7 , 76.1) 96.4 ( 90.2 ,98.7 ) 78.9 ( 75.8 ,81.7 ) 45.0 ( 37.7 ,52.0)
1(b) Nodular lymphocyte predominant 436 95.8 ( 91.7 , 97.9) 100.0 ( - , - ) 97.1 ( 92.1 ,98.9 ) 74.4 ( 49.4 ,88.3)
Hodgkin Lymphoma
2 Non-Hodgkin lymphoma 78,981 64.6 ( 64.1 , 65.0) 84.3 ( 83.0 ,85.4 ) 70.3 ( 69.7 ,70.9 ) 55.5 ( 54.7 ,56.3)
3 Composite Hodgkin lymphoma and Non-Hodgkin 41 59.6 ( 41.0 , 74.1) - ( - , - ) 55.9 ( 33.7 ,73.3 ) - ( - , - )
lymphoma
4 Lymphoid neoplasm, NOSc 2,438 48.2 ( 45.6 , 50.7) 75.9 ( 56.0 ,87.7 ) 57.1 ( 53.8 ,60.4 ) 39.1 ( 35.2 ,42.9)
Table 9.26
All Lymphoid Neoplasms With Detailed Hodgkin Lymphoma Subtypesa
SEERb 5-Year Relative Survival (Percent) by Age at Diagnosis
All Races, Males, 2002-2008

SEE
R C
ancer Statistics Review
1975-2009N
ational Cancer Institute
a Morton LM, Turner JJ, Cerhan JR, Linet MS, Treseler PA, Clarke CA, Jack A, Cozen W, Maynadié M, Spinelli JJ, Costantini AS,Rüdiger T, Scarpa A, Zheng T, Weisenburger DD. Proposed classification of lymphoid neoplasms for epidemiologic research fromthe Pathology Working Group of the International Lymphoma Epidemiology Consortium (InterLymph). Blood. 2007;110:695-708.
b SEER 18 areas (San Francisco, Connecticut, Detroit, Hawaii, Iowa, New Mexico, Seattle, Utah, Atlanta, San Jose-Monterey,Los Angeles, Alaska Native Registry, Rural Georgia, California excluding SF/SJM/LA, Kentucky, Louisiana, New Jersey andGeorgia excluding ATL/RG).
c NOS = Not otherwise specified.- Statistic not displayed due to less than 25 cases.
All Ages Ages 0-19 Ages 20-64 Ages 65+
Site Count Percent ( 95% C.I. ) Percent ( 95% C.I. ) Percent ( 95% C.I. ) Percent ( 95% C.I. )
Lymphoid Neoplasm 73,767 67.4 ( 66.9 , 67.9) 89.4 ( 88.3 ,90.5 ) 77.9 ( 77.3 ,78.4 ) 56.2 ( 55.4 ,56.9)
1 Hodgkin Lymphoma 6,747 85.9 ( 84.9 , 86.9) 95.6 ( 93.6 ,97.0 ) 91.3 ( 90.3 ,92.2 ) 51.1 ( 47.0 ,55.2)
1(a) Classical Hodgkin lymphoma 6,557 85.6 ( 84.5 , 86.6) 95.5 ( 93.5 ,96.9 ) 91.1 ( 90.0 ,92.0 ) 50.0 ( 45.7 ,54.2)
1(a)1. Lymphocyte-rich/mixed cellularity/ 886 76.1 ( 72.3 , 79.5) 92.1 ( 80.0 ,97.0 ) 85.5 ( 81.5 ,88.7 ) 56.5 ( 48.4 ,63.9)
lymphocyte-depleted
1(a)1.1 Lymphocyte-rich 173 81.3 ( 71.7 , 87.9) - ( - , - ) 86.1 ( 74.8 ,92.6 ) 66.2 ( 45.8 ,80.4)
1(a)1.2 Mixed cellularity 646 76.3 ( 71.8 , 80.1) 90.2 ( 75.6 ,96.2 ) 86.0 ( 81.4 ,89.5 ) 56.5 ( 46.9 ,64.9)
1(a)1.3 Lymphocyte-depleted 67 60.0 ( 45.6 , 71.8) - ( - , - ) 78.1 ( 57.3 ,89.6 ) 28.8 ( 12.2 ,47.9)
1(a)2. Nodular sclerosis 4,492 90.0 ( 88.9 , 91.0) 95.6 ( 93.3 ,97.1 ) 92.9 ( 91.7 ,93.8 ) 50.6 ( 43.7 ,57.0)
1(a)3. Classical Hodgkin lymphoma, NOSc 1,179 75.7 ( 72.5 , 78.6) 97.5 ( 90.0 ,99.4 ) 86.7 ( 83.4 ,89.4 ) 41.9 ( 34.7 ,48.9)
1(b) Nodular lymphocyte predominant 190 96.2 ( 89.9 , 98.6) - ( - , - ) 97.3 ( 90.2 ,99.3 ) 87.1 ( 50.0 ,97.3)
Hodgkin Lymphoma
2 Non-Hodgkin lymphoma 64,745 66.1 ( 65.6 , 66.6) 87.5 ( 86.1 ,88.8 ) 75.6 ( 75.0 ,76.2 ) 57.1 ( 56.3 ,57.8)
3 Composite Hodgkin lymphoma and Non-Hodgkin 28 60.4 ( 36.5 , 77.8) - ( - , - ) - ( - , - ) - ( - , - )
lymphoma
4 Lymphoid neoplasm, NOSc 2,247 47.9 ( 45.2 , 50.5) - ( - , - ) 67.0 ( 62.8 ,70.8 ) 38.5 ( 35.1 ,41.8)
Table 9.27
All Lymphoid Neoplasms With Detailed Hodgkin Lymphoma Subtypesa
SEERb 5-Year Relative Survival (Percent) by Age at Diagnosis
All Races, Females, 2002-2008
0
1
2
3
4
5
6
1975 1985 1995 20090
1
2
3
4
5
6
1975 1985 1995 20090
1
2
3
4
5
6
1975 1985 1995 20090
1
2
3
4
5
6
1975 1985 1995 2009
Delay-AdjustedIncidenceDelay-AdjustedIncidence
ObservedIncidenceObservedIncidenceMortalityMortality
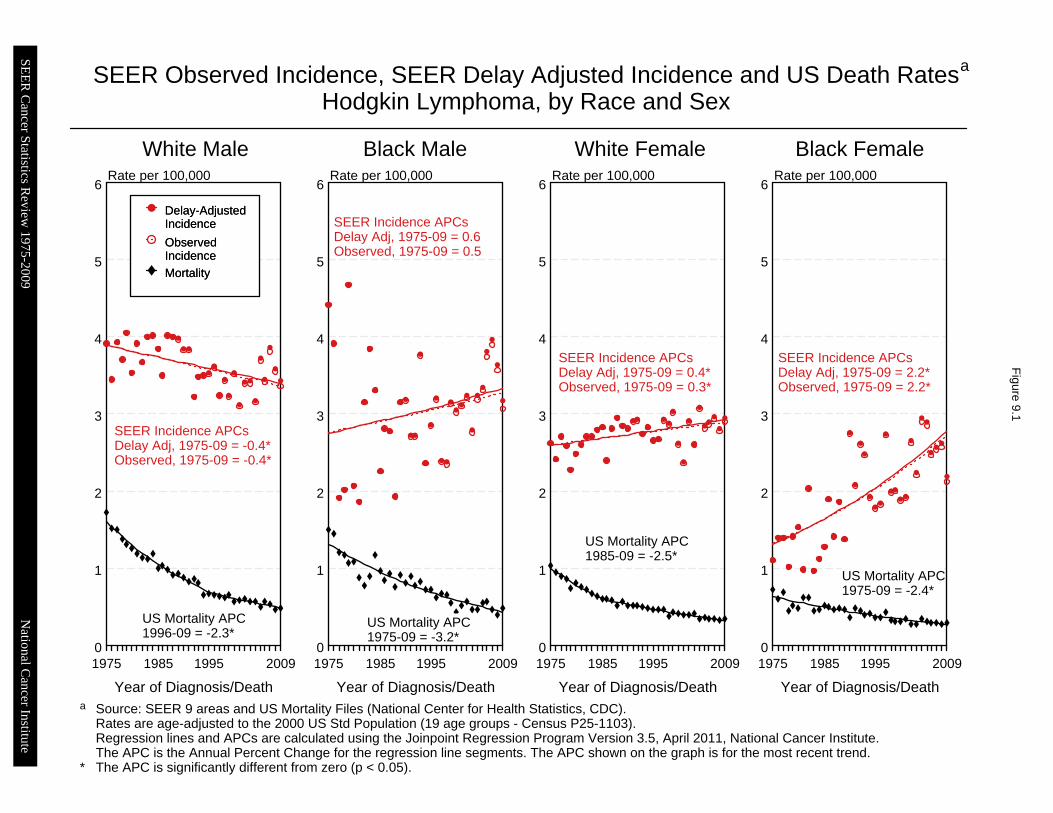
SEER Observed Incidence, SEER Delay Adjusted Incidence and US Death RatesHodgkin Lymphoma, by Race and Sex
a
Figure 9.1
Source: SEER 9 areas and US Mortality Files (National Center for Health Statistics, CDC).Rates are age-adjusted to the 2000 US Std Population (19 age groups - Census P25-1103).Regression lines and APCs are calculated using the Joinpoint Regression Program Version 3.5, April 2011, National Cancer Institute.The APC is the Annual Percent Change for the regression line segments. The APC shown on the graph is for the most recent trend.The APC is significantly different from zero (p < 0.05).
a
*
White Male Black Male White Female Black FemaleRate per 100,000 Rate per 100,000 Rate per 100,000 Rate per 100,000
Year of Diagnosis/Death Year of Diagnosis/Death Year of Diagnosis/Death Year of Diagnosis/Death
SEER Incidence APCsDelay Adj, 1975-09 = -0.4*Observed, 1975-09 = -0.4*
US Mortality APC1996-09 = -2.3*
SEER Incidence APCsDelay Adj, 1975-09 = 0.6Observed, 1975-09 = 0.5
US Mortality APC1975-09 = -3.2*
SEER Incidence APCsDelay Adj, 1975-09 = 0.4*Observed, 1975-09 = 0.3*
US Mortality APC1985-09 = -2.5*
SEER Incidence APCsDelay Adj, 1975-09 = 2.2*Observed, 1975-09 = 2.2*
US Mortality APC1975-09 = -2.4*
SEE
R C
ancer Statistics Review
1975-2009N
ational Cancer Institute
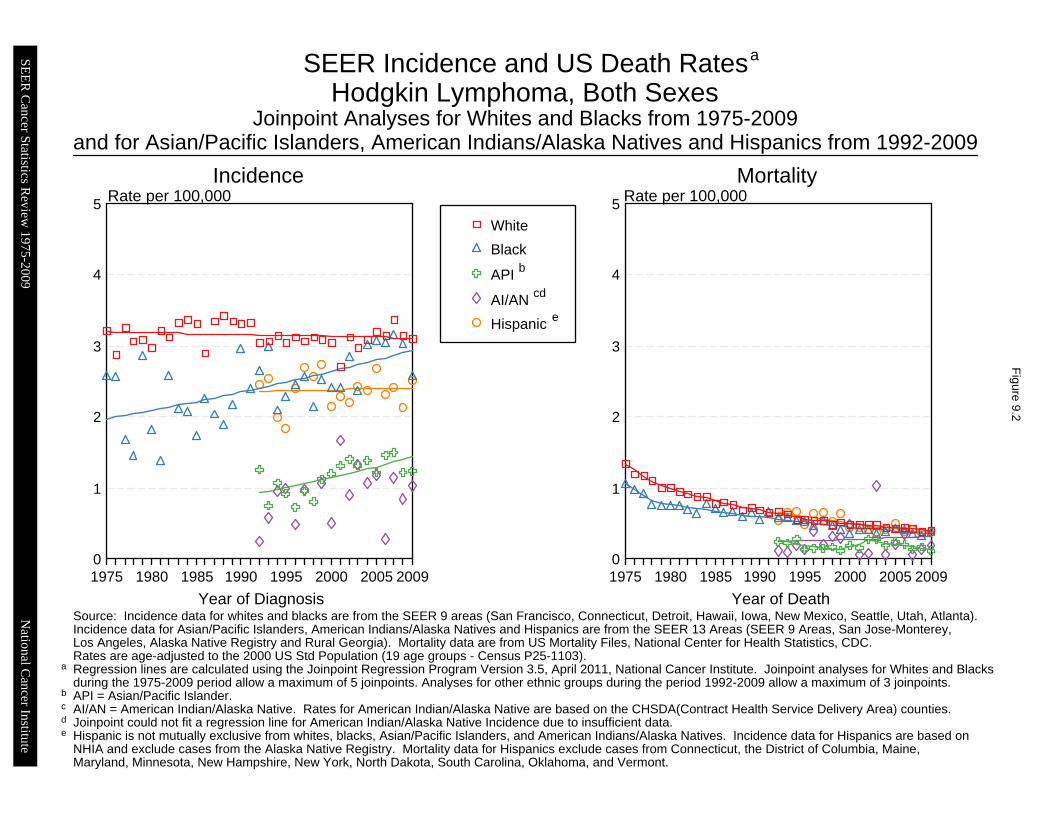
Joinpoint Analyses for Whites and Blacks from 1975-2009and for Asian/Pacific Islanders, American Indians/Alaska Natives and Hispanics from 1992-2009
0
1
2
3
4
5
1975 1980 1985 1990 1995 2000 2005 20090
1
2
3
4
5
1975 1980 1985 1990 1995 2000 2005 2009
White
Black
API
AI/AN
Hispanic
SEER Incidence and US Death RatesHodgkin Lymphoma, Both Sexes
Figure 9.2
Source: Incidence data for whites and blacks are from the SEER 9 areas (San Francisco, Connecticut, Detroit, Hawaii, Iowa, New Mexico, Seattle, Utah, Atlanta). Incidence data for Asian/Pacific Islanders, American Indians/Alaska Natives and Hispanics are from the SEER 13 Areas (SEER 9 Areas, San Jose-Monterey,Los Angeles, Alaska Native Registry and Rural Georgia). Mortality data are from US Mortality Files, National Center for Health Statistics, CDC.Rates are age-adjusted to the 2000 US Std Population (19 age groups - Census P25-1103). Regression lines are calculated using the Joinpoint Regression Program Version 3.5, April 2011, National Cancer Institute. Joinpoint analyses for Whites and Blacksduring the 1975-2009 period allow a maximum of 5 joinpoints. Analyses for other ethnic groups during the period 1992-2009 allow a maximum of 3 joinpoints.API = Asian/Pacific Islander.AI/AN = American Indian/Alaska Native. Rates for American Indian/Alaska Native are based on the CHSDA(Contract Health Service Delivery Area) counties.Joinpoint could not fit a regression line for American Indian/Alaska Native Incidence due to insufficient data.Hispanic is not mutually exclusive from whites, blacks, Asian/Pacific Islanders, and American Indians/Alaska Natives. Incidence data for Hispanics are based onNHIA and exclude cases from the Alaska Native Registry. Mortality data for Hispanics exclude cases from Connecticut, the District of Columbia, Maine,Maryland, Minnesota, New Hampshire, New York, North Dakota, South Carolina, Oklahoma, and Vermont.
Incidence MortalityRate per 100,000 Rate per 100,000
Year of Diagnosis Year of Death
a
e
a
b
cd
cb
e
d
SEE
R C
ancer Statistics Review
1975-2009N
ational Cancer Institute
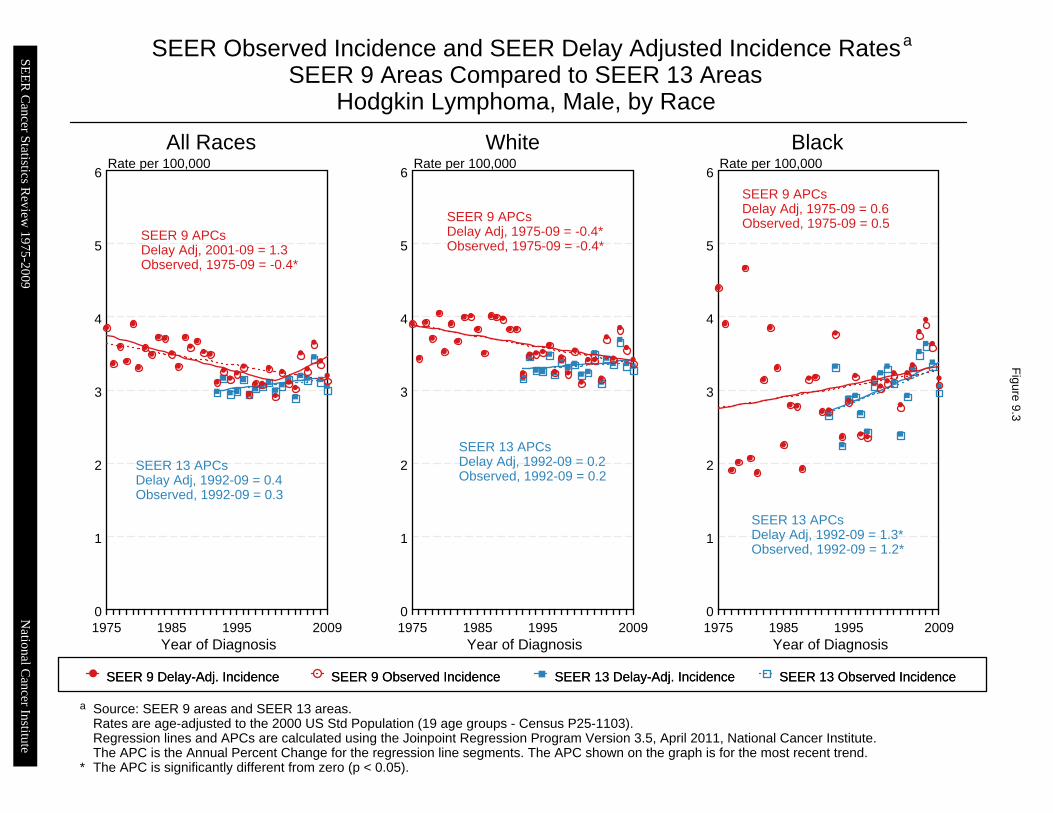
0
1
2
3
4
5
6
1975 1985 1995 20090
1
2
3
4
5
6
1975 1985 1995 20090
1
2
3
4
5
6
1975 1985 1995 2009
SEER 9 Delay-Adj. IncidenceSEER 9 Delay-Adj. Incidence SEER 9 Observed IncidenceSEER 9 Observed Incidence SEER 13 Delay-Adj. IncidenceSEER 13 Delay-Adj. Incidence SEER 13 Observed IncidenceSEER 13 Observed Incidence
SEER Observed Incidence and SEER Delay Adjusted Incidence RatesSEER 9 Areas Compared to SEER 13 Areas
Hodgkin Lymphoma, Male, by Race
aF
igure 9.3
Source: SEER 9 areas and SEER 13 areas.Rates are age-adjusted to the 2000 US Std Population (19 age groups - Census P25-1103).Regression lines and APCs are calculated using the Joinpoint Regression Program Version 3.5, April 2011, National Cancer Institute.The APC is the Annual Percent Change for the regression line segments. The APC shown on the graph is for the most recent trend.The APC is significantly different from zero (p < 0.05).
a
*
All Races White BlackRate per 100,000 Rate per 100,000 Rate per 100,000
Year of Diagnosis Year of Diagnosis Year of Diagnosis
SEER 9 APCsDelay Adj, 2001-09 = 1.3Observed, 1975-09 = -0.4*
SEER 13 APCsDelay Adj, 1992-09 = 0.4Observed, 1992-09 = 0.3
SEER 9 APCsDelay Adj, 1975-09 = -0.4*Observed, 1975-09 = -0.4*
SEER 13 APCsDelay Adj, 1992-09 = 0.2Observed, 1992-09 = 0.2
SEER 9 APCsDelay Adj, 1975-09 = 0.6Observed, 1975-09 = 0.5
SEER 13 APCsDelay Adj, 1992-09 = 1.3*Observed, 1992-09 = 1.2*
SEE
R C
ancer Statistics Review
1975-2009N
ational Cancer Institute
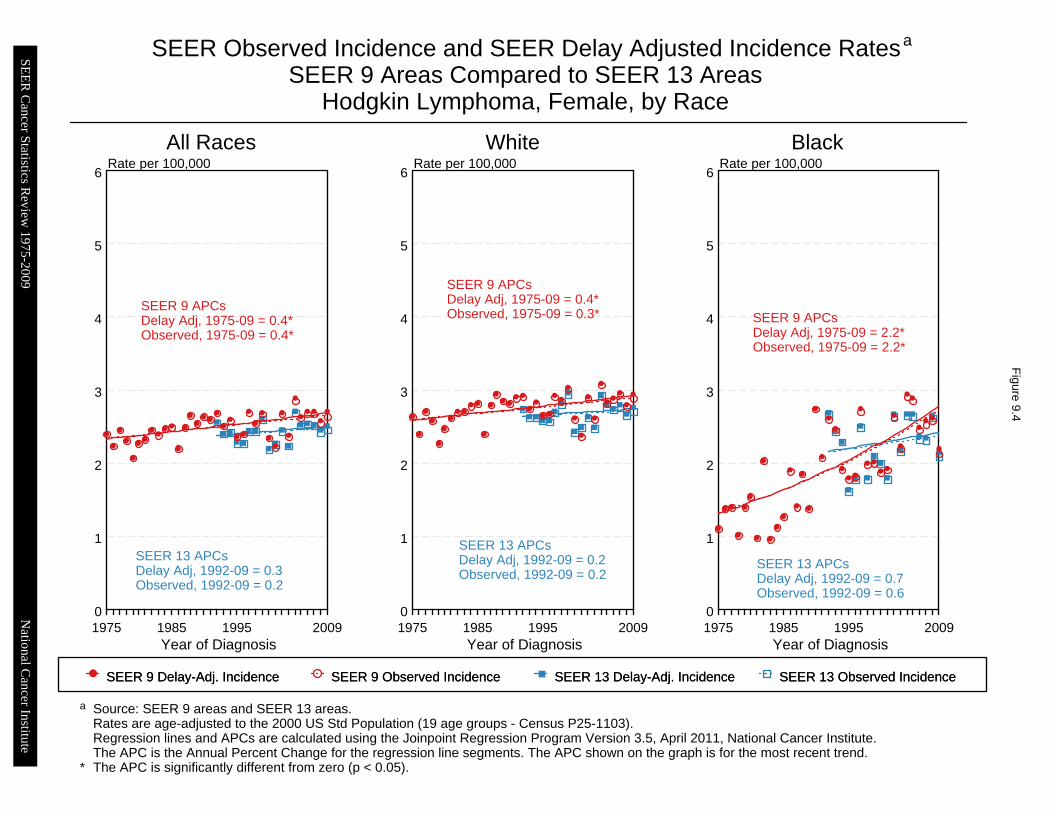
0
1
2
3
4
5
6
1975 1985 1995 20090
1
2
3
4
5
6
1975 1985 1995 20090
1
2
3
4
5
6
1975 1985 1995 2009
SEER 9 Delay-Adj. IncidenceSEER 9 Delay-Adj. Incidence SEER 9 Observed IncidenceSEER 9 Observed Incidence SEER 13 Delay-Adj. IncidenceSEER 13 Delay-Adj. Incidence SEER 13 Observed IncidenceSEER 13 Observed Incidence
SEER Observed Incidence and SEER Delay Adjusted Incidence RatesSEER 9 Areas Compared to SEER 13 Areas
Hodgkin Lymphoma, Female, by Race
aF
igure 9.4
Source: SEER 9 areas and SEER 13 areas.Rates are age-adjusted to the 2000 US Std Population (19 age groups - Census P25-1103).Regression lines and APCs are calculated using the Joinpoint Regression Program Version 3.5, April 2011, National Cancer Institute.The APC is the Annual Percent Change for the regression line segments. The APC shown on the graph is for the most recent trend.The APC is significantly different from zero (p < 0.05).
a
*
All Races White BlackRate per 100,000 Rate per 100,000 Rate per 100,000
Year of Diagnosis Year of Diagnosis Year of Diagnosis
SEER 9 APCsDelay Adj, 1975-09 = 0.4*Observed, 1975-09 = 0.4*
SEER 13 APCsDelay Adj, 1992-09 = 0.3Observed, 1992-09 = 0.2
SEER 9 APCsDelay Adj, 1975-09 = 0.4*Observed, 1975-09 = 0.3*
SEER 13 APCsDelay Adj, 1992-09 = 0.2Observed, 1992-09 = 0.2
SEER 9 APCsDelay Adj, 1975-09 = 2.2*Observed, 1975-09 = 2.2*
SEER 13 APCsDelay Adj, 1992-09 = 0.7Observed, 1992-09 = 0.6
SEE
R C
ancer Statistics Review
1975-2009N
ational Cancer Institute
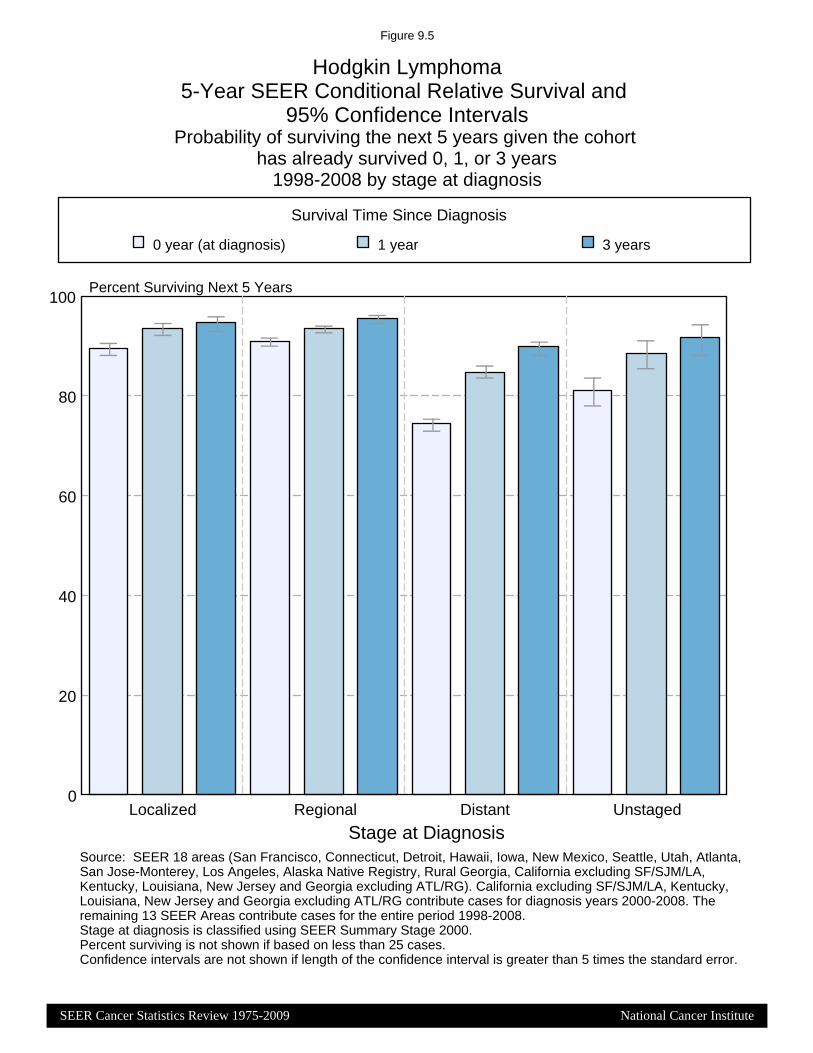
Figure 9.5
Hodgkin Lymphoma5-Year SEER Conditional Relative Survival and
95% Confidence Intervals
Source: SEER 18 areas (San Francisco, Connecticut, Detroit, Hawaii, Iowa, New Mexico, Seattle, Utah, Atlanta,San Jose-Monterey, Los Angeles, Alaska Native Registry, Rural Georgia, California excluding SF/SJM/LA,Kentucky, Louisiana, New Jersey and Georgia excluding ATL/RG). California excluding SF/SJM/LA, Kentucky,Louisiana, New Jersey and Georgia excluding ATL/RG contribute cases for diagnosis years 2000-2008. Theremaining 13 SEER Areas contribute cases for the entire period 1998-2008.Stage at diagnosis is classified using SEER Summary Stage 2000.Percent surviving is not shown if based on less than 25 cases.Confidence intervals are not shown if length of the confidence interval is greater than 5 times the standard error.
0
20
40
60
80
100Percent Surviving Next 5 Years
Stage at Diagnosis
Probability of surviving the next 5 years given the cohort
has already survived 0, 1, or 3 years1998-2008 by stage at diagnosis
Survival Time Since Diagnosis
Localized Regional Distant Unstaged
0 year (at diagnosis) 1 year 3 years
SEER Cancer Statistics Review 1975-2009 National Cancer Institute