Embed Size (px)
Citation preview
SEE
R C
ancer Statistics Review
1975-2008N
ational Cancer Institute
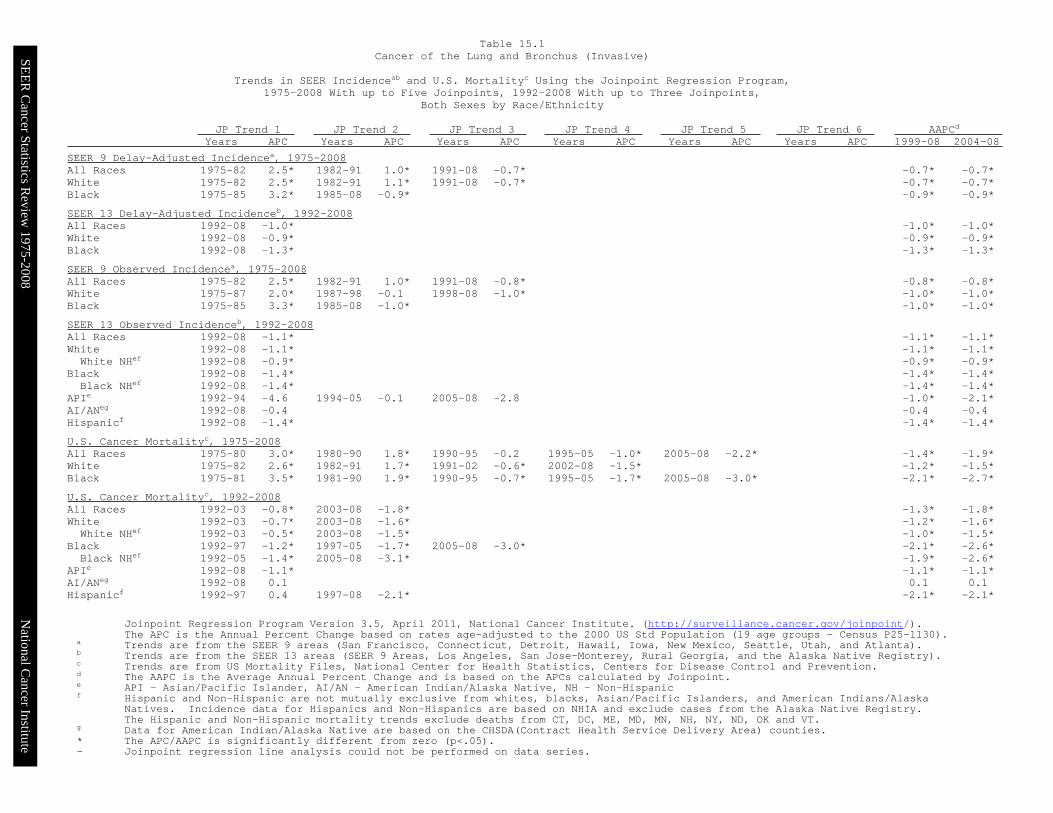
Joinpoint Regression Program Version 3.5, April 2011, National Cancer Institute. (http://surveillance.cancer.gov/joinpoint/).The APC is the Annual Percent Change based on rates age-adjusted to the 2000 US Std Population (19 age groups - Census P25-1130).
a Trends are from the SEER 9 areas (San Francisco, Connecticut, Detroit, Hawaii, Iowa, New Mexico, Seattle, Utah, and Atlanta).b Trends are from the SEER 13 areas (SEER 9 Areas, Los Angeles, San Jose-Monterey, Rural Georgia, and the Alaska Native Registry).c Trends are from US Mortality Files, National Center for Health Statistics, Centers for Disease Control and Prevention.d The AAPC is the Average Annual Percent Change and is based on the APCs calculated by Joinpoint.e API - Asian/Pacific Islander, AI/AN - American Indian/Alaska Native, NH - Non-Hispanicf Hispanic and Non-Hispanic are not mutually exclusive from whites, blacks, Asian/Pacific Islanders, and American Indians/Alaska
Natives. Incidence data for Hispanics and Non-Hispanics are based on NHIA and exclude cases from the Alaska Native Registry.The Hispanic and Non-Hispanic mortality trends exclude deaths from CT, DC, ME, MD, MN, NH, NY, ND, OK and VT.
g Data for American Indian/Alaska Native are based on the CHSDA(Contract Health Service Delivery Area) counties.* The APC/AAPC is significantly different from zero (p<.05).- Joinpoint regression line analysis could not be performed on data series.
JP Trend 1 JP Trend 2 JP Trend 3 JP Trend 4 JP Trend 5 JP Trend 6 AAPCd Years APC Years APC Years APC Years APC Years APC Years APC 1999-08 2004-08
SEER 9 Delay-Adjusted Incidencea, 1975-2008All Races 1975-82 2.5* 1982-91 1.0* 1991-08 -0.7* -0.7* -0.7*White 1975-82 2.5* 1982-91 1.1* 1991-08 -0.7* -0.7* -0.7*Black 1975-85 3.2* 1985-08 -0.9* -0.9* -0.9*
SEER 13 Delay-Adjusted Incidenceb, 1992-2008All Races 1992-08 -1.0* -1.0* -1.0*White 1992-08 -0.9* -0.9* -0.9*Black 1992-08 -1.3* -1.3* -1.3*
SEER 9 Observed Incidencea, 1975-2008All Races 1975-82 2.5* 1982-91 1.0* 1991-08 -0.8* -0.8* -0.8*White 1975-87 2.0* 1987-98 -0.1 1998-08 -1.0* -1.0* -1.0*Black 1975-85 3.3* 1985-08 -1.0* -1.0* -1.0*
SEER 13 Observed Incidenceb, 1992-2008All Races 1992-08 -1.1* -1.1* -1.1*White 1992-08 -1.1* -1.1* -1.1*White NHef 1992-08 -0.9* -0.9* -0.9*
Black 1992-08 -1.4* -1.4* -1.4*Black NHef 1992-08 -1.4* -1.4* -1.4*
APIe 1992-94 -4.6 1994-05 -0.1 2005-08 -2.8 -1.0* -2.1*AI/ANeg 1992-08 -0.4 -0.4 -0.4Hispanicf 1992-08 -1.4* -1.4* -1.4*
U.S. Cancer Mortalityc, 1975-2008All Races 1975-80 3.0* 1980-90 1.8* 1990-95 -0.2 1995-05 -1.0* 2005-08 -2.2* -1.4* -1.9*White 1975-82 2.6* 1982-91 1.7* 1991-02 -0.6* 2002-08 -1.5* -1.2* -1.5*Black 1975-81 3.5* 1981-90 1.9* 1990-95 -0.7* 1995-05 -1.7* 2005-08 -3.0* -2.1* -2.7*
U.S. Cancer Mortalityc, 1992-2008All Races 1992-03 -0.8* 2003-08 -1.8* -1.3* -1.8*White 1992-03 -0.7* 2003-08 -1.6* -1.2* -1.6*White NHef 1992-03 -0.5* 2003-08 -1.5* -1.0* -1.5*
Black 1992-97 -1.2* 1997-05 -1.7* 2005-08 -3.0* -2.1* -2.6*Black NHef 1992-05 -1.4* 2005-08 -3.1* -1.9* -2.6*
APIe 1992-08 -1.1* -1.1* -1.1*AI/ANeg 1992-08 0.1 0.1 0.1Hispanicf 1992-97 0.4 1997-08 -2.1* -2.1* -2.1*
Table 15.1Cancer of the Lung and Bronchus (Invasive)
Trends in SEER Incidenceab and U.S. Mortalityc Using the Joinpoint Regression Program,1975-2008 With up to Five Joinpoints, 1992-2008 With up to Three Joinpoints,
Both Sexes by Race/Ethnicity
SEE
R C
ancer Statistics Review
1975-2008N
ational Cancer Institute
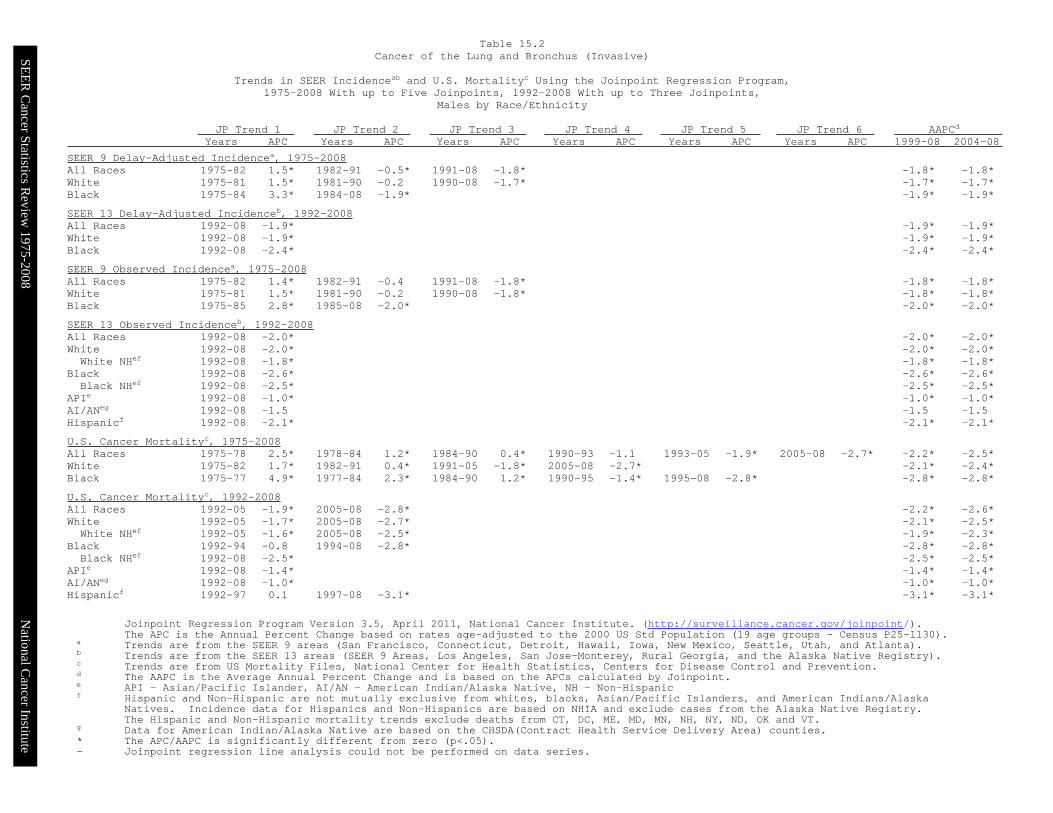
Joinpoint Regression Program Version 3.5, April 2011, National Cancer Institute. (http://surveillance.cancer.gov/joinpoint/).The APC is the Annual Percent Change based on rates age-adjusted to the 2000 US Std Population (19 age groups - Census P25-1130).
a Trends are from the SEER 9 areas (San Francisco, Connecticut, Detroit, Hawaii, Iowa, New Mexico, Seattle, Utah, and Atlanta).b Trends are from the SEER 13 areas (SEER 9 Areas, Los Angeles, San Jose-Monterey, Rural Georgia, and the Alaska Native Registry).c Trends are from US Mortality Files, National Center for Health Statistics, Centers for Disease Control and Prevention.d The AAPC is the Average Annual Percent Change and is based on the APCs calculated by Joinpoint.e API - Asian/Pacific Islander, AI/AN - American Indian/Alaska Native, NH - Non-Hispanicf Hispanic and Non-Hispanic are not mutually exclusive from whites, blacks, Asian/Pacific Islanders, and American Indians/Alaska
Natives. Incidence data for Hispanics and Non-Hispanics are based on NHIA and exclude cases from the Alaska Native Registry.The Hispanic and Non-Hispanic mortality trends exclude deaths from CT, DC, ME, MD, MN, NH, NY, ND, OK and VT.
g Data for American Indian/Alaska Native are based on the CHSDA(Contract Health Service Delivery Area) counties.* The APC/AAPC is significantly different from zero (p<.05).- Joinpoint regression line analysis could not be performed on data series.
JP Trend 1 JP Trend 2 JP Trend 3 JP Trend 4 JP Trend 5 JP Trend 6 AAPCd Years APC Years APC Years APC Years APC Years APC Years APC 1999-08 2004-08
SEER 9 Delay-Adjusted Incidencea, 1975-2008All Races 1975-82 1.5* 1982-91 -0.5* 1991-08 -1.8* -1.8* -1.8*White 1975-81 1.5* 1981-90 -0.2 1990-08 -1.7* -1.7* -1.7*Black 1975-84 3.3* 1984-08 -1.9* -1.9* -1.9*
SEER 13 Delay-Adjusted Incidenceb, 1992-2008All Races 1992-08 -1.9* -1.9* -1.9*White 1992-08 -1.9* -1.9* -1.9*Black 1992-08 -2.4* -2.4* -2.4*
SEER 9 Observed Incidencea, 1975-2008All Races 1975-82 1.4* 1982-91 -0.4 1991-08 -1.8* -1.8* -1.8*White 1975-81 1.5* 1981-90 -0.2 1990-08 -1.8* -1.8* -1.8*Black 1975-85 2.8* 1985-08 -2.0* -2.0* -2.0*
SEER 13 Observed Incidenceb, 1992-2008All Races 1992-08 -2.0* -2.0* -2.0*White 1992-08 -2.0* -2.0* -2.0*White NHef 1992-08 -1.8* -1.8* -1.8*
Black 1992-08 -2.6* -2.6* -2.6*Black NHef 1992-08 -2.5* -2.5* -2.5*
APIe 1992-08 -1.0* -1.0* -1.0*AI/ANeg 1992-08 -1.5 -1.5 -1.5Hispanicf 1992-08 -2.1* -2.1* -2.1*
U.S. Cancer Mortalityc, 1975-2008All Races 1975-78 2.5* 1978-84 1.2* 1984-90 0.4* 1990-93 -1.1 1993-05 -1.9* 2005-08 -2.7* -2.2* -2.5*White 1975-82 1.7* 1982-91 0.4* 1991-05 -1.8* 2005-08 -2.7* -2.1* -2.4*Black 1975-77 4.9* 1977-84 2.3* 1984-90 1.2* 1990-95 -1.4* 1995-08 -2.8* -2.8* -2.8*
U.S. Cancer Mortalityc, 1992-2008All Races 1992-05 -1.9* 2005-08 -2.8* -2.2* -2.6*White 1992-05 -1.7* 2005-08 -2.7* -2.1* -2.5*White NHef 1992-05 -1.6* 2005-08 -2.5* -1.9* -2.3*
Black 1992-94 -0.8 1994-08 -2.8* -2.8* -2.8*Black NHef 1992-08 -2.5* -2.5* -2.5*
APIe 1992-08 -1.4* -1.4* -1.4*AI/ANeg 1992-08 -1.0* -1.0* -1.0*Hispanicf 1992-97 0.1 1997-08 -3.1* -3.1* -3.1*
Table 15.2Cancer of the Lung and Bronchus (Invasive)
Trends in SEER Incidenceab and U.S. Mortalityc Using the Joinpoint Regression Program,1975-2008 With up to Five Joinpoints, 1992-2008 With up to Three Joinpoints,
Males by Race/Ethnicity
SEE
R C
ancer Statistics Review
1975-2008N
ational Cancer Institute
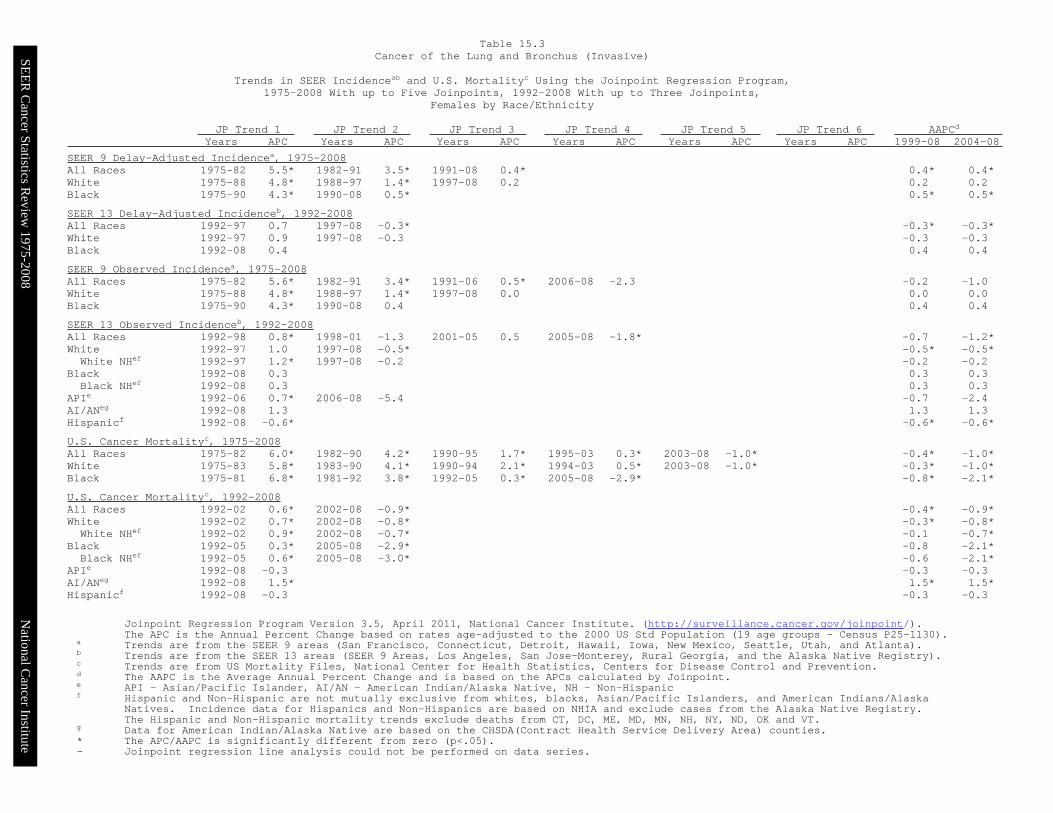
Joinpoint Regression Program Version 3.5, April 2011, National Cancer Institute. (http://surveillance.cancer.gov/joinpoint/).The APC is the Annual Percent Change based on rates age-adjusted to the 2000 US Std Population (19 age groups - Census P25-1130).
a Trends are from the SEER 9 areas (San Francisco, Connecticut, Detroit, Hawaii, Iowa, New Mexico, Seattle, Utah, and Atlanta).b Trends are from the SEER 13 areas (SEER 9 Areas, Los Angeles, San Jose-Monterey, Rural Georgia, and the Alaska Native Registry).c Trends are from US Mortality Files, National Center for Health Statistics, Centers for Disease Control and Prevention.d The AAPC is the Average Annual Percent Change and is based on the APCs calculated by Joinpoint.e API - Asian/Pacific Islander, AI/AN - American Indian/Alaska Native, NH - Non-Hispanicf Hispanic and Non-Hispanic are not mutually exclusive from whites, blacks, Asian/Pacific Islanders, and American Indians/Alaska
Natives. Incidence data for Hispanics and Non-Hispanics are based on NHIA and exclude cases from the Alaska Native Registry.The Hispanic and Non-Hispanic mortality trends exclude deaths from CT, DC, ME, MD, MN, NH, NY, ND, OK and VT.
g Data for American Indian/Alaska Native are based on the CHSDA(Contract Health Service Delivery Area) counties.* The APC/AAPC is significantly different from zero (p<.05).- Joinpoint regression line analysis could not be performed on data series.
JP Trend 1 JP Trend 2 JP Trend 3 JP Trend 4 JP Trend 5 JP Trend 6 AAPCd Years APC Years APC Years APC Years APC Years APC Years APC 1999-08 2004-08
SEER 9 Delay-Adjusted Incidencea, 1975-2008All Races 1975-82 5.5* 1982-91 3.5* 1991-08 0.4* 0.4* 0.4*White 1975-88 4.8* 1988-97 1.4* 1997-08 0.2 0.2 0.2Black 1975-90 4.3* 1990-08 0.5* 0.5* 0.5*
SEER 13 Delay-Adjusted Incidenceb, 1992-2008All Races 1992-97 0.7 1997-08 -0.3* -0.3* -0.3*White 1992-97 0.9 1997-08 -0.3 -0.3 -0.3Black 1992-08 0.4 0.4 0.4
SEER 9 Observed Incidencea, 1975-2008All Races 1975-82 5.6* 1982-91 3.4* 1991-06 0.5* 2006-08 -2.3 -0.2 -1.0White 1975-88 4.8* 1988-97 1.4* 1997-08 0.0 0.0 0.0Black 1975-90 4.3* 1990-08 0.4 0.4 0.4
SEER 13 Observed Incidenceb, 1992-2008All Races 1992-98 0.8* 1998-01 -1.3 2001-05 0.5 2005-08 -1.8* -0.7 -1.2*White 1992-97 1.0 1997-08 -0.5* -0.5* -0.5*White NHef 1992-97 1.2* 1997-08 -0.2 -0.2 -0.2
Black 1992-08 0.3 0.3 0.3Black NHef 1992-08 0.3 0.3 0.3
APIe 1992-06 0.7* 2006-08 -5.4 -0.7 -2.4AI/ANeg 1992-08 1.3 1.3 1.3Hispanicf 1992-08 -0.6* -0.6* -0.6*
U.S. Cancer Mortalityc, 1975-2008All Races 1975-82 6.0* 1982-90 4.2* 1990-95 1.7* 1995-03 0.3* 2003-08 -1.0* -0.4* -1.0*White 1975-83 5.8* 1983-90 4.1* 1990-94 2.1* 1994-03 0.5* 2003-08 -1.0* -0.3* -1.0*Black 1975-81 6.8* 1981-92 3.8* 1992-05 0.3* 2005-08 -2.9* -0.8* -2.1*
U.S. Cancer Mortalityc, 1992-2008All Races 1992-02 0.6* 2002-08 -0.9* -0.4* -0.9*White 1992-02 0.7* 2002-08 -0.8* -0.3* -0.8*White NHef 1992-02 0.9* 2002-08 -0.7* -0.1 -0.7*
Black 1992-05 0.3* 2005-08 -2.9* -0.8 -2.1*Black NHef 1992-05 0.6* 2005-08 -3.0* -0.6 -2.1*
APIe 1992-08 -0.3 -0.3 -0.3AI/ANeg 1992-08 1.5* 1.5* 1.5*Hispanicf 1992-08 -0.3 -0.3 -0.3
Table 15.3Cancer of the Lung and Bronchus (Invasive)
Trends in SEER Incidenceab and U.S. Mortalityc Using the Joinpoint Regression Program,1975-2008 With up to Five Joinpoints, 1992-2008 With up to Three Joinpoints,
Females by Race/Ethnicity
SEE
R C
ancer Statistics Review
1975-2008N
ational Cancer Institute
Joinpoint Regression Program Version 3.5, April 2011, National Cancer Institute. (http://surveillance.cancer.gov/joinpoint/).The APC is the Annual Percent Change based on rates age-adjusted to the 2000 US Std Population (19 age groups - Census P25-1130).
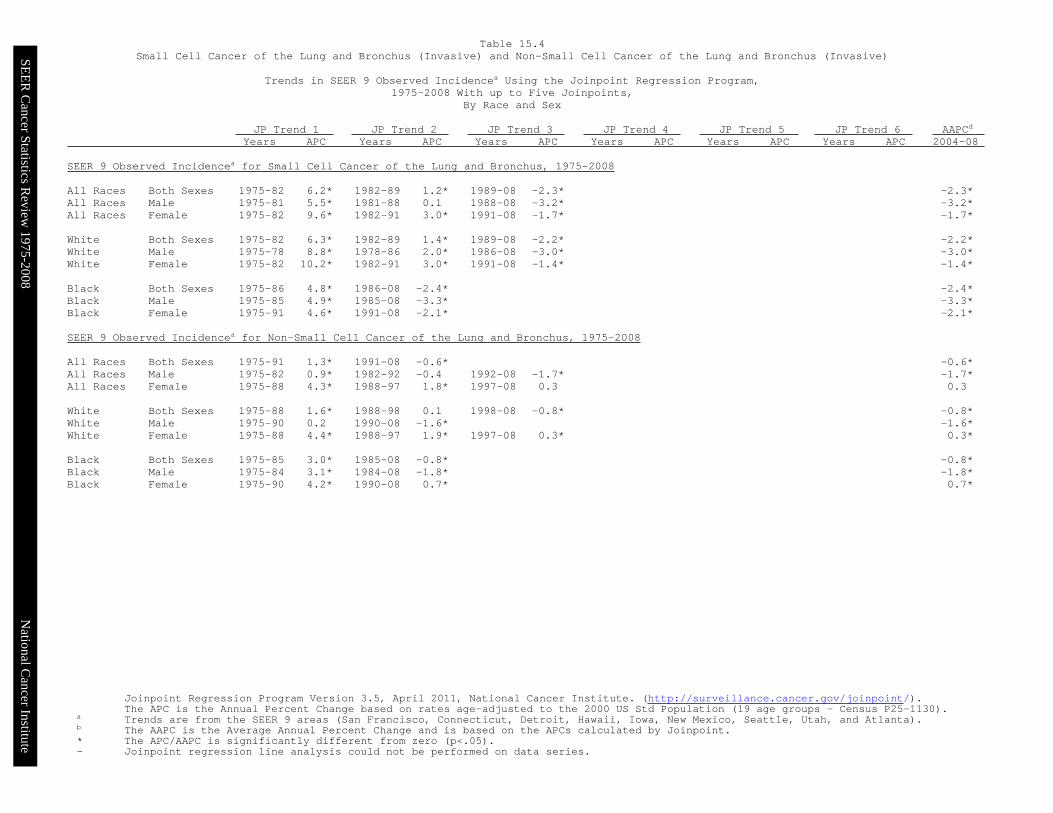
a Trends are from the SEER 9 areas (San Francisco, Connecticut, Detroit, Hawaii, Iowa, New Mexico, Seattle, Utah, and Atlanta).b The AAPC is the Average Annual Percent Change and is based on the APCs calculated by Joinpoint.* The APC/AAPC is significantly different from zero (p<.05).- Joinpoint regression line analysis could not be performed on data series.
JP Trend 1 JP Trend 2 JP Trend 3 JP Trend 4 JP Trend 5 JP Trend 6 AAPCd Years APC Years APC Years APC Years APC Years APC Years APC 2004-08
SEER 9 Observed Incidencea for Small Cell Cancer of the Lung and Bronchus, 1975-2008
All Races Both Sexes 1975-82 6.2* 1982-89 1.2* 1989-08 -2.3* -2.3*All Races Male 1975-81 5.5* 1981-88 0.1 1988-08 -3.2* -3.2*All Races Female 1975-82 9.6* 1982-91 3.0* 1991-08 -1.7* -1.7*
White Both Sexes 1975-82 6.3* 1982-89 1.4* 1989-08 -2.2* -2.2*White Male 1975-78 8.8* 1978-86 2.0* 1986-08 -3.0* -3.0*White Female 1975-82 10.2* 1982-91 3.0* 1991-08 -1.4* -1.4*
Black Both Sexes 1975-86 4.8* 1986-08 -2.4* -2.4*Black Male 1975-85 4.9* 1985-08 -3.3* -3.3*Black Female 1975-91 4.6* 1991-08 -2.1* -2.1*
SEER 9 Observed Incidencea for Non-Small Cell Cancer of the Lung and Bronchus, 1975-2008
All Races Both Sexes 1975-91 1.3* 1991-08 -0.6* -0.6*All Races Male 1975-82 0.9* 1982-92 -0.4 1992-08 -1.7* -1.7*All Races Female 1975-88 4.3* 1988-97 1.8* 1997-08 0.3 0.3
White Both Sexes 1975-88 1.6* 1988-98 0.1 1998-08 -0.8* -0.8*White Male 1975-90 0.2 1990-08 -1.6* -1.6*White Female 1975-88 4.4* 1988-97 1.9* 1997-08 0.3* 0.3*
Black Both Sexes 1975-85 3.0* 1985-08 -0.8* -0.8*Black Male 1975-84 3.1* 1984-08 -1.8* -1.8*Black Female 1975-90 4.2* 1990-08 0.7* 0.7*
Table 15.4Small Cell Cancer of the Lung and Bronchus (Invasive) and Non-Small Cell Cancer of the Lung and Bronchus (Invasive)
Trends in SEER 9 Observed Incidencea Using the Joinpoint Regression Program,1975-2008 With up to Five Joinpoints,
By Race and Sex
SEE
R C
ancer Statistics Review
1975-2008N
ational Cancer Institute
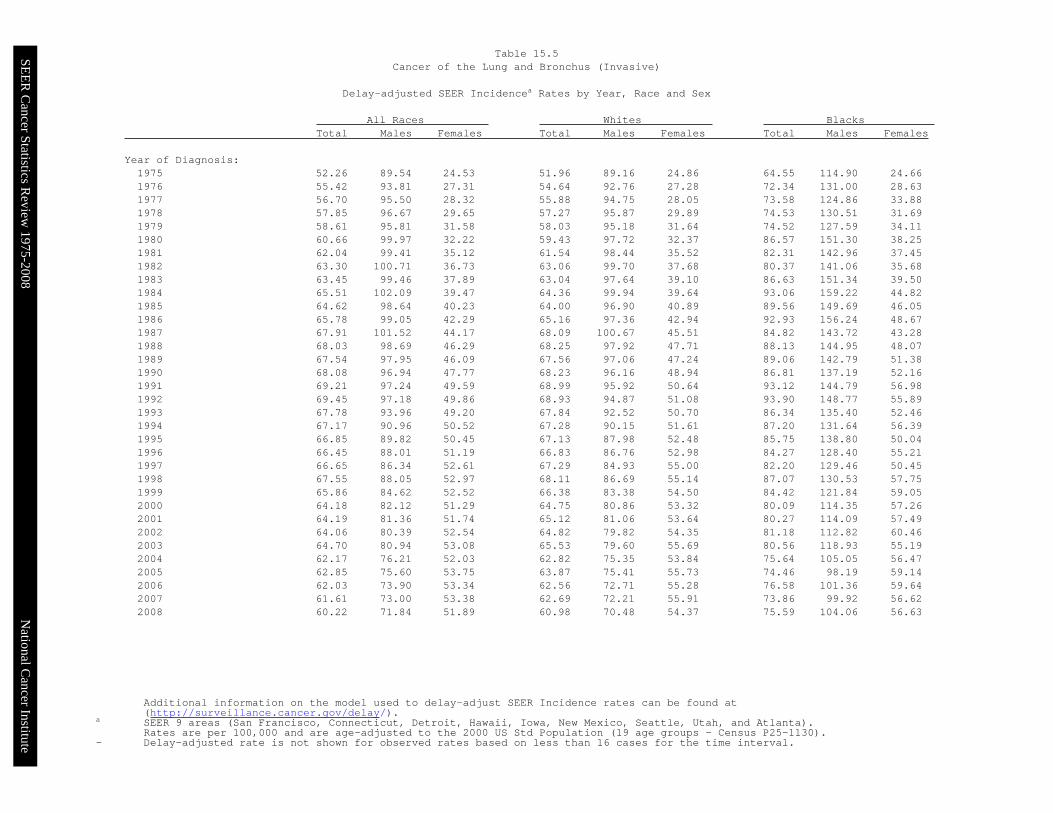
Additional information on the model used to delay-adjust SEER Incidence rates can be found at(http://surveillance.cancer.gov/delay/).
a SEER 9 areas (San Francisco, Connecticut, Detroit, Hawaii, Iowa, New Mexico, Seattle, Utah, and Atlanta).Rates are per 100,000 and are age-adjusted to the 2000 US Std Population (19 age groups - Census P25-1130).
- Delay-adjusted rate is not shown for observed rates based on less than 16 cases for the time interval.
All Races Whites Blacks Total Males Females Total Males Females Total Males Females
Year of Diagnosis:1975 52.26 89.54 24.53 51.96 89.16 24.86 64.55 114.90 24.661976 55.42 93.81 27.31 54.64 92.76 27.28 72.34 131.00 28.631977 56.70 95.50 28.32 55.88 94.75 28.05 73.58 124.86 33.881978 57.85 96.67 29.65 57.27 95.87 29.89 74.53 130.51 31.691979 58.61 95.81 31.58 58.03 95.18 31.64 74.52 127.59 34.111980 60.66 99.97 32.22 59.43 97.72 32.37 86.57 151.30 38.251981 62.04 99.41 35.12 61.54 98.44 35.52 82.31 142.96 37.451982 63.30 100.71 36.73 63.06 99.70 37.68 80.37 141.06 35.681983 63.45 99.46 37.89 63.04 97.64 39.10 86.63 151.34 39.501984 65.51 102.09 39.47 64.36 99.94 39.64 93.06 159.22 44.821985 64.62 98.64 40.23 64.00 96.90 40.89 89.56 149.69 46.051986 65.78 99.05 42.29 65.16 97.36 42.94 92.93 156.24 48.671987 67.91 101.52 44.17 68.09 100.67 45.51 84.82 143.72 43.281988 68.03 98.69 46.29 68.25 97.92 47.71 88.13 144.95 48.071989 67.54 97.95 46.09 67.56 97.06 47.24 89.06 142.79 51.381990 68.08 96.94 47.77 68.23 96.16 48.94 86.81 137.19 52.161991 69.21 97.24 49.59 68.99 95.92 50.64 93.12 144.79 56.981992 69.45 97.18 49.86 68.93 94.87 51.08 93.90 148.77 55.891993 67.78 93.96 49.20 67.84 92.52 50.70 86.34 135.40 52.461994 67.17 90.96 50.52 67.28 90.15 51.61 87.20 131.64 56.391995 66.85 89.82 50.45 67.13 87.98 52.48 85.75 138.80 50.041996 66.45 88.01 51.19 66.83 86.76 52.98 84.27 128.40 55.211997 66.65 86.34 52.61 67.29 84.93 55.00 82.20 129.46 50.451998 67.55 88.05 52.97 68.11 86.69 55.14 87.07 130.53 57.751999 65.86 84.62 52.52 66.38 83.38 54.50 84.42 121.84 59.052000 64.18 82.12 51.29 64.75 80.86 53.32 80.09 114.35 57.262001 64.19 81.36 51.74 65.12 81.06 53.64 80.27 114.09 57.492002 64.06 80.39 52.54 64.82 79.82 54.35 81.18 112.82 60.462003 64.70 80.94 53.08 65.53 79.60 55.69 80.56 118.93 55.192004 62.17 76.21 52.03 62.82 75.35 53.84 75.64 105.05 56.472005 62.85 75.60 53.75 63.87 75.41 55.73 74.46 98.19 59.142006 62.03 73.90 53.34 62.56 72.71 55.28 76.58 101.36 59.642007 61.61 73.00 53.38 62.69 72.21 55.91 73.86 99.92 56.622008 60.22 71.84 51.89 60.98 70.48 54.37 75.59 104.06 56.63
Table 15.5Cancer of the Lung and Bronchus (Invasive)
Delay-adjusted SEER Incidencea Rates by Year, Race and Sex
SEE
R C
ancer Statistics Review
1975-2008N
ational Cancer Institute
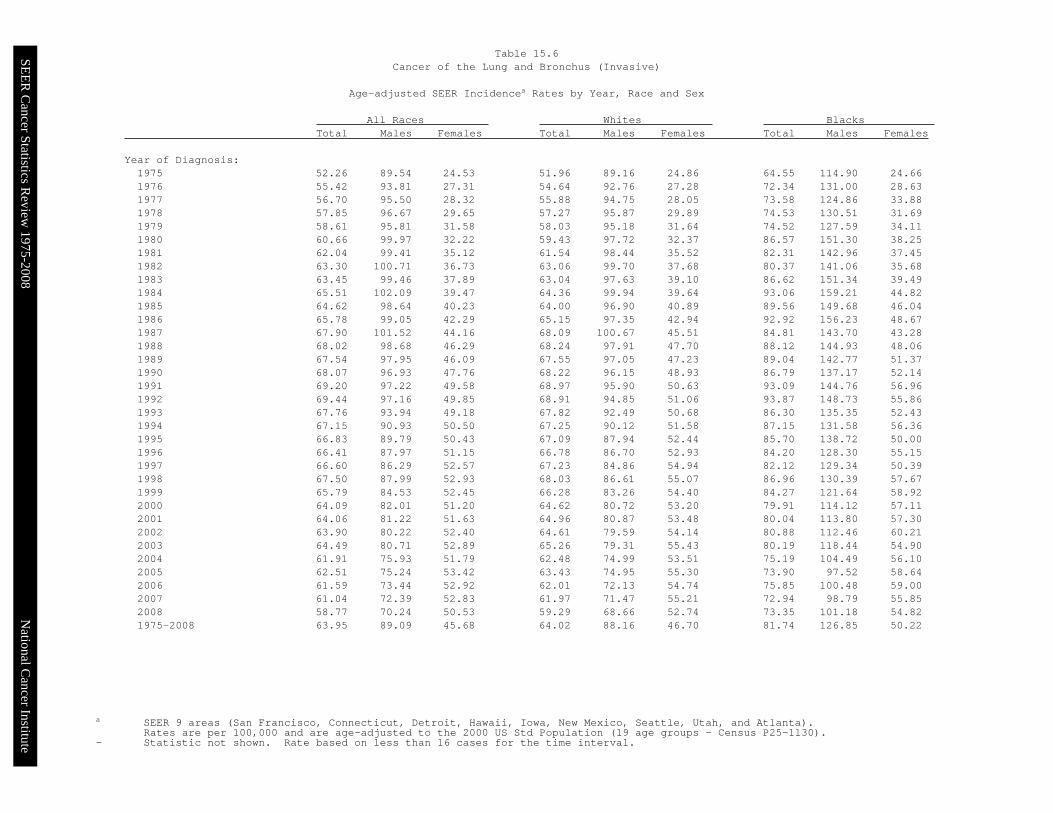
a SEER 9 areas (San Francisco, Connecticut, Detroit, Hawaii, Iowa, New Mexico, Seattle, Utah, and Atlanta).Rates are per 100,000 and are age-adjusted to the 2000 US Std Population (19 age groups - Census P25-1130).
- Statistic not shown. Rate based on less than 16 cases for the time interval.
All Races Whites Blacks Total Males Females Total Males Females Total Males Females
Year of Diagnosis:1975 52.26 89.54 24.53 51.96 89.16 24.86 64.55 114.90 24.661976 55.42 93.81 27.31 54.64 92.76 27.28 72.34 131.00 28.631977 56.70 95.50 28.32 55.88 94.75 28.05 73.58 124.86 33.881978 57.85 96.67 29.65 57.27 95.87 29.89 74.53 130.51 31.691979 58.61 95.81 31.58 58.03 95.18 31.64 74.52 127.59 34.111980 60.66 99.97 32.22 59.43 97.72 32.37 86.57 151.30 38.251981 62.04 99.41 35.12 61.54 98.44 35.52 82.31 142.96 37.451982 63.30 100.71 36.73 63.06 99.70 37.68 80.37 141.06 35.681983 63.45 99.46 37.89 63.04 97.63 39.10 86.62 151.34 39.491984 65.51 102.09 39.47 64.36 99.94 39.64 93.06 159.21 44.821985 64.62 98.64 40.23 64.00 96.90 40.89 89.56 149.68 46.041986 65.78 99.05 42.29 65.15 97.35 42.94 92.92 156.23 48.671987 67.90 101.52 44.16 68.09 100.67 45.51 84.81 143.70 43.281988 68.02 98.68 46.29 68.24 97.91 47.70 88.12 144.93 48.061989 67.54 97.95 46.09 67.55 97.05 47.23 89.04 142.77 51.371990 68.07 96.93 47.76 68.22 96.15 48.93 86.79 137.17 52.141991 69.20 97.22 49.58 68.97 95.90 50.63 93.09 144.76 56.961992 69.44 97.16 49.85 68.91 94.85 51.06 93.87 148.73 55.861993 67.76 93.94 49.18 67.82 92.49 50.68 86.30 135.35 52.431994 67.15 90.93 50.50 67.25 90.12 51.58 87.15 131.58 56.361995 66.83 89.79 50.43 67.09 87.94 52.44 85.70 138.72 50.001996 66.41 87.97 51.15 66.78 86.70 52.93 84.20 128.30 55.151997 66.60 86.29 52.57 67.23 84.86 54.94 82.12 129.34 50.391998 67.50 87.99 52.93 68.03 86.61 55.07 86.96 130.39 57.671999 65.79 84.53 52.45 66.28 83.26 54.40 84.27 121.64 58.922000 64.09 82.01 51.20 64.62 80.72 53.20 79.91 114.12 57.112001 64.06 81.22 51.63 64.96 80.87 53.48 80.04 113.80 57.302002 63.90 80.22 52.40 64.61 79.59 54.14 80.88 112.46 60.212003 64.49 80.71 52.89 65.26 79.31 55.43 80.19 118.44 54.902004 61.91 75.93 51.79 62.48 74.99 53.51 75.19 104.49 56.102005 62.51 75.24 53.42 63.43 74.95 55.30 73.90 97.52 58.642006 61.59 73.44 52.92 62.01 72.13 54.74 75.85 100.48 59.002007 61.04 72.39 52.83 61.97 71.47 55.21 72.94 98.79 55.852008 58.77 70.24 50.53 59.29 68.66 52.74 73.35 101.18 54.821975-2008 63.95 89.09 45.68 64.02 88.16 46.70 81.74 126.85 50.22
Table 15.6Cancer of the Lung and Bronchus (Invasive)
Age-adjusted SEER Incidencea Rates by Year, Race and Sex
SEE
R C
ancer Statistics Review
1975-2008N
ational Cancer Institute
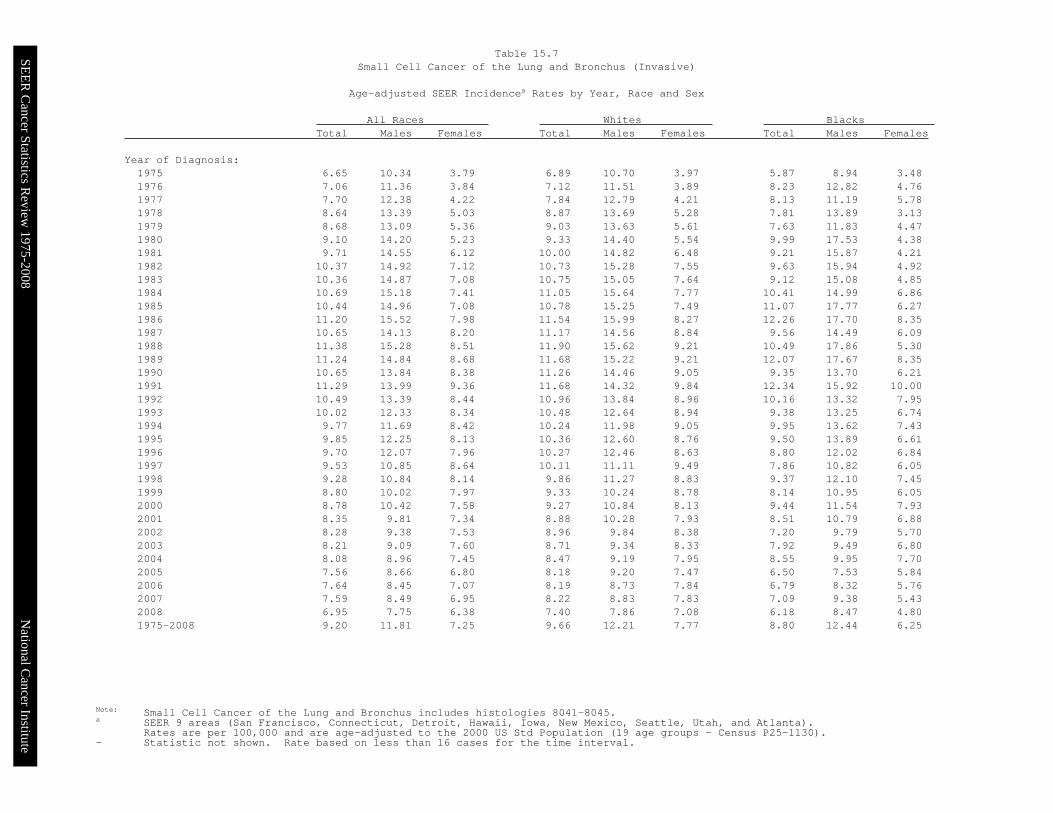
Note: Small Cell Cancer of the Lung and Bronchus includes histologies 8041-8045.a SEER 9 areas (San Francisco, Connecticut, Detroit, Hawaii, Iowa, New Mexico, Seattle, Utah, and Atlanta).
Rates are per 100,000 and are age-adjusted to the 2000 US Std Population (19 age groups - Census P25-1130).- Statistic not shown. Rate based on less than 16 cases for the time interval.
All Races Whites Blacks Total Males Females Total Males Females Total Males Females
Year of Diagnosis:1975 6.65 10.34 3.79 6.89 10.70 3.97 5.87 8.94 3.481976 7.06 11.36 3.84 7.12 11.51 3.89 8.23 12.82 4.761977 7.70 12.38 4.22 7.84 12.79 4.21 8.13 11.19 5.781978 8.64 13.39 5.03 8.87 13.69 5.28 7.81 13.89 3.131979 8.68 13.09 5.36 9.03 13.63 5.61 7.63 11.83 4.471980 9.10 14.20 5.23 9.33 14.40 5.54 9.99 17.53 4.381981 9.71 14.55 6.12 10.00 14.82 6.48 9.21 15.87 4.211982 10.37 14.92 7.12 10.73 15.28 7.55 9.63 15.94 4.921983 10.36 14.87 7.08 10.75 15.05 7.64 9.12 15.08 4.851984 10.69 15.18 7.41 11.05 15.64 7.77 10.41 14.99 6.861985 10.44 14.96 7.08 10.78 15.25 7.49 11.07 17.77 6.271986 11.20 15.52 7.98 11.54 15.99 8.27 12.26 17.70 8.351987 10.65 14.13 8.20 11.17 14.56 8.84 9.56 14.49 6.091988 11.38 15.28 8.51 11.90 15.62 9.21 10.49 17.86 5.301989 11.24 14.84 8.68 11.68 15.22 9.21 12.07 17.67 8.351990 10.65 13.84 8.38 11.26 14.46 9.05 9.35 13.70 6.211991 11.29 13.99 9.36 11.68 14.32 9.84 12.34 15.92 10.001992 10.49 13.39 8.44 10.96 13.84 8.96 10.16 13.32 7.951993 10.02 12.33 8.34 10.48 12.64 8.94 9.38 13.25 6.741994 9.77 11.69 8.42 10.24 11.98 9.05 9.95 13.62 7.431995 9.85 12.25 8.13 10.36 12.60 8.76 9.50 13.89 6.611996 9.70 12.07 7.96 10.27 12.46 8.63 8.80 12.02 6.841997 9.53 10.85 8.64 10.11 11.11 9.49 7.86 10.82 6.051998 9.28 10.84 8.14 9.86 11.27 8.83 9.37 12.10 7.451999 8.80 10.02 7.97 9.33 10.24 8.78 8.14 10.95 6.052000 8.78 10.42 7.58 9.27 10.84 8.13 9.44 11.54 7.932001 8.35 9.81 7.34 8.88 10.28 7.93 8.51 10.79 6.882002 8.28 9.38 7.53 8.96 9.84 8.38 7.20 9.79 5.702003 8.21 9.09 7.60 8.71 9.34 8.33 7.92 9.49 6.802004 8.08 8.96 7.45 8.47 9.19 7.95 8.55 9.95 7.702005 7.56 8.66 6.80 8.18 9.20 7.47 6.50 7.53 5.842006 7.64 8.45 7.07 8.19 8.73 7.84 6.79 8.32 5.762007 7.59 8.49 6.95 8.22 8.83 7.83 7.09 9.38 5.432008 6.95 7.75 6.38 7.40 7.86 7.08 6.18 8.47 4.801975-2008 9.20 11.81 7.25 9.66 12.21 7.77 8.80 12.44 6.25
Table 15.7Small Cell Cancer of the Lung and Bronchus (Invasive)
Age-adjusted SEER Incidencea Rates by Year, Race and Sex
SEE
R C
ancer Statistics Review
1975-2008N
ational Cancer Institute
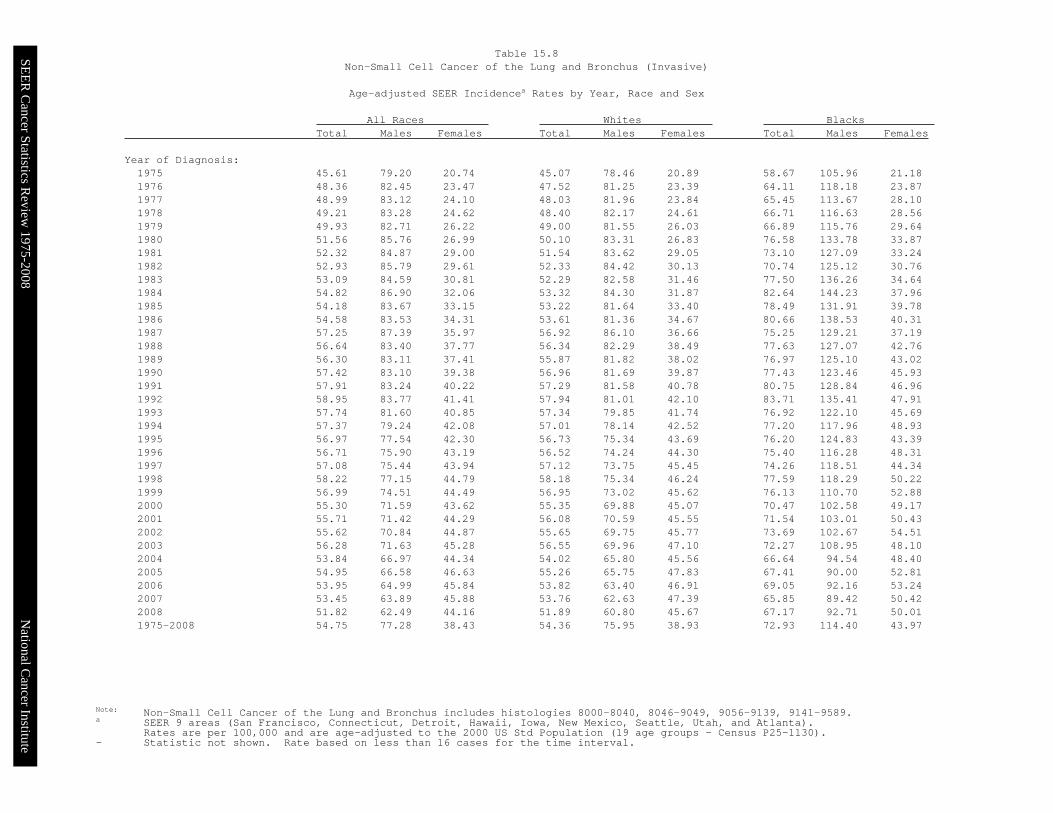
Note: Non-Small Cell Cancer of the Lung and Bronchus includes histologies 8000-8040, 8046-9049, 9056-9139, 9141-9589.a SEER 9 areas (San Francisco, Connecticut, Detroit, Hawaii, Iowa, New Mexico, Seattle, Utah, and Atlanta).
Rates are per 100,000 and are age-adjusted to the 2000 US Std Population (19 age groups - Census P25-1130).- Statistic not shown. Rate based on less than 16 cases for the time interval.
All Races Whites Blacks Total Males Females Total Males Females Total Males Females
Year of Diagnosis:1975 45.61 79.20 20.74 45.07 78.46 20.89 58.67 105.96 21.181976 48.36 82.45 23.47 47.52 81.25 23.39 64.11 118.18 23.871977 48.99 83.12 24.10 48.03 81.96 23.84 65.45 113.67 28.101978 49.21 83.28 24.62 48.40 82.17 24.61 66.71 116.63 28.561979 49.93 82.71 26.22 49.00 81.55 26.03 66.89 115.76 29.641980 51.56 85.76 26.99 50.10 83.31 26.83 76.58 133.78 33.871981 52.32 84.87 29.00 51.54 83.62 29.05 73.10 127.09 33.241982 52.93 85.79 29.61 52.33 84.42 30.13 70.74 125.12 30.761983 53.09 84.59 30.81 52.29 82.58 31.46 77.50 136.26 34.641984 54.82 86.90 32.06 53.32 84.30 31.87 82.64 144.23 37.961985 54.18 83.67 33.15 53.22 81.64 33.40 78.49 131.91 39.781986 54.58 83.53 34.31 53.61 81.36 34.67 80.66 138.53 40.311987 57.25 87.39 35.97 56.92 86.10 36.66 75.25 129.21 37.191988 56.64 83.40 37.77 56.34 82.29 38.49 77.63 127.07 42.761989 56.30 83.11 37.41 55.87 81.82 38.02 76.97 125.10 43.021990 57.42 83.10 39.38 56.96 81.69 39.87 77.43 123.46 45.931991 57.91 83.24 40.22 57.29 81.58 40.78 80.75 128.84 46.961992 58.95 83.77 41.41 57.94 81.01 42.10 83.71 135.41 47.911993 57.74 81.60 40.85 57.34 79.85 41.74 76.92 122.10 45.691994 57.37 79.24 42.08 57.01 78.14 42.52 77.20 117.96 48.931995 56.97 77.54 42.30 56.73 75.34 43.69 76.20 124.83 43.391996 56.71 75.90 43.19 56.52 74.24 44.30 75.40 116.28 48.311997 57.08 75.44 43.94 57.12 73.75 45.45 74.26 118.51 44.341998 58.22 77.15 44.79 58.18 75.34 46.24 77.59 118.29 50.221999 56.99 74.51 44.49 56.95 73.02 45.62 76.13 110.70 52.882000 55.30 71.59 43.62 55.35 69.88 45.07 70.47 102.58 49.172001 55.71 71.42 44.29 56.08 70.59 45.55 71.54 103.01 50.432002 55.62 70.84 44.87 55.65 69.75 45.77 73.69 102.67 54.512003 56.28 71.63 45.28 56.55 69.96 47.10 72.27 108.95 48.102004 53.84 66.97 44.34 54.02 65.80 45.56 66.64 94.54 48.402005 54.95 66.58 46.63 55.26 65.75 47.83 67.41 90.00 52.812006 53.95 64.99 45.84 53.82 63.40 46.91 69.05 92.16 53.242007 53.45 63.89 45.88 53.76 62.63 47.39 65.85 89.42 50.422008 51.82 62.49 44.16 51.89 60.80 45.67 67.17 92.71 50.011975-2008 54.75 77.28 38.43 54.36 75.95 38.93 72.93 114.40 43.97
Table 15.8Non-Small Cell Cancer of the Lung and Bronchus (Invasive)
Age-adjusted SEER Incidencea Rates by Year, Race and Sex
SEE
R C
ancer Statistics Review
1975-2008N
ational Cancer Institute
a US Mortality Files, National Center for Health Statistics, Centers for Disease Control and Prevention.Rates are per 100,000 and are age-adjusted to the 2000 US Std Population (19 age groups - Census P25-1130).
- Statistic not shown. Rate based on less than 16 cases for the time interval.
All Races Whites Blacks Total Males Females Total Males Females Total Males Females
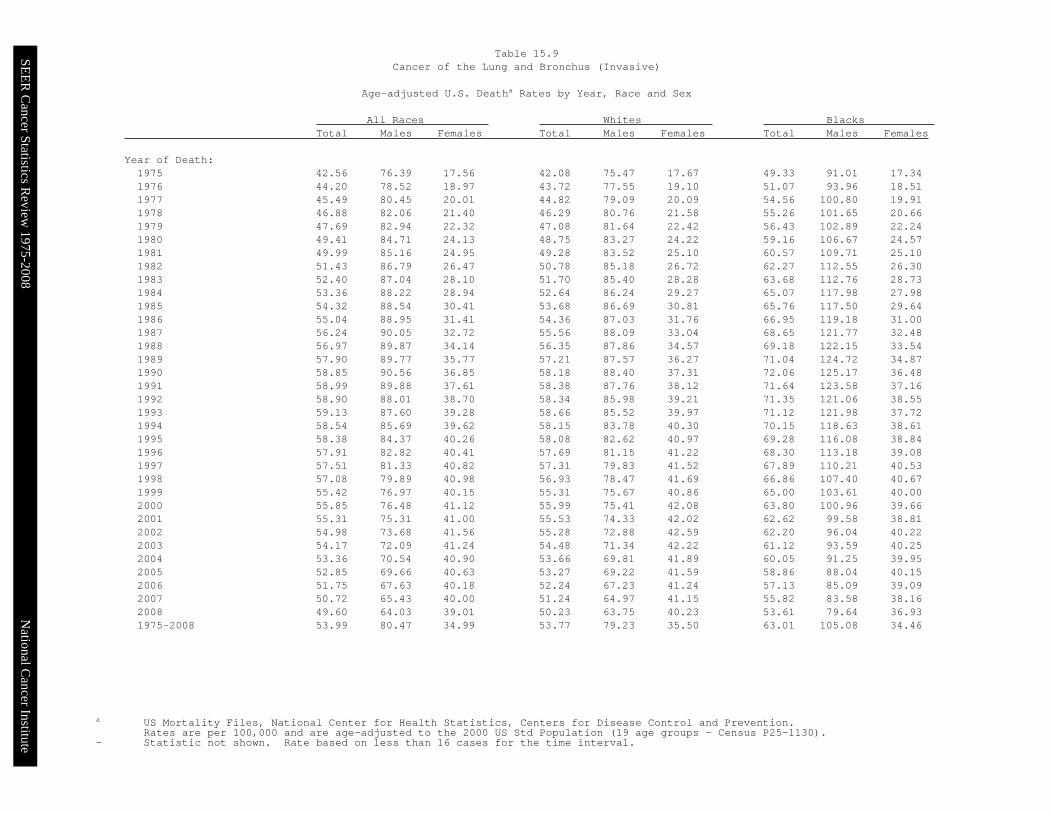
Year of Death:1975 42.56 76.39 17.56 42.08 75.47 17.67 49.33 91.01 17.341976 44.20 78.52 18.97 43.72 77.55 19.10 51.07 93.96 18.511977 45.49 80.45 20.01 44.82 79.09 20.09 54.56 100.80 19.911978 46.88 82.06 21.40 46.29 80.76 21.58 55.26 101.65 20.661979 47.69 82.94 22.32 47.08 81.64 22.42 56.43 102.89 22.241980 49.41 84.71 24.13 48.75 83.27 24.22 59.16 106.67 24.571981 49.99 85.16 24.95 49.28 83.52 25.10 60.57 109.71 25.101982 51.43 86.79 26.47 50.78 85.18 26.72 62.27 112.55 26.301983 52.40 87.04 28.10 51.70 85.40 28.28 63.68 112.76 28.731984 53.36 88.22 28.94 52.64 86.24 29.27 65.07 117.98 27.981985 54.32 88.54 30.41 53.68 86.69 30.81 65.76 117.50 29.641986 55.04 88.95 31.41 54.36 87.03 31.76 66.95 119.18 31.001987 56.24 90.05 32.72 55.56 88.09 33.04 68.65 121.77 32.481988 56.97 89.87 34.14 56.35 87.86 34.57 69.18 122.15 33.541989 57.90 89.77 35.77 57.21 87.57 36.27 71.04 124.72 34.871990 58.85 90.56 36.85 58.18 88.40 37.31 72.06 125.17 36.481991 58.99 89.88 37.61 58.38 87.76 38.12 71.64 123.58 37.161992 58.90 88.01 38.70 58.34 85.98 39.21 71.35 121.06 38.551993 59.13 87.60 39.28 58.66 85.52 39.97 71.12 121.98 37.721994 58.54 85.69 39.62 58.15 83.78 40.30 70.15 118.63 38.611995 58.38 84.37 40.26 58.08 82.62 40.97 69.28 116.08 38.841996 57.91 82.82 40.41 57.69 81.15 41.22 68.30 113.18 39.081997 57.51 81.33 40.82 57.31 79.83 41.52 67.89 110.21 40.531998 57.08 79.89 40.98 56.93 78.47 41.69 66.86 107.40 40.671999 55.42 76.97 40.15 55.31 75.67 40.86 65.00 103.61 40.002000 55.85 76.48 41.12 55.99 75.41 42.08 63.80 100.96 39.662001 55.31 75.31 41.00 55.53 74.33 42.02 62.62 99.58 38.812002 54.98 73.68 41.56 55.28 72.88 42.59 62.20 96.04 40.222003 54.17 72.09 41.24 54.48 71.34 42.22 61.12 93.59 40.252004 53.36 70.54 40.90 53.66 69.81 41.89 60.05 91.25 39.952005 52.85 69.66 40.63 53.27 69.22 41.59 58.86 88.04 40.152006 51.75 67.63 40.18 52.24 67.23 41.24 57.13 85.09 39.092007 50.72 65.43 40.00 51.24 64.97 41.15 55.82 83.58 38.162008 49.60 64.03 39.01 50.23 63.75 40.23 53.61 79.64 36.931975-2008 53.99 80.47 34.99 53.77 79.23 35.50 63.01 105.08 34.46
Table 15.9Cancer of the Lung and Bronchus (Invasive)
Age-adjusted U.S. Deatha Rates by Year, Race and Sex
SEE
R C
ancer Statistics Review
1975-2008N
ational Cancer Institute
a SEER 17 areas. Rates are per 100,000 and are age-adjusted to the 2000 US Std Population (19 age groups - Census P25-1130),unless noted.
b US Mortality Files, National Center for Health Statistics, Centers for Disease Control and Prevention.Rates are per 100,000 and are age-adjusted to the 2000 US Std Population (19 age groups - Census P25-1130), unless noted.
c Rates are per 100,000 and are age-adjusted to the IARC world standard population.- Statistic not shown. Rate based on less than 16 cases for the time interval.
All Races Whites Blacks Total Males Females Total Males Females Total Males Females
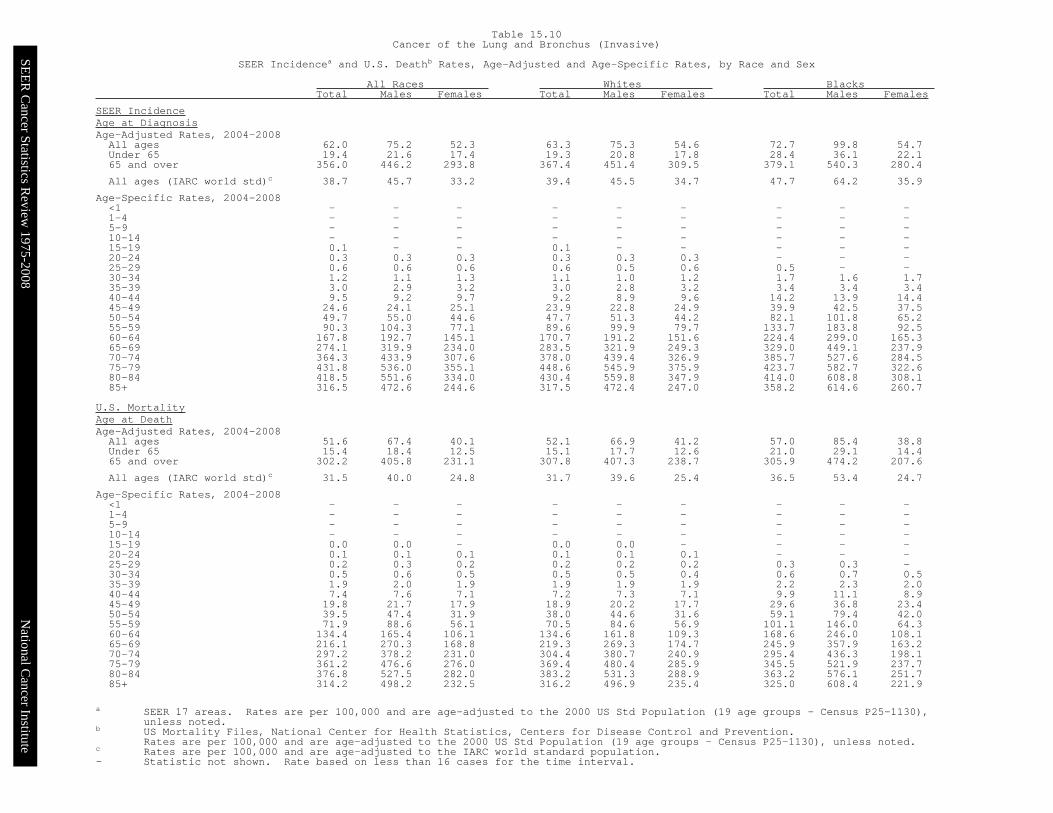
SEER IncidenceAge at DiagnosisAge-Adjusted Rates, 2004-2008All ages 62.0 75.2 52.3 63.3 75.3 54.6 72.7 99.8 54.7Under 65 19.4 21.6 17.4 19.3 20.8 17.8 28.4 36.1 22.165 and over 356.0 446.2 293.8 367.4 451.4 309.5 379.1 540.3 280.4
All ages (IARC world std)c 38.7 45.7 33.2 39.4 45.5 34.7 47.7 64.2 35.9
Age-Specific Rates, 2004-2008<1 - - - - - - - - -1-4 - - - - - - - - -5-9 - - - - - - - - -10-14 - - - - - - - - -15-19 0.1 - - 0.1 - - - - -20-24 0.3 0.3 0.3 0.3 0.3 0.3 - - -25-29 0.6 0.6 0.6 0.6 0.5 0.6 0.5 - -30-34 1.2 1.1 1.3 1.1 1.0 1.2 1.7 1.6 1.735-39 3.0 2.9 3.2 3.0 2.8 3.2 3.4 3.4 3.440-44 9.5 9.2 9.7 9.2 8.9 9.6 14.2 13.9 14.445-49 24.6 24.1 25.1 23.9 22.8 24.9 39.9 42.5 37.550-54 49.7 55.0 44.6 47.7 51.3 44.2 82.1 101.8 65.255-59 90.3 104.3 77.1 89.6 99.9 79.7 133.7 183.8 92.560-64 167.8 192.7 145.1 170.7 191.2 151.6 224.4 299.0 165.365-69 274.1 319.9 234.0 283.5 321.9 249.3 329.0 449.1 237.970-74 364.3 433.9 307.6 378.0 439.4 326.9 385.7 527.6 284.575-79 431.8 536.0 355.1 448.6 545.9 375.9 423.7 582.7 322.680-84 418.5 551.6 334.0 430.4 559.8 347.9 414.0 608.8 308.185+ 316.5 472.6 244.6 317.5 472.4 247.0 358.2 614.6 260.7
U.S. MortalityAge at DeathAge-Adjusted Rates, 2004-2008All ages 51.6 67.4 40.1 52.1 66.9 41.2 57.0 85.4 38.8Under 65 15.4 18.4 12.5 15.1 17.7 12.6 21.0 29.1 14.465 and over 302.2 405.8 231.1 307.8 407.3 238.7 305.9 474.2 207.6
All ages (IARC world std)c 31.5 40.0 24.8 31.7 39.6 25.4 36.5 53.4 24.7
Age-Specific Rates, 2004-2008<1 - - - - - - - - -1-4 - - - - - - - - -5-9 - - - - - - - - -10-14 - - - - - - - - -15-19 0.0 0.0 - 0.0 0.0 - - - -20-24 0.1 0.1 0.1 0.1 0.1 0.1 - - -25-29 0.2 0.3 0.2 0.2 0.2 0.2 0.3 0.3 -30-34 0.5 0.6 0.5 0.5 0.5 0.4 0.6 0.7 0.535-39 1.9 2.0 1.9 1.9 1.9 1.9 2.2 2.3 2.040-44 7.4 7.6 7.1 7.2 7.3 7.1 9.9 11.1 8.945-49 19.8 21.7 17.9 18.9 20.2 17.7 29.6 36.8 23.450-54 39.5 47.4 31.9 38.0 44.6 31.6 59.1 79.4 42.055-59 71.9 88.6 56.1 70.5 84.6 56.9 101.1 146.0 64.360-64 134.4 165.4 106.1 134.6 161.8 109.3 168.6 246.0 108.165-69 216.1 270.3 168.8 219.3 269.3 174.7 245.9 357.9 163.270-74 297.2 378.2 231.0 304.4 380.7 240.9 295.4 436.3 198.175-79 361.2 476.6 276.0 369.4 480.4 285.9 345.5 521.9 237.780-84 376.8 527.5 282.0 383.2 531.3 288.9 363.2 576.1 251.785+ 314.2 498.2 232.5 316.2 496.9 235.4 325.0 608.4 221.9
Table 15.10Cancer of the Lung and Bronchus (Invasive)
SEER Incidencea and U.S. Deathb Rates, Age-Adjusted and Age-Specific Rates, by Race and Sex
SEE
R C
ancer Statistics Review
1975-2008N
ational Cancer Institute
a Small Cell Cancer of the Lung and Bronchus includes histologies 8041-8045.b Non-Small Cell Cancer of the Lung and Bronchus includes histologies 8000-8040, 8046-9049, 9056-9139, 9141-9589.c SEER 17 areas. Rates are per 100,000 and are age-adjusted to the 2000 US Std Population (19 age groups - Census P25-1130),
unless noted.d Rates are per 100,000 and are age-adjusted to the IARC world standard population.- Statistic not shown. Rate based on less than 16 cases for the time interval.
All Races Whites Blacks Total Males Females Total Males Females Total Males Females
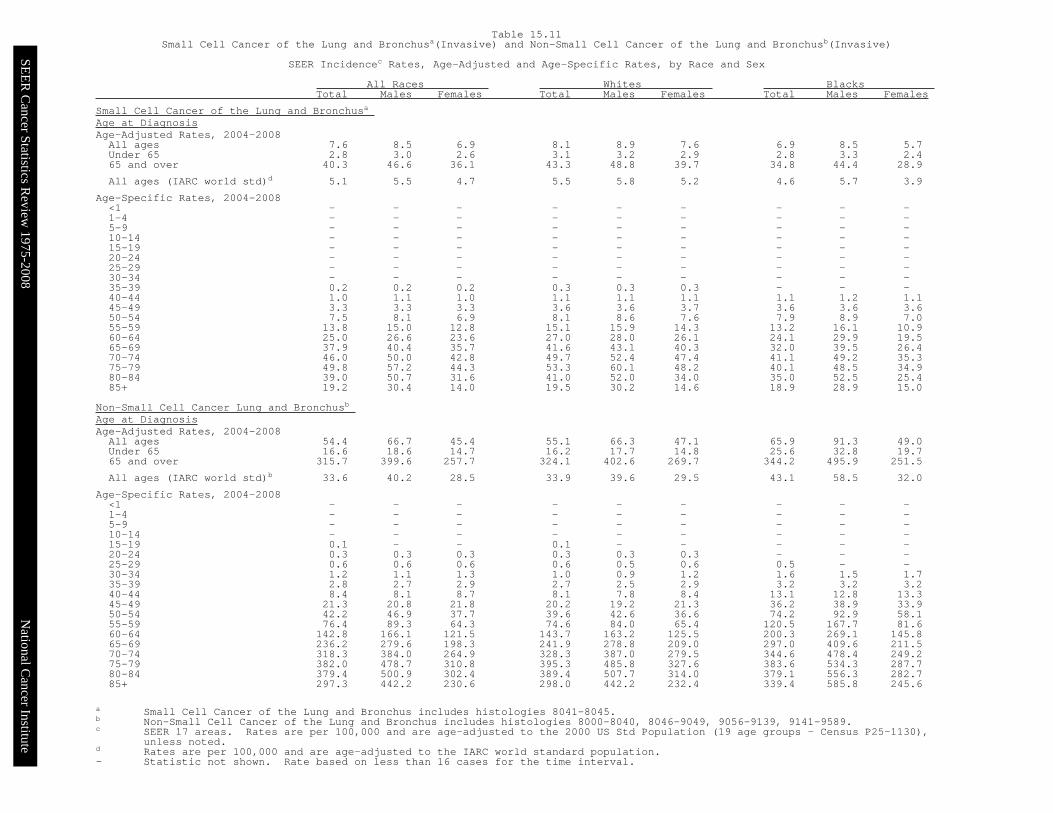
Small Cell Cancer of the Lung and Bronchusa Age at DiagnosisAge-Adjusted Rates, 2004-2008All ages 7.6 8.5 6.9 8.1 8.9 7.6 6.9 8.5 5.7Under 65 2.8 3.0 2.6 3.1 3.2 2.9 2.8 3.3 2.465 and over 40.3 46.6 36.1 43.3 48.8 39.7 34.8 44.4 28.9
All ages (IARC world std)d 5.1 5.5 4.7 5.5 5.8 5.2 4.6 5.7 3.9
Age-Specific Rates, 2004-2008<1 - - - - - - - - -1-4 - - - - - - - - -5-9 - - - - - - - - -10-14 - - - - - - - - -15-19 - - - - - - - - -20-24 - - - - - - - - -25-29 - - - - - - - - -30-34 - - - - - - - - -35-39 0.2 0.2 0.2 0.3 0.3 0.3 - - -40-44 1.0 1.1 1.0 1.1 1.1 1.1 1.1 1.2 1.145-49 3.3 3.3 3.3 3.6 3.6 3.7 3.6 3.6 3.650-54 7.5 8.1 6.9 8.1 8.6 7.6 7.9 8.9 7.055-59 13.8 15.0 12.8 15.1 15.9 14.3 13.2 16.1 10.960-64 25.0 26.6 23.6 27.0 28.0 26.1 24.1 29.9 19.565-69 37.9 40.4 35.7 41.6 43.1 40.3 32.0 39.5 26.470-74 46.0 50.0 42.8 49.7 52.4 47.4 41.1 49.2 35.375-79 49.8 57.2 44.3 53.3 60.1 48.2 40.1 48.5 34.980-84 39.0 50.7 31.6 41.0 52.0 34.0 35.0 52.5 25.485+ 19.2 30.4 14.0 19.5 30.2 14.6 18.9 28.9 15.0
Non-Small Cell Cancer Lung and Bronchusb Age at DiagnosisAge-Adjusted Rates, 2004-2008All ages 54.4 66.7 45.4 55.1 66.3 47.1 65.9 91.3 49.0Under 65 16.6 18.6 14.7 16.2 17.7 14.8 25.6 32.8 19.765 and over 315.7 399.6 257.7 324.1 402.6 269.7 344.2 495.9 251.5
All ages (IARC world std)b 33.6 40.2 28.5 33.9 39.6 29.5 43.1 58.5 32.0
Age-Specific Rates, 2004-2008<1 - - - - - - - - -1-4 - - - - - - - - -5-9 - - - - - - - - -10-14 - - - - - - - - -15-19 0.1 - - 0.1 - - - - -20-24 0.3 0.3 0.3 0.3 0.3 0.3 - - -25-29 0.6 0.6 0.6 0.6 0.5 0.6 0.5 - -30-34 1.2 1.1 1.3 1.0 0.9 1.2 1.6 1.5 1.735-39 2.8 2.7 2.9 2.7 2.5 2.9 3.2 3.2 3.240-44 8.4 8.1 8.7 8.1 7.8 8.4 13.1 12.8 13.345-49 21.3 20.8 21.8 20.2 19.2 21.3 36.2 38.9 33.950-54 42.2 46.9 37.7 39.6 42.6 36.6 74.2 92.9 58.155-59 76.4 89.3 64.3 74.6 84.0 65.4 120.5 167.7 81.660-64 142.8 166.1 121.5 143.7 163.2 125.5 200.3 269.1 145.865-69 236.2 279.6 198.3 241.9 278.8 209.0 297.0 409.6 211.570-74 318.3 384.0 264.9 328.3 387.0 279.5 344.6 478.4 249.275-79 382.0 478.7 310.8 395.3 485.8 327.6 383.6 534.3 287.780-84 379.4 500.9 302.4 389.4 507.7 314.0 379.1 556.3 282.785+ 297.3 442.2 230.6 298.0 442.2 232.4 339.4 585.8 245.6
Table 15.11Small Cell Cancer of the Lung and Bronchusa(Invasive) and Non-Small Cell Cancer of the Lung and Bronchusb(Invasive)
SEER Incidencec Rates, Age-Adjusted and Age-Specific Rates, by Race and Sex
SEE
R C
ancer Statistics Review
1975-2008N
ational Cancer Institute
a Based on End Results data from a series of hospital registries and one population-based registry.b SEER 9 areas (San Francisco, Connecticut, Detroit, Hawaii, Iowa, New Mexico, Seattle, Utah, Atlanta).
Based on follow-up of patients into 2008.c SEER 17 areas (San Francisco, Connecticut, Detroit, Hawaii, Iowa, New Mexico, Seattle, Utah, Atlanta, San Jose-Monterey,
Los Angeles, Alaska Native Registry, Rural Georgia, California excluding SF/SJM/LA, Kentucky, Louisiana and New Jersey).Based on follow-up of patients into 2008.
d Period survival provides a 2007 estimate of survival by piecing together the most recent conditional survival estimatesfrom several cohorts. It is computed here using three year calendar blocks (2005-2007: 0-1 year survival),(2004-2006: 1-2 year survival), (2003-2005: 2-3 year survival), (2002-2004: 3-4 year survival), (2001-2003: 4-5 years survival).
e The difference between 1975-1977 and 2001-2007 is statistically significant (p<.05).f The standard error is between 5 and 10 percentage points.g The standard error is greater than 10 percentage points.- Statistic could not be calculated due to fewer than 25 cases during the time period.
All Races Whites Blacks Total Males Females Total Males Females Total Males Females
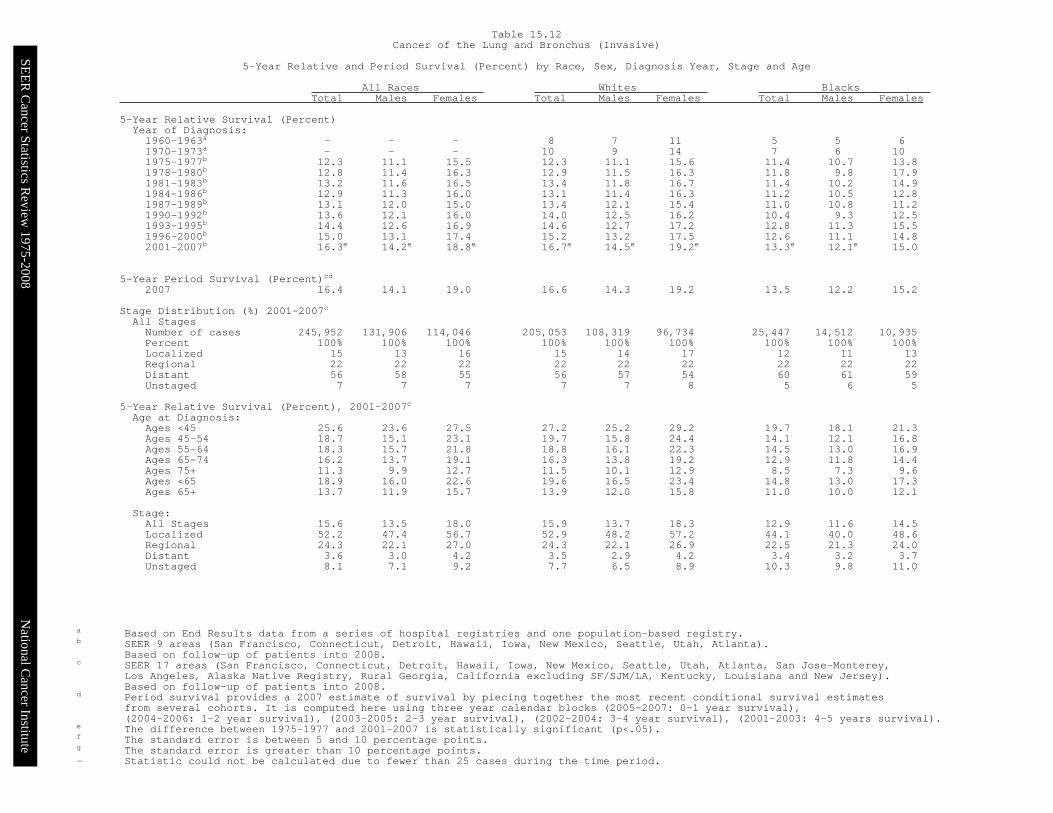
5-Year Relative Survival (Percent)Year of Diagnosis:1960-1963a - - - 8 7 11 5 5 61970-1973a - - - 10 9 14 7 6 101975-1977b 12.3 11.1 15.5 12.3 11.1 15.6 11.4 10.7 13.81978-1980b 12.8 11.4 16.3 12.9 11.5 16.3 11.8 9.8 17.91981-1983b 13.2 11.6 16.5 13.4 11.8 16.7 11.4 10.2 14.91984-1986b 12.9 11.3 16.0 13.1 11.4 16.3 11.2 10.5 12.81987-1989b 13.1 12.0 15.0 13.4 12.1 15.4 11.0 10.8 11.21990-1992b 13.6 12.1 16.0 14.0 12.5 16.2 10.4 9.3 12.51993-1995b 14.4 12.6 16.9 14.6 12.7 17.2 12.8 11.3 15.51996-2000b 15.0 13.1 17.4 15.2 13.2 17.5 12.6 11.1 14.82001-2007b 16.3e 14.2e 18.8e 16.7e 14.5e 19.2e 13.3e 12.1e 15.0
5-Year Period Survival (Percent)cd
2007 16.4 14.1 19.0 16.6 14.3 19.2 13.5 12.2 15.2
Stage Distribution (%) 2001-2007c
All StagesNumber of cases 245,952 131,906 114,046 205,053 108,319 96,734 25,447 14,512 10,935Percent 100% 100% 100% 100% 100% 100% 100% 100% 100%Localized 15 13 16 15 14 17 12 11 13Regional 22 22 22 22 22 22 22 22 22Distant 56 58 55 56 57 54 60 61 59Unstaged 7 7 7 7 7 8 5 6 5
5-Year Relative Survival (Percent), 2001-2007c
Age at Diagnosis:Ages <45 25.6 23.6 27.5 27.2 25.2 29.2 19.7 18.1 21.3Ages 45-54 18.7 15.1 23.1 19.7 15.8 24.4 14.1 12.1 16.8Ages 55-64 18.3 15.7 21.8 18.8 16.1 22.3 14.5 13.0 16.9Ages 65-74 16.2 13.7 19.1 16.3 13.8 19.2 12.9 11.8 14.4Ages 75+ 11.3 9.9 12.7 11.5 10.1 12.9 8.5 7.3 9.6Ages <65 18.9 16.0 22.6 19.6 16.5 23.4 14.8 13.0 17.3Ages 65+ 13.7 11.9 15.7 13.9 12.0 15.8 11.0 10.0 12.1
Stage:All Stages 15.6 13.5 18.0 15.9 13.7 18.3 12.9 11.6 14.5Localized 52.2 47.4 56.7 52.9 48.2 57.2 44.1 40.0 48.6Regional 24.3 22.1 27.0 24.3 22.1 26.9 22.5 21.3 24.0Distant 3.6 3.0 4.2 3.5 2.9 4.2 3.4 3.2 3.7Unstaged 8.1 7.1 9.2 7.7 6.5 8.9 10.3 9.8 11.0
Table 15.12Cancer of the Lung and Bronchus (Invasive)
5-Year Relative and Period Survival (Percent) by Race, Sex, Diagnosis Year, Stage and Age
SEE
R C
ancer Statistics Review
1975-2008N
ational Cancer Institute
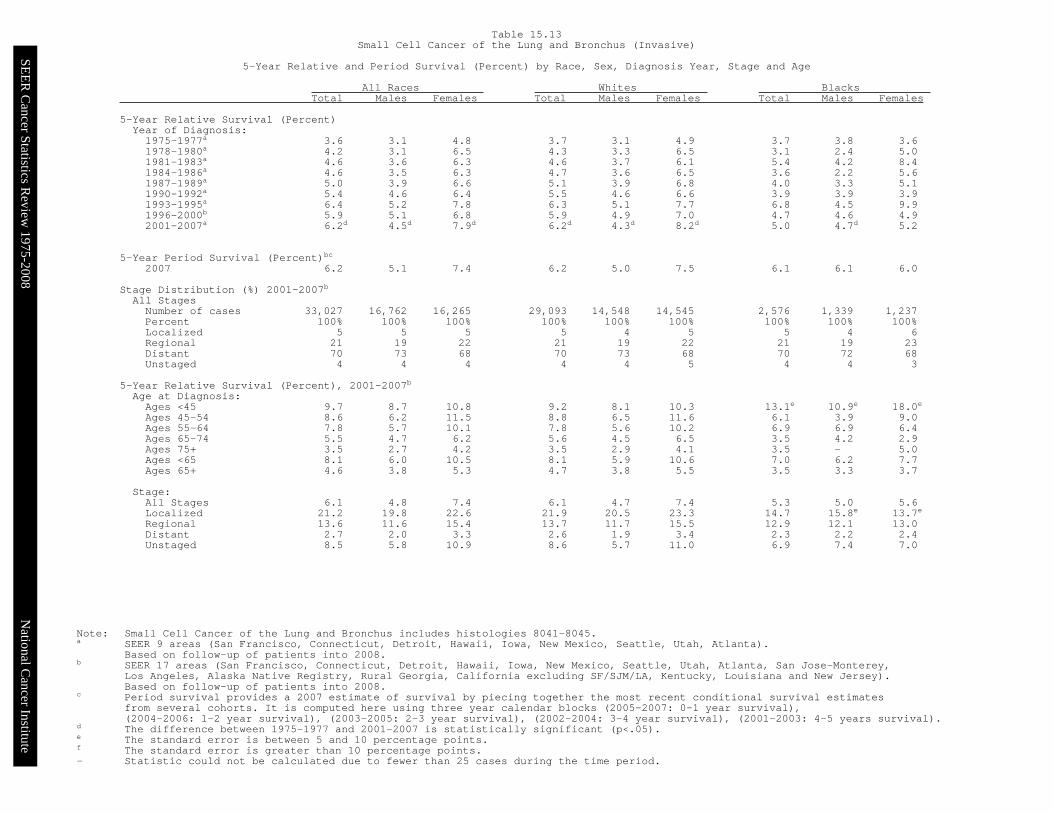
Note: Small Cell Cancer of the Lung and Bronchus includes histologies 8041-8045.a SEER 9 areas (San Francisco, Connecticut, Detroit, Hawaii, Iowa, New Mexico, Seattle, Utah, Atlanta).
Based on follow-up of patients into 2008.b SEER 17 areas (San Francisco, Connecticut, Detroit, Hawaii, Iowa, New Mexico, Seattle, Utah, Atlanta, San Jose-Monterey,
Los Angeles, Alaska Native Registry, Rural Georgia, California excluding SF/SJM/LA, Kentucky, Louisiana and New Jersey).Based on follow-up of patients into 2008.
c Period survival provides a 2007 estimate of survival by piecing together the most recent conditional survival estimatesfrom several cohorts. It is computed here using three year calendar blocks (2005-2007: 0-1 year survival),(2004-2006: 1-2 year survival), (2003-2005: 2-3 year survival), (2002-2004: 3-4 year survival), (2001-2003: 4-5 years survival).
d The difference between 1975-1977 and 2001-2007 is statistically significant (p<.05).e The standard error is between 5 and 10 percentage points.f The standard error is greater than 10 percentage points.- Statistic could not be calculated due to fewer than 25 cases during the time period.
All Races Whites Blacks Total Males Females Total Males Females Total Males Females
5-Year Relative Survival (Percent)Year of Diagnosis:1975-1977a 3.6 3.1 4.8 3.7 3.1 4.9 3.7 3.8 3.61978-1980a 4.2 3.1 6.5 4.3 3.3 6.5 3.1 2.4 5.01981-1983a 4.6 3.6 6.3 4.6 3.7 6.1 5.4 4.2 8.41984-1986a 4.6 3.5 6.3 4.7 3.6 6.5 3.6 2.2 5.61987-1989a 5.0 3.9 6.6 5.1 3.9 6.8 4.0 3.3 5.11990-1992a 5.4 4.6 6.4 5.5 4.6 6.6 3.9 3.9 3.91993-1995a 6.4 5.2 7.8 6.3 5.1 7.7 6.8 4.5 9.91996-2000b 5.9 5.1 6.8 5.9 4.9 7.0 4.7 4.6 4.92001-2007a 6.2d 4.5d 7.9d 6.2d 4.3d 8.2d 5.0 4.7d 5.2
5-Year Period Survival (Percent)bc
2007 6.2 5.1 7.4 6.2 5.0 7.5 6.1 6.1 6.0
Stage Distribution (%) 2001-2007b
All StagesNumber of cases 33,027 16,762 16,265 29,093 14,548 14,545 2,576 1,339 1,237Percent 100% 100% 100% 100% 100% 100% 100% 100% 100%Localized 5 5 5 5 4 5 5 4 6Regional 21 19 22 21 19 22 21 19 23Distant 70 73 68 70 73 68 70 72 68Unstaged 4 4 4 4 4 5 4 4 3
5-Year Relative Survival (Percent), 2001-2007b
Age at Diagnosis:Ages <45 9.7 8.7 10.8 9.2 8.1 10.3 13.1e 10.9e 18.0e
Ages 45-54 8.6 6.2 11.5 8.8 6.5 11.6 6.1 3.9 9.0Ages 55-64 7.8 5.7 10.1 7.8 5.6 10.2 6.9 6.9 6.4Ages 65-74 5.5 4.7 6.2 5.6 4.5 6.5 3.5 4.2 2.9Ages 75+ 3.5 2.7 4.2 3.5 2.9 4.1 3.5 - 5.0Ages <65 8.1 6.0 10.5 8.1 5.9 10.6 7.0 6.2 7.7Ages 65+ 4.6 3.8 5.3 4.7 3.8 5.5 3.5 3.3 3.7
Stage:All Stages 6.1 4.8 7.4 6.1 4.7 7.4 5.3 5.0 5.6Localized 21.2 19.8 22.6 21.9 20.5 23.3 14.7 15.8e 13.7e
Regional 13.6 11.6 15.4 13.7 11.7 15.5 12.9 12.1 13.0Distant 2.7 2.0 3.3 2.6 1.9 3.4 2.3 2.2 2.4Unstaged 8.5 5.8 10.9 8.6 5.7 11.0 6.9 7.4 7.0
Table 15.13Small Cell Cancer of the Lung and Bronchus (Invasive)
5-Year Relative and Period Survival (Percent) by Race, Sex, Diagnosis Year, Stage and Age
SEE
R C
ancer Statistics Review
1975-2008N
ational Cancer Institute
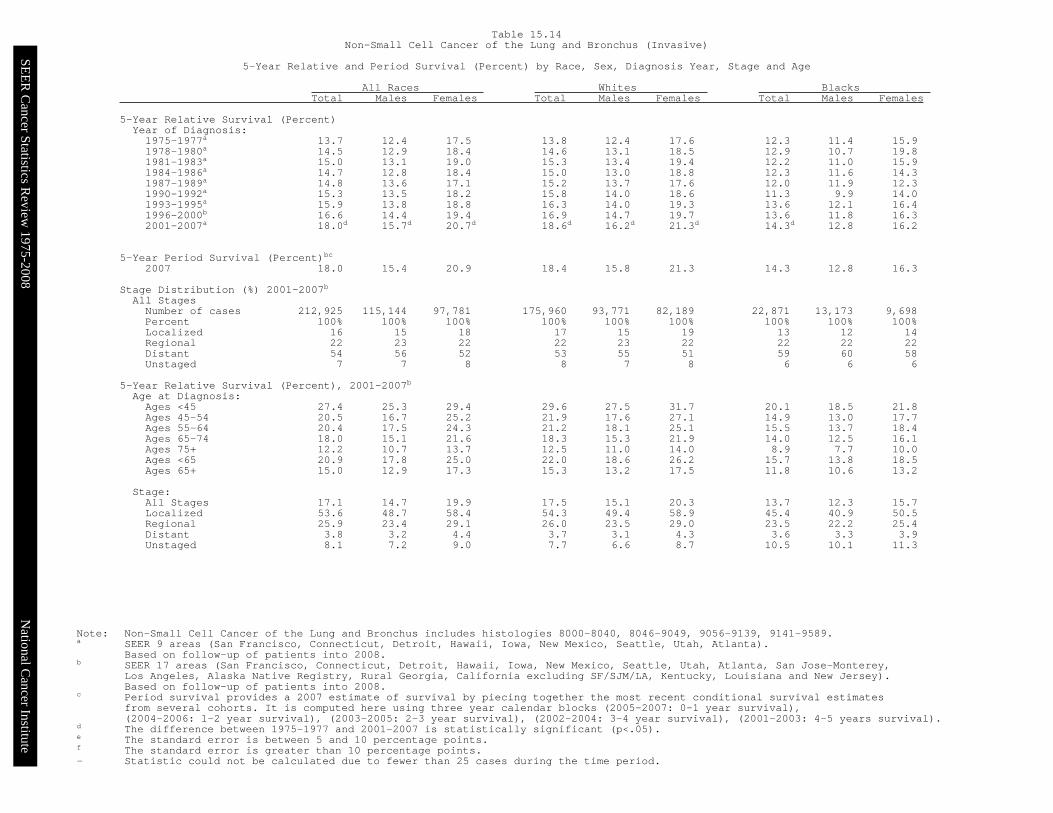
Note: Non-Small Cell Cancer of the Lung and Bronchus includes histologies 8000-8040, 8046-9049, 9056-9139, 9141-9589.a SEER 9 areas (San Francisco, Connecticut, Detroit, Hawaii, Iowa, New Mexico, Seattle, Utah, Atlanta).
Based on follow-up of patients into 2008.b SEER 17 areas (San Francisco, Connecticut, Detroit, Hawaii, Iowa, New Mexico, Seattle, Utah, Atlanta, San Jose-Monterey,
Los Angeles, Alaska Native Registry, Rural Georgia, California excluding SF/SJM/LA, Kentucky, Louisiana and New Jersey).Based on follow-up of patients into 2008.
c Period survival provides a 2007 estimate of survival by piecing together the most recent conditional survival estimatesfrom several cohorts. It is computed here using three year calendar blocks (2005-2007: 0-1 year survival),(2004-2006: 1-2 year survival), (2003-2005: 2-3 year survival), (2002-2004: 3-4 year survival), (2001-2003: 4-5 years survival).
d The difference between 1975-1977 and 2001-2007 is statistically significant (p<.05).e The standard error is between 5 and 10 percentage points.f The standard error is greater than 10 percentage points.- Statistic could not be calculated due to fewer than 25 cases during the time period.
All Races Whites Blacks Total Males Females Total Males Females Total Males Females
5-Year Relative Survival (Percent)Year of Diagnosis:1975-1977a 13.7 12.4 17.5 13.8 12.4 17.6 12.3 11.4 15.91978-1980a 14.5 12.9 18.4 14.6 13.1 18.5 12.9 10.7 19.81981-1983a 15.0 13.1 19.0 15.3 13.4 19.4 12.2 11.0 15.91984-1986a 14.7 12.8 18.4 15.0 13.0 18.8 12.3 11.6 14.31987-1989a 14.8 13.6 17.1 15.2 13.7 17.6 12.0 11.9 12.31990-1992a 15.3 13.5 18.2 15.8 14.0 18.6 11.3 9.9 14.01993-1995a 15.9 13.8 18.8 16.3 14.0 19.3 13.6 12.1 16.41996-2000b 16.6 14.4 19.4 16.9 14.7 19.7 13.6 11.8 16.32001-2007a 18.0d 15.7d 20.7d 18.6d 16.2d 21.3d 14.3d 12.8 16.2
5-Year Period Survival (Percent)bc
2007 18.0 15.4 20.9 18.4 15.8 21.3 14.3 12.8 16.3
Stage Distribution (%) 2001-2007b
All StagesNumber of cases 212,925 115,144 97,781 175,960 93,771 82,189 22,871 13,173 9,698Percent 100% 100% 100% 100% 100% 100% 100% 100% 100%Localized 16 15 18 17 15 19 13 12 14Regional 22 23 22 22 23 22 22 22 22Distant 54 56 52 53 55 51 59 60 58Unstaged 7 7 8 8 7 8 6 6 6
5-Year Relative Survival (Percent), 2001-2007b
Age at Diagnosis:Ages <45 27.4 25.3 29.4 29.6 27.5 31.7 20.1 18.5 21.8Ages 45-54 20.5 16.7 25.2 21.9 17.6 27.1 14.9 13.0 17.7Ages 55-64 20.4 17.5 24.3 21.2 18.1 25.1 15.5 13.7 18.4Ages 65-74 18.0 15.1 21.6 18.3 15.3 21.9 14.0 12.5 16.1Ages 75+ 12.2 10.7 13.7 12.5 11.0 14.0 8.9 7.7 10.0Ages <65 20.9 17.8 25.0 22.0 18.6 26.2 15.7 13.8 18.5Ages 65+ 15.0 12.9 17.3 15.3 13.2 17.5 11.8 10.6 13.2
Stage:All Stages 17.1 14.7 19.9 17.5 15.1 20.3 13.7 12.3 15.7Localized 53.6 48.7 58.4 54.3 49.4 58.9 45.4 40.9 50.5Regional 25.9 23.4 29.1 26.0 23.5 29.0 23.5 22.2 25.4Distant 3.8 3.2 4.4 3.7 3.1 4.3 3.6 3.3 3.9Unstaged 8.1 7.2 9.0 7.7 6.6 8.7 10.5 10.1 11.3
Table 15.14Non-Small Cell Cancer of the Lung and Bronchus (Invasive)
5-Year Relative and Period Survival (Percent) by Race, Sex, Diagnosis Year, Stage and Age

SEE
R C
ancer Statistics Review
1975-2008N
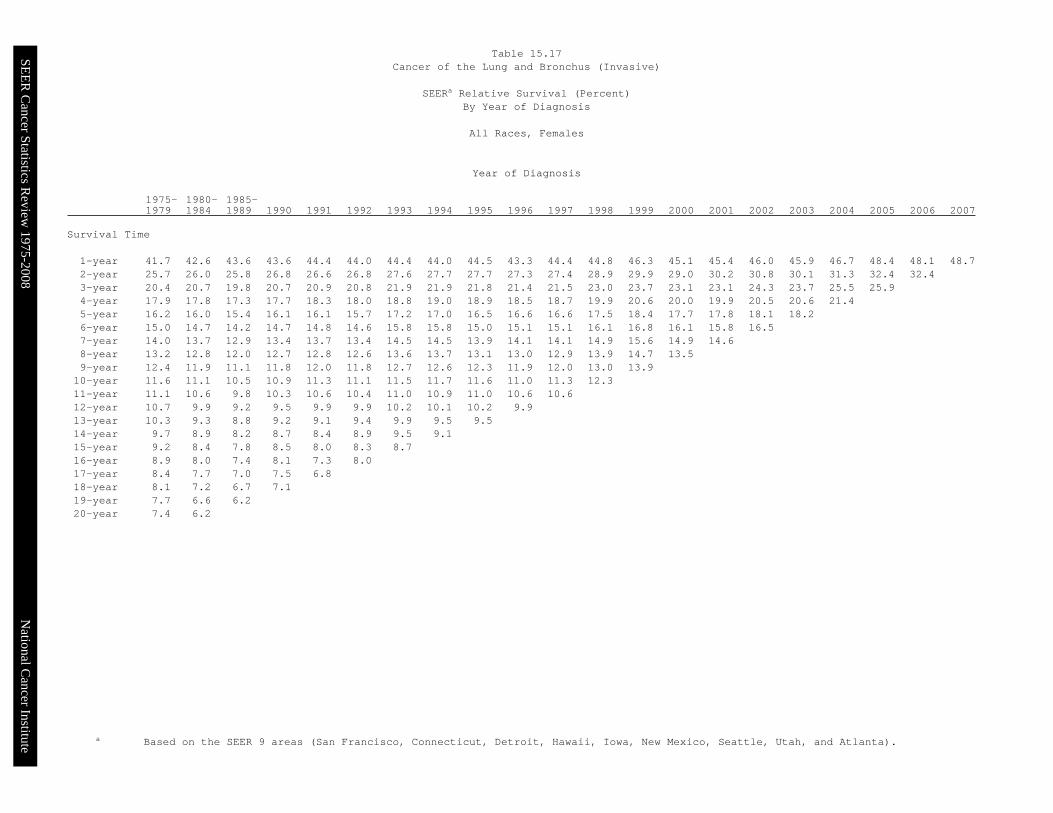
ational Cancer Institute a Based on the SEER 9 areas (San Francisco, Connecticut, Detroit, Hawaii, Iowa, New Mexico, Seattle, Utah, and Atlanta).
1975- 1980- 1985-1979 1984 1989 1990 1991 1992 1993 1994 1995 1996 1997 1998 1999 2000 2001 2002 2003 2004 2005 2006 2007
Survival Time
1-year 36.6 38.5 39.8 40.2 41.1 40.9 40.6 40.8 41.4 40.9 41.5 41.1 42.6 42.2 41.4 41.8 42.9 43.4 44.4 45.0 45.12-year 21.5 22.3 22.9 23.4 23.7 24.5 24.3 24.3 25.2 25.1 25.2 25.6 26.2 26.3 26.0 26.7 26.8 27.9 28.4 29.63-year 16.4 17.1 17.3 17.7 18.4 18.7 18.6 18.8 19.3 19.5 19.5 19.9 19.9 20.5 20.0 20.9 20.8 22.4 22.54-year 14.0 14.5 14.7 14.9 15.6 15.8 15.8 15.9 16.6 16.3 16.6 17.0 17.0 17.6 16.9 17.6 17.8 18.85-year 12.6 13.0 13.1 13.3 13.7 13.9 14.2 14.3 14.6 14.6 14.8 14.7 15.2 15.7 15.0 15.6 16.06-year 11.5 11.8 11.9 12.1 12.7 12.7 13.0 13.0 13.2 13.2 13.4 13.2 13.8 14.2 13.5 14.17-year 10.7 10.9 10.9 11.1 11.5 11.6 12.0 11.9 12.4 12.1 12.3 12.2 12.7 12.9 12.38-year 10.1 10.0 10.1 10.3 10.6 10.7 11.0 11.1 11.5 11.2 11.3 11.2 11.9 11.99-year 9.4 9.3 9.4 9.4 10.0 9.9 10.3 10.3 10.7 10.4 10.4 10.5 11.110-year 8.8 8.6 8.8 8.7 9.4 9.3 9.5 9.7 10.0 9.5 9.8 10.011-year 8.3 8.2 8.2 8.0 8.7 8.6 8.8 9.1 9.5 8.9 9.212-year 7.9 7.7 7.7 7.4 8.2 8.2 8.1 8.3 8.9 8.213-year 7.5 7.2 7.2 7.1 7.5 7.7 7.6 7.9 8.214-year 7.1 6.8 6.8 6.8 6.8 7.4 7.2 7.415-year 6.6 6.4 6.4 6.5 6.4 6.9 6.716-year 6.4 6.0 6.1 6.0 5.9 6.517-year 6.1 5.7 5.7 5.7 5.618-year 5.7 5.4 5.3 5.519-year 5.4 5.0 4.920-year 5.2 4.6
Table 15.15Cancer of the Lung and Bronchus (Invasive)
SEERa Relative Survival (Percent)By Year of Diagnosis
All Races, Males and Females
Year of Diagnosis

SEE
R C
ancer Statistics Review
1975-2008N
ational Cancer Institute a Based on the SEER 9 areas (San Francisco, Connecticut, Detroit, Hawaii, Iowa, New Mexico, Seattle, Utah, and Atlanta).
1975- 1980- 1985-1979 1984 1989 1990 1991 1992 1993 1994 1995 1996 1997 1998 1999 2000 2001 2002 2003 2004 2005 2006 2007
Survival Time
1-year 34.7 36.6 37.8 38.0 38.9 38.9 38.0 38.5 39.2 39.1 39.2 38.3 39.5 39.9 38.2 38.3 40.4 40.5 40.8 42.2 41.72-year 19.9 20.6 21.3 21.2 21.8 22.9 22.1 21.8 23.4 23.4 23.4 23.0 23.1 24.1 22.6 23.3 24.0 25.0 24.8 27.03-year 14.9 15.4 15.8 15.8 16.8 17.3 16.3 16.4 17.5 18.0 17.9 17.5 16.8 18.4 17.5 18.1 18.4 19.6 19.34-year 12.6 13.0 13.2 13.1 13.8 14.4 13.7 13.7 15.0 14.7 15.0 14.7 14.1 15.7 14.4 15.1 15.6 16.65-year 11.2 11.5 11.7 11.5 12.1 12.7 12.2 12.3 13.2 13.1 13.4 12.5 12.6 14.1 12.8 13.5 14.16-year 10.2 10.4 10.7 10.5 11.3 11.4 11.1 11.0 11.9 11.8 11.9 11.0 11.3 12.6 11.6 12.27-year 9.5 9.5 9.8 9.7 10.0 10.4 10.2 10.0 11.3 10.6 10.8 10.1 10.3 11.3 10.48-year 8.9 8.7 9.0 8.8 9.1 9.4 9.3 9.3 10.3 9.9 10.0 9.0 9.5 10.79-year 8.3 8.0 8.5 7.8 8.6 8.6 8.6 8.7 9.6 9.2 9.2 8.5 8.710-year 7.7 7.4 7.9 7.2 8.2 8.0 8.0 8.2 8.8 8.3 8.6 8.111-year 7.2 7.1 7.4 6.6 7.5 7.3 7.2 7.7 8.4 7.5 8.012-year 6.8 6.6 6.8 6.1 7.1 7.0 6.7 6.9 8.0 6.913-year 6.4 6.2 6.4 5.8 6.4 6.5 6.0 6.7 7.214-year 6.1 5.8 6.0 5.5 5.8 6.3 5.7 6.115-year 5.6 5.5 5.7 5.1 5.3 6.0 5.316-year 5.4 5.1 5.3 4.7 4.9 5.517-year 5.1 4.7 4.9 4.4 4.718-year 4.8 4.5 4.5 4.319-year 4.5 4.2 4.220-year 4.2 3.8
Table 15.16Cancer of the Lung and Bronchus (Invasive)
SEERa Relative Survival (Percent)By Year of Diagnosis
All Races, Males
Year of Diagnosis
SEE
R C
ancer Statistics Review
1975-2008N
ational Cancer Institute a Based on the SEER 9 areas (San Francisco, Connecticut, Detroit, Hawaii, Iowa, New Mexico, Seattle, Utah, and Atlanta).
1975- 1980- 1985-1979 1984 1989 1990 1991 1992 1993 1994 1995 1996 1997 1998 1999 2000 2001 2002 2003 2004 2005 2006 2007
Survival Time
1-year 41.7 42.6 43.6 43.6 44.4 44.0 44.4 44.0 44.5 43.3 44.4 44.8 46.3 45.1 45.4 46.0 45.9 46.7 48.4 48.1 48.72-year 25.7 26.0 25.8 26.8 26.6 26.8 27.6 27.7 27.7 27.3 27.4 28.9 29.9 29.0 30.2 30.8 30.1 31.3 32.4 32.43-year 20.4 20.7 19.8 20.7 20.9 20.8 21.9 21.9 21.8 21.4 21.5 23.0 23.7 23.1 23.1 24.3 23.7 25.5 25.94-year 17.9 17.8 17.3 17.7 18.3 18.0 18.8 19.0 18.9 18.5 18.7 19.9 20.6 20.0 19.9 20.5 20.6 21.45-year 16.2 16.0 15.4 16.1 16.1 15.7 17.2 17.0 16.5 16.6 16.6 17.5 18.4 17.7 17.8 18.1 18.26-year 15.0 14.7 14.2 14.7 14.8 14.6 15.8 15.8 15.0 15.1 15.1 16.1 16.8 16.1 15.8 16.57-year 14.0 13.7 12.9 13.4 13.7 13.4 14.5 14.5 13.9 14.1 14.1 14.9 15.6 14.9 14.68-year 13.2 12.8 12.0 12.7 12.8 12.6 13.6 13.7 13.1 13.0 12.9 13.9 14.7 13.59-year 12.4 11.9 11.1 11.8 12.0 11.8 12.7 12.6 12.3 11.9 12.0 13.0 13.910-year 11.6 11.1 10.5 10.9 11.3 11.1 11.5 11.7 11.6 11.0 11.3 12.311-year 11.1 10.6 9.8 10.3 10.6 10.4 11.0 10.9 11.0 10.6 10.612-year 10.7 9.9 9.2 9.5 9.9 9.9 10.2 10.1 10.2 9.913-year 10.3 9.3 8.8 9.2 9.1 9.4 9.9 9.5 9.514-year 9.7 8.9 8.2 8.7 8.4 8.9 9.5 9.115-year 9.2 8.4 7.8 8.5 8.0 8.3 8.716-year 8.9 8.0 7.4 8.1 7.3 8.017-year 8.4 7.7 7.0 7.5 6.818-year 8.1 7.2 6.7 7.119-year 7.7 6.6 6.220-year 7.4 6.2
Table 15.17Cancer of the Lung and Bronchus (Invasive)
SEERa Relative Survival (Percent)By Year of Diagnosis
All Races, Females
Year of Diagnosis

SEE
R C
ancer Statistics Review
1975-2008N
ational Cancer Institute
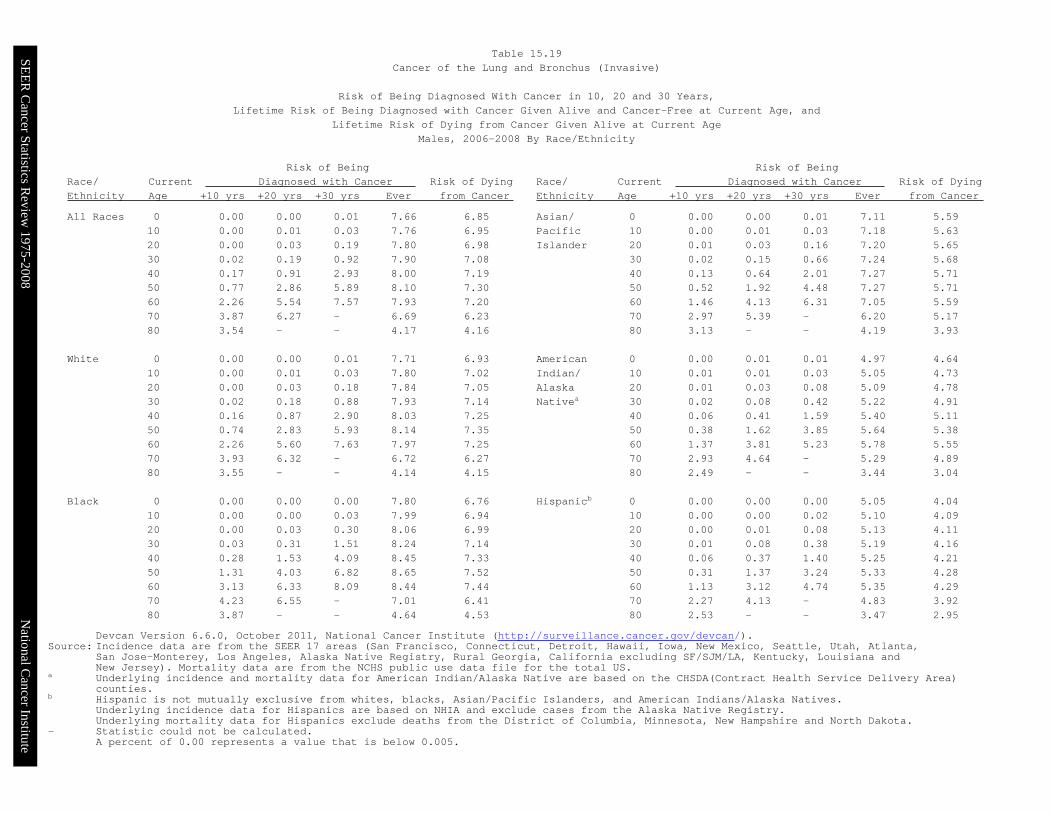
Devcan Version 6.6.0, October 2011, National Cancer Institute (http://surveillance.cancer.gov/devcan/).Source: Incidence data are from the SEER 17 areas (San Francisco, Connecticut, Detroit, Hawaii, Iowa, New Mexico, Seattle, Utah, Atlanta,
San Jose-Monterey, Los Angeles, Alaska Native Registry, Rural Georgia, California excluding SF/SJM/LA, Kentucky, Louisiana andNew Jersey). Mortality data are from the NCHS public use data file for the total US.
a Underlying incidence and mortality data for American Indian/Alaska Native are based on the CHSDA(Contract Health Service Delivery Area)counties.
b Hispanic is not mutually exclusive from whites, blacks, Asian/Pacific Islanders, and American Indians/Alaska Natives.Underlying incidence data for Hispanics are based on NHIA and exclude cases from the Alaska Native Registry.Underlying mortality data for Hispanics exclude deaths from the District of Columbia, Minnesota, New Hampshire and North Dakota.
- Statistic could not be calculated.A percent of 0.00 represents a value that is below 0.005.
Risk of Being Risk of Being
Race/ Current Diagnosed with Cancer Risk of Dying Race/ Current Diagnosed with Cancer Risk of Dying
Ethnicity Age +10 yrs +20 yrs +30 yrs Ever from Cancer Ethnicity Age +10 yrs +20 yrs +30 yrs Ever from Cancer
All Races 0 0.00 0.00 0.01 6.94 5.87 Asian/ 0 0.00 0.00 0.01 5.63 4.32
10 0.00 0.01 0.03 7.02 5.95 Pacific 10 0.00 0.01 0.03 5.68 4.36
20 0.00 0.03 0.20 7.05 5.98 Islander 20 0.01 0.03 0.14 5.69 4.37
30 0.02 0.19 0.85 7.11 6.03 30 0.02 0.14 0.55 5.71 4.38
40 0.17 0.83 2.64 7.17 6.10 40 0.11 0.53 1.59 5.72 4.40
50 0.68 2.54 5.23 7.19 6.14 50 0.42 1.50 3.43 5.69 4.38
60 1.98 4.84 6.59 6.93 5.96 60 1.11 3.11 4.76 5.45 4.25
70 3.28 5.29 - 5.68 5.01 70 2.17 3.96 - 4.71 3.86
80 2.79 - - 3.31 3.12 80 2.20 - - 3.13 2.87
White 0 0.00 0.00 0.01 7.12 6.02 American 0 0.00 0.00 0.01 4.56 4.26
10 0.00 0.01 0.03 7.20 6.09 Indian/ 10 0.00 0.01 0.02 4.63 4.32
20 0.00 0.03 0.19 7.22 6.11 Alaska 20 0.00 0.02 0.09 4.66 4.36
30 0.02 0.19 0.84 7.28 6.17 Nativea 30 0.02 0.08 0.47 4.74 4.44
40 0.17 0.82 2.69 7.34 6.23 40 0.07 0.47 1.61 4.86 4.57
50 0.67 2.59 5.38 7.37 6.26 50 0.41 1.61 3.58 5.01 4.74
60 2.03 5.00 6.79 7.10 6.08 60 1.29 3.41 4.54 4.95 4.77
70 3.40 5.44 - 5.81 5.10 70 2.47 3.79 - 4.26 4.09
80 2.84 - - 3.34 3.15 80 1.82 - - 2.48 2.50
Black 0 0.00 0.00 0.00 6.59 5.34 Hispanicb 0 0.00 0.00 0.00 4.26 3.03
10 0.00 0.00 0.03 6.74 5.48 10 0.00 0.00 0.02 4.30 3.06
20 0.00 0.03 0.28 6.78 5.51 20 0.00 0.02 0.08 4.32 3.07
30 0.03 0.29 1.22 6.88 5.58 30 0.01 0.08 0.36 4.35 3.09
40 0.26 1.22 3.26 7.00 5.69 40 0.07 0.35 1.26 4.38 3.12
50 1.00 3.14 5.47 7.06 5.76 50 0.29 1.21 2.76 4.41 3.14
60 2.39 4.99 6.46 6.76 5.56 60 0.97 2.59 3.86 4.33 3.10
70 3.22 5.04 - 5.42 4.61 70 1.81 3.22 - 3.73 2.76
80 2.75 - - 3.31 3.00 80 1.82 - - 2.49 1.96
Table 15.18
Cancer of the Lung and Bronchus (Invasive)
Risk of Being Diagnosed With Cancer in 10, 20 and 30 Years,
Lifetime Risk of Being Diagnosed with Cancer Given Alive and Cancer-Free at Current Age, and
Lifetime Risk of Dying from Cancer Given Alive at Current Age
Both Sexes, 2006-2008 By Race/Ethnicity
SEE
R C
ancer Statistics Review
1975-2008N
ational Cancer Institute
Devcan Version 6.6.0, October 2011, National Cancer Institute (http://surveillance.cancer.gov/devcan/).Source: Incidence data are from the SEER 17 areas (San Francisco, Connecticut, Detroit, Hawaii, Iowa, New Mexico, Seattle, Utah, Atlanta,
San Jose-Monterey, Los Angeles, Alaska Native Registry, Rural Georgia, California excluding SF/SJM/LA, Kentucky, Louisiana andNew Jersey). Mortality data are from the NCHS public use data file for the total US.
a Underlying incidence and mortality data for American Indian/Alaska Native are based on the CHSDA(Contract Health Service Delivery Area)counties.
b Hispanic is not mutually exclusive from whites, blacks, Asian/Pacific Islanders, and American Indians/Alaska Natives.Underlying incidence data for Hispanics are based on NHIA and exclude cases from the Alaska Native Registry.Underlying mortality data for Hispanics exclude deaths from the District of Columbia, Minnesota, New Hampshire and North Dakota.
- Statistic could not be calculated.A percent of 0.00 represents a value that is below 0.005.
Risk of Being Risk of Being
Race/ Current Diagnosed with Cancer Risk of Dying Race/ Current Diagnosed with Cancer Risk of Dying
Ethnicity Age +10 yrs +20 yrs +30 yrs Ever from Cancer Ethnicity Age +10 yrs +20 yrs +30 yrs Ever from Cancer
All Races 0 0.00 0.00 0.01 7.66 6.85 Asian/ 0 0.00 0.00 0.01 7.11 5.59
10 0.00 0.01 0.03 7.76 6.95 Pacific 10 0.00 0.01 0.03 7.18 5.63
20 0.00 0.03 0.19 7.80 6.98 Islander 20 0.01 0.03 0.16 7.20 5.65
30 0.02 0.19 0.92 7.90 7.08 30 0.02 0.15 0.66 7.24 5.68
40 0.17 0.91 2.93 8.00 7.19 40 0.13 0.64 2.01 7.27 5.71
50 0.77 2.86 5.89 8.10 7.30 50 0.52 1.92 4.48 7.27 5.71
60 2.26 5.54 7.57 7.93 7.20 60 1.46 4.13 6.31 7.05 5.59
70 3.87 6.27 - 6.69 6.23 70 2.97 5.39 - 6.20 5.17
80 3.54 - - 4.17 4.16 80 3.13 - - 4.19 3.93
White 0 0.00 0.00 0.01 7.71 6.93 American 0 0.00 0.01 0.01 4.97 4.64
10 0.00 0.01 0.03 7.80 7.02 Indian/ 10 0.01 0.01 0.03 5.05 4.73
20 0.00 0.03 0.18 7.84 7.05 Alaska 20 0.01 0.03 0.08 5.09 4.78
30 0.02 0.18 0.88 7.93 7.14 Nativea 30 0.02 0.08 0.42 5.22 4.91
40 0.16 0.87 2.90 8.03 7.25 40 0.06 0.41 1.59 5.40 5.11
50 0.74 2.83 5.93 8.14 7.35 50 0.38 1.62 3.85 5.64 5.38
60 2.26 5.60 7.63 7.97 7.25 60 1.37 3.81 5.23 5.78 5.55
70 3.93 6.32 - 6.72 6.27 70 2.93 4.64 - 5.29 4.89
80 3.55 - - 4.14 4.15 80 2.49 - - 3.44 3.04
Black 0 0.00 0.00 0.00 7.80 6.76 Hispanicb 0 0.00 0.00 0.00 5.05 4.04
10 0.00 0.00 0.03 7.99 6.94 10 0.00 0.00 0.02 5.10 4.09
20 0.00 0.03 0.30 8.06 6.99 20 0.00 0.01 0.08 5.13 4.11
30 0.03 0.31 1.51 8.24 7.14 30 0.01 0.08 0.38 5.19 4.16
40 0.28 1.53 4.09 8.45 7.33 40 0.06 0.37 1.40 5.25 4.21
50 1.31 4.03 6.82 8.65 7.52 50 0.31 1.37 3.24 5.33 4.28
60 3.13 6.33 8.09 8.44 7.44 60 1.13 3.12 4.74 5.35 4.29
70 4.23 6.55 - 7.01 6.41 70 2.27 4.13 - 4.83 3.92
80 3.87 - - 4.64 4.53 80 2.53 - - 3.47 2.95
Table 15.19
Cancer of the Lung and Bronchus (Invasive)
Risk of Being Diagnosed With Cancer in 10, 20 and 30 Years,
Lifetime Risk of Being Diagnosed with Cancer Given Alive and Cancer-Free at Current Age, and
Lifetime Risk of Dying from Cancer Given Alive at Current Age
Males, 2006-2008 By Race/Ethnicity

SEE
R C
ancer Statistics Review
1975-2008N
ational Cancer Institute
Devcan Version 6.6.0, October 2011, National Cancer Institute (http://surveillance.cancer.gov/devcan/).Source: Incidence data are from the SEER 17 areas (San Francisco, Connecticut, Detroit, Hawaii, Iowa, New Mexico, Seattle, Utah, Atlanta,
San Jose-Monterey, Los Angeles, Alaska Native Registry, Rural Georgia, California excluding SF/SJM/LA, Kentucky, Louisiana andNew Jersey). Mortality data are from the NCHS public use data file for the total US.
a Underlying incidence and mortality data for American Indian/Alaska Native are based on the CHSDA(Contract Health Service Delivery Area)counties.
b Hispanic is not mutually exclusive from whites, blacks, Asian/Pacific Islanders, and American Indians/Alaska Natives.Underlying incidence data for Hispanics are based on NHIA and exclude cases from the Alaska Native Registry.Underlying mortality data for Hispanics exclude deaths from the District of Columbia, Minnesota, New Hampshire and North Dakota.
- Statistic could not be calculated.A percent of 0.00 represents a value that is below 0.005.
Risk of Being Risk of Being
Race/ Current Diagnosed with Cancer Risk of Dying Race/ Current Diagnosed with Cancer Risk of Dying
Ethnicity Age +10 yrs +20 yrs +30 yrs Ever from Cancer Ethnicity Age +10 yrs +20 yrs +30 yrs Ever from Cancer
All Races 0 0.00 0.00 0.01 6.33 5.04 Asian/ 0 0.00 0.00 0.00 4.39 3.29
10 0.00 0.01 0.03 6.40 5.10 Pacific 10 0.00 0.00 0.03 4.42 3.31
20 0.00 0.03 0.20 6.42 5.11 Islander 20 0.00 0.03 0.13 4.43 3.32
30 0.02 0.20 0.77 6.44 5.13 30 0.03 0.12 0.45 4.44 3.33
40 0.17 0.76 2.36 6.47 5.17 40 0.10 0.42 1.22 4.43 3.33
50 0.59 2.24 4.63 6.43 5.15 50 0.33 1.13 2.55 4.38 3.30
60 1.72 4.23 5.79 6.12 4.94 60 0.82 2.28 3.51 4.16 3.18
70 2.80 4.55 - 4.91 4.09 70 1.55 2.87 - 3.55 2.86
80 2.30 - - 2.77 2.48 80 1.55 - - 2.37 2.12
White 0 0.00 0.00 0.01 6.64 5.23 American 0 0.00 0.00 0.00 4.28 3.92
10 0.00 0.01 0.03 6.70 5.29 Indian/ 10 0.00 0.00 0.01 4.33 3.98
20 0.01 0.03 0.20 6.72 5.30 Alaska 20 0.00 0.01 0.09 4.35 4.00
30 0.02 0.20 0.79 6.74 5.33 Nativea 30 0.01 0.09 0.52 4.39 4.04
40 0.17 0.77 2.47 6.77 5.36 40 0.09 0.52 1.63 4.47 4.11
50 0.61 2.35 4.89 6.73 5.34 50 0.45 1.60 3.34 4.54 4.20
60 1.82 4.48 6.09 6.40 5.11 60 1.22 3.07 3.99 4.34 4.13
70 2.97 4.77 - 5.12 4.21 70 2.10 3.14 - 3.53 3.48
80 2.37 - - 2.83 2.53 80 1.38 - - 1.91 2.17
Black 0 0.00 0.00 0.00 5.56 4.16 Hispanicb 0 0.00 0.00 0.01 3.66 2.21
10 0.00 0.00 0.03 5.68 4.25 10 0.00 0.00 0.02 3.69 2.23
20 0.00 0.03 0.27 5.70 4.26 20 0.00 0.02 0.09 3.70 2.23
30 0.03 0.27 0.96 5.74 4.29 30 0.01 0.09 0.35 3.71 2.24
40 0.24 0.95 2.54 5.80 4.34 40 0.08 0.34 1.13 3.72 2.25
50 0.73 2.38 4.32 5.76 4.34 50 0.26 1.07 2.35 3.69 2.24
60 1.79 3.90 5.18 5.46 4.14 60 0.84 2.16 3.16 3.55 2.18
70 2.49 4.00 - 4.34 3.42 70 1.44 2.53 - 2.96 1.93
80 2.13 - - 2.60 2.20 80 1.35 - - 1.88 1.35
Table 15.20
Cancer of the Lung and Bronchus (Invasive)
Risk of Being Diagnosed With Cancer in 10, 20 and 30 Years,
Lifetime Risk of Being Diagnosed with Cancer Given Alive and Cancer-Free at Current Age, and
Lifetime Risk of Dying from Cancer Given Alive at Current Age
Females, 2006-2008 By Race/Ethnicity
SEER Cancer Statistics Review 1975-2008 National Cancer Institute
The AAPC is the Average Annual Percent Change over the time interval. The AAPCs are calculated bythe Joinpoint Regression Program Version 3.5, April 2011, National Cancer Institute.
- Statistic not shown. Rate based on less than 16 cases for the time interval.Trend based on less than 10 cases for at least one year within the time interval.
a Rates are age-adjusted to the 2000 US Std Population (19 age groups - Census P25-1130). Trendsare based on rates age-adjusted to the 2000 US Std Population (19 age groups - Census P25-1130).
b The SEER 9 areas are San Francisco, Connecticut, Detroit, Hawaii, Iowa, New Mexico, Seattle, Utahand Atlanta.The SEER 13 areas comprise the SEER 9 areas plus San Jose-Monterey, Los Angeles, the AlaskaNative Registry and Rural Georgia.The SEER 17 areas comprise the SEER 13 areas plus California excluding SF/SJM/LA, Kentucky,Louisiana and New Jersey.
c The 1999-2008 AAPC estimates are based on a Joinpoint analysis with up to 3 Joinpoints overdiagnosis years 1992-2008.
d The 1999-2008 AAPC estimates are based on a Joinpoint analysis with up to 5 Joinpoints overdiagnosis years 1975-2008.
e Hispanic and Non-Hispanic are not mutually exclusive from whites, blacks, Asian/PacificIslanders, and American Indians/Alaska Natives. Incidence data for Hispanics and Non-Hispanicsare based on NHIA and exclude cases from the Alaska Native Registry. The 2004-2008 Hispanic andNon-Hispanic death rates exclude deaths from the District of Columbia and North Dakota.The 1999-2008 Hispanic and Non-Hispanic mortality trends exclude deaths from Connecticut, theDistrict of Columbia, Maine, Maryland, Minnesota, New Hampshire, New York, North Dakota, Oklahomaand Vermont.
f Incidence data for American Indian/Alaska Native are based on the CHSDA(Contract Health ServiceDelivery Area) counties.
g US Mortality Files, National Center for Health Statistics, CDC.h The 1999-2008 mortality AAPCs are based on a Joinpoint analysis using years of death 1992-2008.* The APC is significantly different from zero (p<.05).
SEER Incidence SEER 17 Areasb SEER 13 Areasb SEER 9 Areasb
Rate 2004-2008 Trend 1999-2008c Trend 1999-2008d
Rate per 100,000 persons AAPC (%) AAPC (%)
Total Males Females Total Males Females Total Males Females RACE/ETHNICITY
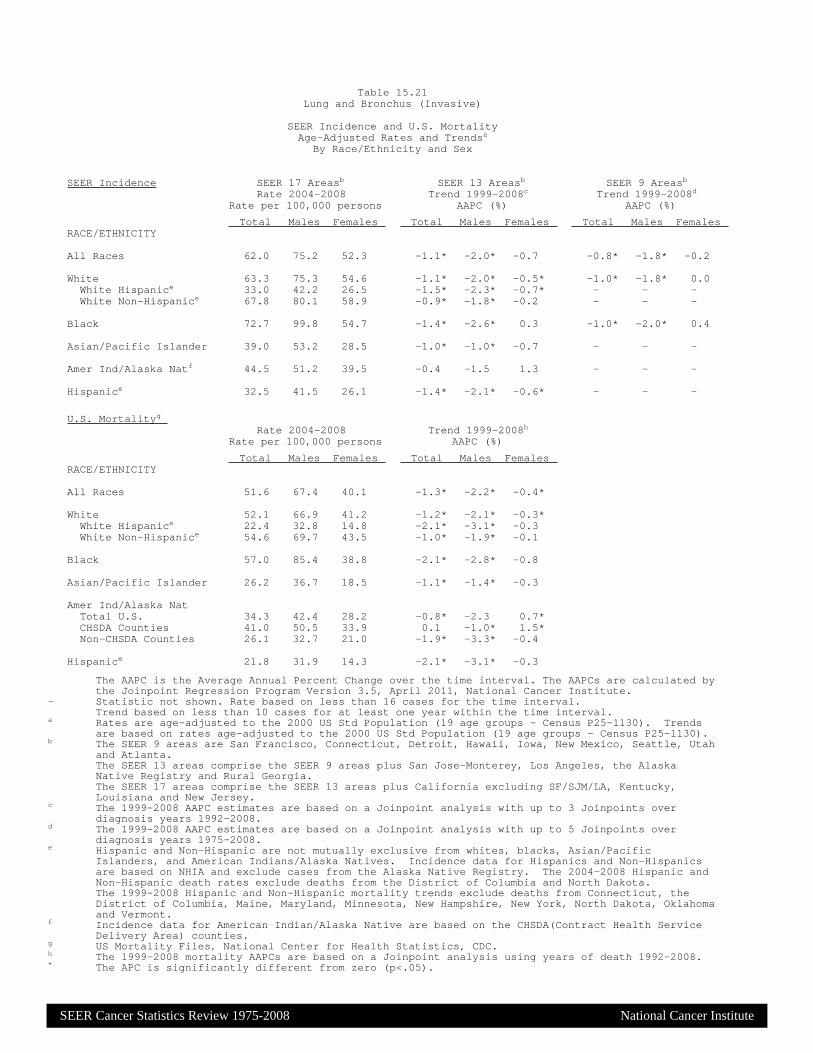
All Races 62.0 75.2 52.3 -1.1* -2.0* -0.7 -0.8* -1.8* -0.2
White 63.3 75.3 54.6 -1.1* -2.0* -0.5* -1.0* -1.8* 0.0White Hispanice 33.0 42.2 26.5 -1.5* -2.3* -0.7* - - -White Non-Hispanice 67.8 80.1 58.9 -0.9* -1.8* -0.2 - - -
Black 72.7 99.8 54.7 -1.4* -2.6* 0.3 -1.0* -2.0* 0.4
Asian/Pacific Islander 39.0 53.2 28.5 -1.0* -1.0* -0.7 - - -
Amer Ind/Alaska Natf 44.5 51.2 39.5 -0.4 -1.5 1.3 - - -
Hispanice 32.5 41.5 26.1 -1.4* -2.1* -0.6* - - -
U.S. Mortalityg Rate 2004-2008 Trend 1999-2008h
Rate per 100,000 persons AAPC (%)
Total Males Females Total Males FemalesRACE/ETHNICITY
All Races 51.6 67.4 40.1 -1.3* -2.2* -0.4*
White 52.1 66.9 41.2 -1.2* -2.1* -0.3*White Hispanice 22.4 32.8 14.8 -2.1* -3.1* -0.3White Non-Hispanice 54.6 69.7 43.5 -1.0* -1.9* -0.1
Black 57.0 85.4 38.8 -2.1* -2.8* -0.8
Asian/Pacific Islander 26.2 36.7 18.5 -1.1* -1.4* -0.3
Amer Ind/Alaska NatTotal U.S. 34.3 42.4 28.2 -0.8* -2.3 0.7*CHSDA Counties 41.0 50.5 33.9 0.1 -1.0* 1.5*Non-CHSDA Counties 26.1 32.7 21.0 -1.9* -3.3* -0.4
Hispanice 21.8 31.9 14.3 -2.1* -3.1* -0.3
Table 15.21Lung and Bronchus (Invasive)
SEER Incidence and U.S. MortalityAge-Adjusted Rates and Trendsa
By Race/Ethnicity and Sex
SEE
R C
ancer Statistics Review
1975-2008N
ational Cancer Institute
a Rates are per 100,000 and are age-adjusted to the 2000 US Std Population (19 age groups - Census P25-1130)b The SEER 9 areas are San Francisco, Connecticut, Detroit, Hawaii, Iowa, New Mexico, Seattle, Utah and Atlanta.
The SEER 11 areas comprise the SEER 9 areas plus San Jose-Monterey and Los Angeles.The SEER 13 areas comprise the SEER 11 areas plus the Alaska Native Registry and Rural Georgia.The SEER 17 areas comprise the SEER 13 areas plus California excluding SF/SJM/LA, Kentucky, Louisiana and New Jersey.
- Statistic not shown. Rate based on less than 16 cases for the time interval.
All Races Whites Blacks Total Males Females Total Males Females Total Males Females
SEER Incidence Ratesa, 2004-2008
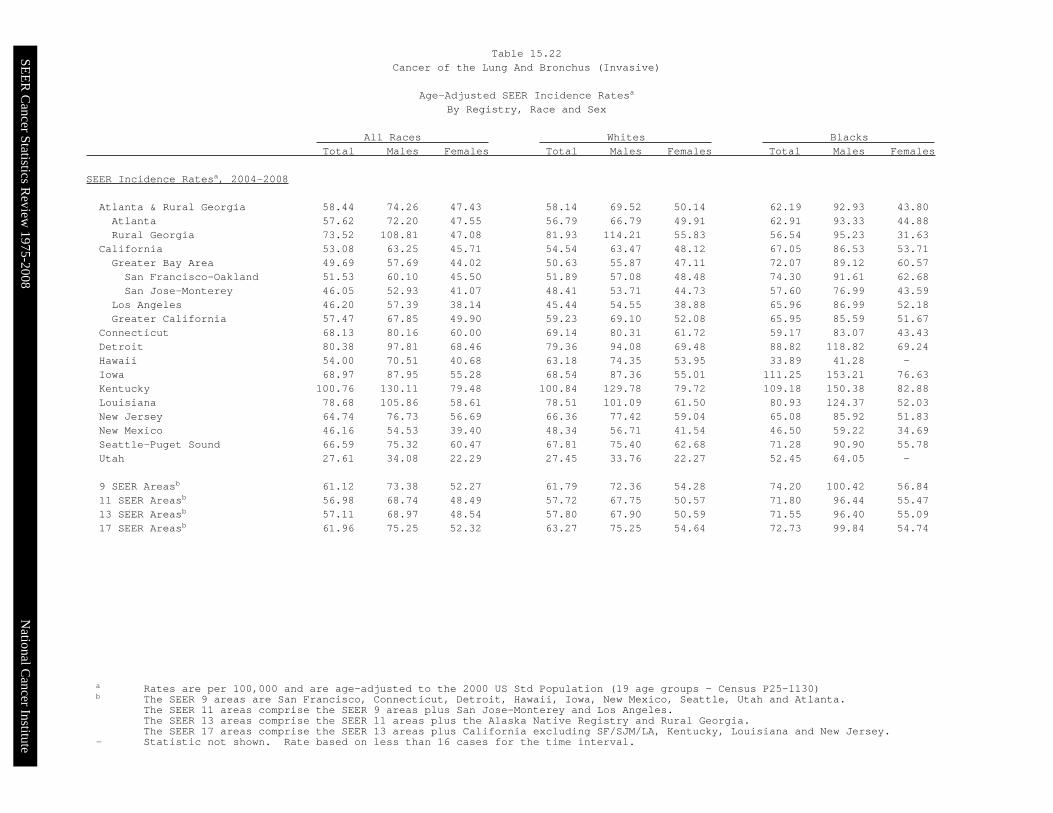
Atlanta & Rural Georgia 58.44 74.26 47.43 58.14 69.52 50.14 62.19 92.93 43.80Atlanta 57.62 72.20 47.55 56.79 66.79 49.91 62.91 93.33 44.88Rural Georgia 73.52 108.81 47.08 81.93 114.21 55.83 56.54 95.23 31.63
California 53.08 63.25 45.71 54.54 63.47 48.12 67.05 86.53 53.71Greater Bay Area 49.69 57.69 44.02 50.63 55.87 47.11 72.07 89.12 60.57San Francisco-Oakland 51.53 60.10 45.50 51.89 57.08 48.48 74.30 91.61 62.68San Jose-Monterey 46.05 52.93 41.07 48.41 53.71 44.73 57.60 76.99 43.59
Los Angeles 46.20 57.39 38.14 45.44 54.55 38.88 65.96 86.99 52.18Greater California 57.47 67.85 49.90 59.23 69.10 52.08 65.95 85.59 51.67
Connecticut 68.13 80.16 60.00 69.14 80.31 61.72 59.17 83.07 43.43Detroit 80.38 97.81 68.46 79.36 94.08 69.48 88.82 118.82 69.24Hawaii 54.00 70.51 40.68 63.18 74.35 53.95 33.89 41.28 -Iowa 68.97 87.95 55.28 68.54 87.36 55.01 111.25 153.21 76.63Kentucky 100.76 130.11 79.48 100.84 129.78 79.72 109.18 150.38 82.88Louisiana 78.68 105.86 58.61 78.51 101.09 61.50 80.93 124.37 52.03New Jersey 64.74 76.73 56.69 66.36 77.42 59.04 65.08 85.92 51.83New Mexico 46.16 54.53 39.40 48.34 56.71 41.54 46.50 59.22 34.69Seattle-Puget Sound 66.59 75.32 60.47 67.81 75.40 62.68 71.28 90.90 55.78Utah 27.61 34.08 22.29 27.45 33.76 22.27 52.45 64.05 -
9 SEER Areasb 61.12 73.38 52.27 61.79 72.36 54.28 74.20 100.42 56.8411 SEER Areasb 56.98 68.74 48.49 57.72 67.75 50.57 71.80 96.44 55.4713 SEER Areasb 57.11 68.97 48.54 57.80 67.90 50.59 71.55 96.40 55.0917 SEER Areasb 61.96 75.25 52.32 63.27 75.25 54.64 72.73 99.84 54.74
Table 15.22Cancer of the Lung And Bronchus (Invasive)
Age-Adjusted SEER Incidence Ratesa
By Registry, Race and Sex
SEE
R C
ancer Statistics Review
1975-2008N
ational Cancer Institute
a US Mortality Files, National Center for Health Statistics, Centers for Disease Control and Prevention.Rates are per 100,000 and are age-adjusted to the 2000 US Std Population (19 age groups - Census P25-1130).
b The SEER 9 areas are San Francisco, Connecticut, Detroit, Hawaii, Iowa, New Mexico, Seattle, Utah and Atlanta.The SEER 11 areas comprise the SEER 9 areas plus San Jose-Monterey and Los Angeles.The SEER 13 areas comprise the SEER 11 areas plus the Alaska Native Registry and Rural Georgia.The SEER 17 areas comprise the SEER 13 areas plus California excluding SF/SJM/LA, Kentucky, Louisiana and New Jersey.
- Statistic not shown. Rate based on less than 16 cases for the time interval.
All Races Whites Blacks Total Males Females Total Males Females Total Males Females
SEER Death Ratesa, 2004-2008
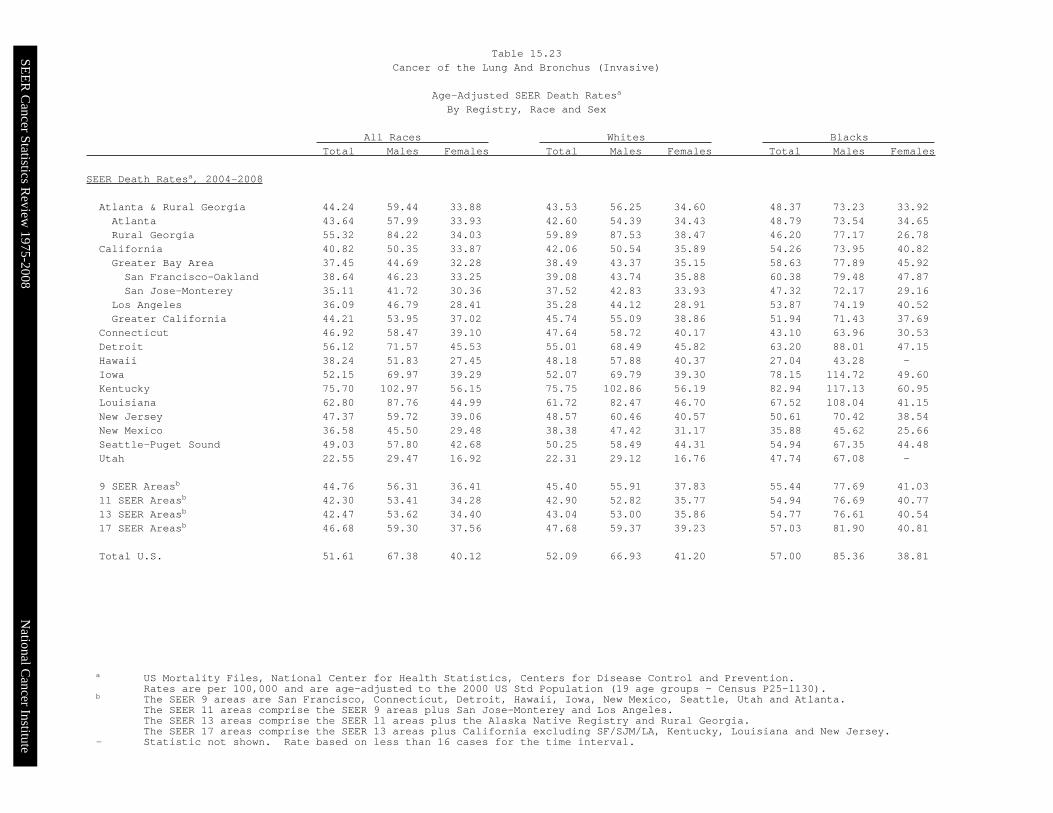
Atlanta & Rural Georgia 44.24 59.44 33.88 43.53 56.25 34.60 48.37 73.23 33.92Atlanta 43.64 57.99 33.93 42.60 54.39 34.43 48.79 73.54 34.65Rural Georgia 55.32 84.22 34.03 59.89 87.53 38.47 46.20 77.17 26.78
California 40.82 50.35 33.87 42.06 50.54 35.89 54.26 73.95 40.82Greater Bay Area 37.45 44.69 32.28 38.49 43.37 35.15 58.63 77.89 45.92San Francisco-Oakland 38.64 46.23 33.25 39.08 43.74 35.88 60.38 79.48 47.87San Jose-Monterey 35.11 41.72 30.36 37.52 42.83 33.93 47.32 72.17 29.16
Los Angeles 36.09 46.79 28.41 35.28 44.12 28.91 53.87 74.19 40.52Greater California 44.21 53.95 37.02 45.74 55.09 38.86 51.94 71.43 37.69
Connecticut 46.92 58.47 39.10 47.64 58.72 40.17 43.10 63.96 30.53Detroit 56.12 71.57 45.53 55.01 68.49 45.82 63.20 88.01 47.15Hawaii 38.24 51.83 27.45 48.18 57.88 40.37 27.04 43.28 -Iowa 52.15 69.97 39.29 52.07 69.79 39.30 78.15 114.72 49.60Kentucky 75.70 102.97 56.15 75.75 102.86 56.19 82.94 117.13 60.95Louisiana 62.80 87.76 44.99 61.72 82.47 46.70 67.52 108.04 41.15New Jersey 47.37 59.72 39.06 48.57 60.46 40.57 50.61 70.42 38.54New Mexico 36.58 45.50 29.48 38.38 47.42 31.17 35.88 45.62 25.66Seattle-Puget Sound 49.03 57.80 42.68 50.25 58.49 44.31 54.94 67.35 44.48Utah 22.55 29.47 16.92 22.31 29.12 16.76 47.74 67.08 -
9 SEER Areasb 44.76 56.31 36.41 45.40 55.91 37.83 55.44 77.69 41.0311 SEER Areasb 42.30 53.41 34.28 42.90 52.82 35.77 54.94 76.69 40.7713 SEER Areasb 42.47 53.62 34.40 43.04 53.00 35.86 54.77 76.61 40.5417 SEER Areasb 46.68 59.30 37.56 47.68 59.37 39.23 57.03 81.90 40.81
Total U.S. 51.61 67.38 40.12 52.09 66.93 41.20 57.00 85.36 38.81
Table 15.23Cancer of the Lung And Bronchus (Invasive)
Age-Adjusted SEER Death Ratesa
By Registry, Race and Sex
SEER Cancer Statistics Review 1975-2008 National Cancer Institute
a US Mortality Files, National Center for Health Statistics, Centers for Disease Control andPrevention. Rates are per 100,000 and are age-adjusted to the 2000 US Std Population (19age groups - Census P25-1130).
b Difference between state rate and total U.S. rate is statistically significant (p<=.0002).c Absolute percent difference between state rate and total U.S. rate is 5% or more.SE Standard error of the rate.PD Percent difference between state rate and total U.S. rate.- Statistic not shown. Rate based on less than 16 cases for the time interval.
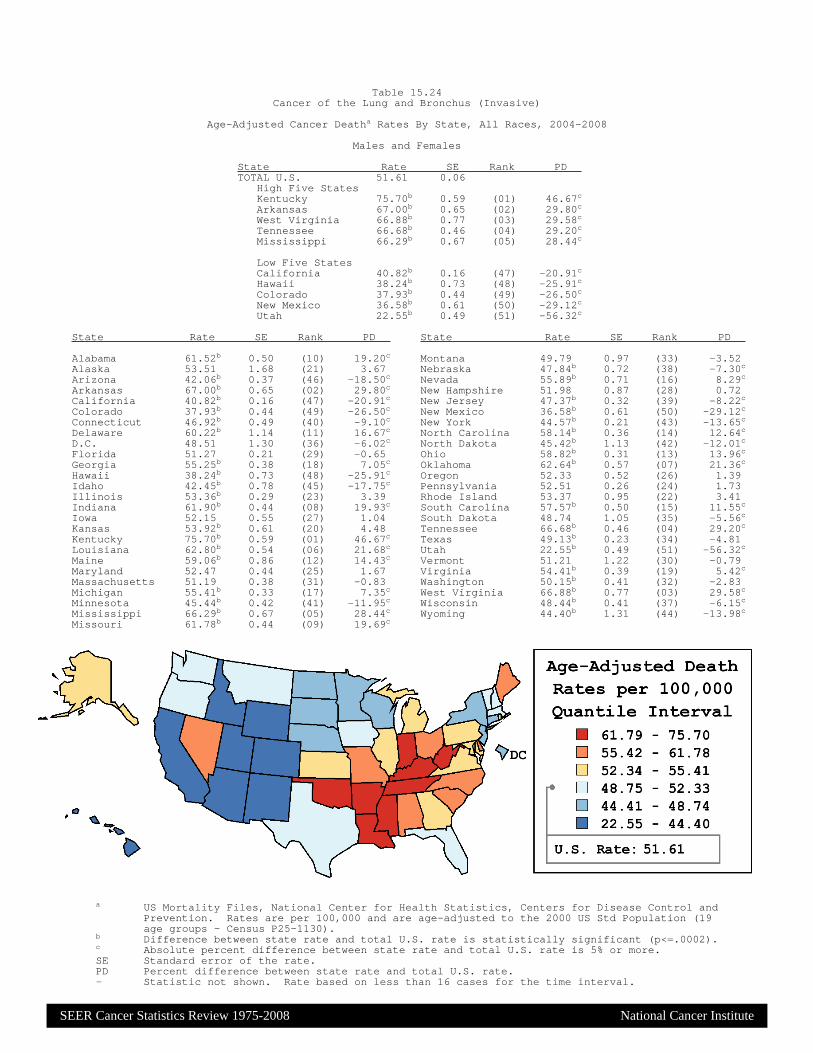
State Rate SE Rank PD TOTAL U.S. 51.61 0.06
High Five StatesKentucky 75.70b 0.59 (01) 46.67c
Arkansas 67.00b 0.65 (02) 29.80c
West Virginia 66.88b 0.77 (03) 29.58c
Tennessee 66.68b 0.46 (04) 29.20c
Mississippi 66.29b 0.67 (05) 28.44c
Low Five StatesCalifornia 40.82b 0.16 (47) -20.91c
Hawaii 38.24b 0.73 (48) -25.91c
Colorado 37.93b 0.44 (49) -26.50c
New Mexico 36.58b 0.61 (50) -29.12c
Utah 22.55b 0.49 (51) -56.32c
State Rate SE Rank PD State Rate SE Rank PD
Alabama 61.52b 0.50 (10) 19.20c Montana 49.79 0.97 (33) -3.52Alaska 53.51 1.68 (21) 3.67 Nebraska 47.84b 0.72 (38) -7.30c
Arizona 42.06b 0.37 (46) -18.50c Nevada 55.89b 0.71 (16) 8.29c
Arkansas 67.00b 0.65 (02) 29.80c New Hampshire 51.98 0.87 (28) 0.72California 40.82b 0.16 (47) -20.91c New Jersey 47.37b 0.32 (39) -8.22c
Colorado 37.93b 0.44 (49) -26.50c New Mexico 36.58b 0.61 (50) -29.12c
Connecticut 46.92b 0.49 (40) -9.10c New York 44.57b 0.21 (43) -13.65c
Delaware 60.22b 1.14 (11) 16.67c North Carolina 58.14b 0.36 (14) 12.64c
D.C. 48.51 1.30 (36) -6.02c North Dakota 45.42b 1.13 (42) -12.01c
Florida 51.27 0.21 (29) -0.65 Ohio 58.82b 0.31 (13) 13.96c
Georgia 55.25b 0.38 (18) 7.05c Oklahoma 62.64b 0.57 (07) 21.36c
Hawaii 38.24b 0.73 (48) -25.91c Oregon 52.33 0.52 (26) 1.39Idaho 42.45b 0.78 (45) -17.75c Pennsylvania 52.51 0.26 (24) 1.73Illinois 53.36b 0.29 (23) 3.39 Rhode Island 53.37 0.95 (22) 3.41Indiana 61.90b 0.44 (08) 19.93c South Carolina 57.57b 0.50 (15) 11.55c
Iowa 52.15 0.55 (27) 1.04 South Dakota 48.74 1.05 (35) -5.56c
Kansas 53.92b 0.61 (20) 4.48 Tennessee 66.68b 0.46 (04) 29.20c
Kentucky 75.70b 0.59 (01) 46.67c Texas 49.13b 0.23 (34) -4.81Louisiana 62.80b 0.54 (06) 21.68c Utah 22.55b 0.49 (51) -56.32c
Maine 59.06b 0.86 (12) 14.43c Vermont 51.21 1.22 (30) -0.79Maryland 52.47 0.44 (25) 1.67 Virginia 54.41b 0.39 (19) 5.42c
Massachusetts 51.19 0.38 (31) -0.83 Washington 50.15b 0.41 (32) -2.83Michigan 55.41b 0.33 (17) 7.35c West Virginia 66.88b 0.77 (03) 29.58c
Minnesota 45.44b 0.42 (41) -11.95c Wisconsin 48.44b 0.41 (37) -6.15c
Mississippi 66.29b 0.67 (05) 28.44c Wyoming 44.40b 1.31 (44) -13.98c
Missouri 61.78b 0.44 (09) 19.69c
Table 15.24Cancer of the Lung and Bronchus (Invasive)
Age-Adjusted Cancer Deatha Rates By State, All Races, 2004-2008
Males and Females
SEER Cancer Statistics Review 1975-2008 National Cancer Institute
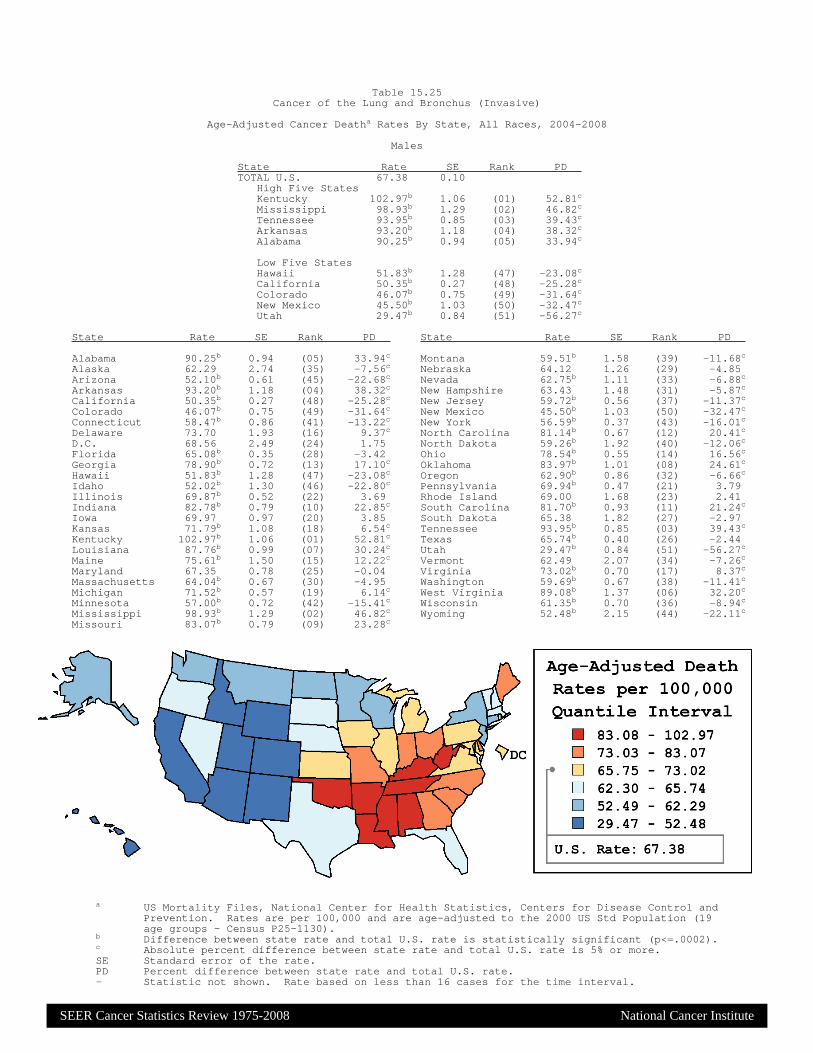
a US Mortality Files, National Center for Health Statistics, Centers for Disease Control andPrevention. Rates are per 100,000 and are age-adjusted to the 2000 US Std Population (19age groups - Census P25-1130).
b Difference between state rate and total U.S. rate is statistically significant (p<=.0002).c Absolute percent difference between state rate and total U.S. rate is 5% or more.SE Standard error of the rate.PD Percent difference between state rate and total U.S. rate.- Statistic not shown. Rate based on less than 16 cases for the time interval.
State Rate SE Rank PD TOTAL U.S. 67.38 0.10
High Five StatesKentucky 102.97b 1.06 (01) 52.81c
Mississippi 98.93b 1.29 (02) 46.82c
Tennessee 93.95b 0.85 (03) 39.43c
Arkansas 93.20b 1.18 (04) 38.32c
Alabama 90.25b 0.94 (05) 33.94c
Low Five StatesHawaii 51.83b 1.28 (47) -23.08c
California 50.35b 0.27 (48) -25.28c
Colorado 46.07b 0.75 (49) -31.64c
New Mexico 45.50b 1.03 (50) -32.47c
Utah 29.47b 0.84 (51) -56.27c
State Rate SE Rank PD State Rate SE Rank PD
Alabama 90.25b 0.94 (05) 33.94c Montana 59.51b 1.58 (39) -11.68c
Alaska 62.29 2.74 (35) -7.56c Nebraska 64.12 1.26 (29) -4.85Arizona 52.10b 0.61 (45) -22.68c Nevada 62.75b 1.11 (33) -6.88c
Arkansas 93.20b 1.18 (04) 38.32c New Hampshire 63.43 1.48 (31) -5.87c
California 50.35b 0.27 (48) -25.28c New Jersey 59.72b 0.56 (37) -11.37c
Colorado 46.07b 0.75 (49) -31.64c New Mexico 45.50b 1.03 (50) -32.47c
Connecticut 58.47b 0.86 (41) -13.22c New York 56.59b 0.37 (43) -16.01c
Delaware 73.70 1.93 (16) 9.37c North Carolina 81.14b 0.67 (12) 20.41c
D.C. 68.56 2.49 (24) 1.75 North Dakota 59.26b 1.92 (40) -12.06c
Florida 65.08b 0.35 (28) -3.42 Ohio 78.54b 0.55 (14) 16.56c
Georgia 78.90b 0.72 (13) 17.10c Oklahoma 83.97b 1.01 (08) 24.61c
Hawaii 51.83b 1.28 (47) -23.08c Oregon 62.90b 0.86 (32) -6.66c
Idaho 52.02b 1.30 (46) -22.80c Pennsylvania 69.94b 0.47 (21) 3.79Illinois 69.87b 0.52 (22) 3.69 Rhode Island 69.00 1.68 (23) 2.41Indiana 82.78b 0.79 (10) 22.85c South Carolina 81.70b 0.93 (11) 21.24c
Iowa 69.97 0.97 (20) 3.85 South Dakota 65.38 1.82 (27) -2.97Kansas 71.79b 1.08 (18) 6.54c Tennessee 93.95b 0.85 (03) 39.43c
Kentucky 102.97b 1.06 (01) 52.81c Texas 65.74b 0.40 (26) -2.44Louisiana 87.76b 0.99 (07) 30.24c Utah 29.47b 0.84 (51) -56.27c
Maine 75.61b 1.50 (15) 12.22c Vermont 62.49 2.07 (34) -7.26c
Maryland 67.35 0.78 (25) -0.04 Virginia 73.02b 0.70 (17) 8.37c
Massachusetts 64.04b 0.67 (30) -4.95 Washington 59.69b 0.67 (38) -11.41c
Michigan 71.52b 0.57 (19) 6.14c West Virginia 89.08b 1.37 (06) 32.20c
Minnesota 57.00b 0.72 (42) -15.41c Wisconsin 61.35b 0.70 (36) -8.94c
Mississippi 98.93b 1.29 (02) 46.82c Wyoming 52.48b 2.15 (44) -22.11c
Missouri 83.07b 0.79 (09) 23.28c
Table 15.25Cancer of the Lung and Bronchus (Invasive)
Age-Adjusted Cancer Deatha Rates By State, All Races, 2004-2008
Males
SEER Cancer Statistics Review 1975-2008 National Cancer Institute
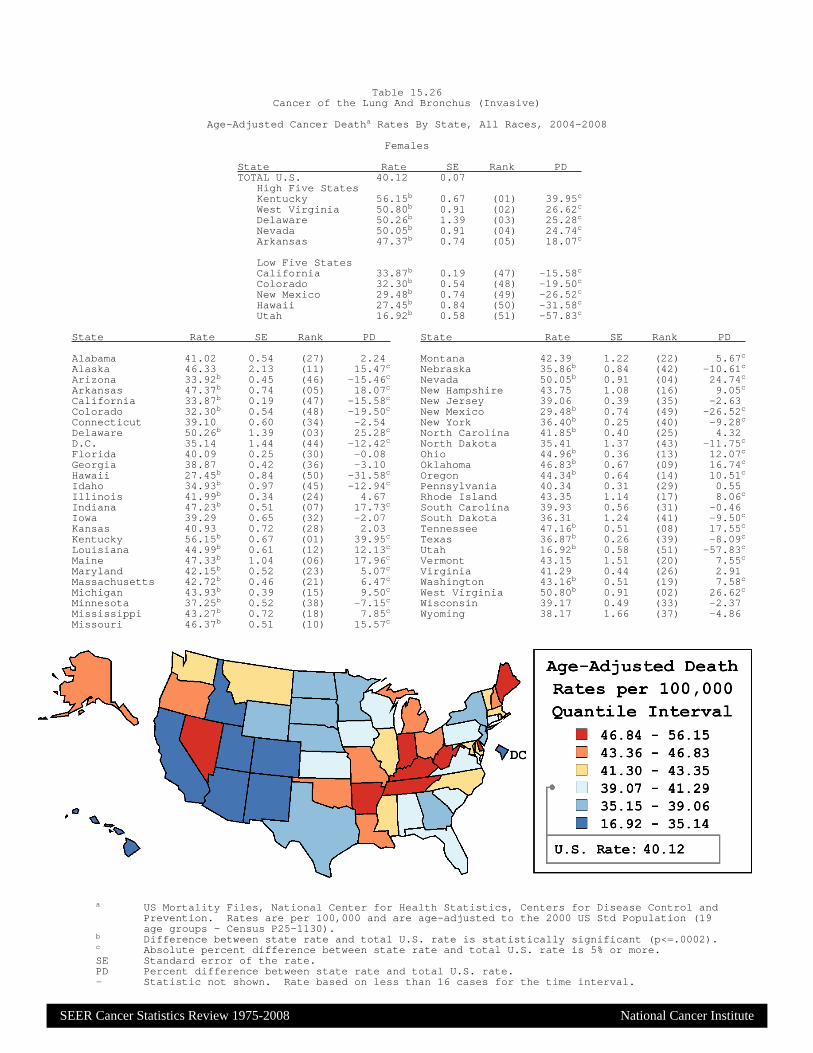
a US Mortality Files, National Center for Health Statistics, Centers for Disease Control andPrevention. Rates are per 100,000 and are age-adjusted to the 2000 US Std Population (19age groups - Census P25-1130).
b Difference between state rate and total U.S. rate is statistically significant (p<=.0002).c Absolute percent difference between state rate and total U.S. rate is 5% or more.SE Standard error of the rate.PD Percent difference between state rate and total U.S. rate.- Statistic not shown. Rate based on less than 16 cases for the time interval.
State Rate SE Rank PD TOTAL U.S. 40.12 0.07
High Five StatesKentucky 56.15b 0.67 (01) 39.95c
West Virginia 50.80b 0.91 (02) 26.62c
Delaware 50.26b 1.39 (03) 25.28c
Nevada 50.05b 0.91 (04) 24.74c
Arkansas 47.37b 0.74 (05) 18.07c
Low Five StatesCalifornia 33.87b 0.19 (47) -15.58c
Colorado 32.30b 0.54 (48) -19.50c
New Mexico 29.48b 0.74 (49) -26.52c
Hawaii 27.45b 0.84 (50) -31.58c
Utah 16.92b 0.58 (51) -57.83c
State Rate SE Rank PD State Rate SE Rank PD
Alabama 41.02 0.54 (27) 2.24 Montana 42.39 1.22 (22) 5.67c
Alaska 46.33 2.13 (11) 15.47c Nebraska 35.86b 0.84 (42) -10.61c
Arizona 33.92b 0.45 (46) -15.46c Nevada 50.05b 0.91 (04) 24.74c
Arkansas 47.37b 0.74 (05) 18.07c New Hampshire 43.75 1.08 (16) 9.05c
California 33.87b 0.19 (47) -15.58c New Jersey 39.06 0.39 (35) -2.63Colorado 32.30b 0.54 (48) -19.50c New Mexico 29.48b 0.74 (49) -26.52c
Connecticut 39.10 0.60 (34) -2.54 New York 36.40b 0.25 (40) -9.28c
Delaware 50.26b 1.39 (03) 25.28c North Carolina 41.85b 0.40 (25) 4.32D.C. 35.14 1.44 (44) -12.42c North Dakota 35.41 1.37 (43) -11.75c
Florida 40.09 0.25 (30) -0.08 Ohio 44.96b 0.36 (13) 12.07c
Georgia 38.87 0.42 (36) -3.10 Oklahoma 46.83b 0.67 (09) 16.74c
Hawaii 27.45b 0.84 (50) -31.58c Oregon 44.34b 0.64 (14) 10.51c
Idaho 34.93b 0.97 (45) -12.94c Pennsylvania 40.34 0.31 (29) 0.55Illinois 41.99b 0.34 (24) 4.67 Rhode Island 43.35 1.14 (17) 8.06c
Indiana 47.23b 0.51 (07) 17.73c South Carolina 39.93 0.56 (31) -0.46Iowa 39.29 0.65 (32) -2.07 South Dakota 36.31 1.24 (41) -9.50c
Kansas 40.93 0.72 (28) 2.03 Tennessee 47.16b 0.51 (08) 17.55c
Kentucky 56.15b 0.67 (01) 39.95c Texas 36.87b 0.26 (39) -8.09c
Louisiana 44.99b 0.61 (12) 12.13c Utah 16.92b 0.58 (51) -57.83c
Maine 47.33b 1.04 (06) 17.96c Vermont 43.15 1.51 (20) 7.55c
Maryland 42.15b 0.52 (23) 5.07c Virginia 41.29 0.44 (26) 2.91Massachusetts 42.72b 0.46 (21) 6.47c Washington 43.16b 0.51 (19) 7.58c
Michigan 43.93b 0.39 (15) 9.50c West Virginia 50.80b 0.91 (02) 26.62c
Minnesota 37.25b 0.52 (38) -7.15c Wisconsin 39.17 0.49 (33) -2.37Mississippi 43.27b 0.72 (18) 7.85c Wyoming 38.17 1.66 (37) -4.86Missouri 46.37b 0.51 (10) 15.57c
Table 15.26Cancer of the Lung And Bronchus (Invasive)
Age-Adjusted Cancer Deatha Rates By State, All Races, 2004-2008
Females
SEE
R C
ancer Statistics Review
1975-2008N
ational Cancer Institute
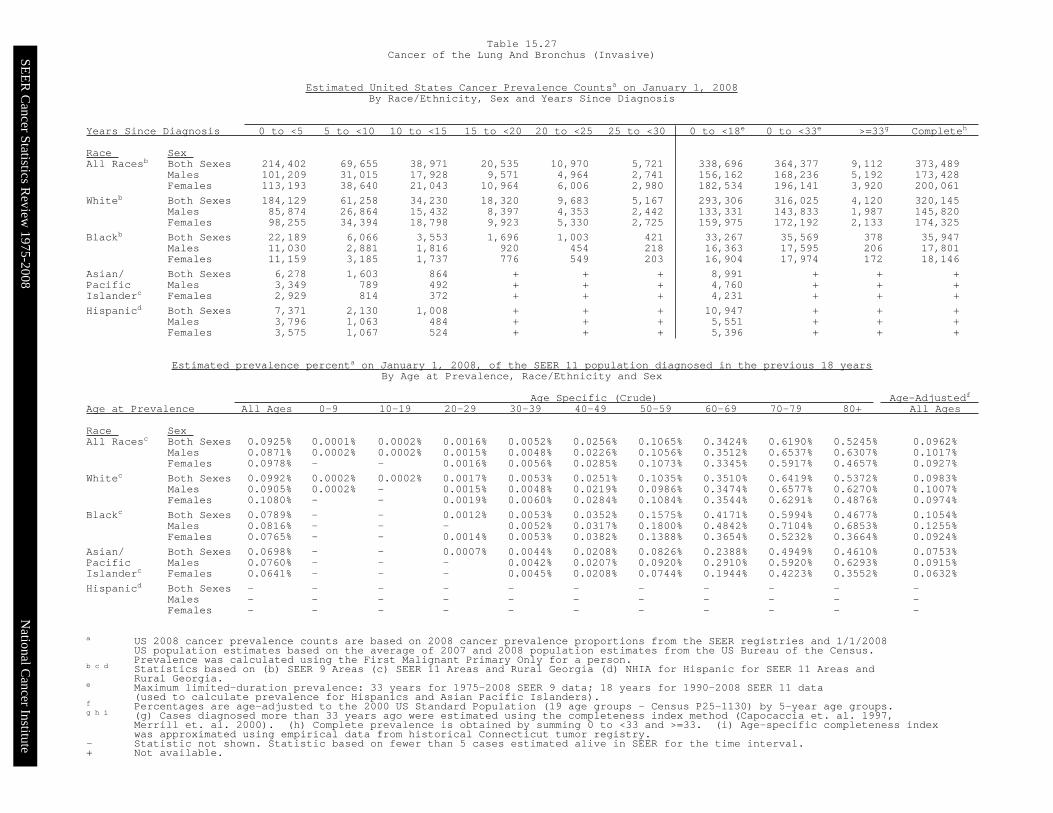
a US 2008 cancer prevalence counts are based on 2008 cancer prevalence proportions from the SEER registries and 1/1/2008US population estimates based on the average of 2007 and 2008 population estimates from the US Bureau of the Census.Prevalence was calculated using the First Malignant Primary Only for a person.
b c d Statistics based on (b) SEER 9 Areas (c) SEER 11 Areas and Rural Georgia (d) NHIA for Hispanic for SEER 11 Areas andRural Georgia.
e Maximum limited-duration prevalence: 33 years for 1975-2008 SEER 9 data; 18 years for 1990-2008 SEER 11 data(used to calculate prevalence for Hispanics and Asian Pacific Islanders).
f Percentages are age-adjusted to the 2000 US Standard Population (19 age groups - Census P25-1130) by 5-year age groups.g h i (g) Cases diagnosed more than 33 years ago were estimated using the completeness index method (Capocaccia et. al. 1997,
Merrill et. al. 2000). (h) Complete prevalence is obtained by summing 0 to <33 and >=33. (i) Age-specific completeness indexwas approximated using empirical data from historical Connecticut tumor registry.
- Statistic not shown. Statistic based on fewer than 5 cases estimated alive in SEER for the time interval.+ Not available.
Years Since Diagnosis 0 to <5 5 to <10 10 to <15 15 to <20 20 to <25 25 to <30 0 to <18e 0 to <33e >=33g Completeh
Race Sex All Racesb Both Sexes 214,402 69,655 38,971 20,535 10,970 5,721 338,696 364,377 9,112 373,489
Males 101,209 31,015 17,928 9,571 4,964 2,741 156,162 168,236 5,192 173,428Females 113,193 38,640 21,043 10,964 6,006 2,980 182,534 196,141 3,920 200,061
Whiteb Both Sexes 184,129 61,258 34,230 18,320 9,683 5,167 293,306 316,025 4,120 320,145Males 85,874 26,864 15,432 8,397 4,353 2,442 133,331 143,833 1,987 145,820Females 98,255 34,394 18,798 9,923 5,330 2,725 159,975 172,192 2,133 174,325
Blackb Both Sexes 22,189 6,066 3,553 1,696 1,003 421 33,267 35,569 378 35,947Males 11,030 2,881 1,816 920 454 218 16,363 17,595 206 17,801Females 11,159 3,185 1,737 776 549 203 16,904 17,974 172 18,146
Asian/ Both Sexes 6,278 1,603 864 + + + 8,991 + + +Pacific Males 3,349 789 492 + + + 4,760 + + +Islanderc Females 2,929 814 372 + + + 4,231 + + +
Hispanicd Both Sexes 7,371 2,130 1,008 + + + 10,947 + + +Males 3,796 1,063 484 + + + 5,551 + + +Females 3,575 1,067 524 + + + 5,396 + + +
Age Specific (Crude) Age-Adjustedf Age at Prevalence All Ages 0-9 10-19 20-29 30-39 40-49 50-59 60-69 70-79 80+ All Ages
Race Sex All Racesc Both Sexes 0.0925% 0.0001% 0.0002% 0.0016% 0.0052% 0.0256% 0.1065% 0.3424% 0.6190% 0.5245% 0.0962%
Males 0.0871% 0.0002% 0.0002% 0.0015% 0.0048% 0.0226% 0.1056% 0.3512% 0.6537% 0.6307% 0.1017%Females 0.0978% - - 0.0016% 0.0056% 0.0285% 0.1073% 0.3345% 0.5917% 0.4657% 0.0927%
Whitec Both Sexes 0.0992% 0.0002% 0.0002% 0.0017% 0.0053% 0.0251% 0.1035% 0.3510% 0.6419% 0.5372% 0.0983%Males 0.0905% 0.0002% - 0.0015% 0.0048% 0.0219% 0.0986% 0.3474% 0.6577% 0.6270% 0.1007%Females 0.1080% - - 0.0019% 0.0060% 0.0284% 0.1084% 0.3544% 0.6291% 0.4876% 0.0974%
Blackc Both Sexes 0.0789% - - 0.0012% 0.0053% 0.0352% 0.1575% 0.4171% 0.5994% 0.4677% 0.1054%Males 0.0816% - - - 0.0052% 0.0317% 0.1800% 0.4842% 0.7104% 0.6853% 0.1255%Females 0.0765% - - 0.0014% 0.0053% 0.0382% 0.1388% 0.3654% 0.5232% 0.3664% 0.0924%
Asian/ Both Sexes 0.0698% - - 0.0007% 0.0044% 0.0208% 0.0826% 0.2388% 0.4949% 0.4610% 0.0753%Pacific Males 0.0760% - - - 0.0042% 0.0207% 0.0920% 0.2910% 0.5920% 0.6293% 0.0915%Islanderc Females 0.0641% - - - 0.0045% 0.0208% 0.0744% 0.1944% 0.4223% 0.3552% 0.0632%
Hispanicd Both Sexes - - - - - - - - - - -Males - - - - - - - - - - -Females - - - - - - - - - - -
Table 15.27Cancer of the Lung And Bronchus (Invasive)
Estimated United States Cancer Prevalence Countsa on January 1, 2008By Race/Ethnicity, Sex and Years Since Diagnosis
Estimated prevalence percenta on January 1, 2008, of the SEER 11 population diagnosed in the previous 18 yearsBy Age at Prevalence, Race/Ethnicity and Sex

SEE
R C
ancer Statistics Review
1975-2008N
ational Cancer Institute
Source: SEER 17 areas (San Francisco, Connecticut, Detroit, Hawaii, Iowa, New Mexico, Seattle, Utah, Atlanta, San Jose-Monterey,Los Angeles, Alaska Native Registry, Rural Georgia, California excluding SF/SJM/LA, Kentucky, Louisiana and New Jersey).Percents may not sum to 100 due to rounding.
a Excludes Kaposi Sarcoma, mesothelioma, lymphomas, leukemias, myelomas, lymphoreticular, and immunoproliferative diseases.b Estimates for American Indian/Alaska Native are based on the CHSDA(Contract Health Service Delivery Area) counties.c Hispanic is not mutually exclusive from whites, blacks, Asian/Pacific Islanders, and American Indians/Alaska Natives.
Underlying incidence data for Hispanics are based on NHIA and exclude cases from the Alaska Native Registry.d Non-small cell includes histologies 8010-8015, 8020-8022, 8030-8040, 8046, 8050-8052, 8070-8084, 8090-8110, 8120-8131,
8140-8156, 8160-8162, 8170-8175, 8180, 8190-8221, 8230-8231, 8240-8263, 8270-8280, 8290-8337, 8340-8347, 8350-8390, 8400-8562,8570-8576, 8580-8671, 8940-8941.
e Squamous and transitional cell includes histologies 8051-8052, 8070-8084, 8120-8131.f Adenocarcinoma includes histologies 8050, 8140-8149, 8160-8162, 8190-8221, 8250-8263, 8270-8280, 8290-8337, 8350-8390,
8400-8560, 8570-8576, 8940-8941.g Other non-small cell includes large cell carcinoma, NOS, other specified carcinomas, and unspecified carcinomas.
Other non-small cell is defined as histologies 8010, 8020-8022, 8030-8040, 8046, 8090-8110, 8150-8156, 8170-8175, 8180,8230-8231, 8240-8249, 8340-8347, 8561-8562, 8580-8671.
h Sarcoma includes histologies 8680-8713, 8800-8921, 8990-8991, 9040-9044, 9120-9136, 9150-9252, 9370-9373, 9540-9582.i Other specific types includes melanomas and is defined as histologies 8720-8790, 8930-8936, 8950-8983, 9000-9030, 9060-9110,
9260-9365, 9380-9539.- Statistic not shown due to fewer than 16 cases during the time period.
Asian/Pacific American Indian/All Races White Black Islander Alaska Nativeb Hispanicc
Histologya Count Percent Count Percent Count Percent Count Percent Count Percent Count Percent
Carcinoma 200,102 98.9% 167,178 98.9% 20,217 99.0% 11,263 99.1% 713 98.2% 11,104 98.6%
Small cell (8041-8045) 27,596 13.6% 24,326 14.4% 2,137 10.5% 915 8.0% 136 18.7% 1,300 11.5%
Non-small celld 172,506 85.3% 142,852 84.5% 18,080 88.5% 10,348 91.0% 577 79.5% 9,804 87.1%
Squamous and 40,449 20.0% 33,829 20.0% 4,579 22.4% 1,731 15.2% 176 24.2% 1,909 17.0%
transitional celle
Adenocarcinomaf 77,926 38.5% 64,188 38.0% 7,550 37.0% 5,713 50.2% 180 24.8% 4,665 41.4%
Large cell (8011-8015) 5,914 2.9% 4,854 2.9% 723 3.5% 298 2.6% 20 2.8% 329 2.9%
Other non-small cellg 48,217 23.8% 39,981 23.7% 5,228 25.6% 2,606 22.9% 201 27.7% 2,901 25.8%
Sarcomah 351 0.2% 297 0.2% 31 0.2% - - - - 33 0.3%
Other specified typesi 159 0.1% 140 0.1% - - - - - - 16 0.1%
Unspecified (8000-8005) 1,691 0.8% 1,431 0.8% 159 0.8% 85 0.7% - - 109 1.0%
Total 202,303 100.0% 169,046 100.0% 20,419 100.0% 11,370 100.0% 726 100.0% 11,262 100.0%
Table 15.28
Cancer of the Lung and Bronchus (Invasive)
Percent Distribution and Counts by Histology among Histologically Confirmed Cases, 2004-2008Both Sexes by Race
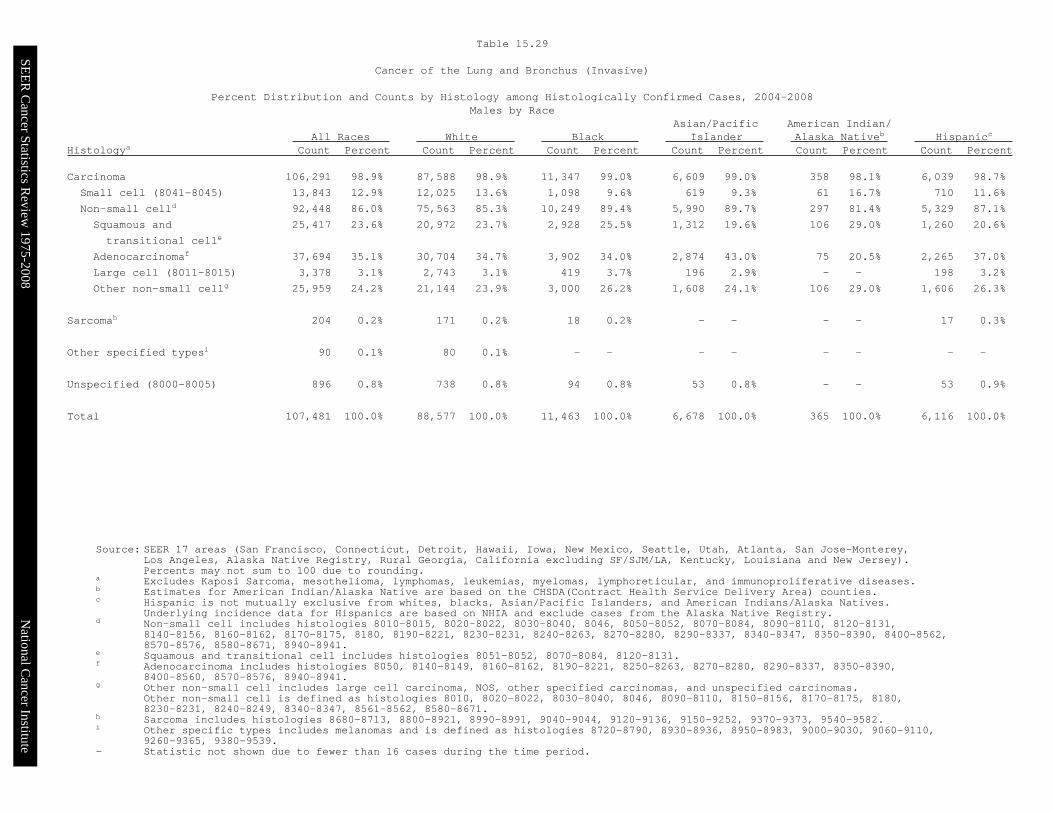
SEE
R C
ancer Statistics Review
1975-2008N
ational Cancer Institute
Source: SEER 17 areas (San Francisco, Connecticut, Detroit, Hawaii, Iowa, New Mexico, Seattle, Utah, Atlanta, San Jose-Monterey,Los Angeles, Alaska Native Registry, Rural Georgia, California excluding SF/SJM/LA, Kentucky, Louisiana and New Jersey).Percents may not sum to 100 due to rounding.
a Excludes Kaposi Sarcoma, mesothelioma, lymphomas, leukemias, myelomas, lymphoreticular, and immunoproliferative diseases.b Estimates for American Indian/Alaska Native are based on the CHSDA(Contract Health Service Delivery Area) counties.c Hispanic is not mutually exclusive from whites, blacks, Asian/Pacific Islanders, and American Indians/Alaska Natives.
Underlying incidence data for Hispanics are based on NHIA and exclude cases from the Alaska Native Registry.d Non-small cell includes histologies 8010-8015, 8020-8022, 8030-8040, 8046, 8050-8052, 8070-8084, 8090-8110, 8120-8131,
8140-8156, 8160-8162, 8170-8175, 8180, 8190-8221, 8230-8231, 8240-8263, 8270-8280, 8290-8337, 8340-8347, 8350-8390, 8400-8562,8570-8576, 8580-8671, 8940-8941.
e Squamous and transitional cell includes histologies 8051-8052, 8070-8084, 8120-8131.f Adenocarcinoma includes histologies 8050, 8140-8149, 8160-8162, 8190-8221, 8250-8263, 8270-8280, 8290-8337, 8350-8390,
8400-8560, 8570-8576, 8940-8941.g Other non-small cell includes large cell carcinoma, NOS, other specified carcinomas, and unspecified carcinomas.
Other non-small cell is defined as histologies 8010, 8020-8022, 8030-8040, 8046, 8090-8110, 8150-8156, 8170-8175, 8180,8230-8231, 8240-8249, 8340-8347, 8561-8562, 8580-8671.
h Sarcoma includes histologies 8680-8713, 8800-8921, 8990-8991, 9040-9044, 9120-9136, 9150-9252, 9370-9373, 9540-9582.i Other specific types includes melanomas and is defined as histologies 8720-8790, 8930-8936, 8950-8983, 9000-9030, 9060-9110,
9260-9365, 9380-9539.- Statistic not shown due to fewer than 16 cases during the time period.
Asian/Pacific American Indian/All Races White Black Islander Alaska Nativeb Hispanicc
Histologya Count Percent Count Percent Count Percent Count Percent Count Percent Count Percent
Carcinoma 106,291 98.9% 87,588 98.9% 11,347 99.0% 6,609 99.0% 358 98.1% 6,039 98.7%
Small cell (8041-8045) 13,843 12.9% 12,025 13.6% 1,098 9.6% 619 9.3% 61 16.7% 710 11.6%
Non-small celld 92,448 86.0% 75,563 85.3% 10,249 89.4% 5,990 89.7% 297 81.4% 5,329 87.1%
Squamous and 25,417 23.6% 20,972 23.7% 2,928 25.5% 1,312 19.6% 106 29.0% 1,260 20.6%
transitional celle
Adenocarcinomaf 37,694 35.1% 30,704 34.7% 3,902 34.0% 2,874 43.0% 75 20.5% 2,265 37.0%
Large cell (8011-8015) 3,378 3.1% 2,743 3.1% 419 3.7% 196 2.9% - - 198 3.2%
Other non-small cellg 25,959 24.2% 21,144 23.9% 3,000 26.2% 1,608 24.1% 106 29.0% 1,606 26.3%
Sarcomah 204 0.2% 171 0.2% 18 0.2% - - - - 17 0.3%
Other specified typesi 90 0.1% 80 0.1% - - - - - - - -
Unspecified (8000-8005) 896 0.8% 738 0.8% 94 0.8% 53 0.8% - - 53 0.9%
Total 107,481 100.0% 88,577 100.0% 11,463 100.0% 6,678 100.0% 365 100.0% 6,116 100.0%
Table 15.29
Cancer of the Lung and Bronchus (Invasive)
Percent Distribution and Counts by Histology among Histologically Confirmed Cases, 2004-2008Males by Race

SEE
R C
ancer Statistics Review
1975-2008N
ational Cancer Institute
Source: SEER 17 areas (San Francisco, Connecticut, Detroit, Hawaii, Iowa, New Mexico, Seattle, Utah, Atlanta, San Jose-Monterey,Los Angeles, Alaska Native Registry, Rural Georgia, California excluding SF/SJM/LA, Kentucky, Louisiana and New Jersey).Percents may not sum to 100 due to rounding.
a Excludes Kaposi Sarcoma, mesothelioma, lymphomas, leukemias, myelomas, lymphoreticular, and immunoproliferative diseases.b Estimates for American Indian/Alaska Native are based on the CHSDA(Contract Health Service Delivery Area) counties.c Hispanic is not mutually exclusive from whites, blacks, Asian/Pacific Islanders, and American Indians/Alaska Natives.
Underlying incidence data for Hispanics are based on NHIA and exclude cases from the Alaska Native Registry.d Non-small cell includes histologies 8010-8015, 8020-8022, 8030-8040, 8046, 8050-8052, 8070-8084, 8090-8110, 8120-8131,
8140-8156, 8160-8162, 8170-8175, 8180, 8190-8221, 8230-8231, 8240-8263, 8270-8280, 8290-8337, 8340-8347, 8350-8390, 8400-8562,8570-8576, 8580-8671, 8940-8941.
e Squamous and transitional cell includes histologies 8051-8052, 8070-8084, 8120-8131.f Adenocarcinoma includes histologies 8050, 8140-8149, 8160-8162, 8190-8221, 8250-8263, 8270-8280, 8290-8337, 8350-8390,
8400-8560, 8570-8576, 8940-8941.g Other non-small cell includes large cell carcinoma, NOS, other specified carcinomas, and unspecified carcinomas.
Other non-small cell is defined as histologies 8010, 8020-8022, 8030-8040, 8046, 8090-8110, 8150-8156, 8170-8175, 8180,8230-8231, 8240-8249, 8340-8347, 8561-8562, 8580-8671.
h Sarcoma includes histologies 8680-8713, 8800-8921, 8990-8991, 9040-9044, 9120-9136, 9150-9252, 9370-9373, 9540-9582.i Other specific types includes melanomas and is defined as histologies 8720-8790, 8930-8936, 8950-8983, 9000-9030, 9060-9110,
9260-9365, 9380-9539.- Statistic not shown due to fewer than 16 cases during the time period.
Asian/Pacific American Indian/All Races White Black Islander Alaska Nativeb Hispanicc
Histologya Count Percent Count Percent Count Percent Count Percent Count Percent Count Percent
Carcinoma 93,811 98.9% 79,590 98.9% 8,870 99.0% 4,654 99.2% 355 98.3% 5,065 98.4%
Small cell (8041-8045) 13,753 14.5% 12,301 15.3% 1,039 11.6% 296 6.3% 75 20.8% 590 11.5%
Non-small celld 80,058 84.4% 67,289 83.6% 7,831 87.4% 4,358 92.9% 280 77.6% 4,475 87.0%
Squamous and 15,032 15.9% 12,857 16.0% 1,651 18.4% 419 8.9% 70 19.4% 649 12.6%
transitional celle
Adenocarcinomaf 40,232 42.4% 33,484 41.6% 3,648 40.7% 2,839 60.5% 105 29.1% 2,400 46.6%
Large cell (8011-8015) 2,536 2.7% 2,111 2.6% 304 3.4% 102 2.2% - - 131 2.5%
Other non-small cellg 22,258 23.5% 18,837 23.4% 2,228 24.9% 998 21.3% 95 26.3% 1,295 25.2%
Sarcomah 147 0.2% 126 0.2% - - - - - - 16 0.3%
Other specified typesi 69 0.1% 60 0.1% - - - - - - - -
Unspecified (8000-8005) 795 0.8% 693 0.9% 65 0.7% 32 0.7% - - 56 1.1%
Total 94,822 100.0% 80,469 100.0% 8,956 100.0% 4,692 100.0% 361 100.0% 5,146 100.0%
Table 15.30
Cancer of the Lung and Bronchus (Invasive)
Percent Distribution and Counts by Histology among Histologically Confirmed Cases, 2004-2008Females by Race
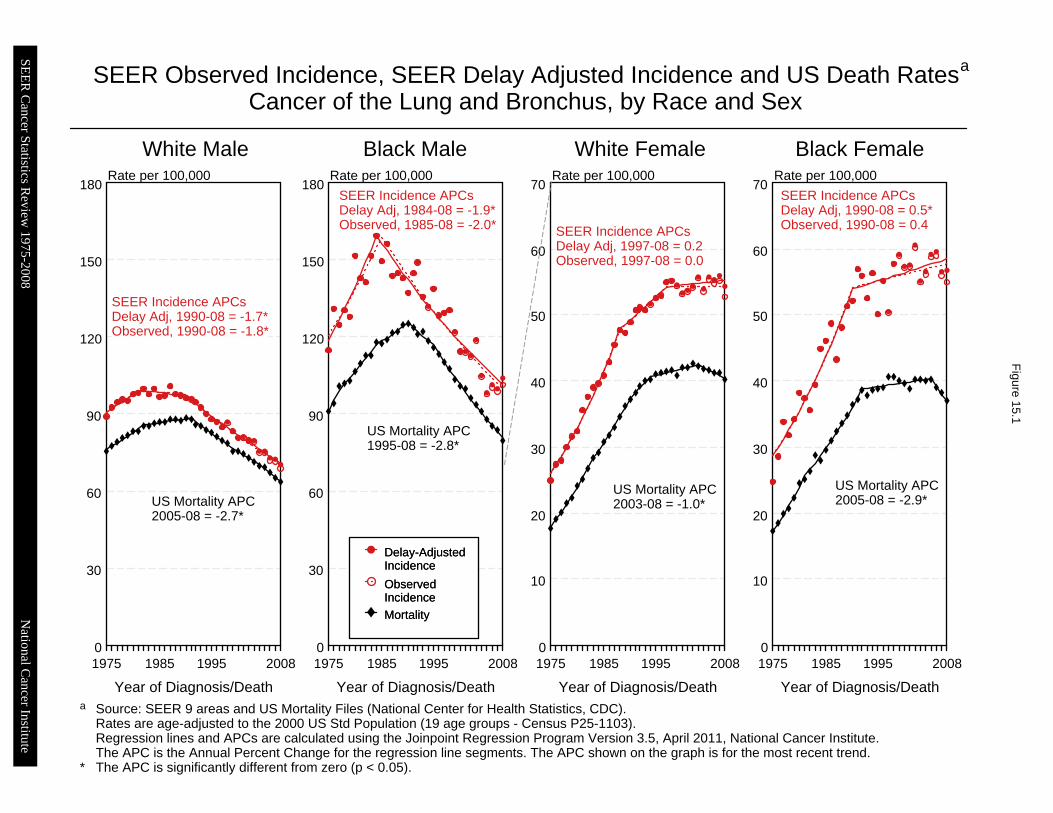
0
30
60
90
120
150
180
1975 1985 1995 20080
30
60
90
120
150
180
1975 1985 1995 20080
10
20
30
40
50
60
70
1975 1985 1995 20080
10
20
30
40
50
60
70
1975 1985 1995 2008
Delay-AdjustedIncidenceDelay-AdjustedIncidence
ObservedIncidenceObservedIncidenceMortalityMortality
SEER Observed Incidence, SEER Delay Adjusted Incidence and US Death RatesCancer of the Lung and Bronchus, by Race and Sex
a
Figure 15.1
Source: SEER 9 areas and US Mortality Files (National Center for Health Statistics, CDC).Rates are age-adjusted to the 2000 US Std Population (19 age groups - Census P25-1103).Regression lines and APCs are calculated using the Joinpoint Regression Program Version 3.5, April 2011, National Cancer Institute.The APC is the Annual Percent Change for the regression line segments. The APC shown on the graph is for the most recent trend.The APC is significantly different from zero (p < 0.05).
a
*
White Male Black Male White Female Black FemaleRate per 100,000 Rate per 100,000 Rate per 100,000 Rate per 100,000
Year of Diagnosis/Death Year of Diagnosis/Death Year of Diagnosis/Death Year of Diagnosis/Death
SEER Incidence APCsDelay Adj, 1990-08 = -1.7*Observed, 1990-08 = -1.8*
US Mortality APC2005-08 = -2.7*
SEER Incidence APCsDelay Adj, 1984-08 = -1.9*Observed, 1985-08 = -2.0*
US Mortality APC1995-08 = -2.8*
SEER Incidence APCsDelay Adj, 1997-08 = 0.2Observed, 1997-08 = 0.0
US Mortality APC2003-08 = -1.0*
SEER Incidence APCsDelay Adj, 1990-08 = 0.5*Observed, 1990-08 = 0.4
US Mortality APC2005-08 = -2.9*
SEE
R C
ancer Statistics Review
1975-2008N
ational Cancer Institute
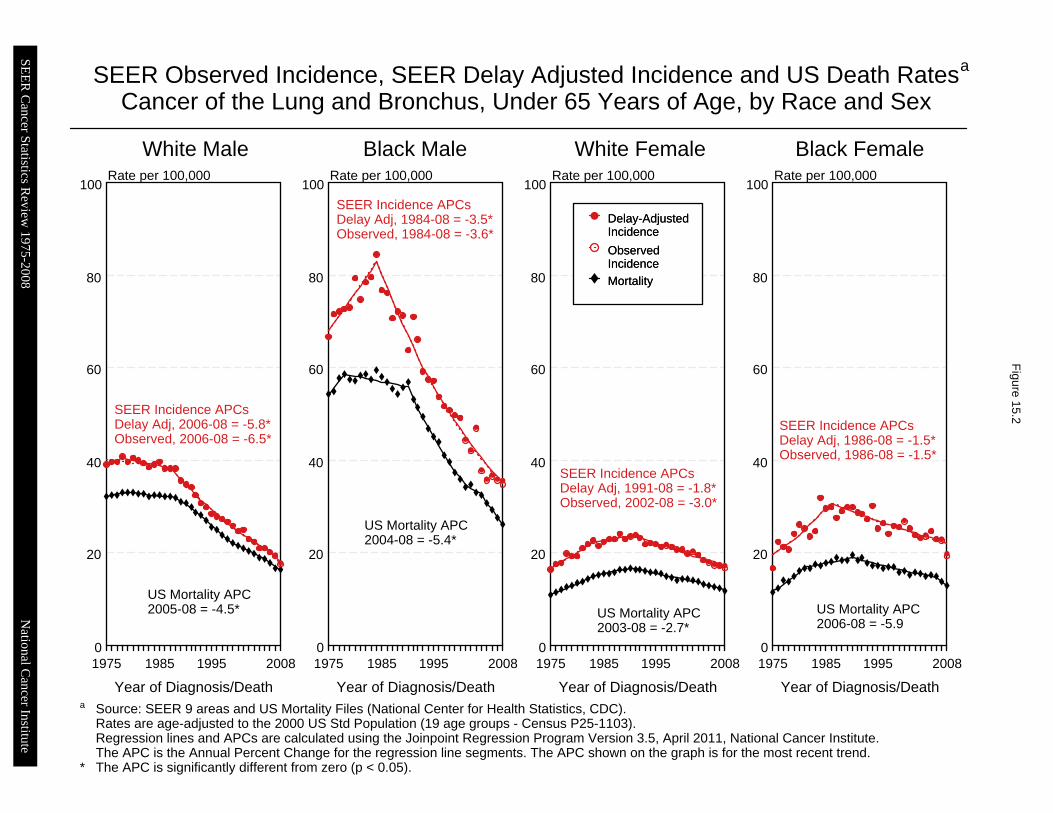
0
20
40
60
80
100
1975 1985 1995 20080
20
40
60
80
100
1975 1985 1995 20080
20
40
60
80
100
1975 1985 1995 20080
20
40
60
80
100
1975 1985 1995 2008
Delay-AdjustedIncidenceDelay-AdjustedIncidence
ObservedIncidenceObservedIncidenceMortalityMortality
SEER Observed Incidence, SEER Delay Adjusted Incidence and US Death RatesCancer of the Lung and Bronchus, Under 65 Years of Age, by Race and Sex
a
Figure 15.2
Source: SEER 9 areas and US Mortality Files (National Center for Health Statistics, CDC).Rates are age-adjusted to the 2000 US Std Population (19 age groups - Census P25-1103).Regression lines and APCs are calculated using the Joinpoint Regression Program Version 3.5, April 2011, National Cancer Institute.The APC is the Annual Percent Change for the regression line segments. The APC shown on the graph is for the most recent trend.The APC is significantly different from zero (p < 0.05).
a
*
White Male Black Male White Female Black FemaleRate per 100,000 Rate per 100,000 Rate per 100,000 Rate per 100,000
Year of Diagnosis/Death Year of Diagnosis/Death Year of Diagnosis/Death Year of Diagnosis/Death
SEER Incidence APCsDelay Adj, 2006-08 = -5.8*Observed, 2006-08 = -6.5*
US Mortality APC2005-08 = -4.5*
SEER Incidence APCsDelay Adj, 1984-08 = -3.5*Observed, 1984-08 = -3.6*
US Mortality APC2004-08 = -5.4*
SEER Incidence APCsDelay Adj, 1991-08 = -1.8*Observed, 2002-08 = -3.0*
US Mortality APC2003-08 = -2.7*
SEER Incidence APCsDelay Adj, 1986-08 = -1.5*Observed, 1986-08 = -1.5*
US Mortality APC2006-08 = -5.9
SEE
R C
ancer Statistics Review
1975-2008N
ational Cancer Institute
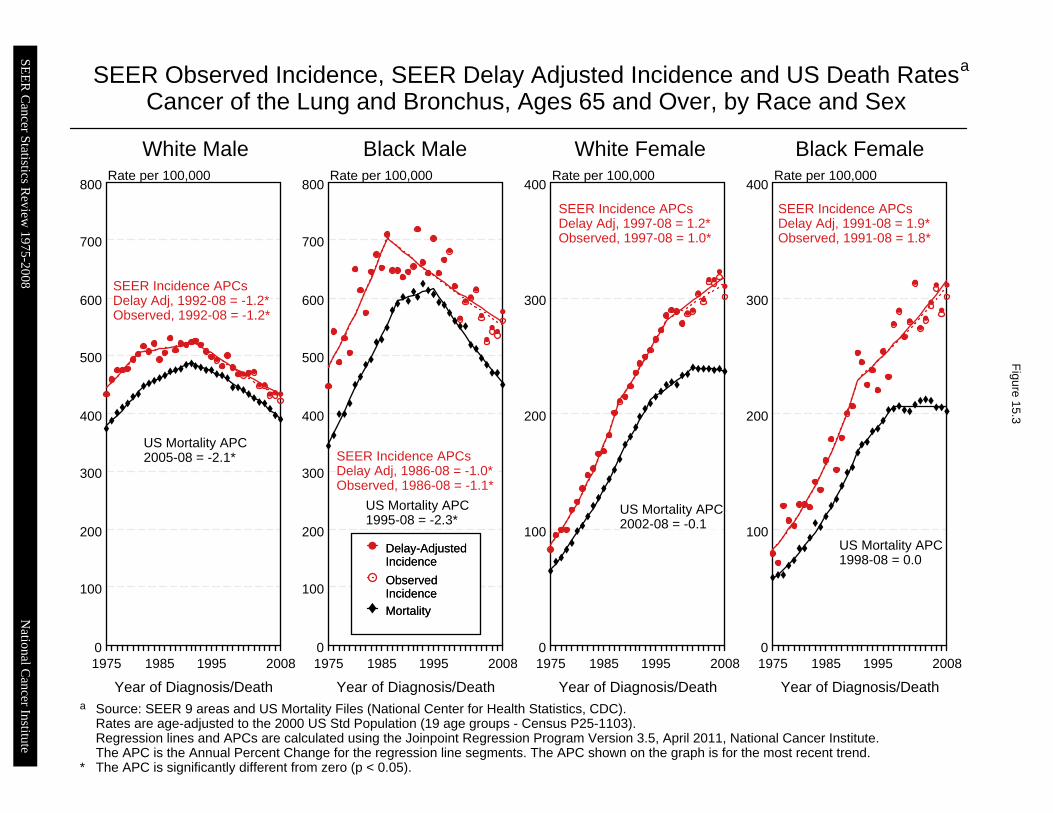
0
100
200
300
400
500
600
700
800
1975 1985 1995 20080
100
200
300
400
500
600
700
800
1975 1985 1995 20080
100
200
300
400
1975 1985 1995 20080
100
200
300
400
1975 1985 1995 2008
Delay-AdjustedIncidenceDelay-AdjustedIncidence
ObservedIncidenceObservedIncidenceMortalityMortality
SEER Observed Incidence, SEER Delay Adjusted Incidence and US Death RatesCancer of the Lung and Bronchus, Ages 65 and Over, by Race and Sex
a
Figure 15.3
Source: SEER 9 areas and US Mortality Files (National Center for Health Statistics, CDC).Rates are age-adjusted to the 2000 US Std Population (19 age groups - Census P25-1103).Regression lines and APCs are calculated using the Joinpoint Regression Program Version 3.5, April 2011, National Cancer Institute.The APC is the Annual Percent Change for the regression line segments. The APC shown on the graph is for the most recent trend.The APC is significantly different from zero (p < 0.05).
a
*
White Male Black Male White Female Black FemaleRate per 100,000 Rate per 100,000 Rate per 100,000 Rate per 100,000
Year of Diagnosis/Death Year of Diagnosis/Death Year of Diagnosis/Death Year of Diagnosis/Death
SEER Incidence APCsDelay Adj, 1992-08 = -1.2*Observed, 1992-08 = -1.2*
US Mortality APC2005-08 = -2.1* SEER Incidence APCs
Delay Adj, 1986-08 = -1.0*Observed, 1986-08 = -1.1*
US Mortality APC1995-08 = -2.3*
SEER Incidence APCsDelay Adj, 1997-08 = 1.2*Observed, 1997-08 = 1.0*
US Mortality APC2002-08 = -0.1
SEER Incidence APCsDelay Adj, 1991-08 = 1.9*Observed, 1991-08 = 1.8*
US Mortality APC1998-08 = 0.0
SEE
R C
ancer Statistics Review
1975-2008N
ational Cancer Institute
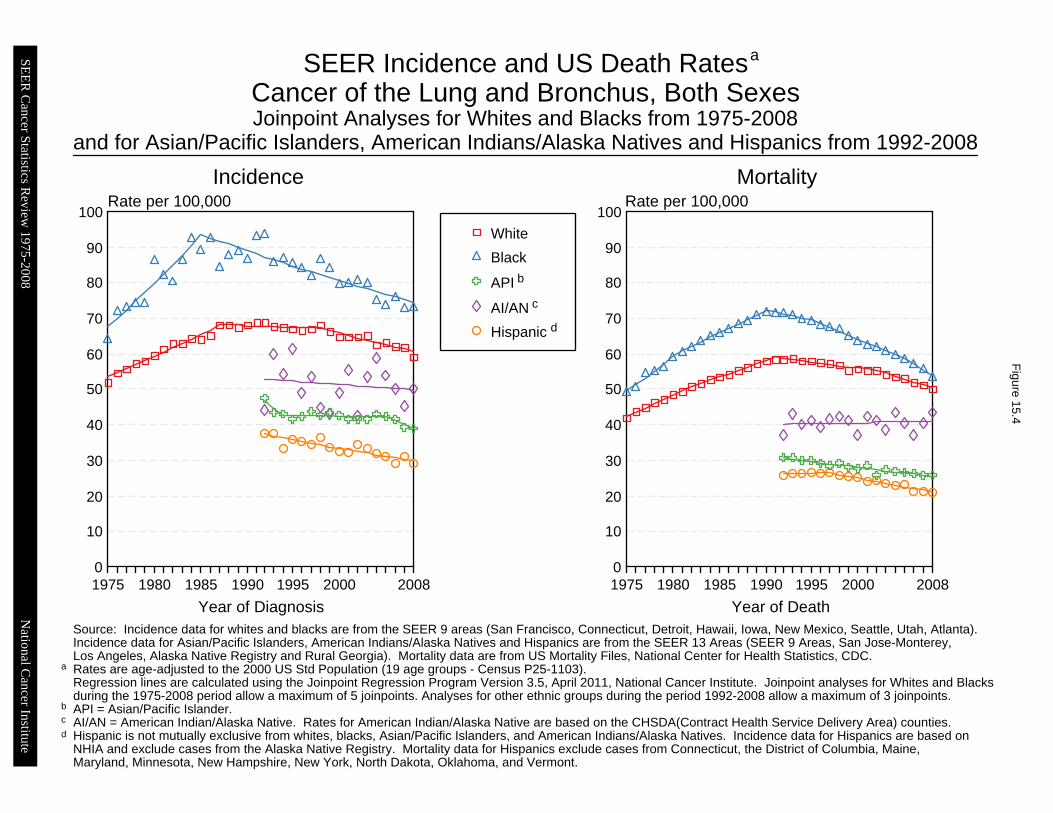
Joinpoint Analyses for Whites and Blacks from 1975-2008and for Asian/Pacific Islanders, American Indians/Alaska Natives and Hispanics from 1992-2008
0
10
20
30
40
50
60
70
80
90
100
1975 1980 1985 1990 1995 2000 20080
10
20
30
40
50
60
70
80
90
100
1975 1980 1985 1990 1995 2000 2008
White
Black
API
AI/AN
Hispanic
SEER Incidence and US Death RatesCancer of the Lung and Bronchus, Both Sexes
Figure 15.4
Source: Incidence data for whites and blacks are from the SEER 9 areas (San Francisco, Connecticut, Detroit, Hawaii, Iowa, New Mexico, Seattle, Utah, Atlanta). Incidence data for Asian/Pacific Islanders, American Indians/Alaska Natives and Hispanics are from the SEER 13 Areas (SEER 9 Areas, San Jose-Monterey,Los Angeles, Alaska Native Registry and Rural Georgia). Mortality data are from US Mortality Files, National Center for Health Statistics, CDC.Rates are age-adjusted to the 2000 US Std Population (19 age groups - Census P25-1103). Regression lines are calculated using the Joinpoint Regression Program Version 3.5, April 2011, National Cancer Institute. Joinpoint analyses for Whites and Blacksduring the 1975-2008 period allow a maximum of 5 joinpoints. Analyses for other ethnic groups during the period 1992-2008 allow a maximum of 3 joinpoints.API = Asian/Pacific Islander.AI/AN = American Indian/Alaska Native. Rates for American Indian/Alaska Native are based on the CHSDA(Contract Health Service Delivery Area) counties.Hispanic is not mutually exclusive from whites, blacks, Asian/Pacific Islanders, and American Indians/Alaska Natives. Incidence data for Hispanics are based onNHIA and exclude cases from the Alaska Native Registry. Mortality data for Hispanics exclude cases from Connecticut, the District of Columbia, Maine,Maryland, Minnesota, New Hampshire, New York, North Dakota, Oklahoma, and Vermont.
Incidence MortalityRate per 100,000 Rate per 100,000
Year of Diagnosis Year of Death
a
d
a
b
c
cb
d
SEE
R C
ancer Statistics Review
1975-2008N
ational Cancer Institute
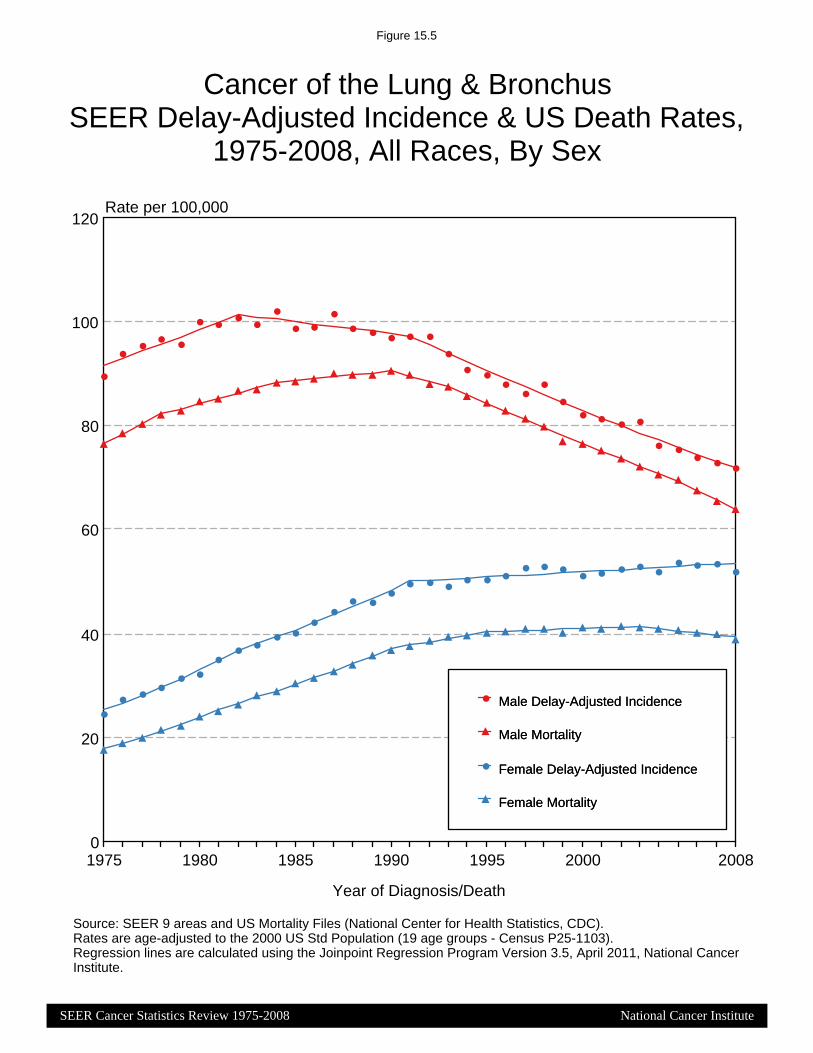
0
20
40
60
80
100
120
1975 1980 1985 1990 1995 2000 2008
Cancer of the Lung & BronchusSEER Delay-Adjusted Incidence & US Death Rates,
1975-2008, All Races, By Sex
Figure 15.5
Male Delay-Adjusted IncidenceMale Delay-Adjusted Incidence
Male MortalityMale Mortality
Female Delay-Adjusted IncidenceFemale Delay-Adjusted Incidence
Female MortalityFemale Mortality
Source: SEER 9 areas and US Mortality Files (National Center for Health Statistics, CDC).Rates are age-adjusted to the 2000 US Std Population (19 age groups - Census P25-1103).Regression lines are calculated using the Joinpoint Regression Program Version 3.5, April 2011, National CancerInstitute.
Rate per 100,000
Year of Diagnosis/Death
SEER Cancer Statistics Review 1975-2008 National Cancer Institute
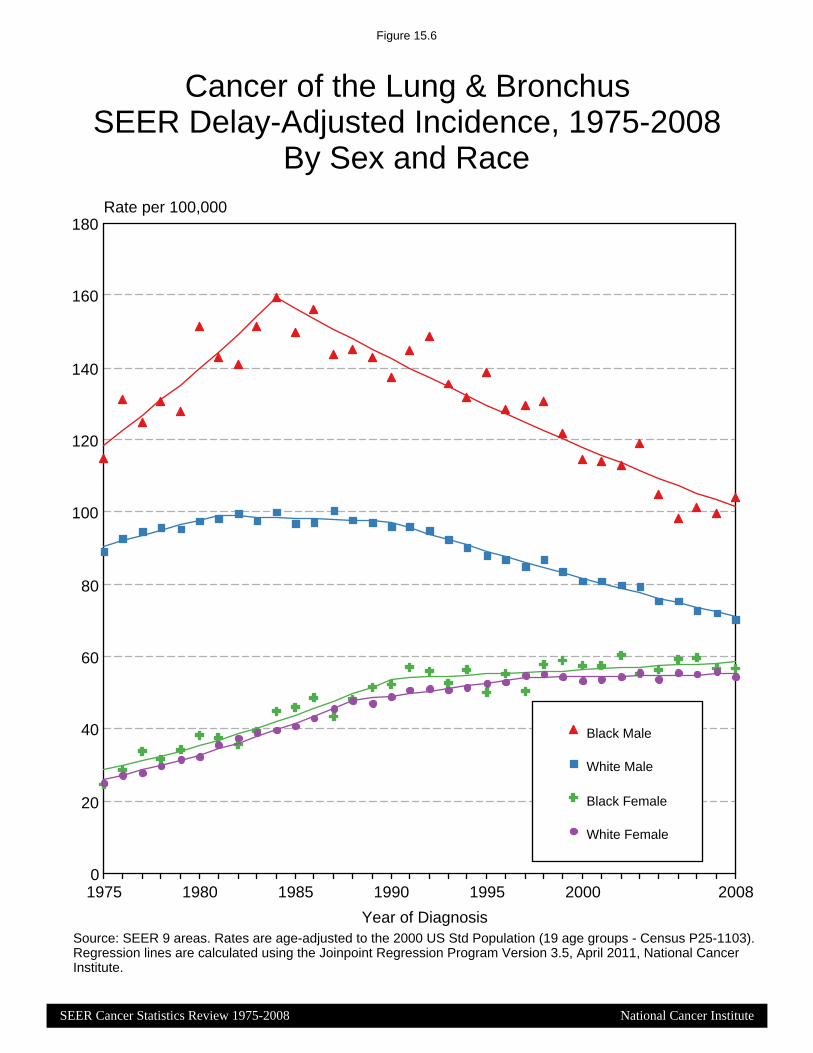
0
20
40
60
80
100
120
140
160
180
1975 1980 1985 1990 1995 2000 2008
Cancer of the Lung & BronchusSEER Delay-Adjusted Incidence, 1975-2008
By Sex and Race
Figure 15.6
Black Male
White Male
Black Female
White Female
Source: SEER 9 areas. Rates are age-adjusted to the 2000 US Std Population (19 age groups - Census P25-1103).Regression lines are calculated using the Joinpoint Regression Program Version 3.5, April 2011, National CancerInstitute.
Rate per 100,000
Year of Diagnosis
SEER Cancer Statistics Review 1975-2008 National Cancer Institute
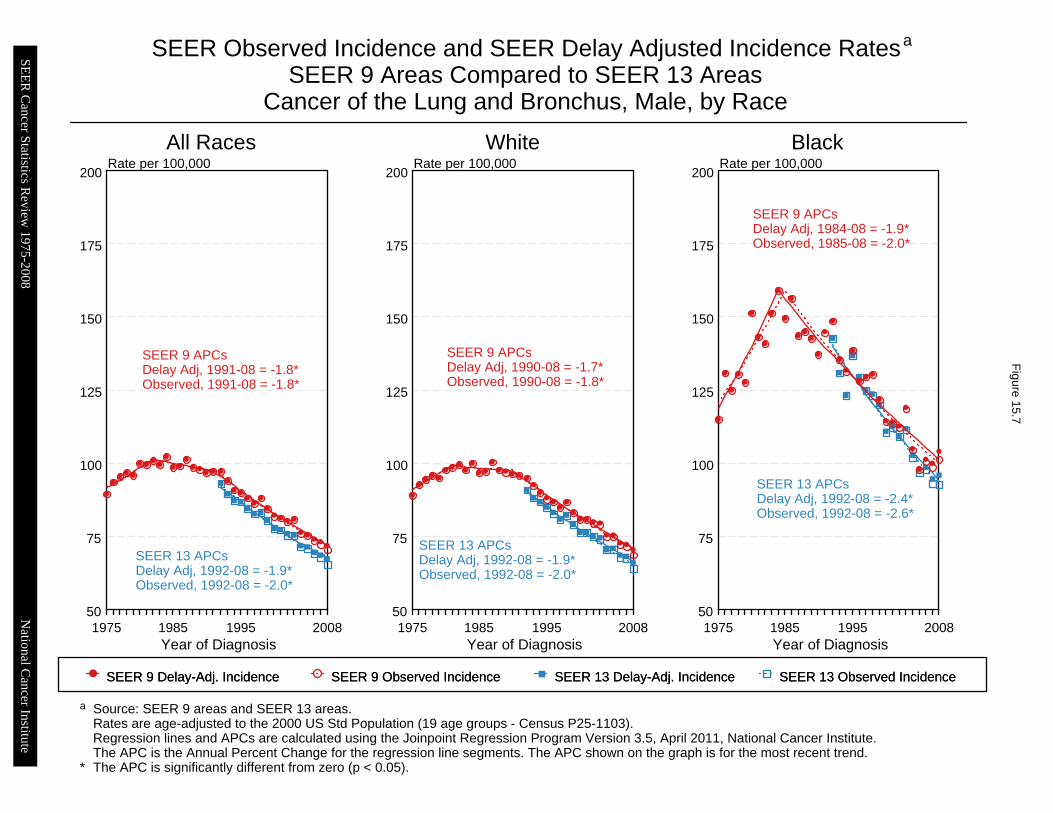
50
75
100
125
150
175
200
1975 1985 1995 200850
75
100
125
150
175
200
1975 1985 1995 200850
75
100
125
150
175
200
1975 1985 1995 2008
SEER 9 Delay-Adj. IncidenceSEER 9 Delay-Adj. Incidence SEER 9 Observed IncidenceSEER 9 Observed Incidence SEER 13 Delay-Adj. IncidenceSEER 13 Delay-Adj. Incidence SEER 13 Observed IncidenceSEER 13 Observed Incidence
SEER Observed Incidence and SEER Delay Adjusted Incidence RatesSEER 9 Areas Compared to SEER 13 Areas
Cancer of the Lung and Bronchus, Male, by Race
aF
igure 15.7
Source: SEER 9 areas and SEER 13 areas.Rates are age-adjusted to the 2000 US Std Population (19 age groups - Census P25-1103).Regression lines and APCs are calculated using the Joinpoint Regression Program Version 3.5, April 2011, National Cancer Institute.The APC is the Annual Percent Change for the regression line segments. The APC shown on the graph is for the most recent trend.The APC is significantly different from zero (p < 0.05).
a
*
All Races White BlackRate per 100,000 Rate per 100,000 Rate per 100,000
Year of Diagnosis Year of Diagnosis Year of Diagnosis
SEER 9 APCsDelay Adj, 1991-08 = -1.8*Observed, 1991-08 = -1.8*
SEER 13 APCsDelay Adj, 1992-08 = -1.9*Observed, 1992-08 = -2.0*
SEER 9 APCsDelay Adj, 1990-08 = -1.7*Observed, 1990-08 = -1.8*
SEER 13 APCsDelay Adj, 1992-08 = -1.9*Observed, 1992-08 = -2.0*
SEER 9 APCsDelay Adj, 1984-08 = -1.9*Observed, 1985-08 = -2.0*
SEER 13 APCsDelay Adj, 1992-08 = -2.4*Observed, 1992-08 = -2.6*
SEE
R C
ancer Statistics Review
1975-2008N
ational Cancer Institute
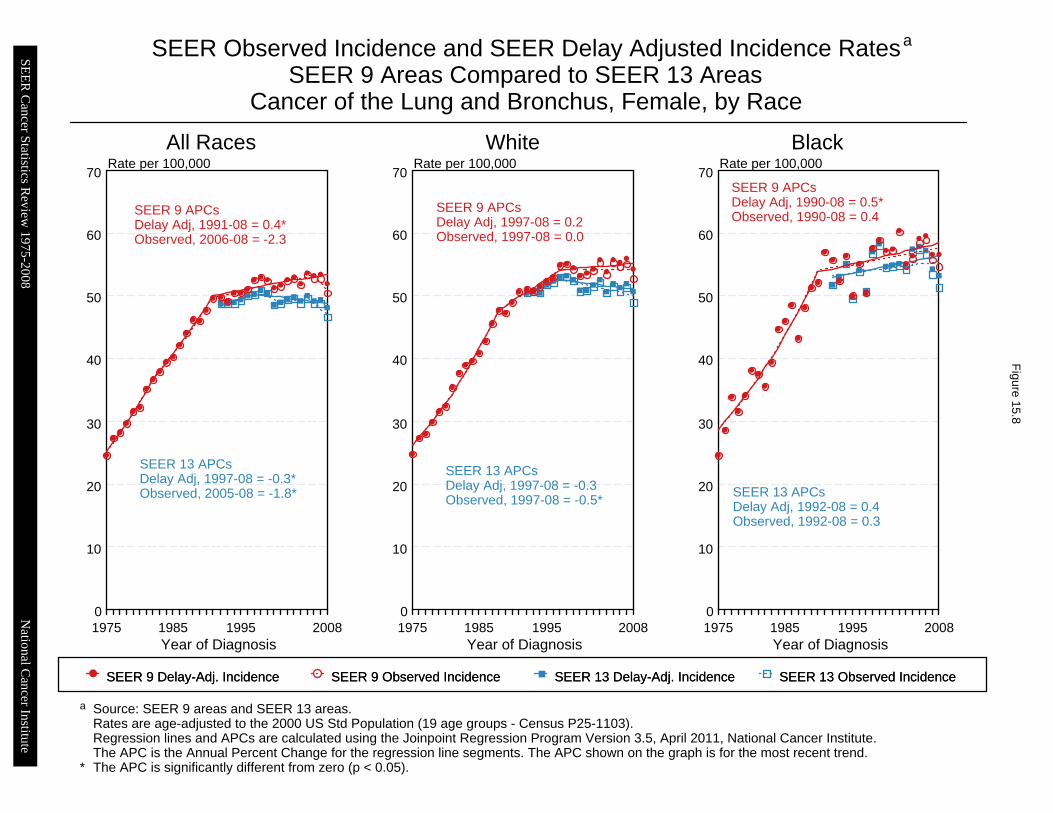
0
10
20
30
40
50
60
70
1975 1985 1995 20080
10
20
30
40
50
60
70
1975 1985 1995 20080
10
20
30
40
50
60
70
1975 1985 1995 2008
SEER 9 Delay-Adj. IncidenceSEER 9 Delay-Adj. Incidence SEER 9 Observed IncidenceSEER 9 Observed Incidence SEER 13 Delay-Adj. IncidenceSEER 13 Delay-Adj. Incidence SEER 13 Observed IncidenceSEER 13 Observed Incidence
SEER Observed Incidence and SEER Delay Adjusted Incidence RatesSEER 9 Areas Compared to SEER 13 Areas
Cancer of the Lung and Bronchus, Female, by Race
aF
igure 15.8
Source: SEER 9 areas and SEER 13 areas.Rates are age-adjusted to the 2000 US Std Population (19 age groups - Census P25-1103).Regression lines and APCs are calculated using the Joinpoint Regression Program Version 3.5, April 2011, National Cancer Institute.The APC is the Annual Percent Change for the regression line segments. The APC shown on the graph is for the most recent trend.The APC is significantly different from zero (p < 0.05).
a
*
All Races White BlackRate per 100,000 Rate per 100,000 Rate per 100,000
Year of Diagnosis Year of Diagnosis Year of Diagnosis
SEER 9 APCsDelay Adj, 1991-08 = 0.4*Observed, 2006-08 = -2.3
SEER 13 APCsDelay Adj, 1997-08 = -0.3*Observed, 2005-08 = -1.8*
SEER 9 APCsDelay Adj, 1997-08 = 0.2Observed, 1997-08 = 0.0
SEER 13 APCsDelay Adj, 1997-08 = -0.3Observed, 1997-08 = -0.5*
SEER 9 APCsDelay Adj, 1990-08 = 0.5*Observed, 1990-08 = 0.4
SEER 13 APCsDelay Adj, 1992-08 = 0.4Observed, 1992-08 = 0.3
SEE
R C
ancer Statistics Review
1975-2008N
ational Cancer Institute
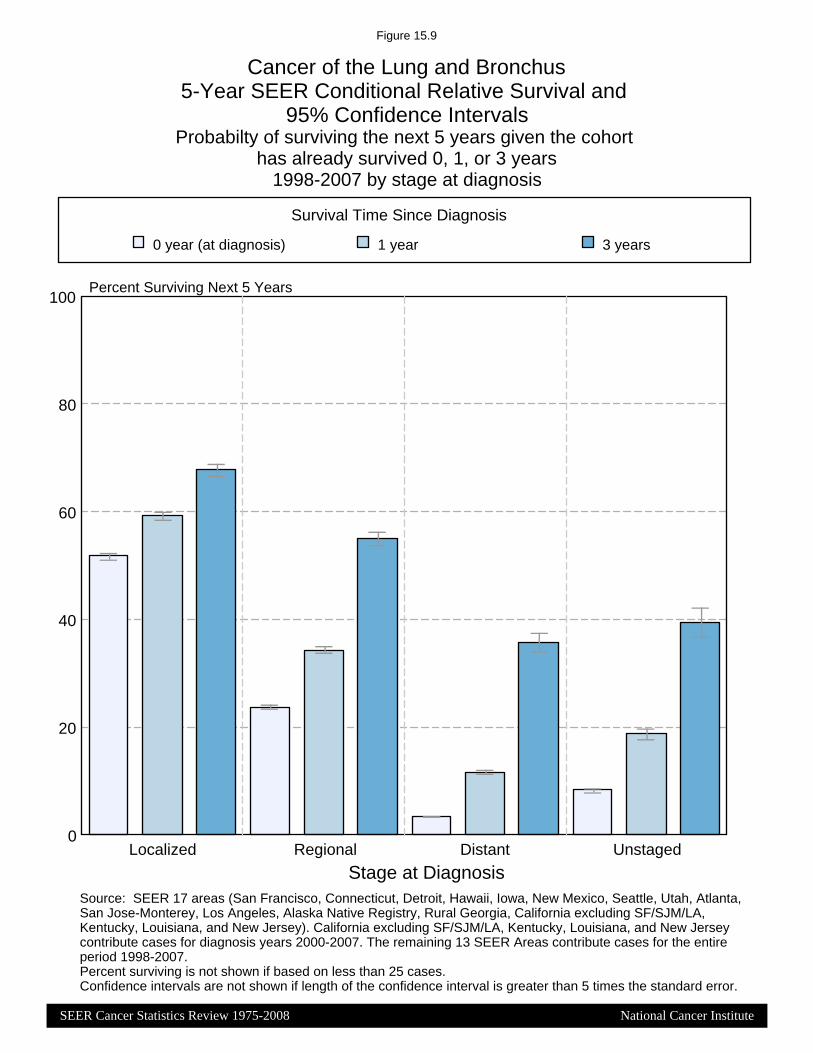
Figure 15.9
Cancer of the Lung and Bronchus5-Year SEER Conditional Relative Survival and
95% Confidence Intervals
Source: SEER 17 areas (San Francisco, Connecticut, Detroit, Hawaii, Iowa, New Mexico, Seattle, Utah, Atlanta,San Jose-Monterey, Los Angeles, Alaska Native Registry, Rural Georgia, California excluding SF/SJM/LA,Kentucky, Louisiana, and New Jersey). California excluding SF/SJM/LA, Kentucky, Louisiana, and New Jerseycontribute cases for diagnosis years 2000-2007. The remaining 13 SEER Areas contribute cases for the entireperiod 1998-2007.Percent surviving is not shown if based on less than 25 cases.Confidence intervals are not shown if length of the confidence interval is greater than 5 times the standard error.
0
20
40
60
80
100Percent Surviving Next 5 Years
Stage at Diagnosis
Probabilty of surviving the next 5 years given the cohort
has already survived 0, 1, or 3 years1998-2007 by stage at diagnosis
Survival Time Since Diagnosis
Localized Regional Distant Unstaged
0 year (at diagnosis) 1 year 3 years
SEER Cancer Statistics Review 1975-2008 National Cancer Institute