Embed Size (px)
Citation preview
ORIGINAL RESEARCHpublished: 27 March 2015
doi: 10.3389/fnhum.2015.00152
Frontiers in Human Neuroscience | www.frontiersin.org 1 March 2015 | Volume 9 | Article 152
Edited by:
Alexander J. Shackman,
University of Maryland, USA
Reviewed by:
Hackjin Kim,
Korea University, South Korea
Oana Tudusciuc,
California Institute of Technology, USA
*Correspondence:
Sonia J. Bishop,
Department of Psychology,
University of California Berkeley,
3210 Tolman Hall, Berkeley,
CA 94720-1650, USA
Received: 03 January 2015
Accepted: 05 March 2015
Published: 27 March 2015
Citation:
Bishop SJ, Aguirre GK,
Nunez-Elizalde AO and Toker D (2015)
Seeing the world through non
rose-colored glasses: anxiety and the
amygdala response to blended
expressions.
Front. Hum. Neurosci. 9:152.
doi: 10.3389/fnhum.2015.00152
Seeing the world through nonrose-colored glasses: anxiety and theamygdala response to blendedexpressionsSonia J. Bishop 1, 2*, Geoffrey K. Aguirre 3, Anwar O. Nunez-Elizalde 2 and Daniel Toker 2
1Department of Psychology, University of California Berkeley, Berkeley, CA, USA, 2Helen Wills Neuroscience Institute,
University of California Berkeley, Berkeley, CA, USA, 3Department of Neurology, University of Pennsylvania, Philadelphia, PA,
USA
Anxious individuals have a greater tendency to categorize faces with ambiguous
emotional expressions as fearful (Richards et al., 2002). These behavioral findings might
reflect anxiety-related biases in stimulus representation within the human amygdala.
Here, we used functional magnetic resonance imaging (fMRI) together with a continuous
adaptation design to investigate the representation of faces from three expression
continua (surprise-fear, sadness-fear, and surprise-sadness) within the amygdala and
other brain regions implicated in face processing. Fifty-four healthy adult participants
completed a face expression categorization task. Nineteen of these participants also
viewed the same expressions presented using type 1 index 1 sequences while fMRI
data were acquired. Behavioral analyses revealed an anxiety-related categorization bias
in the surprise-fear continuum alone. Here, elevated anxiety was associated with a more
rapid transition from surprise to fear responses as a function of percentage fear in the
face presented, leading to increased fear categorizations for faces with a mid-way blend
of surprise and fear. fMRI analyses revealed that high trait anxious participants also
showed greater representational similarity, as indexed by greater adaptation of the Blood
Oxygenation Level Dependent (BOLD) signal, between 50/50 surprise/fear expression
blends and faces from the fear end of the surprise-fear continuum in both the right
amygdala and right fusiform face area (FFA). No equivalent biases were observed for
the other expression continua. These findings suggest that anxiety-related biases in
the processing of expressions intermediate between surprise and fear may be linked
to differential representation of these stimuli in the amygdala and FFA. The absence of
anxiety-related biases for the sad-fear continuum might reflect intermediate expressions
from the surprise-fear continuum being most ambiguous in threat-relevance.
Keywords: fMRI adaptation, expression, amygdala, anxiety, fear, ambiguity, face processing, representation
Introduction
Facial expressions are important social cues. They signal emotional state and can act as warn-ing signals that threat is imminent. A stranger with a look of fear may indicate a threatthat you have not seen, or that they have perceived your behavior as aggression. In either
Bishop et al. Anxiety and amygdala adaptation for expressions
scenario, detecting and evaluating that signal is of clear impor-tance. The amygdala has been proposed to be the neural locusof the rapid processing of potential threat cues including fearfulexpressions (Vuilleumier et al., 2001; Öhman, 2005).
There can be uncertainty in whether a given stimulus sig-nals the presence of threat. High trait anxious individuals showan increased tendency to interpret ambiguous stimuli as threat-related (Bishop, 2007). Early demonstrations of this used textwhere both a “threat” and a “neutral” meaning was available(Mathews and MacLeod, 1994). Extending this work, Richardsand colleagues examined the categorization of blended emotionalexpressions created by morphing between exemplars of basicemotions (Richards et al., 2002). They observed that high traitanxious individuals made more fear categorizations than lowanxious participants for expression blends that contained 50%or higher proportion of fear, plus 50% or lower of surprise orsadness. Biases were not observed for other negative expressionblends (e.g., anger/sadness) or for blends of surprise and happi-ness. Based on these results, they hypothesized that categoriza-tion biases for expressions containing fear might reflect increasedamygdala responses to such stimuli in anxious individuals.
The current study examined whether trait anxiety is indeedassociated with altered representation in the amygdala of expres-sions containing fear. A functional magnetic resonance imaging(fMRI) “continuous carry-over” adaptation paradigm (Aguirre,2007; Harris and Aguirre, 2010) was used to examine the rep-resentation of pure (sad, fear, surprise) and blended expressionswithin the amygdala. The principle behind fMRI adaptationis that if a given brain region codes for a particular stimu-lus attribute, then a decrease in brain activity, as indexed bythe Blood Oxygenation Level Dependent (BOLD) signal, will beobserved as a function of whether two sequentially viewed stimulishare this attribute (Grill-Spector et al., 2006). Similarly, “releasefrom adaptation,” as indexed by an increase in BOLD signal, isexpected to occur as a function of the extent to which two sequen-tially viewed stimuli differ in regards to the attribute in question.In the fMRI adaptation design most classically used, each trialinvolves close sequential presentation of two stimuli, for exampletwo faces. The first stimulus in each pair is kept constant acrossconditions and the second stimulus is varied. In face adaptationstudies, “control” trials typically consist of two identical faces,while in other conditions the second face differs from the firstin identity, expression, viewpoint, or another attribute of interest(Winston et al., 2004; Xu and Biederman, 2010). The extent towhich BOLD activity is elevated on trials where the second facediffers from the first in a given attribute (identity, expression etc.)relative to control trials, where the two faces are identical, givesa measure of release from adaptation as a function of change inthat particular attribute, and as such is argued to indicate that theregion or voxel examined is sensitive to the attribute in question.The continuous carry-over adaptation paradigm (Aguirre, 2007)differs from the classic approach as follows. Most importantly,stimuli are not presented in pairs but rather as a single long rapidsequence of trials typically separated by no more than a second,with null trials interspersed. A second key feature of the designis that a “type 1 index 1” trial sequence is used—this permutestrial order such that every trial type follows every other trial type
(and itself) equally often (Finney and Outhwaite, 1956; Aguirre,2007). As a result, it is possible to independently model the BOLDactivity to each stimulus as a function of not only what it is(the “direct” effect), but also how it differs in terms of a givenfeature from the stimulus that preceded it (the “adaptation” or“carry-over” effect). This makes it possible to take advantage of,rather than have to control for, prior stimulus effects, and to usean extremely rapid sequence of presentation. By such means, itis possible to examine how adaptation varies as a function ofchanges along the feature dimension of interest. This in turn facil-itates examination of the similarity, or dissimilarity, with whichstimuli that differ in some attribute (e.g., percentage of fear in theexpression viewed) are represented in a given brain region.
Here, we used a continuous carry over design to test theprediction that high trait anxious participants would show abias in representation of intermediate expression morphs con-taining fear. Specifically, we tested the hypothesis that hightrait anxious individuals would show greater adaptation ofthe amygdala BOLD signal—indicative of greater representa-tional similarity—for transitions between 50/50 fear/surprise orfear/sadness morphs and expressions predominantly (66–100%)containing fear than between these 50/50 morphs and expres-sions predominantly (66–100%) containing surprise or sadness,respectively. In the study by Richards and colleagues, results fromfear-surprise and fear-sad continua were collapsed. Hence oursecondary aim was to determine whether biases in categoriza-tion behavior and fMRI adaptation effects would be observed inboth or just one of these continua. Our third aim was to estab-lish whether anxiety-related differences in categorization perfor-mance and amygdala adaptation effects would only be observedfor expressions containing some percentage of fear or whetherdifferences would also be observed for blends between surpriseand sadness.
Materials and Methods
ParticipantsA total of 54 healthy adults participated in the study. Nine-teen participants (13 female, all right-handed, aged 19–24 years,mean age 20.5 years) completed a combined fMRI and behavioralexperimental session. An additional 35 participants (25 females,all right-handed, aged 18–36 years, mean age 20.8 years) com-pleted the behavioral task alone. Individuals with a history of psy-chiatric care, neurological disease, or head injury were excludedfrom the study, as were individuals using psychotropic drugsor with a significant history of illegal drug use. The study wasapproved by the University of California Berkeley committee forprotection of human subjects. Informed consent was obtainedfrom all participants prior to participation.
ProcedureWemeasured trait anxiety using the Spielberger State-Trait Anx-iety Inventory, Form Y (STAI; Spielberger et al., 1983). This self-report questionnaire provides a measure of trait vulnerability toanxiety. Scores on the trait subscale are elevated in individualswho meet criteria for anxiety disorders (AD), across subtypes(Bieling et al., 1998; Chambers et al., 2004). Elevated trait anxiety
Frontiers in Human Neuroscience | www.frontiersin.org 2 March 2015 | Volume 9 | Article 152
Bishop et al. Anxiety and amygdala adaptation for expressions
scores on the STAI questionnaire have also been shown to pre-dict future AD diagnosis (Plehn and Peterson, 2002). Participantscompleted the STAI trait anxiety subscale at the beginning of theexperimental session prior to data collection. In the sample as awhole, STAI trait anxiety scores ranged from 20 to 57 (M = 39.2,SD = 8.46). In the sub-sample who completed the fMRI task,STAI trait anxiety scores ranged from 22 to 57 (M = 39.5,SD = 9.75). These scores are comparable to published normsfor this age group (Spielberger et al., 1983).
The behavioral task was conducted in a quiet testing room,the fMRI task in UC Berkeley’s 3T MRI facility. Participants whoparticipated in the combined fMRI and behavioral session com-pleted the fMRI task prior to the behavioral task with a shortbreak in between. Behavioral task only participants completedthe behavioral task immediately following administration of theSTAI.
Experimental StimuliFaces were taken from the Pictures of Facial Affect (POFA)set (Ekman and Friesen, 1976). Faces showing fearful, sad,and surprised expressions were selected for two different actors(one male, one female). These were used to construct emo-tional expression morphs for each identity. Each pair of emo-tional expressions wasmorphed separately using the Fantamorphsoftware package (Abrosoft Inc.) This yielded a continuum ofmorphed faces for each original pair of expressions: surprise-fear, sad-fear, and surprise-sad. Each continuum comprised pureexpressions at the end of each continuum (e.g., 100% fear, 0% sur-prise, and 0% fear, 100% surprise) and five intermediate blendedexpressions that differed from each other in 16.7% morph steps(e.g., 16.7% surprise, 83.3% fear; 33.3% surprise, 66.7% fear. . . 83.3% surprise, 16.7% fear), Figure 1A. The neutral expres-sions of the two actors were used as target stimuli in the fMRItask (and catch trials in the behavioral task) in order to maintainvigilance (see below) but were not involved in the construction ofany of the morph continua.
fMRI TaskStimuli were presented in an unbroken, counterbalancedsequence. This allows adaptation effects to be investigated onevery trial as a function of the difference between the current andthe previous stimulus (Aguirre, 2007). In each imaging run, par-ticipants were presented with stimuli from a single expressioncontinuum (e.g., the surprise-fear continuum). Presentation offaces from a single continuum at a time enabled us to examineadaptation effects as a function of transitions along a given con-tinuum. For each of the two identities, each of the seven levels ofexpression (100% expression A, 0% expression B, 83% expressionA, 17% expression B . . . , 0% expression A, 100% expression B)together with neutral face trials and “null” trials (blank screenonly) were presented using a “type 1 index 1” sequence of 82trials (Finney and Outhwaite, 1956; Aguirre, 2007), Figure S1.This refers to a sequence of length n2 + 1 trials where there aren conditions or trial types and there is first order counterbal-ancing, specifically each condition follows every other conditionand itself once. In addition, each of the n trial types occurs oncein pseudo-random order within each sequential set of n trials
FIGURE 1 | Task stimuli and design. (A) Three emotional expression
continua were created by morphing between sad and fearful, surprised and
sad, and surprised and fearful expressions, using six 16.7% morph steps.
These continua were created for both a male and a female actor, faces were
taken from the Pictures of Facial Affect set (Ekman and Friesen, 1976). The
actors’ neutral expressions were also used as stimuli, but not included in the
continuum construction. For the main fMRI analysis, using a categorical model,
faces were labeled according to the end of the continuum to which they
belonged (“A” or “B,” e.g., “surprise” or “fear”) with a third label being given to
“50/50” morphs that comprised equal amounts of each end expression. (B)
Within the fMRI task, participants were shown faces with expressions from one
continuum at a time, presented together with neutral faces and double length
null trials in a pseudo-random fashion using a “type 1 index 1 sequence”
(Figure S1). Participants were asked to respond by key press to presentation
of the neutral face. (C) In the behavioral task, an equivalent type 1 index 1
presentation sequence was used but participants were asked to respond to all
faces except the neutral trials, categorizing the faces as showing “mainly”
expression “A” or expression “B” for a given continuum (e.g., “mainly surprise”
or “mainly fear” for the surprise-fear continuum, as shown in the example.)
minimizing differential habituation across trial types (the onlydetectable regularity being that each new set of n trials starts withthe same trial type that the previous set finished with).
The sequence for one identity was concatenated with thesequence for the other identity with a 12 s gap in between.The second sequence was pseudo-randomized independently
Frontiers in Human Neuroscience | www.frontiersin.org 3 March 2015 | Volume 9 | Article 152
Bishop et al. Anxiety and amygdala adaptation for expressions
and was not identical in order to the first. We only usedtwo identities and did not mix identities within each sequenceto avoid confounds resulting from fluctuations in strength ofexpression between identities. Including a mixture of identitieswould also have entailed many more trials to separate effectsof identity-related adaptation from expression-related adapta-tion. Each face was presented for 1 s followed by a blankscreen for 500ms (Figure 1B). Null trials lasted for 3 s (i.e.,twice the duration of face trials, enhancing power for detec-tion of main effects; Aguirre, 2007). Participants were asked topress a button with the right index finger any time the neu-tral expression occurred (i.e., no responses were made on thetrials of interest), and to pay attention to all the facial expres-sions shown. The occurrence of neutral face trials was notpredictable, requiring participants to maintain concentration.Before the start of each imaging run, participants were shownthe target neutral faces for both identities. There were nineruns, three per expression continuum. Prior to the start of thefMRI session, participants performed short practice blocks foreach expression continuum outside the scanner. This ensuredthat participants were familiar with the facial emotional expres-sions presented during the fMRI session and with the taskitself.
Behavioral TaskVision Egg (Straw, 2008) was used for stimulus delivery, as forthe fMRI task. The task was performed on a desktop computerin a behavioral testing room, with the visual angle subtendedby the face stimuli equated to that within the fMRI task (5 × 8degrees). The stimuli used were the same as in the fMRI task,and were also presented using type 1 index 1 sequences of 82trials. However, the task performed was different. Participantswere instructed to judge the main emotion contained in the facialexpression shown on a given trial, while avoiding responding toneutral faces (i.e., here neutral face trials acted as catch trials),Figure 1C. For example, in the surprise-fear continuum, partic-ipants were asked to judge if the presented face showed “mainlysurprise” or “mainly fear.” Responses were made by key press.The emotions chosen between were mapped onto unique keys onthe keyboard (color labeled for easier task performance). Map-pings were randomized across participants. At the beginning ofeach task block, participants were told which two emotions theywould be categorizing the faces according to and reminded ofthe color of the corresponding key for each emotion. Partici-pants performed training blocks for each continuum to famil-iarize them with the task and emotion key mapping. Trials wereself-paced with participants having a maximum of 6 s to make aresponse (mean reaction time = 760ms). Neutral face catch tri-als were shown for 2 s. Null trials lasted 2 s. A blank period of4 s occurred in between the two facial identities shown in eachtask block. Participants completed six task blocks, two per expres-sion continuum. Each task block contained two sets (one peridentity) of 82 trials of faces corresponding to nine repetitionsof each of the different “morph levels” from a given continuum(plus neutral and null trials). These were presented using type 1index 1 sequences starting with a double null trial as in the fMRItask.
fMRI Data AcquisitionBlood oxygenation level dependent (BOLD) contrast functionalimages were acquired with echo-planar T2∗-weighted imaging(EPI) using a Siemens Tim Trio 3T MR system with a 12 chan-nel head coil. Each image volume consisted of 26 sequential3mm thick slices (interslice gap, 0.75mm; in-plane resolution,2.4 × 2.4mm; field of view, 234 by 234mm; matrix size, 98by 98; flip angle, 74 degrees; echo time, 33ms; repetition time,2 s). Slice acquisition was transverse oblique, angled to avoid theeyes, and provided near whole brain coverage. These acquisitionparameters were chosen to minimize voxel size while coveringall brain regions of interest. In some subjects, cerebellum andpart of motor cortex was not covered by our slice prescription.To aid co-registration, an additional eight echo-planar volumeswere acquired using the same parameters as the task data butwith an increased number of slices and adjusted TR. Data wereacquired in nine scanning runs lasting approximately 5min each.The first five volumes of each run were discarded to allow forT1 equilibration effects. A T1-weighted structural scan was alsoacquired at 1mm isotropic resolution. This was acquired prior tothe functional data.
fMRI PreprocessingData were preprocessed using Matlab version 7.3 (The Math-Works, Natick, MA) and SPM5 (Welcome Department of Imag-ing Neuroscience, London, UK). After conversion from DICOMto NIfTI format, diagnostics were run on the time series for eachimaging run. Following an approach similar to that adopted byPower et al. (2012) and Carp (2013), bad volumes (with unusuallyhigh changes in mean whole brain signal intensity) were replacedby the average of the volumes on either side. These volumes wereidentified using the SPM timeseries diagnostic tool tsdiffana.m.Among other indices, this calculates the mean square differenceof voxel-wise signal intensities, averaged across the whole vol-ume, between each volume (n) and the previous volume (n − 1)and divides this by the mean signal across the whole volume aver-aged over the whole timeseries. Volumes (both n and n− 1) wererejected using an absolute cutoff (the recommended default of 10)as this handled differences between participants in the noisinessof data better than a within-participant percentile cut off. In linewith findings by Power et al. (2012), bad volumes tended to cor-respond to those with notable spikes in movement. For each pairof volumes replaced, a “bad scan” regressor of no interest thatcoded these volumes as 1 and all other volumes as 0 was createdto model out the replaced volumes in the final analysis.
Subsequent to this initial data-cleaning step, image realign-ment (correcting for head movement) was conducted, followedby slice time correction. The subject’s T1-weighted structuralscan was aligned to their EPI data. Following this, the T1 wastransformed into standard (MNI) space using SPM5’s combinedsegmentation and normalization procedure (Ashburner and Fris-ton, 2005) and the transformation applied to the echo-planarimages. These images were resampled to 2mm isotropic voxels. Ahigh-pass filter of 180 s was used to remove low-frequency scan-ner noise. Spatially unsmoothed images were used for region ofinterest (ROI) based analyses, see below. Whole-brain voxelwiseanalyses were used to define functional ROIs implicated in face
Frontiers in Human Neuroscience | www.frontiersin.org 4 March 2015 | Volume 9 | Article 152
Bishop et al. Anxiety and amygdala adaptation for expressions
processing (also see below). For these analyses, spatial smoothingof the echoplanar images was conducted with a Gaussian kernelwith a full-width-to-half-maximum value of 6mm.
fMRI Data AnalysisThe data from each expression continuum were modeled sepa-rately. Events were modeled by a delta (impulse) function. Theregressors of interest used can be divided into those representingdirect stimulus effects (i.e., the “condition” to which the stim-ulus on a given trial (n) belonged, as commonly used in mostexperiments) and those representing “carry over” or adaptationeffects. The latter were coded in terms of the difference or dis-tance between the stimulus on the current trial (n), and the stimu-lus on the prior trial (n− 1), though the exact nature of this variedbetween the two models used (see below and Figure 2; FigureS2). A number of regressors of “non-interest” were also includedin both models to remove task-unrelated variance (noise). Thesecomprised six realignment (movement) regressors, regressorsindicating volumes where “bad scans” had been replaced by theaverage of neighboring volumes, and mean time-series extractedfrom outside-of-brain masks.
Regressors of interest were convolved with the canonicalHRF function and together with the (noise) regressors of non-interest were used to model the mean BOLD response fromright and left amygdala ROIs (defined using the Montreal Neu-rological Institute Automated Anatomical Labeling template,Tzourio-Mazoyer et al., 2002). Non-smoothed data were used;analysis was conducted with the MARSBAR ROI toolbox forSPM (Brett et al., 2002). Additional ROI analyses are reported forfunctionally defined ROIs from across the face-processing net-work (see below). While our a-priori hypotheses focused on theamygdala, the results of these additional analyses are providedfor researchers with more general interests in the differentiationof aspects of face processing across different brain regions.
Model Overview: Categorical vs. GradedThere has been much debate as to whether the perception offacial expressions is categorical or continuous in nature. Behav-iorally, the categorization of faces from expression morph con-tinua of the type used in the current study has been found tofit well with a categorical model, typically showing a sigmoidalfunction with a sharp boundary transition between judgments ofmorphed faces as showing one emotion or another (Etcoff andMagee, 1992; Calder et al., 1996; Young et al., 1997; Said et al.,2010). However, expressions further from prototypes (i.e., 100%expressions) take longer to categorize and participants can dis-criminate between exemplars categorized as showing the sameexpression (Young et al., 1997). Within the fMRI literature, it hasbeen argued that the amygdala shows categorical representationof facial expression but that other regions in the face processingnetwork may show more graded or continuous representation ofexpressions or associated changes in physical features (Said et al.,2010; Harris et al., 2012). Given the dominance of the categori-cal model in the behavioral literature combined with our primaryfocus on the amygdala, we adopted a categorical model for ourmain fMRI analyses. However, we also constructed a continuous,graded, model to enable additional examination of linear adap-tation effects as a function of “morph steps” along the expres-sion continua, this is described following the main categoricalmodel.
The Categorical ModelData from each expression continuum were modeled indepen-dently. According to a categorical model there should be asharp transition in representation of faces from expression “A”to expression “B” with little difference in representation withinexpressions labeled as “A” or “B.” In order to model a categoricalor step function, stimuli were dichotomously allocated to the endof the expression continuum to which they were closest. So, for
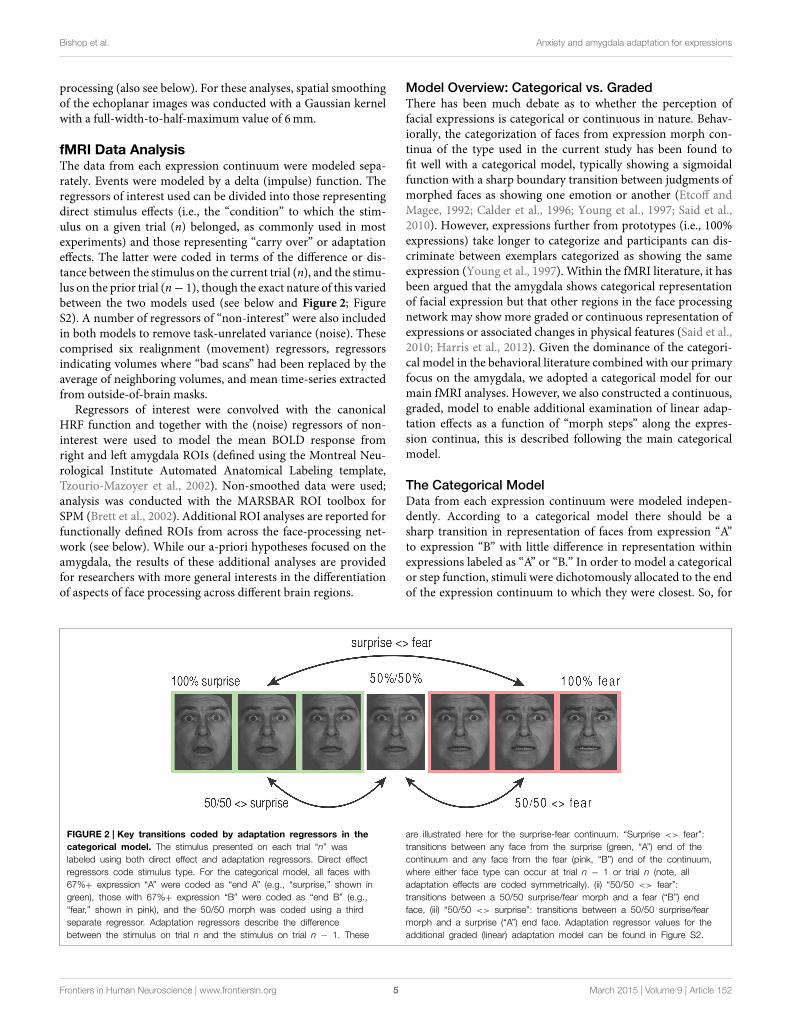
FIGURE 2 | Key transitions coded by adaptation regressors in the
categorical model. The stimulus presented on each trial “n” was
labeled using both direct effect and adaptation regressors. Direct effect
regressors code stimulus type. For the categorical model, all faces with
67%+ expression “A” were coded as “end A” (e.g., “surprise,” shown in
green), those with 67%+ expression “B” were coded as “end B” (e.g.,
“fear,” shown in pink), and the 50/50 morph was coded using a third
separate regressor. Adaptation regressors describe the difference
between the stimulus on trial n and the stimulus on trial n − 1. These
are illustrated here for the surprise-fear continuum. “Surprise <> fear”:
transitions between any face from the surprise (green, “A”) end of the
continuum and any face from the fear (pink, “B”) end of the continuum,
where either face type can occur at trial n − 1 or trial n (note, all
adaptation effects are coded symmetrically). (ii) “50/50 <> fear”:
transitions between a 50/50 surprise/fear morph and a fear (“B”) end
face, (iii) “50/50 <> surprise”: transitions between a 50/50 surprise/fear
morph and a surprise (“A”) end face. Adaptation regressor values for the
additional graded (linear) adaptation model can be found in Figure S2.
Frontiers in Human Neuroscience | www.frontiersin.org 5 March 2015 | Volume 9 | Article 152
Bishop et al. Anxiety and amygdala adaptation for expressions
example, for the surprise-fear continuum, faces with 100% sur-prise, 0% fear; 83% surprise, 17% fear; and 67% surprise, 33% fearwere allocated to the “surprise end,” and faces with 33% surprise,67% fear; 17% surprise, 83% fear; and 0% surprise, 100% fear)were allocated to the “fear end” (Figure 1A, also see Figure 2).50/50 morphs were modeled using a third direct effect regressor.The regressors of primary interest, however, were the adapta-tion regressors. For each trial “n” these encoded the nature ofthe transition from the stimulus shown on the previous trial (n− 1) to that shown on the current trial (n). There were threeprimary adaptation regressors (Figure 2). The first representedtransitions between one end of a given continuum and the other.In the surprise-fear continuum, for example, if trial “n” was a facewith 66% or greater surprise (“surprise end”) and trial n − 1 wasa face with 66% or more fear (“fear end”), or vice versa, this “sur-prise <> fear” regressor was given a “1” on trial n, otherwise itwas given a “0.” The second adaptation regressor coded transi-tions between 50/50 morphs and faces from the right-hand end“B” of a given continuum. This second regressor (e.g., “50/50<>
fear”) was also directionless, i.e., trial “n” was given a “1” for thisregressor regardless of whether it was a fear end face following a50% surprise/50% fear face or a 50% surprise/50% fear face fol-lowing a fear end face. The third adaptation regressor coded fortransitions between 50/50 morphs and faces from the left-handend “A” of a given continuum (e.g., “50/50 <> surprise” in thecase of the surprise-fear continuum).
We were interested in testing the proposal that elevated traitanxiety would be associated with a bias toward representing50/50 morphs containing fear more similarly to expressions fromthe fear end of the surprise-fear and sad-fear continua than toexpressions from the non-fear ends of these continua. If this isthe case, then individuals with high trait anxiety scores shouldshow more adaptation for 50/50 <> fear end face transitionsthan for 50/50 <> sad or surprise end face transitions for thesetwo continua.
For completeness, two additional direct effect regressors wereincluded—one modeled the occurrence of neutral face (tar-get) trials and one the occurrence of any emotional expression,regardless of type. Four additional adaptation regressors werealso included—thesemodeled direct repetitions of a given expres-sion blend, direct repetition of the neutral face, trials whereany emotional face followed a neutral face and trials where anyemotional face followed a null trial.
Graded Non-Categorical ModelSupplementary use of a graded non-categorical model allowedus to examine whether particular brain regions showed contin-ual graded representation of the expressions that made up eachmorph continuum—i.e., whether they linearly tracked changesin the stimuli, as measured in morph steps. Such a model isexpected to fit well in regions sensitive to low-level physicalchanges in face stimuli, regardless of whether these changes con-tribute to changes in percept. The Occipital Face area (OFA)—aright-lateralized region of lateral occipital cortex (Gauthier et al.,2000)—is thought to be such a region.
The graded model contained a direct effect regressor for“morph level” (0–100% in 16.7% increments or steps along the
continuum of interest). A second direct effect regressor modeledthe occurrence of neutral faces and a third the occurrence of anyface with an emotional expression. The key adaptation regres-sor coded the distance of the stimulus presented on trial n inmorph steps (in either direction) from the stimulus presented onthe previous trial (n − 1), Figure S2. Two additional adaptationregressors modeled direct repeats of a given expression blend anddirect repeats of neutral faces, two others indicated when faceswith any emotional expression followed a neutral face (emotionafter neutral) or a null trial (emotion following null).
Functional Definition of Additional ROIsImplicated in Face ProcessingRegions of interest for the Occipital Face Area (OFA), FusiformFace Area (FFA, Kanwisher et al., 1997), and Superior TemporalSulcus (STS) were functionally defined using the graded non-categorical model and contrasts orthogonal to those in whichwe were interested. Activation to presentation of any emotionalexpression, including those following null trials, but not thosefollowing neutral (target) trials, was used to define bilateral FFAand STS ROIs. Group-level maps thresholded using family-wiseerror (FWE) whole brain correction for multiple comparisons atp < 0.05 were used to identify activation clusters of interest. Tohave a similar number of voxels in each ROI, we used slightly dif-ferent thresholds for right FFA and right STS (t > 7 and t > 5.25,respectively). The right FFA cluster comprised 213 voxels withactivation peak: x, y, z: 40,−48,−18 (MNI space). The right STScluster comprised 221 voxels and had its peak at x, y, z = 56,−38,12. This contrast also yielded an activation cluster in right lateraloccipital cortex, although this was too diffuse to allow identifica-tion of a constrained region corresponding to OFA as describedin previous reports. Activation to neutral target faces vs. base-line (also an orthogonal contrast to those of interest) did howeverallow for definition of a constrained right OFA ROI that corre-sponded well to previous accounts (Pitcher et al., 2011a). Thegroup level activation map for this contrast was thresholded att > 13, giving a cluster of 224 voxels, with activation peak: x, y,z = 40,−86,−4. No clear left lateralized activation was observed,in line with prior findings indicating greater involvement of righthemisphere regions in face processing, hence these right ROIswere mirrored across the sagittal plane to create correspondingleft lateralized ROIs.
Results
Behavioral ResultsAs described above, subjects performed a two-way classificationof emotional expressions from three morph continua (surprise-fear, sad-fear, and surprise-sad). In each continuum, the faces tobe classified were morphs between exemplars of the end expres-sions (two distinct identities were used, with seven morph lev-els including the two pure end expressions, Figure 1A). Givenbehavioral effects are often smaller and noisier than fMRI effects,we combined data from participants who performed both thefMRI and behavioral task with that from participants who per-formed the behavioral task alone. This gave us a combined sample
Frontiers in Human Neuroscience | www.frontiersin.org 6 March 2015 | Volume 9 | Article 152
Bishop et al. Anxiety and amygdala adaptation for expressions
size of 54. Generalized mixed effects logistic regression analy-ses were conducted using the R lme4 package, R DevelopmentCore Team (2011), separately, for categorization data from eachexpression continuum. Covariates of interest comprised partic-ipant trait anxiety (continuous), morph “level” (0–100% expres-sion “B” in 16.7% increments) and the interaction term formorphlevel × trait anxiety. Participant ID (nominal) was additionallyentered as a random effects term. Behavioral categorization of thefaces from each continuum (as expression “A” vs. expression “B”)provided the binary dependent variable.
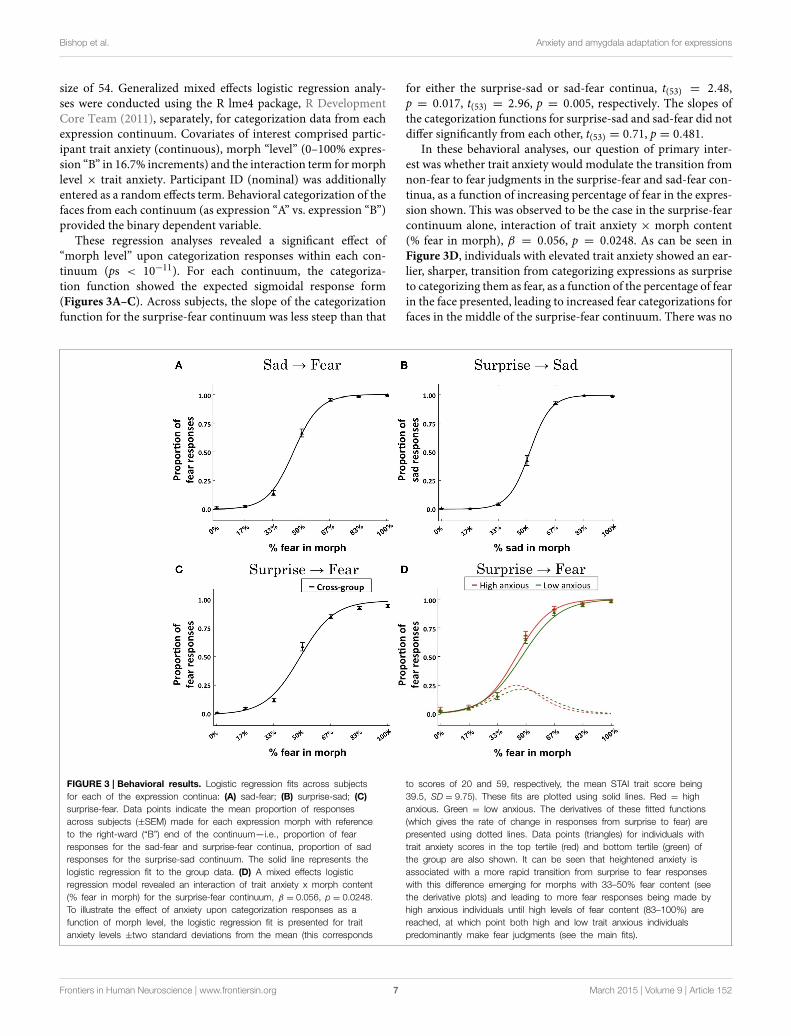
These regression analyses revealed a significant effect of“morph level” upon categorization responses within each con-tinuum (ps < 10−11). For each continuum, the categoriza-tion function showed the expected sigmoidal response form(Figures 3A–C). Across subjects, the slope of the categorizationfunction for the surprise-fear continuum was less steep than that
for either the surprise-sad or sad-fear continua, t(53) = 2.48,p = 0.017, t(53) = 2.96, p = 0.005, respectively. The slopes ofthe categorization functions for surprise-sad and sad-fear did notdiffer significantly from each other, t(53) = 0.71, p = 0.481.
In these behavioral analyses, our question of primary inter-est was whether trait anxiety would modulate the transition fromnon-fear to fear judgments in the surprise-fear and sad-fear con-tinua, as a function of increasing percentage of fear in the expres-sion shown. This was observed to be the case in the surprise-fearcontinuum alone, interaction of trait anxiety × morph content(% fear in morph), β = 0.056, p = 0.0248. As can be seen inFigure 3D, individuals with elevated trait anxiety showed an ear-lier, sharper, transition from categorizing expressions as surpriseto categorizing them as fear, as a function of the percentage of fearin the face presented, leading to increased fear categorizations forfaces in the middle of the surprise-fear continuum. There was no
FIGURE 3 | Behavioral results. Logistic regression fits across subjects
for each of the expression continua: (A) sad-fear; (B) surprise-sad; (C)
surprise-fear. Data points indicate the mean proportion of responses
across subjects (±SEM) made for each expression morph with reference
to the right-ward (“B”) end of the continuum—i.e., proportion of fear
responses for the sad-fear and surprise-fear continua, proportion of sad
responses for the surprise-sad continuum. The solid line represents the
logistic regression fit to the group data. (D) A mixed effects logistic
regression model revealed an interaction of trait anxiety x morph content
(% fear in morph) for the surprise-fear continuum, β = 0.056, p = 0.0248.
To illustrate the effect of anxiety upon categorization responses as a
function of morph level, the logistic regression fit is presented for trait
anxiety levels ±two standard deviations from the mean (this corresponds
to scores of 20 and 59, respectively, the mean STAI trait score being
39.5, SD = 9.75). These fits are plotted using solid lines. Red = high
anxious. Green = low anxious. The derivatives of these fitted functions
(which gives the rate of change in responses from surprise to fear) are
presented using dotted lines. Data points (triangles) for individuals with
trait anxiety scores in the top tertile (red) and bottom tertile (green) of
the group are also shown. It can be seen that heightened anxiety is
associated with a more rapid transition from surprise to fear responses
with this difference emerging for morphs with 33–50% fear content (see
the derivative plots) and leading to more fear responses being made by
high anxious individuals until high levels of fear content (83–100%) are
reached, at which point both high and low trait anxious individuals
predominantly make fear judgments (see the main fits).
Frontiers in Human Neuroscience | www.frontiersin.org 7 March 2015 | Volume 9 | Article 152
Bishop et al. Anxiety and amygdala adaptation for expressions
significant effect of trait anxiety upon categorization performanceas a function of morph level within the sad-fear or surprise-sadcontinua.
fMRI ResultsIn line with previous studies, our behavioral data are consistentwith a categorical model of representation of emotional expres-sions. While this may not translate to categorical representationacross the face-processing network, given our a-priori focus onthe amygdala and our desire to understand biases in behavioralcategorization performance, we focused primarily on the categor-ical model to test our hypotheses regarding the modulation bytrait anxiety of representation of expression blends—especiallythose containing fear—within the amygdala. We used a regionof interest approach, activity being extracted from, and aver-aged across, left and right amygdala ROIs defined using the MNIAAL template (Figure 4A). This approach avoids issues pertain-ing to corrections for multiple comparisons and inflated effectsizes when reporting peak voxel statistics following whole-brainor small-volume search (Vul et al., 2009). One-tailed tests atp < 0.05 were used to test a-priori hypotheses. Other results arereported as significant if they survived p < 0.05, two-tailed.
Adaptation Effects in the AmygdalaWe first examined the extent to which amygdala activity showedrelease from adaptation when emotional faces followed a neutralface. If the amygdala shows preferential activation to emotionalfaces, in general, relative to neutral faces then we would expect tosee such a rebound in activity. This was indeed observed acrosscontinua, left amygdala: t(18) = 3.63, p = 0.002, right amyg-dala: t(18) = 2.38, p = 0.029. For both amygdala ROIs, thiseffect did not vary significantly by continuum (ps > 0.4), nor was
it modulated significantly by anxiety across or within continua(ps > 0.5).
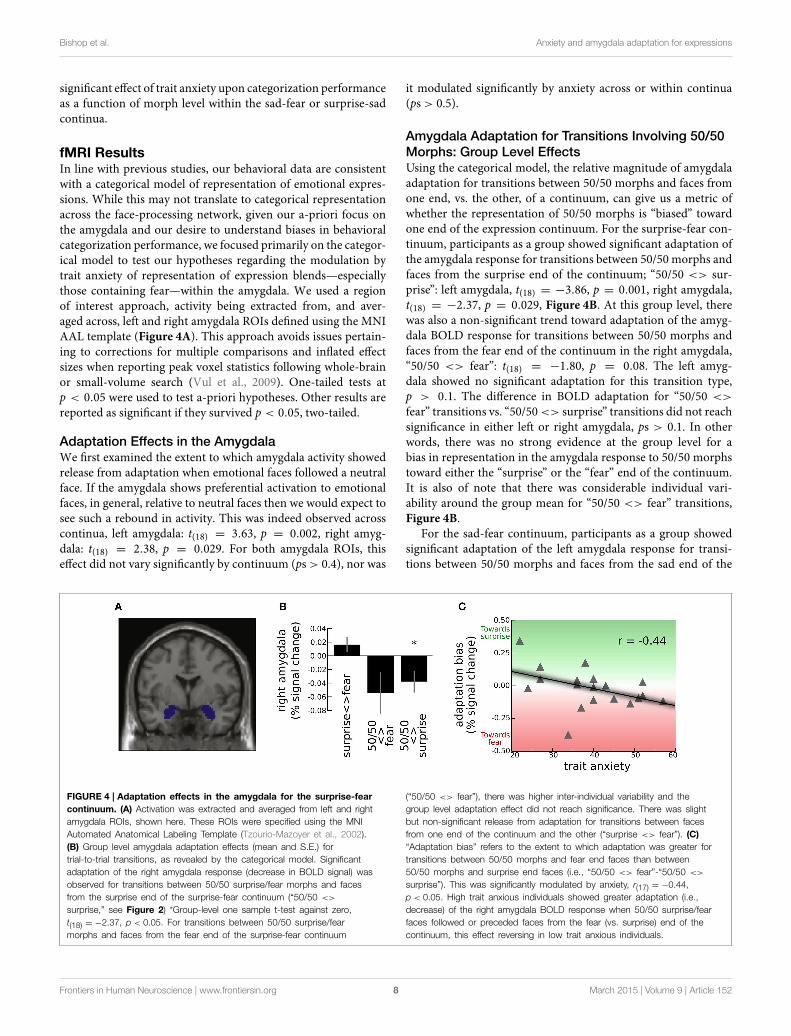
Amygdala Adaptation for Transitions Involving 50/50
Morphs: Group Level EffectsUsing the categorical model, the relative magnitude of amygdalaadaptation for transitions between 50/50 morphs and faces fromone end, vs. the other, of a continuum, can give us a metric ofwhether the representation of 50/50 morphs is “biased” towardone end of the expression continuum. For the surprise-fear con-tinuum, participants as a group showed significant adaptation ofthe amygdala response for transitions between 50/50 morphs andfaces from the surprise end of the continuum; “50/50 <> sur-prise”: left amygdala, t(18) = −3.86, p = 0.001, right amygdala,t(18) = −2.37, p = 0.029, Figure 4B. At this group level, therewas also a non-significant trend toward adaptation of the amyg-dala BOLD response for transitions between 50/50 morphs andfaces from the fear end of the continuum in the right amygdala,“50/50 <> fear”: t(18) = −1.80, p = 0.08. The left amyg-dala showed no significant adaptation for this transition type,p > 0.1. The difference in BOLD adaptation for “50/50 <>
fear” transitions vs. “50/50<> surprise” transitions did not reachsignificance in either left or right amygdala, ps > 0.1. In otherwords, there was no strong evidence at the group level for abias in representation in the amygdala response to 50/50 morphstoward either the “surprise” or the “fear” end of the continuum.It is also of note that there was considerable individual vari-ability around the group mean for “50/50 <> fear” transitions,Figure 4B.
For the sad-fear continuum, participants as a group showedsignificant adaptation of the left amygdala response for transi-tions between 50/50 morphs and faces from the sad end of the
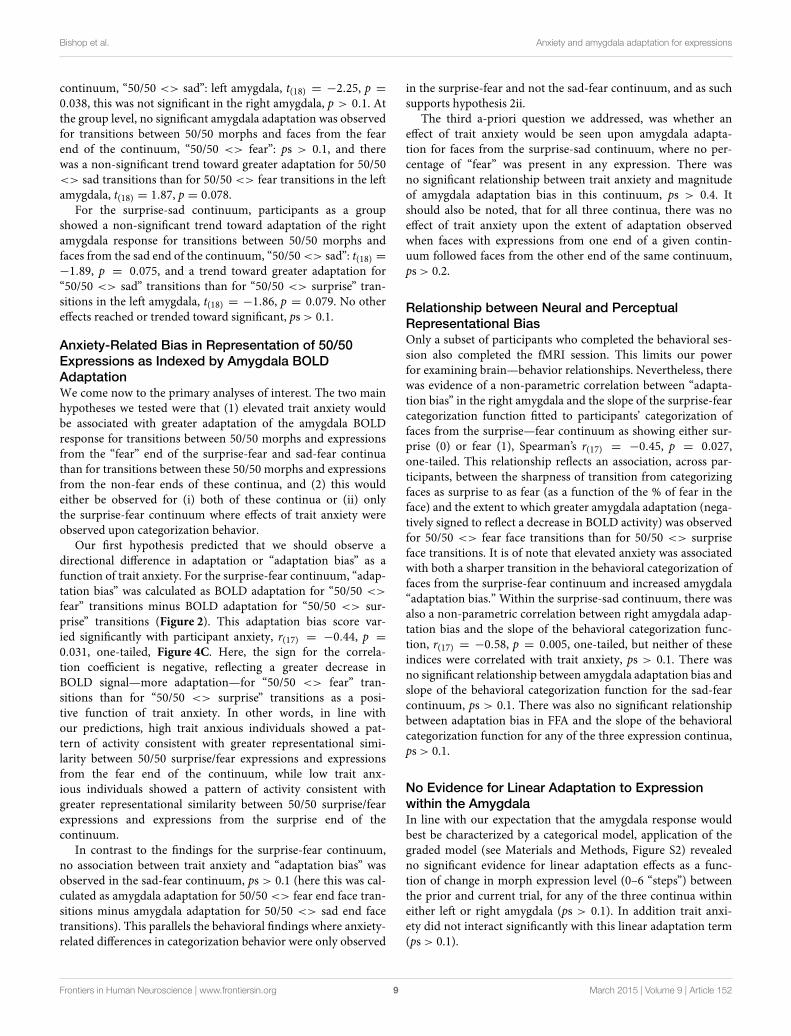
FIGURE 4 | Adaptation effects in the amygdala for the surprise-fear
continuum. (A) Activation was extracted and averaged from left and right
amygdala ROIs, shown here. These ROIs were specified using the MNI
Automated Anatomical Labeling Template (Tzourio-Mazoyer et al., 2002).
(B) Group level amygdala adaptation effects (mean and S.E.) for
trial-to-trial transitions, as revealed by the categorical model. Significant
adaptation of the right amygdala response (decrease in BOLD signal) was
observed for transitions between 50/50 surprise/fear morphs and faces
from the surprise end of the surprise-fear continuum (“50/50 <>
surprise,” see Figure 2) *Group-level one sample t-test against zero,
t(18) = −2.37, p < 0.05. For transitions between 50/50 surprise/fear
morphs and faces from the fear end of the surprise-fear continuum
(“50/50 <> fear”), there was higher inter-individual variability and the
group level adaptation effect did not reach significance. There was slight
but non-significant release from adaptation for transitions between faces
from one end of the continuum and the other (“surprise <> fear”). (C)
“Adaptation bias” refers to the extent to which adaptation was greater for
transitions between 50/50 morphs and fear end faces than between
50/50 morphs and surprise end faces (i.e., “50/50 <> fear”-“50/50 <>
surprise”). This was significantly modulated by anxiety, r(17) = −0.44,
p < 0.05. High trait anxious individuals showed greater adaptation (i.e.,
decrease) of the right amygdala BOLD response when 50/50 surprise/fear
faces followed or preceded faces from the fear (vs. surprise) end of the
continuum, this effect reversing in low trait anxious individuals.
Frontiers in Human Neuroscience | www.frontiersin.org 8 March 2015 | Volume 9 | Article 152
Bishop et al. Anxiety and amygdala adaptation for expressions
continuum, “50/50 <> sad”: left amygdala, t(18) = −2.25, p =
0.038, this was not significant in the right amygdala, p > 0.1. Atthe group level, no significant amygdala adaptation was observedfor transitions between 50/50 morphs and faces from the fearend of the continuum, “50/50 <> fear”: ps > 0.1, and therewas a non-significant trend toward greater adaptation for 50/50<> sad transitions than for 50/50 <> fear transitions in the leftamygdala, t(18) = 1.87, p = 0.078.
For the surprise-sad continuum, participants as a groupshowed a non-significant trend toward adaptation of the rightamygdala response for transitions between 50/50 morphs andfaces from the sad end of the continuum, “50/50<> sad”: t(18) =−1.89, p = 0.075, and a trend toward greater adaptation for“50/50 <> sad” transitions than for “50/50 <> surprise” tran-sitions in the left amygdala, t(18) = −1.86, p = 0.079. No othereffects reached or trended toward significant, ps > 0.1.
Anxiety-Related Bias in Representation of 50/50
Expressions as Indexed by Amygdala BOLD
AdaptationWe come now to the primary analyses of interest. The two mainhypotheses we tested were that (1) elevated trait anxiety wouldbe associated with greater adaptation of the amygdala BOLDresponse for transitions between 50/50 morphs and expressionsfrom the “fear” end of the surprise-fear and sad-fear continuathan for transitions between these 50/50 morphs and expressionsfrom the non-fear ends of these continua, and (2) this wouldeither be observed for (i) both of these continua or (ii) onlythe surprise-fear continuum where effects of trait anxiety wereobserved upon categorization behavior.
Our first hypothesis predicted that we should observe adirectional difference in adaptation or “adaptation bias” as afunction of trait anxiety. For the surprise-fear continuum, “adap-tation bias” was calculated as BOLD adaptation for “50/50 <>
fear” transitions minus BOLD adaptation for “50/50 <> sur-prise” transitions (Figure 2). This adaptation bias score var-ied significantly with participant anxiety, r(17) = −0.44, p =
0.031, one-tailed, Figure 4C. Here, the sign for the correla-tion coefficient is negative, reflecting a greater decrease inBOLD signal—more adaptation—for “50/50 <> fear” tran-sitions than for “50/50 <> surprise” transitions as a posi-tive function of trait anxiety. In other words, in line withour predictions, high trait anxious individuals showed a pat-tern of activity consistent with greater representational simi-larity between 50/50 surprise/fear expressions and expressionsfrom the fear end of the continuum, while low trait anx-ious individuals showed a pattern of activity consistent withgreater representational similarity between 50/50 surprise/fearexpressions and expressions from the surprise end of thecontinuum.
In contrast to the findings for the surprise-fear continuum,no association between trait anxiety and “adaptation bias” wasobserved in the sad-fear continuum, ps > 0.1 (here this was cal-culated as amygdala adaptation for 50/50 <> fear end face tran-sitions minus amygdala adaptation for 50/50 <> sad end facetransitions). This parallels the behavioral findings where anxiety-related differences in categorization behavior were only observed
in the surprise-fear and not the sad-fear continuum, and as suchsupports hypothesis 2ii.
The third a-priori question we addressed, was whether aneffect of trait anxiety would be seen upon amygdala adapta-tion for faces from the surprise-sad continuum, where no per-centage of “fear” was present in any expression. There wasno significant relationship between trait anxiety and magnitudeof amygdala adaptation bias in this continuum, ps > 0.4. Itshould also be noted, that for all three continua, there was noeffect of trait anxiety upon the extent of adaptation observedwhen faces with expressions from one end of a given contin-uum followed faces from the other end of the same continuum,ps > 0.2.
Relationship between Neural and Perceptual
Representational BiasOnly a subset of participants who completed the behavioral ses-sion also completed the fMRI session. This limits our powerfor examining brain—behavior relationships. Nevertheless, therewas evidence of a non-parametric correlation between “adapta-tion bias” in the right amygdala and the slope of the surprise-fearcategorization function fitted to participants’ categorization offaces from the surprise—fear continuum as showing either sur-prise (0) or fear (1), Spearman’s r(17) = −0.45, p = 0.027,one-tailed. This relationship reflects an association, across par-ticipants, between the sharpness of transition from categorizingfaces as surprise to as fear (as a function of the % of fear in theface) and the extent to which greater amygdala adaptation (nega-tively signed to reflect a decrease in BOLD activity) was observedfor 50/50 <> fear face transitions than for 50/50 <> surpriseface transitions. It is of note that elevated anxiety was associatedwith both a sharper transition in the behavioral categorization offaces from the surprise-fear continuum and increased amygdala“adaptation bias.” Within the surprise-sad continuum, there wasalso a non-parametric correlation between right amygdala adap-tation bias and the slope of the behavioral categorization func-tion, r(17) = −0.58, p = 0.005, one-tailed, but neither of theseindices were correlated with trait anxiety, ps > 0.1. There wasno significant relationship between amygdala adaptation bias andslope of the behavioral categorization function for the sad-fearcontinuum, ps > 0.1. There was also no significant relationshipbetween adaptation bias in FFA and the slope of the behavioralcategorization function for any of the three expression continua,ps > 0.1.
No Evidence for Linear Adaptation to Expression
within the AmygdalaIn line with our expectation that the amygdala response wouldbest be characterized by a categorical model, application of thegraded model (see Materials and Methods, Figure S2) revealedno significant evidence for linear adaptation effects as a func-tion of change in morph expression level (0–6 “steps”) betweenthe prior and current trial, for any of the three continua withineither left or right amygdala (ps > 0.1). In addition trait anxi-ety did not interact significantly with this linear adaptation term(ps > 0.1).
Frontiers in Human Neuroscience | www.frontiersin.org 9 March 2015 | Volume 9 | Article 152
Bishop et al. Anxiety and amygdala adaptation for expressions
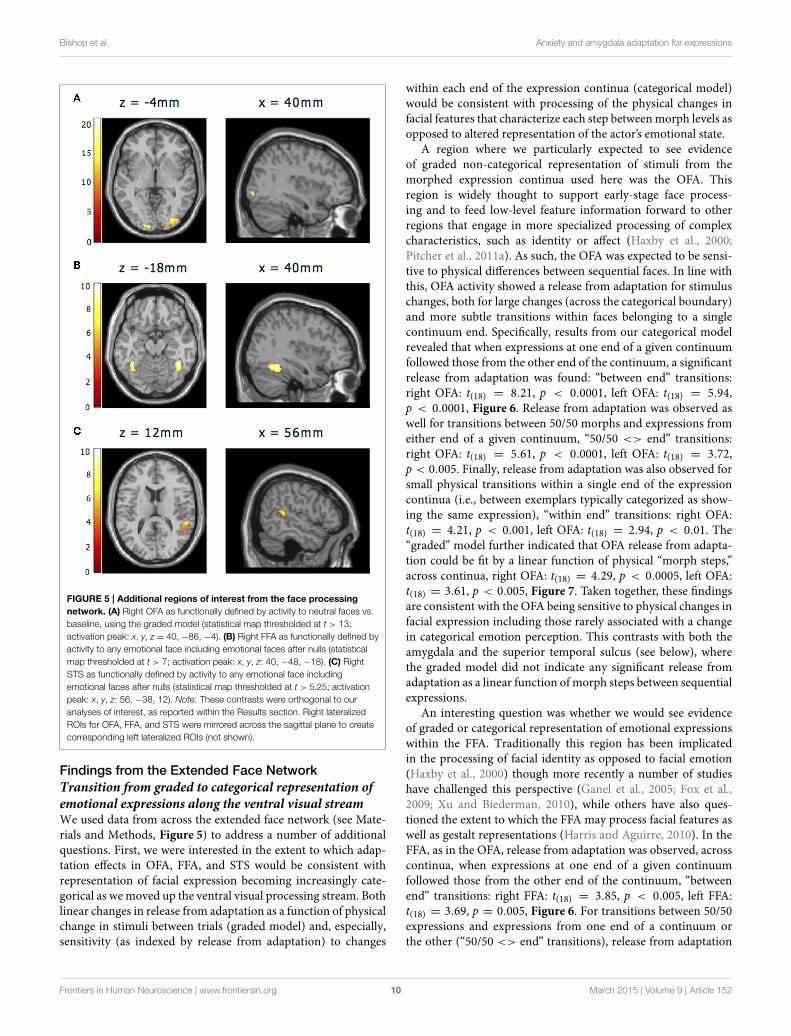
FIGURE 5 | Additional regions of interest from the face processing
network. (A) Right OFA as functionally defined by activity to neutral faces vs.
baseline, using the graded model (statistical map thresholded at t > 13;
activation peak: x, y, z = 40, −86, −4). (B) Right FFA as functionally defined by
activity to any emotional face including emotional faces after nulls (statistical
map thresholded at t > 7; activation peak: x, y, z: 40, −48, −18). (C) Right
STS as functionally defined by activity to any emotional face including
emotional faces after nulls (statistical map thresholded at t > 5.25; activation
peak: x, y, z: 56, −38, 12). Note. These contrasts were orthogonal to our
analyses of interest, as reported within the Results section. Right lateralized
ROIs for OFA, FFA, and STS were mirrored across the sagittal plane to create
corresponding left lateralized ROIs (not shown).
Findings from the Extended Face Network
Transition from graded to categorical representation of
emotional expressions along the ventral visual streamWe used data from across the extended face network (see Mate-rials and Methods, Figure 5) to address a number of additionalquestions. First, we were interested in the extent to which adap-tation effects in OFA, FFA, and STS would be consistent withrepresentation of facial expression becoming increasingly cate-gorical as wemoved up the ventral visual processing stream. Bothlinear changes in release from adaptation as a function of physicalchange in stimuli between trials (graded model) and, especially,sensitivity (as indexed by release from adaptation) to changes
within each end of the expression continua (categorical model)would be consistent with processing of the physical changes infacial features that characterize each step betweenmorph levels asopposed to altered representation of the actor’s emotional state.
A region where we particularly expected to see evidenceof graded non-categorical representation of stimuli from themorphed expression continua used here was the OFA. Thisregion is widely thought to support early-stage face process-ing and to feed low-level feature information forward to otherregions that engage in more specialized processing of complexcharacteristics, such as identity or affect (Haxby et al., 2000;Pitcher et al., 2011a). As such, the OFA was expected to be sensi-tive to physical differences between sequential faces. In line withthis, OFA activity showed a release from adaptation for stimuluschanges, both for large changes (across the categorical boundary)and more subtle transitions within faces belonging to a singlecontinuum end. Specifically, results from our categorical modelrevealed that when expressions at one end of a given continuumfollowed those from the other end of the continuum, a significantrelease from adaptation was found: “between end” transitions:right OFA: t(18) = 8.21, p < 0.0001, left OFA: t(18) = 5.94,p < 0.0001, Figure 6. Release from adaptation was observed aswell for transitions between 50/50 morphs and expressions fromeither end of a given continuum, “50/50 <> end” transitions:right OFA: t(18) = 5.61, p < 0.0001, left OFA: t(18) = 3.72,p < 0.005. Finally, release from adaptation was also observed forsmall physical transitions within a single end of the expressioncontinua (i.e., between exemplars typically categorized as show-ing the same expression), “within end” transitions: right OFA:t(18) = 4.21, p < 0.001, left OFA: t(18) = 2.94, p < 0.01. The“graded” model further indicated that OFA release from adapta-tion could be fit by a linear function of physical “morph steps,”across continua, right OFA: t(18) = 4.29, p < 0.0005, left OFA:t(18) = 3.61, p < 0.005, Figure 7. Taken together, these findingsare consistent with the OFA being sensitive to physical changes infacial expression including those rarely associated with a changein categorical emotion perception. This contrasts with both theamygdala and the superior temporal sulcus (see below), wherethe graded model did not indicate any significant release fromadaptation as a linear function of morph steps between sequentialexpressions.
An interesting question was whether we would see evidenceof graded or categorical representation of emotional expressionswithin the FFA. Traditionally this region has been implicatedin the processing of facial identity as opposed to facial emotion(Haxby et al., 2000) though more recently a number of studieshave challenged this perspective (Ganel et al., 2005; Fox et al.,2009; Xu and Biederman, 2010), while others have also ques-tioned the extent to which the FFA may process facial features aswell as gestalt representations (Harris and Aguirre, 2010). In theFFA, as in the OFA, release from adaptation was observed, acrosscontinua, when expressions at one end of a given continuumfollowed those from the other end of the continuum, “betweenend” transitions: right FFA: t(18) = 3.85, p < 0.005, left FFA:t(18) = 3.69, p = 0.005, Figure 6. For transitions between 50/50expressions and expressions from one end of a continuum orthe other (“50/50 <> end” transitions), release from adaptation
Frontiers in Human Neuroscience | www.frontiersin.org 10 March 2015 | Volume 9 | Article 152
Bishop et al. Anxiety and amygdala adaptation for expressions
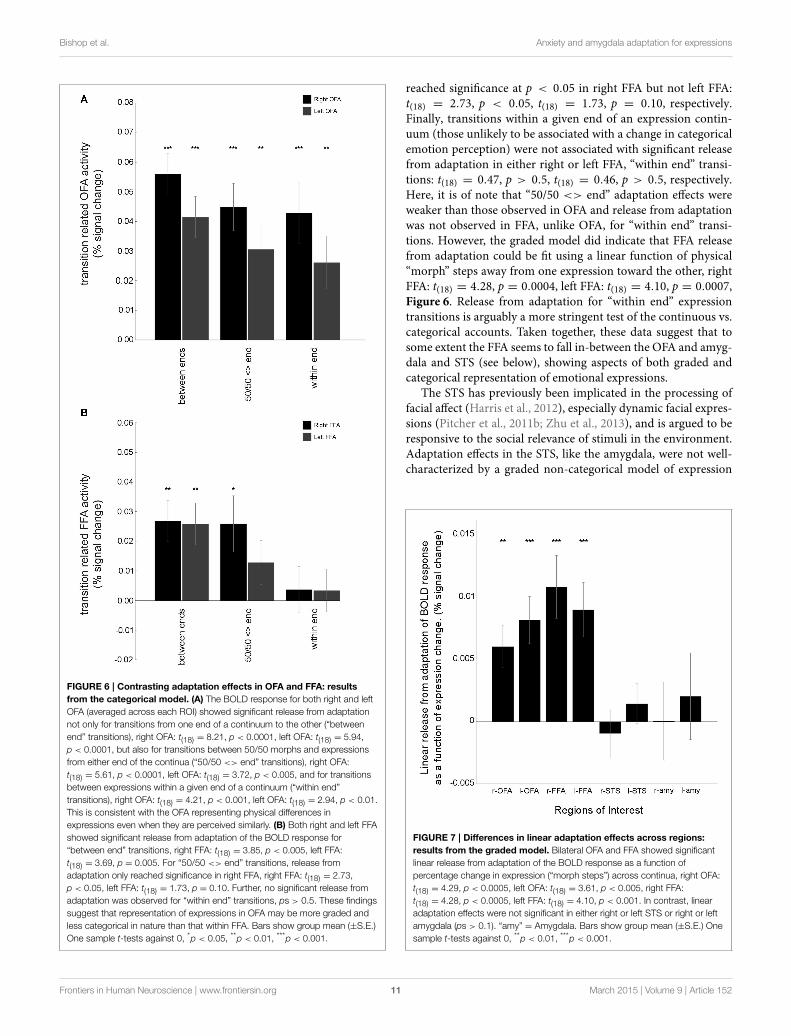
FIGURE 6 | Contrasting adaptation effects in OFA and FFA: results
from the categorical model. (A) The BOLD response for both right and left
OFA (averaged across each ROI) showed significant release from adaptation
not only for transitions from one end of a continuum to the other (“between
end” transitions), right OFA: t(18) = 8.21, p < 0.0001, left OFA: t(18) = 5.94,
p < 0.0001, but also for transitions between 50/50 morphs and expressions
from either end of the continua (“50/50 <> end” transitions), right OFA:
t(18) = 5.61, p < 0.0001, left OFA: t(18) = 3.72, p < 0.005, and for transitions
between expressions within a given end of a continuum (“within end”
transitions), right OFA: t(18) = 4.21, p < 0.001, left OFA: t(18) = 2.94, p < 0.01.
This is consistent with the OFA representing physical differences in
expressions even when they are perceived similarly. (B) Both right and left FFA
showed significant release from adaptation of the BOLD response for
“between end” transitions, right FFA: t(18) = 3.85, p < 0.005, left FFA:
t(18) = 3.69, p = 0.005. For “50/50 <> end” transitions, release from
adaptation only reached significance in right FFA, right FFA: t(18) = 2.73,
p < 0.05, left FFA: t(18) = 1.73, p = 0.10. Further, no significant release from
adaptation was observed for “within end” transitions, ps > 0.5. These findings
suggest that representation of expressions in OFA may be more graded and
less categorical in nature than that within FFA. Bars show group mean (±S.E.)
One sample t-tests against 0, *p < 0.05, **p < 0.01, ***p < 0.001.
reached significance at p < 0.05 in right FFA but not left FFA:t(18) = 2.73, p < 0.05, t(18) = 1.73, p = 0.10, respectively.Finally, transitions within a given end of an expression contin-uum (those unlikely to be associated with a change in categoricalemotion perception) were not associated with significant releasefrom adaptation in either right or left FFA, “within end” transi-tions: t(18) = 0.47, p > 0.5, t(18) = 0.46, p > 0.5, respectively.Here, it is of note that “50/50 <> end” adaptation effects wereweaker than those observed in OFA and release from adaptationwas not observed in FFA, unlike OFA, for “within end” transi-tions. However, the graded model did indicate that FFA releasefrom adaptation could be fit using a linear function of physical“morph” steps away from one expression toward the other, rightFFA: t(18) = 4.28, p = 0.0004, left FFA: t(18) = 4.10, p = 0.0007,Figure 6. Release from adaptation for “within end” expressiontransitions is arguably a more stringent test of the continuous vs.categorical accounts. Taken together, these data suggest that tosome extent the FFA seems to fall in-between the OFA and amyg-dala and STS (see below), showing aspects of both graded andcategorical representation of emotional expressions.
The STS has previously been implicated in the processing offacial affect (Harris et al., 2012), especially dynamic facial expres-sions (Pitcher et al., 2011b; Zhu et al., 2013), and is argued to beresponsive to the social relevance of stimuli in the environment.Adaptation effects in the STS, like the amygdala, were not well-characterized by a graded non-categorical model of expression
FIGURE 7 | Differences in linear adaptation effects across regions:
results from the graded model. Bilateral OFA and FFA showed significant
linear release from adaptation of the BOLD response as a function of
percentage change in expression (“morph steps”) across continua, right OFA:
t(18) = 4.29, p < 0.0005, left OFA: t(18) = 3.61, p < 0.005, right FFA:
t(18) = 4.28, p < 0.0005, left FFA: t(18) = 4.10, p < 0.001. In contrast, linear
adaptation effects were not significant in either right or left STS or right or left
amygdala (ps > 0.1). “amy” = Amygdala. Bars show group mean (±S.E.) One
sample t-tests against 0, **p < 0.01, ***p < 0.001.
Frontiers in Human Neuroscience | www.frontiersin.org 11 March 2015 | Volume 9 | Article 152
Bishop et al. Anxiety and amygdala adaptation for expressions
representation; linear adaptation effects for all continua: ps >
0.1, Figure 7. Indeed, the categorical model revealed that the STSshowed greatest sensitivity to transitions between 50/50 morphsand faces from either end of the continua. Neither right norleft STS showed release from adaptation for “between end” or“within end” transitions, ps > 0.1. Across continua, right STSshowed release from adaptation for “50/50 <> end” transitions:t(18) = 2.13, p = 0.047. This however only reached significancewithin the surprise-fear continuum, right sts: t(18) = 2.41, p =
0.027. In both the surprise-fear continuum and sad-fear contin-uum, release from adaptation was significantly greater for “50/50<> fear” end face transitions than for transitions between 50/50morphs and non-fear-end (sad or surprise) faces, surprise-fear:left STS, t(18) = 2.11, p = 0.049, sad-fear: right STS: t(18) = 2.44,p = 0.025.
Effects of anxiety upon representation of emotional
expressions across the extended face networkWe next looked to see if any region from the extended face net-work showed an anxiety-related adaptation “bias” for faces fromthe surprise-fear continuum that paralleled that observed in theright amygdala. This was indeed the case for right FFA. Here, ele-vated trait anxiety levels were associated with greater adaptationfor “50/50 <> fear” end face transitions than for “50/50 <> sur-prise” end face transitions, r(19) = −0.44, p = 0.030, one-tailed.(Note, the r coefficient is negative here as differential adaptation,i.e., decrease in BOLD, increases with anxiety.)
No equivalent relationship between anxiety and adaptationbias for faces from the surprise-fear continuum was observedin any of our other ROIs of interest. We additionally investi-gated if there was any other modulation by anxiety of adaptationeffects for 50/50 <> end transitions, 50/50 <> end “B” vs. 50/50<> end “A” transitions (“adaptation bias”), or “between end”transitions for any of the three expression continua across theextended face processing network. No other significant effectswere observed within FFA, OFA, or STS. It is also of note thatanxiety did not significantly modulate “graded representation” ofemotional expression (i.e., adaptation modeled as a linear func-tion of expression morph level) in OFA, FFA, or STS for any ofthe three continua.
Direct Effects AnalysesThe experiment reported here was optimized for investigationof “carry-over” adaptation effects between sequentially presentedstimuli. The short inter-stimulus intervals and type 1, index 1sequence, while ideal for this purpose, provide limited powerfor detecting a difference in the mean direct effect of one stim-ulus compared to another. Hence, direct effects analyses areincluded for completeness, but with this important caveat. Usingthe categorical model, analyses of covariance (ANCOVA) withGreenhouse-Geisser corrections for violations of sphericity wereemployed to examine whether there was a main effect of expres-sion type (end “A,” 50/50, end “B”) or an interaction of expres-sion type by anxiety upon the response in the amygdala for eachexpression continuum separately. In none of the three continuawas there either a significant effect of expression type (ps > 0.1except for surprise-fear where p > 0.05 for the right amygdala) or
a significant interaction of expression type by anxiety (ps > 0.1).Post-hoc tests applied to surprise-fear continuum activation inthe right amygdala revealed a non-significant trend for 50/50 sur-prise/fear morphs to elicit higher amygdala activity than surpriseend or fear end faces (p = 0.176, p = 0.153 bonferonni corrected,respectively). Using the linear model, the only significant findingwas for the surprise-sad continuum, where a significant increasein amygdala activity was observed as a function of increased per-centage of sadness in the expression, left amygdala: t(18) = 2.57,p = 0.019, right amygdala: t(18) = 2.31, p = 0.033. For the lin-ear model analyses of direct effects, as for the categorical modelanalyses, no significant interactions of expression level by anxietywere observed.
Parallel “direct effects” investigations of effects of anxiety,expression and their interaction for the three continua were con-ducted for the extended face network ROIs (OFA, FFA, STS).Here, again, no significant interactions of anxiety by expressionwere observed using either the categorical or linear model. Theonly significant effect of expression level was observed withinthe surprise-sad continuum. Here, the graded model revealedthat bilateral OFA activity increased as a function of increasingsadness in the expression, left, t(18) = 2.79, p = 0.012, right,t(18) = 2.12, p = 0.048, paralleling our findings for the amygdala.In addition, the categorical model revealed a significant maineffect of expression type in right FFA for the surprise-sad contin-uum, F(2, 34) = 4.39, p = 0.023. Here, there was no support for alinear increase in activity as a function of increasing sadness. Post-hoc tests revealed a significant difference in activity between sadexpressions and 50/50 sad/surprise morphs, rFFA activity beinghigher for the former (p = 0.020, bonferonni corrected).
Discussion
The primary purpose of this study was to investigate anxiety-related biases in the neural representation of facial expressionswithin the amygdala. Three expression continua were considered.Two of these contained expression blends generated bymorphingbetween a face showing fear and the same identity showing eithersadness or surprise. The third continuum was created by morph-ing between expressions of surprise and sadness, and hence didnot involve any percentage of fear. Our aim was to determinewhether elevated trait anxiety would be associated with biases inrepresentation in the amygdala of expressions containing someelement of fear, and whether this would parallel biases in theperceptual categorization of these expressions.
It has previously been reported that high trait anxious indi-viduals show an increased propensity to categorize expressionsmid-way between fear and either surprise or sadness as showingfear (Richards et al., 2002). In the current study, we consideredsurprise-fear and sad-fear expression continua separately andreplicated Richards and colleagues findings of an anxiety-relatedbias in categorization performance for the former but not thelatter continuum. Specifically, for the surprise-fear continuum,individuals with elevated trait anxiety showed a more rapid tran-sition from categorizing expressions as surprise to categorizingthem as fear, as a function of the percentage of fear in the morphpresented. This led to increased fear categorizations for morphs
Frontiers in Human Neuroscience | www.frontiersin.org 12 March 2015 | Volume 9 | Article 152
Bishop et al. Anxiety and amygdala adaptation for expressions
in the middle of the surprise-fear continuum. There were no sig-nificant anxiety-related biases in categorization performance forthe sadness-fear or surprise-sadness continua.
The specificity to the surprise-fear continuum of the anxiety-related bias in expression categorization was paralleled by find-ings from analyses of BOLD adaptation within the amygdala. Inline with our a priori hypotheses, trait anxiety modulated theextent of adaptation observed in the amygdala for transitionsbetween faces with 50/50 surprise/fear expression blends andfaces showing expressions from the fear vs. the surprise end of thesurprise-fear continuum. High trait anxious individuals showedgreater adaptation for transitions between 50/50 surprise/fearmorphs and faces from the “fear” end of the continuum, whilelow trait anxious individuals showed the reverse pattern withadaptation being greater for transitions between 50/50 morphsand faces from the “surprise” end. If fMRI adaptation is heldto provide an index of representational similarity within a brainregion (Grill-Spector et al., 2006), then we may infer that ele-vated trait anxiety is associated with increased similarity in theamygdala encoding of 50/50 surprise-fear blends and expressionsprimarily categorized as showing fear.
As was the case for categorization behavior, no anxiety-relatedbiases in amygdala adaptation were observed for expressionscomprising blends of sadness and fear, or indeed those compris-ing blends of surprise and sadness. This suggests that anxiety-related bias in the representation of facial expressions is specificto the surprise-fear continuum, out of the three continua consid-ered, at least for the stimuli used here. Replication of this studywith alternate face stimuli or a wider set of facial identities wouldbe of value in establishing the generalizability of this finding. Theexpressions of fear and surprise are more commonly mistakenfor each other than expressions of sadness and fear (Young et al.,1997). Hence, one possibility is that an anxiety-related “fear” biasis only apparent when expressions are easily confusable. In futurework, restriction of the stimuli used to faces close to the norma-tive categorization boundary for each continuummight enable usto examine this possibility further, and to determine if an anxiety-related bias is seen in the sad-fear continuum when a smallerrange of expression variation is used.
Elsewhere, it has been argued that surprise expressions arethemselves ambiguous in indicating a positive or negative event(Kim et al., 2003). This raises the alternate possibility that hightrait anxious individuals are more sensitive to negative interpre-tations when fear is blended with surprise than low anxious indi-viduals but that this bias does not emerge when both ends of thecontinuum are uniformly perceived as unambiguously negative.It is also interesting to note that neither anxiety-related biasesin amygdala activity nor categorization behavior were observedwhen surprise was present in the context of sadness. The inter-pretation of surprise as indicative of threat may be constrained bythe other emotional elements present in a given expression (seeNeta et al., 2011 for further discussion of contextual influences onprocessing of expressions).
We also examined adaptation effects in three other regionswidely held to be core components of a right lateralized faceprocessing network—namely OFA, FFA, and STS. Release fromadaptation within OFA was consistent with suggestions that this
region may be engaged in fairly early processing of physical facefeatures (Haxby et al., 2000). Specifically, OFA activity increasedlinearly as a function of change in expression “morph steps”between sequentially presented faces. In addition, release fromadaptation in this region was not only observed for faces fromdifferent continuum ends, but also for faces from the same endof a given continuum. This hence fits better with graded thancategorical representation of expressions (or their componentfeatures) within this region.
In line with recent findings (Fox et al., 2009; Xu and Bie-derman, 2010), FFA also showed release from adaptation as afunction of changes in expression, across all three continua. Thisis contrary to early models suggesting a specialized role for theFFA in processing invariant aspects of facial information such asidentity (Haxby et al., 2000). One possibility is that processingof facial features might not be the province of the OFA alonebut might entail reciprocal interactions between the OFA andFFA (Rossion, 2008). This however does not explain why theFFA showed less sensitivity to within continuum end changesin expression than OFA, suggesting that it is more sensitive toexpression gestalts and less to specific physical changes in com-ponent features. This might perhaps be explained by the FFAacting as a core hub for face processing, receiving input from boththe OFA and amygdala. Specifically, the FFA might be respon-sive to feed-forward information about differences in facial fea-tures from OFA but also more categorical information aboutfacial expression, especially when threat-relevant, from the amyg-dala. This would be consistent with prior suggestions that amyg-dala activity may influence activity in the FFA, modulating itsresponse to fearful faces (Vuilleumier et al., 2001), and couldpotentially also explain the finding that right FFA adaptation fortransitions between 50/50 surprise-fear morphs and “fear end”vs. “surprise end” faces showed parallel modulation by anxiety tothat observed in the right amygdala.
We also examined adaptation within the superior temporalsulcus. Here recent studies have reported somewhat contradic-tory findings.While some studies have reported adaptation in theSTS BOLD response as a function of changes in facial expression(Winston et al., 2004), others have reported a failure to find suchadaptation effects (Cohen Kadosh et al., 2010; Xu and Bieder-man, 2010). It has been argued that this might potentially arisefrom the STS being predominantly responsive to dynamic facesincluding, under some circumstances, perceived motion betweensequential static expressions. Findings from our current exper-iment provide some support for STS encoding of facial expres-sion. As in the amygdala, the pattern of adaptation observed wasbetter fit by a categorical than a continuous model of expres-sion representation. Also sharing similarities with findings forthe amygdala, across subjects, STS adaptation was greater for50/50 expression morphs followed or preceded by expressionsfrom the non-fear end of the surprise-fear and sad-fear con-tinua. This potentially suggests differential representation of faceswith 67% or higher fear content, perhaps reflecting the socialrelevance of such expressions as cues of potential threat in theenvironment. Interestingly, this adaptation bias was superim-posed on a general tendency for release from adaptation in theSTS for transitions between 50/50 expression morphs and faces
Frontiers in Human Neuroscience | www.frontiersin.org 13 March 2015 | Volume 9 | Article 152
Bishop et al. Anxiety and amygdala adaptation for expressions
from either continuum end. One possibility is that this couldreflect the STS having a general role in resolving the meaningof expressions. This might lead to greatest sensitivity to tran-sitions to and from 50/50 expressions, and also account forsensitivity to dynamic expressions, which by default involve achange in meaning. An alternative, though less likely, possibil-ity is that these 50/50 <> end transitions may be the most ableto create a percept of dynamic expression, with continuum endto end transitions potentially being too large to create such apercept.
To conclude, our current findings suggest that trait anxietyis not only associated with threat-related biases in the catego-rization of surprise-fear expression blends, but also with alteredrepresentation of these stimuli in the amygdala. Specifically, traitanxiety levels significantly correlated with the extent to whichparticipants showed greater adaptation of the amygdala BOLDresponse, and hence arguably greater representational similarity,for transitions involving 50/50 surprise/fear morphs and facesfrom the fear, vs. surprise, end of the continuum. This findingwas only observed when fitting a categorical model and not a
graded, linear, model to the amygdala BOLD signal. A similarpattern was also observed in the right FFA. This latter region,however, was also sensitive to graded physical changes betweenfacial expressions, though to a lesser extent than the OFA. Thesefindings provide initial evidence as to the neural correlates ofbiases in face expression perception shown by high trait anxiousindividuals.
Acknowledgments
This work was supported by the National Institute of MentalHealth (Grant Number R01MH091848) and a National ScienceFoundation award to the UC Berkeley Brain Imaging Centre(Grant Number 005400).
Supplementary Material
The Supplementary Material for this article can be foundonline at: http://www.frontiersin.org/journal/10.3389/fnhum.2015.00152/abstract
References
Aguirre, G. K. (2007). Continuous carry-over designs for fMRI. Neuroimage 35,1480–1494. doi: 10.1016/j.neuroimage.2007.02.005
Ashburner, J., and Friston, K. J. (2005). Unified segmentation. Neuroimage 26,839–851. doi: 10.1016/j.neuroimage.2005.02.018
Bieling, P. J., Antony, M. M., and Swinson, R. P. (1998). The state-trait anxietyinventory, trait version: structure and content re-examined. Behav. Res. Ther.36, 777–788. doi: 10.1016/S0005-7967(98)00023-0
Bishop, S. J. (2007). Neurocognitive mechanisms of anxiety: an integrative account.Trends Cogn. Sci. 11, 307–316. doi: 10.1016/j.tics.2007.05.008
Brett, M., Anton, J. L., Valabregue, R., and Poline, J. B. (2002). Region of interestanalysis using an SPM toolbox. Neuroimage 16(Suppl. 1), 1141.
Calder, A. J., Young, A. W., Perrett, D. I., Etcoff, N. L., and Rowland, D. (1996).Categorical perception of morphed facial expressions. Vis. cogn. 3, 81–117. doi:10.1080/713756735
Carp, J. (2013). Optimizing the order of operations for movementscrubbing: comment on Power et al. Neuroimage 76, 436–438. doi:10.1016/j.neuroimage.2011.12.061
Chambers, J. A., Power, K. G., and Durham, R. C. (2004). The relationshipbetween trait vulnerability and anxiety and depressive diagnoses at longtermfollow-up of generalized anxiety disorder. J. Anxiety Disord. 18, 587–607. doi:10.1016/j.janxdis.2003.09.001
Cohen Kadosh, K., Henson, R. N., Cohen Kadosh, R., Johnson, M. H., and Dick, F.(2010). Task-dependent activation of face-sensitive cortex: an fMRI adaptationstudy. J. Cogn. Neurosci. 22, 903–917. doi: 10.1162/jocn.2009.21224
Ekman, P., and Friesen, W. V. (1976). Pictures of Facial Affect. Palo Alto, CA:Consulting Psychologists Press.
Etcoff, N. L., and Magee, J. J. (1992). Categorical perception of facial expressions.Cognition 44, 227–240. doi: 10.1016/0010-0277(92)90002-Y
Finney, D. J., and Outhwaite, A. D. (1956). Serially balanced sequences in bioassay.Proc. R. Soc. Lond. B Biol. Sci. 145, 493–507. doi: 10.1098/rspb.1956.0058
Fox, C. J., Moon, S. Y., Iaria, G., and Barton, J. J. (2009). The correlates of subjectiveperception of identity and expression in the face network: an fMRI adaptationstudy. Neuroimage 44, 569–580. doi: 10.1016/j.neuroimage.2008.09.011
Ganel, T., Valyear, K. F., Goshen-Gottstein, Y., and Goodale, M. A. (2005).The involvement of the “fusiform face area” in processing facial expres-sion. Neuropsychologia 43, 1645–1654. doi: 10.1016/j.neuropsychologia.2005.01.012
Gauthier, I., Tarr, M. J., Moylan, J., Skudlarski, P., Gore, J. C., and Anderson, A. W.(2000). The fusiform “face area” is part of a network that processes faces at theindividual level. J. Cogn. Neurosci. 12, 495–504. doi: 10.1162/089892900562165
Grill-Spector, K., Henson, R., and Martin, A. (2006). Repetition and the brain:neural models of stimulus-specific effects. Trends Cogn. Sci. 10, 14–23. doi:10.1016/j.tics.2005.11.006
Harris, A., and Aguirre, G. K. (2010). Neural tuning for face wholes and partsin human fusiform gyrus revealed by FMRI adaptation. J. Neurophysiol. 104,336–345. doi: 10.1152/jn.00626.2009
Harris, R. J., Young, A. W., and Andrews, T. J. (2012). Morphing between expres-sions dissociates continuous from categorical representations of facial expres-sion in the human brain. Proc. Natl. Acad. Sci. U.S.A. 109, 21164–21169. doi:10.1073/pnas.1212207110
Haxby, J. V., Hoffman, E. A., and Gobbini, M. I. (2000). The distributedhuman neural system for face perception. Trends Cogn. Sci. 4, 223–233. doi:10.1016/S1364-6613(00)01482-0
Kanwisher, N., McDermott, J., and Chun, M. (1997). The fusiform face area: amodule in human extrastriate cortex specialized for the perception of faces.J. Neurosci. 17, 4302–4311.
Kim,H., Somerville, L. H., Johnstone, T., Alexander, A. L., andWhalen, P. J. (2003).Inverse amygdala and medial prefrontal cortex responses to surprised faces.Neuroreport 14, 2317–2322. doi: 10.1097/00001756-200312190-00006
Mathews, A., and MacLeod, C. (1994). Cognitive approaches to emotion. Annu.Rev. Psychol. 45, 25–50. doi: 10.1146/annurev.ps.45.020194.000325
Neta, M., Davis, F. C., and Whalen, P. J. (2011). Valence resolution of ambiguousfacial expressions using an emotional oddball task. Emotion 11, 1425–1433. doi:10.1037/a0022993
Öhman, A., (2005). The role of the amygdala in human fear: auto-matic detection of threat. Psychoneuroendocrinology 30, 953–958. doi:10.1016/j.psyneuen.2005.03.019
Pitcher, D., Dilks, D. D., Saxe, R. R., Triantafyllou, C., and Kanwisher,N. (2011b). Differential selectivity for dynamic versus static informa-tion in face-selective cortical regions. Neuroimage 56, 2356–2363. doi:10.1016/j.neuroimage.2011.03.067
Pitcher, D., Walsh, V., and Duchaine, B. (2011a). The role of the occipital facearea in the cortical face perception network. Exp. Brain Res. 209, 481–493. doi:10.1007/s00221-011-2579-1
Plehn, K., and Peterson, R. A. (2002). Anxiety sensitivity as a predictor ofthe development of panic symptoms, panic attacks, and panic disorder: a
Frontiers in Human Neuroscience | www.frontiersin.org 14 March 2015 | Volume 9 | Article 152
Bishop et al. Anxiety and amygdala adaptation for expressions
prospective study. J. Anxiety Disord. 16, 455–474. doi: 10.1016/S0887-6185(02)00129-9
Power, J. D., Barnes, K. A., Snyder, A. Z., Schlaggar, B. L., and Petersen, S.E. (2012). Spurious but systematic correlations in functional connectivityMRI networks arise from subject motion. Neuroimage 59, 2142–2154 doi:10.1016/j.neuroimage.2011.10.018
R Development Core Team. (2011). R: A Language and Environment for Sta-
tistical Computing. Vienna: R Foundation for Statistical Computing. ISBN3-900051-07-0.
Richards, A., French, C. C., Calder, A. J., Webb, B., Fox, R., and Young, A. W.(2002). Anxiety-related bias in the classification of emotionally ambiguousfacial expressions. Emotion 2, 273–287. doi: 10.1037/1528-3542.2.3.273
Rossion, B. (2008). Constraining the cortical face network by neuroimag-ing studies of acquired prosopagnosia. NeuroImage 40, 423–426. doi:10.1016/j.neuroimage.2007.10.047
Said, C. P., Moore, C. D., Norman, K. A., Haxby, J. V., and Todorov, A. (2010).Graded representations of emotional expressions in the left superior temporalsulcus. Front. Syst. Neurosci. 4:6. doi: 10.3389/fnsys.2010.00006
Spielberger, C. D., Gorsuch, R. L., Lushene, P. R., Vagg, P. R., and Jacobs, A. G.(1983). Manual for the State-Trait Anxiety Inventory Form Y. Palo Alto, CA:Consulting Psychologists Press, Inc.
Straw, A. D. (2008). Vision egg: an open-source library for realtime visual stimulusgeneration. Front. Neuroinform. 2:4. doi: 10.3389/neuro.11.004.2008
Tzourio-Mazoyer, N., Landeau, B., Papathanassiou, D., Crivello, F., Etard, O., Del-croix, N., et al. (2002). Automated anatomical labeling of activations in SPMusing a macroscopic anatomical parcellation of the MNI MRI single-subjectbrain. NeuroImage 15, 273–289. doi: 10.1006/nimg.2001.0978
Vuilleumier, P., Armony, J. L., Driver, J., and Dolan, R. J. (2001). Effects of atten-tion and emotion on face processing in the human brain: an event-related fMRIstudy. Neuron 30, 829–841. doi: 10.1016/S0896-6273(01)00328-2
Vul, E., Harris, C., Winkielman, P., and Pashler, H. (2009). Puzzingly highcorrelations in fMRI studies of emotion, personality and social cog-nition. Perspect. Psychol. Sci. 4, 274–290. doi: 10.1111/j.1745-6924.2009.01125.x
Winston, J. S., Henson, R. N., Fine-Goulden, M. R., and Dolan, R. J. (2004).fMRI-adaptation reveals dissociable neural representations of identity andexpression in face perception. J Neurophysiol. 92, 1830–1839. doi: 10.1152/jn.00155.2004
Xu, X., and Biederman, I. (2010). Loci of the release from fMRI adaptationfor changes in facial expression, identity, and viewpoint. J. Vis. 10:36. doi:10.1167/10.14.36
Young, A. W., Rowland, D., Calder, A. J., Etcoff, N. L., Seth, A., and Perrett,D. I. (1997). Facial expression megamix: tests of dimensional and categoryaccounts of emotion recognition. Cognition 63, 271–313. doi: 10.1016/S0010-0277(97)00003-6
Zhu, Q., Nelissen, K., Van den Stock, J., De Winter, F. L., Pauwels, K., deGelder, B., et al. (2013). Dissimilar processing of emotional facial expres-sions in human and monkey temporal cortex. Neuroimage 66, 402–411. doi:10.1016/j.neuroimage.2012.10.083
Conflict of Interest Statement: The authors declare that the research was con-ducted in the absence of any commercial or financial relationships that could beconstrued as a potential conflict of interest.
Copyright © 2015 Bishop, Aguirre, Nunez-Elizalde and Toker. This is an open-access
article distributed under the terms of the Creative Commons Attribution License (CC
BY). The use, distribution or reproduction in other forums is permitted, provided the
original author(s) or licensor are credited and that the original publication in this
journal is cited, in accordance with accepted academic practice. No use, distribution
or reproduction is permitted which does not comply with these terms.
Frontiers in Human Neuroscience | www.frontiersin.org 15 March 2015 | Volume 9 | Article 152