Embed Size (px)
Citation preview
““Seeing is Knowing”Seeing is Knowing”
The iThe impact of technology on mpact of technology on visualization techniques used in visualization techniques used in
cartographycartographyPresenter: Jolanta SoltisPresenter: Jolanta Soltis
Class: CIS 679Class: CIS 679
Professor: Merry TuroffProfessor: Merry Turoff
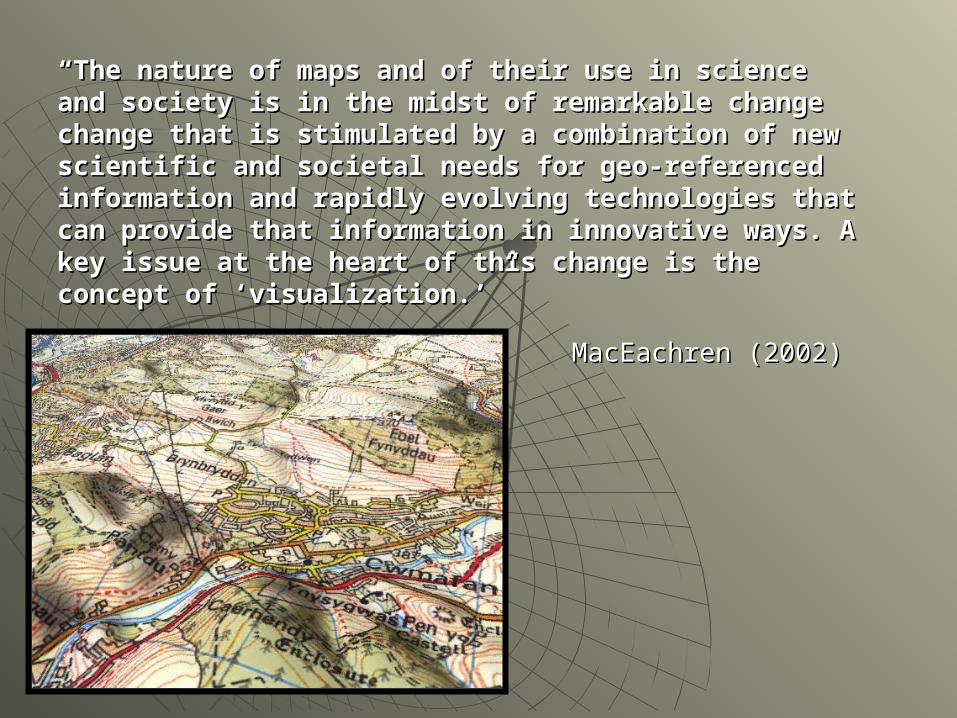
““The nature of maps and of their use in science and The nature of maps and of their use in science and society is in the midst of remarkable change change society is in the midst of remarkable change change that is stimulated by a combination of new scientific that is stimulated by a combination of new scientific and societal needs for geo-referenced information and societal needs for geo-referenced information and rapidly evolving technologies that can provide and rapidly evolving technologies that can provide that information in innovative ways. A key issue at that information in innovative ways. A key issue at the heart of this change is the concept of the heart of this change is the concept of ‘visualization.’”‘visualization.’”
MacEachren (2002)MacEachren (2002)
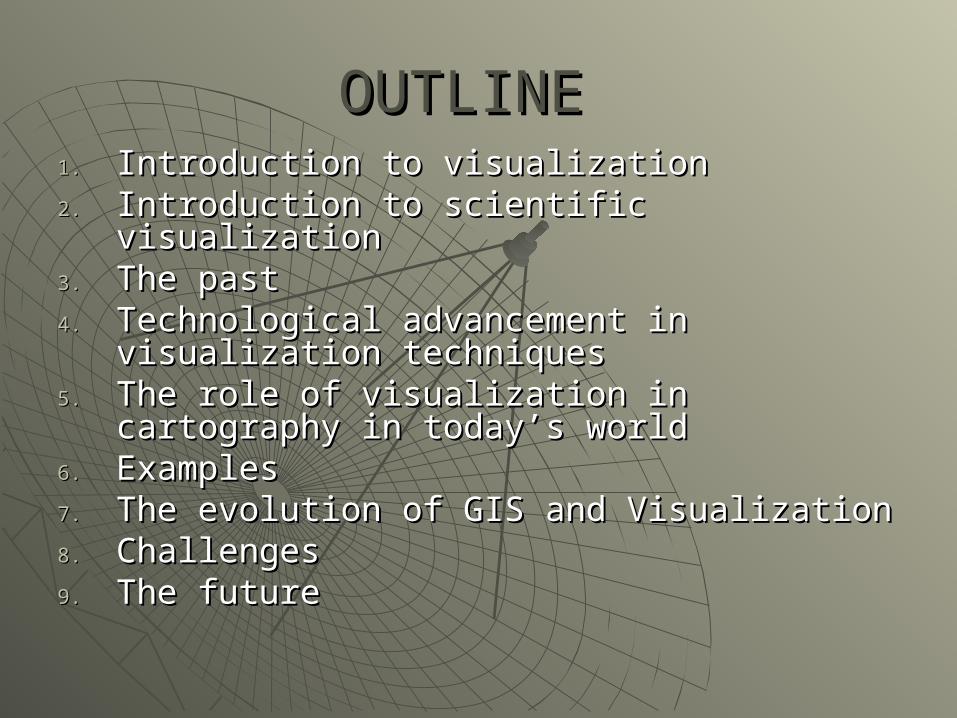
OUTLINE OUTLINE 1.1. Introduction to visualizationIntroduction to visualization2.2. Introduction to scientific visualizationIntroduction to scientific visualization3.3. The past The past 4.4. Technological advancement in Technological advancement in
visualization techniquesvisualization techniques5.5. The role of visualization in cartographyThe role of visualization in cartography in in
today’s world today’s world 6.6. ExamplesExamples7.7. The evolution of GIS and VisualizationThe evolution of GIS and Visualization8.8. ChallengesChallenges9.9. The futureThe future
Introduction to Introduction to visualizationvisualization
Introduction to visualizationIntroduction to visualization
Visualization allows scientists to:Visualization allows scientists to:• understandunderstand the meaning of millions the meaning of millions
of pieces of information in a visual of pieces of information in a visual formform
• interpretinterpret the meaning of this the meaning of this information information
Through the use of multi-Through the use of multi-dimensional, animated depictions of dimensional, animated depictions of data, it is possible to extrude data, it is possible to extrude previously unvisible informationpreviously unvisible information
What is Visualization?What is Visualization?
Is Is visualizationvisualization an activity carried out an activity carried out by human beings?by human beings?
Is Is visualization an activity carried out visualization an activity carried out by by computer?computer?
VisualizeVisualize::• ““To form a mental image or vision of …To form a mental image or vision of …””• ““To imagine or remember as if actually To imagine or remember as if actually
seeing.seeing.””
The purpose of data The purpose of data visualizationvisualization
To cTo convey information to people quickeronvey information to people quicker Visualization is a term with many meaningsVisualization is a term with many meanings
(MacEachern, 1995).(MacEachern, 1995).
• "Visualization" may mean two things."Visualization" may mean two things. Use graphical element to display resultsUse graphical element to display results Use 2 or 3dimensional graphics to diaplay data.Use 2 or 3dimensional graphics to diaplay data.
More possibilitiesMore possibilities• InteractionInteraction• zoomingzooming
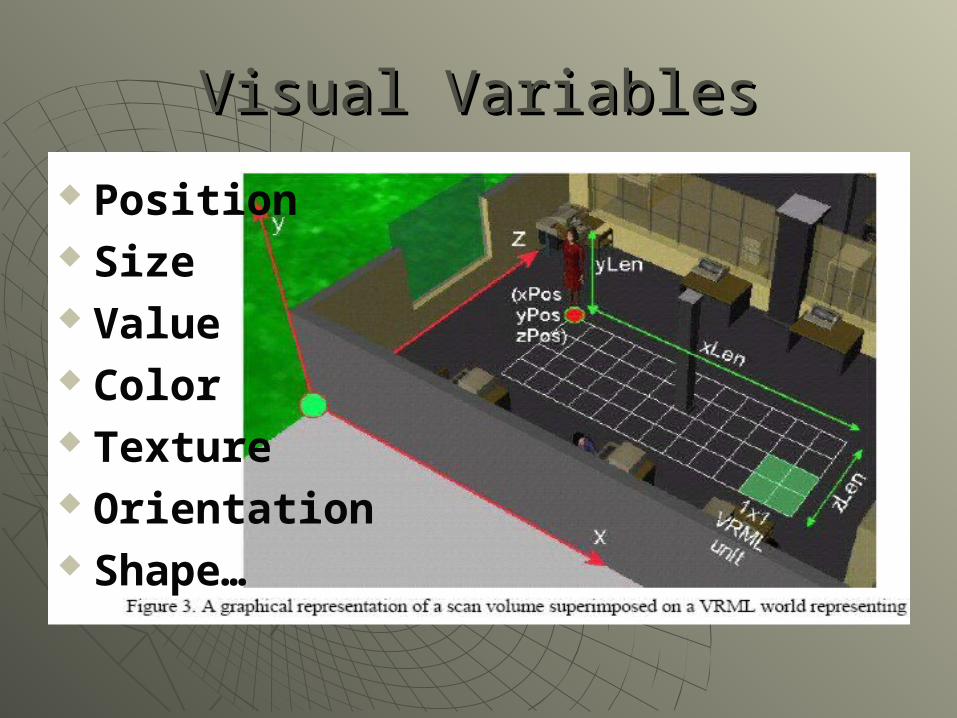
Visual VariablesVisual Variables
Position Size Value Color Texture Orientation Shape…
Static visual variablesStatic visual variables
Size (used to show changes in valueSize (used to show changes in value Value Value Texture/Grain and Color – used as a Texture/Grain and Color – used as a
accent or change in perspectiveaccent or change in perspective Orientation Orientation Form Form
Dynamic visual variablesDynamic visual variables
MomentMoment Duration (unit of time a frame is Duration (unit of time a frame is
displayed)displayed) Frequency (numbers of time forms Frequency (numbers of time forms
are displayed)are displayed) Order (time sequence)Order (time sequence) Rate of changeRate of change Synchronization (correspondence of Synchronization (correspondence of
series)series)
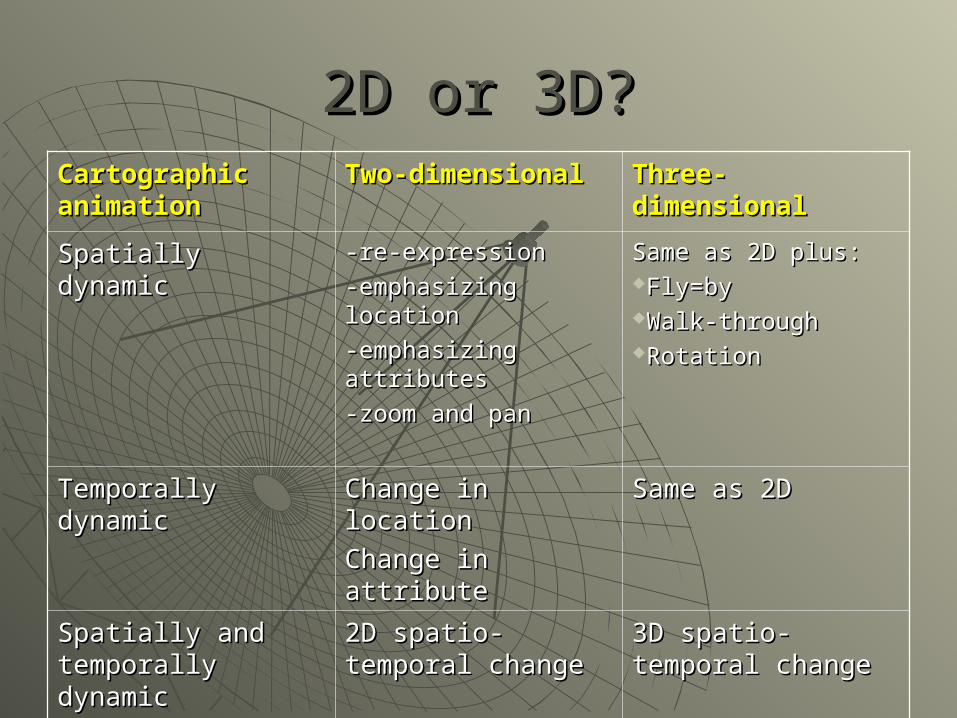
2D or 3D?2D or 3D?Cartographic Cartographic animationanimation
Two-dimensionalTwo-dimensional Three-Three-dimensionaldimensional
Spatially dynamicSpatially dynamic -re-expression-re-expression
-emphasizing location-emphasizing location
-emphasizing -emphasizing attributesattributes
-zoom and pan-zoom and pan
Same as 2D plus: Same as 2D plus: Fly=byFly=byWalk-throughWalk-throughRotationRotation
Temporally Temporally dynamicdynamic
Change in locationChange in location
Change in attributeChange in attributeSame as 2DSame as 2D
Spatially and Spatially and temporally dynamictemporally dynamic
2D spatio-temporal 2D spatio-temporal changechange
3D spatio-temporal 3D spatio-temporal changechange
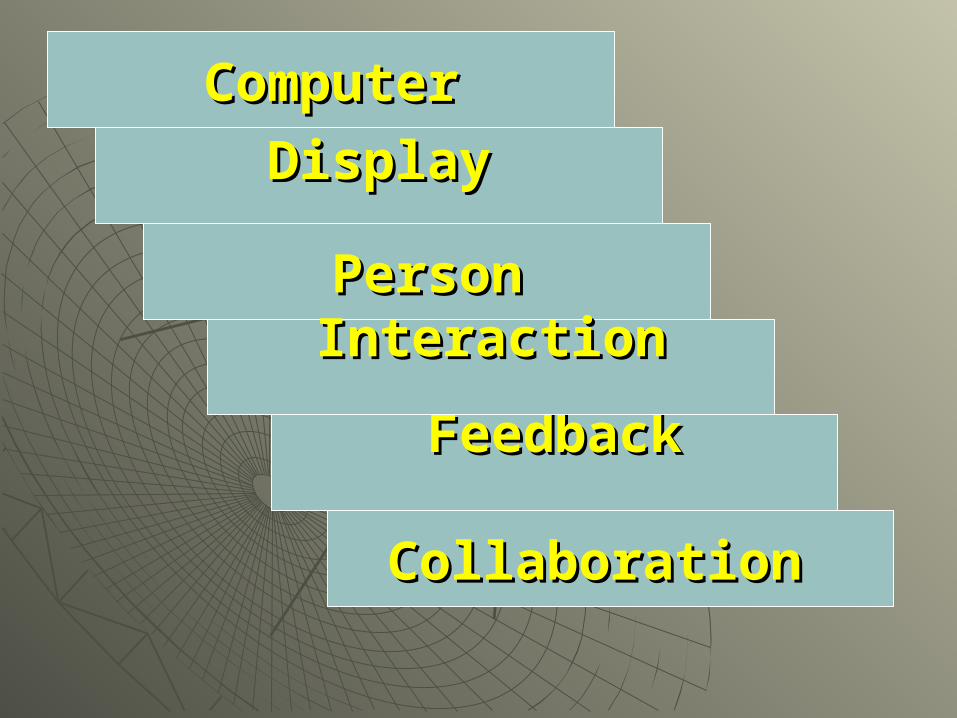
PersonPerson
FeedbackFeedback
ComputerComputer
DisplayDisplay
InteractionInteraction
Collaboration Collaboration
Introduction to scientific Introduction to scientific visualizationvisualization
What is scientific visualization?What is scientific visualization?
"Visualization, is the process of "Visualization, is the process of transforming raw data into a transforming raw data into a displayable image.”displayable image.”
Visvalingam (1994 )Visvalingam (1994 )
To visualize is “to form a mental image To visualize is “to form a mental image or vision of…” or vision of…”
Spence (2001)Spence (2001)
Scientific visualization serves two Scientific visualization serves two purposes:purposes:
Help scientists and engineers solve Help scientists and engineers solve problems.problems.
Explain and promote a particular Explain and promote a particular science to a wide audience. science to a wide audience.
Visualization solutionsVisualization solutions
Mental model – visualization – global Mental model – visualization – global translationtranslation• Invisible could be seenInvisible could be seen• Error detectionError detection• Interactivity and engaging different Interactivity and engaging different
audiencesaudiences• ImmersionImmersion
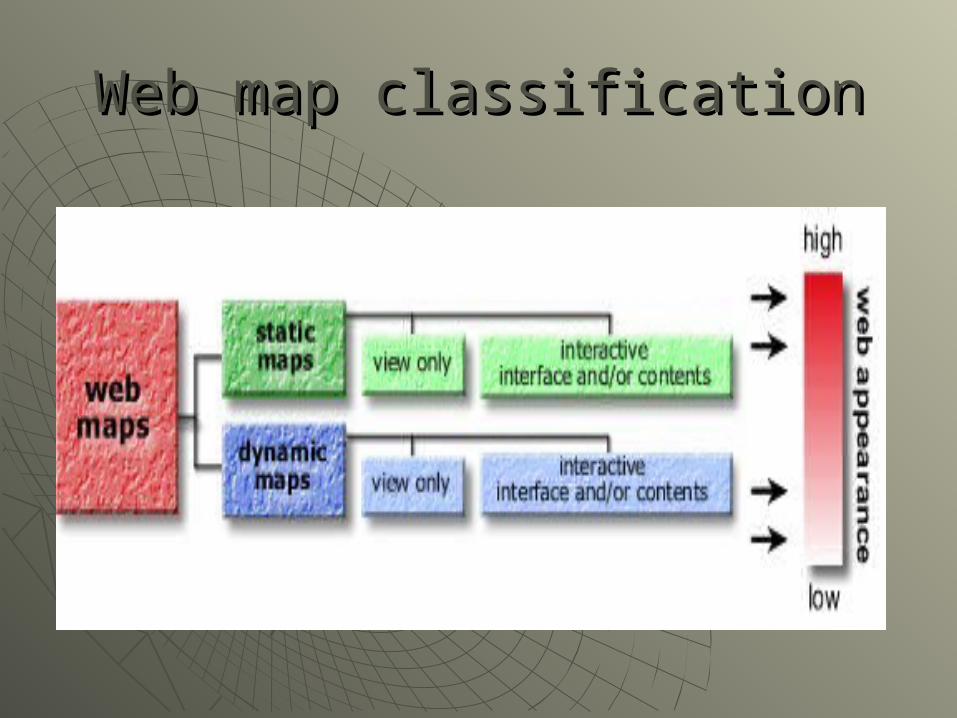
Web map classificationWeb map classification
The pastThe past ……
A little history…A little history…
Development of motion - about 100 years
Mobile sculpture – 20 years Video art – 20 years Animated maps – begin in the
1930’s, but were not developed until 1959
Computer animated maps: 1990’s
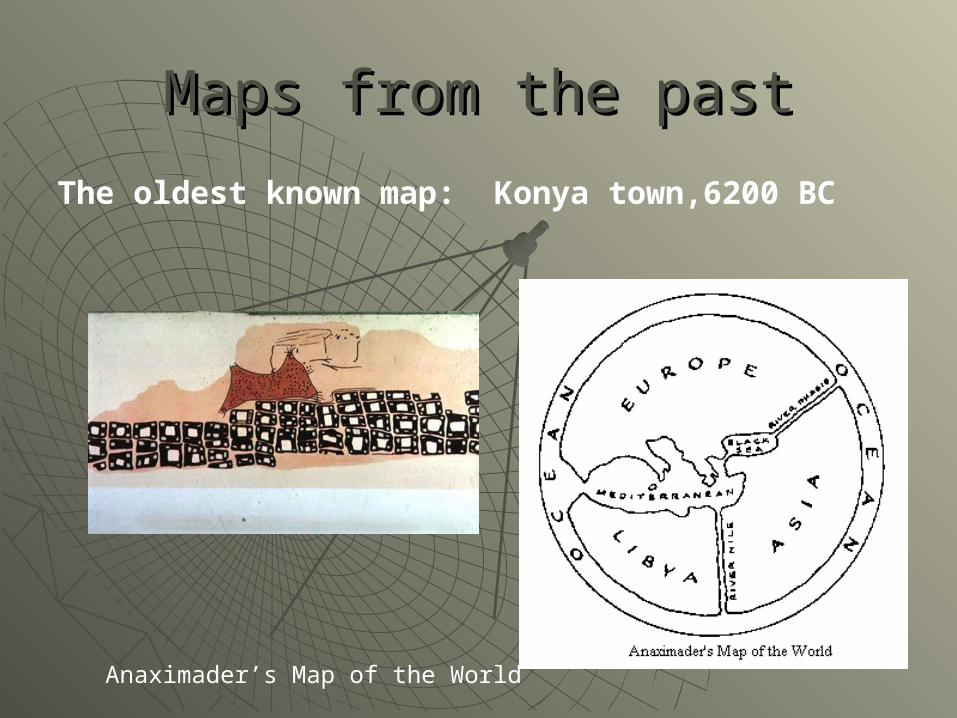
Maps from the pastMaps from the past
The oldest known map: Konya town,6200 BC
Anaximader’s Map of the World
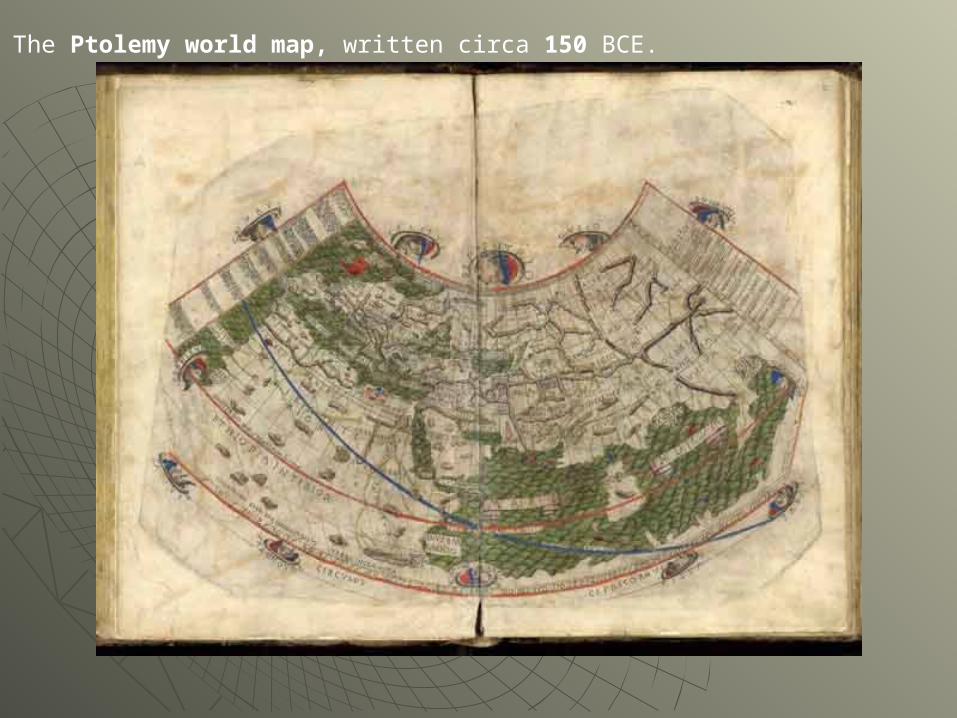
The Ptolemy world map, written circa 150 BCE.
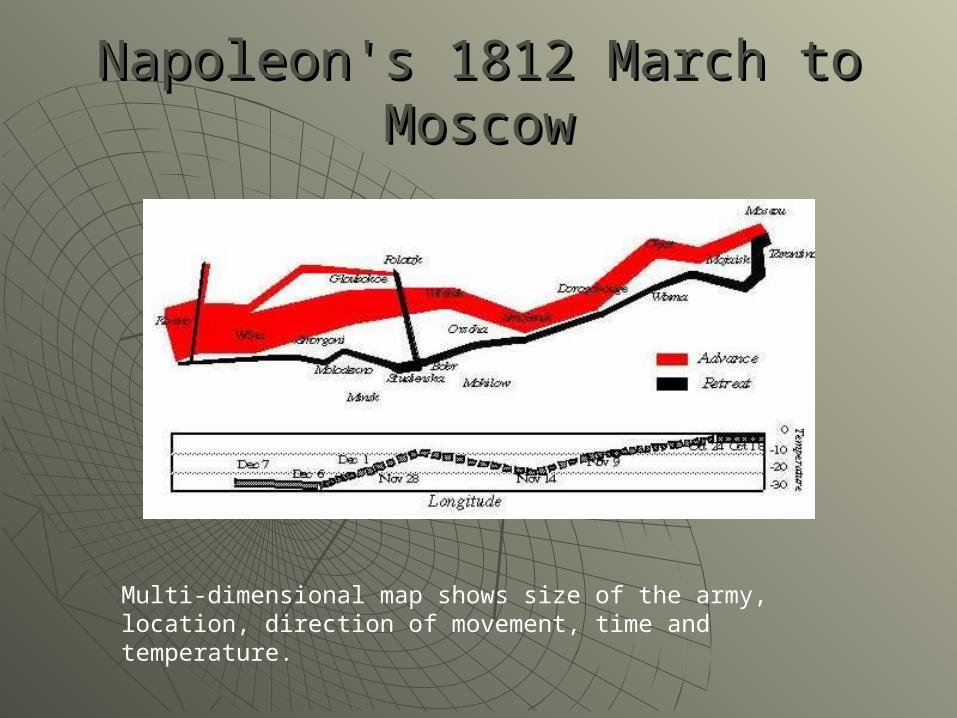
Napoleon's 1812 March to MoscowNapoleon's 1812 March to Moscow
Multi-dimensional map shows size of the army, location, direction of movement, time and temperature.
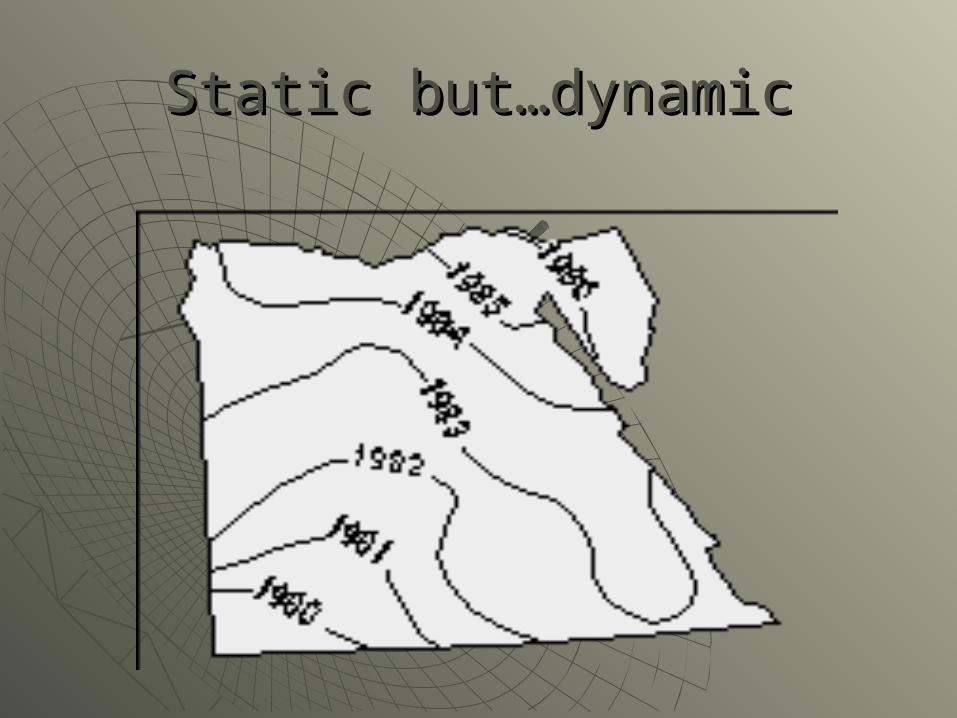
Static but…dynamicStatic but…dynamic
Dynamic maps…Dynamic maps…
In 1959 Thrower mention the of In 1959 Thrower mention the of audio-visual communication audio-visual communication possibilities.possibilities.
Walter Tobler developed first Walter Tobler developed first animation by using 3-D computer animation by using 3-D computer generated mapgenerated map
Technological advancement in Technological advancement in visualization techniquesvisualization techniques
Technological advancement in Technological advancement in visualization techniquesvisualization techniques
Impact of computerImpact of computer Increased processing powerIncreased processing power InternetInternet High quality graphicsHigh quality graphics VRML (Virtual Reality Modeling VRML (Virtual Reality Modeling
Language) Language) AnimationAnimation
ExamplesExamples
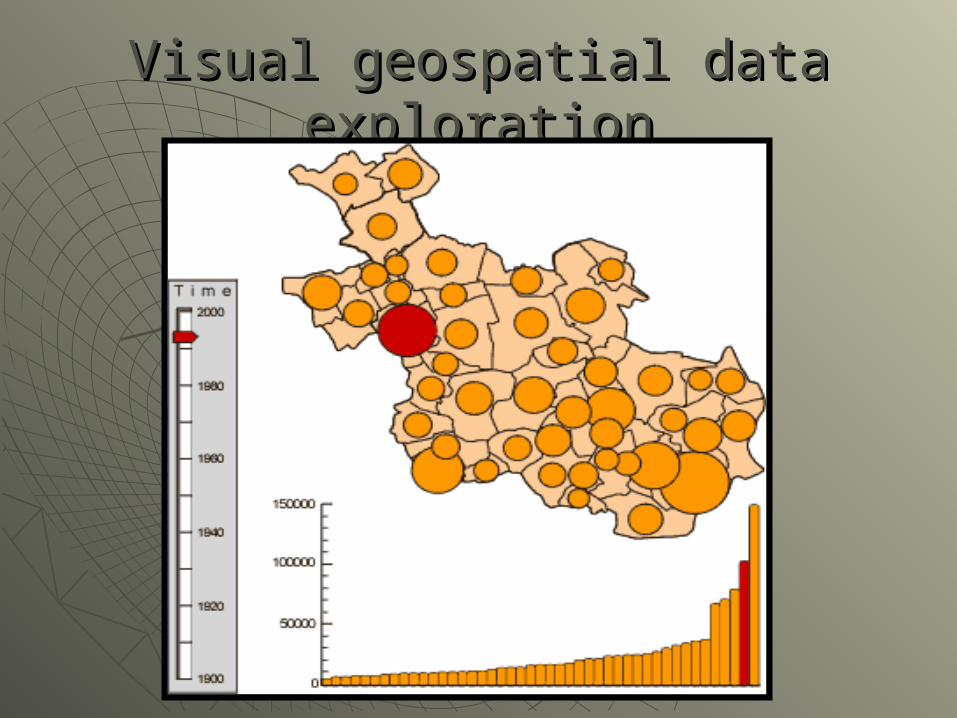
Visual geospatial data explorationVisual geospatial data exploration
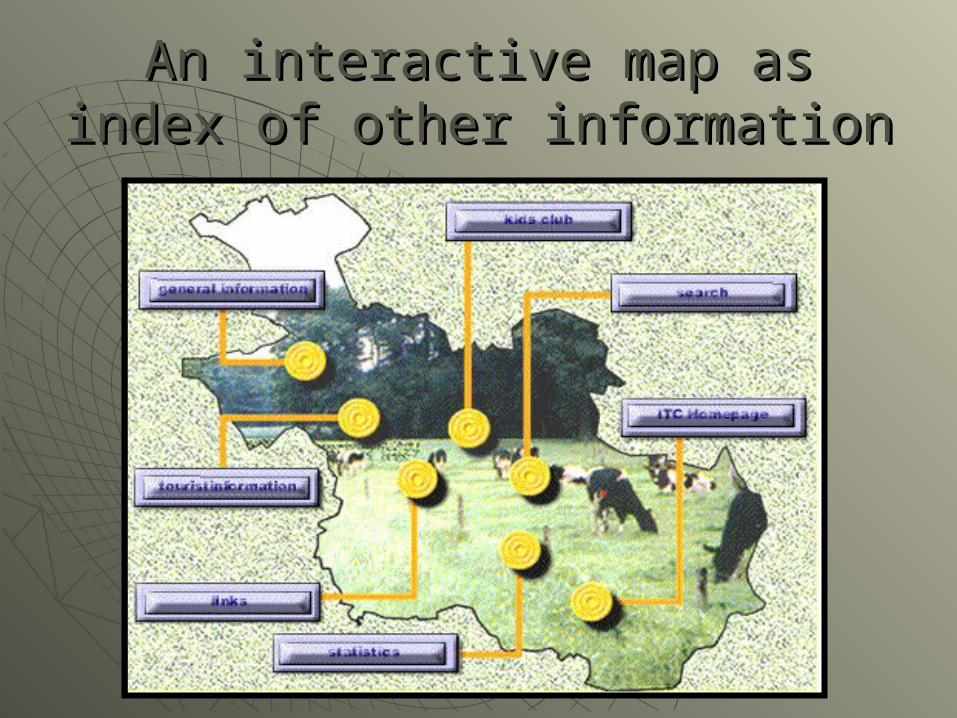
An interactive map as index of An interactive map as index of other informationother information
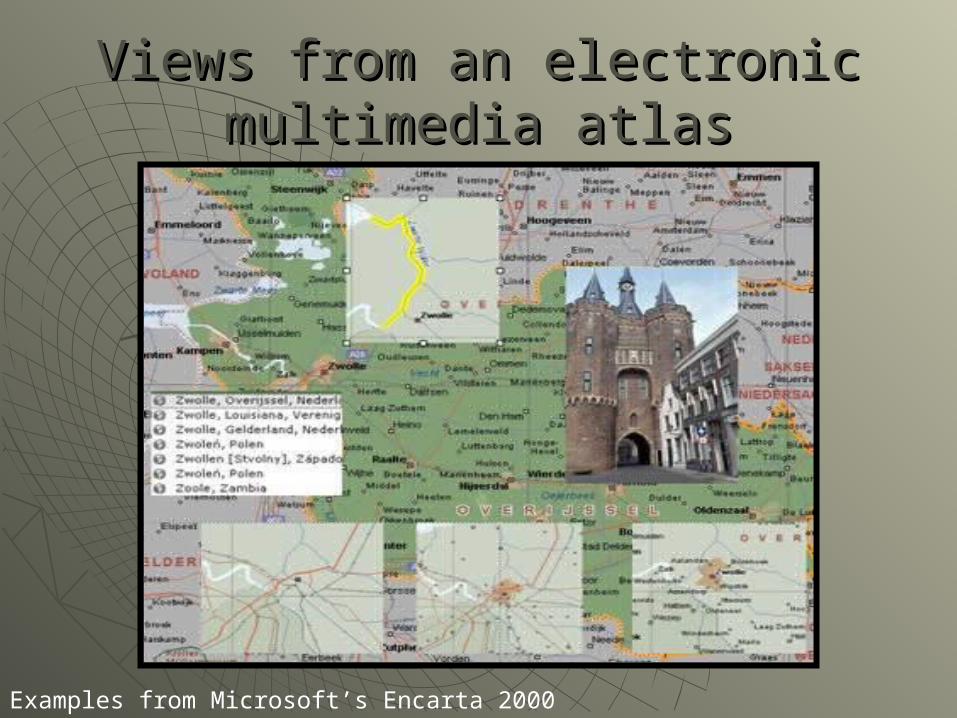
Views from an electronic Views from an electronic multimedia atlasmultimedia atlas
Examples from Microsoft’s Encarta 2000
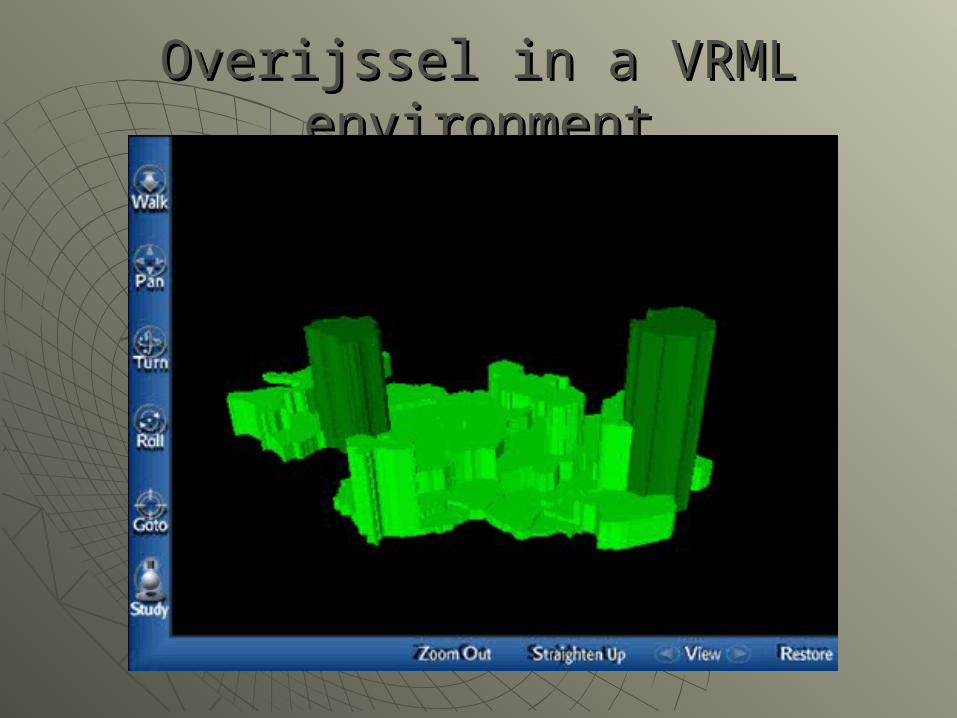
Overijssel in a VRML environmentOverijssel in a VRML environment
The role of visualization in The role of visualization in cartographycartography in today’s world in today’s world
The role of visualization in The role of visualization in cartographycartography
CommunicationCommunication ExplorationExploration ProcessingProcessing

CommunicationCommunication
Cartographic visualization relies on Cartographic visualization relies on the use of maps to communicate the use of maps to communicate cartographic ideas. cartographic ideas.
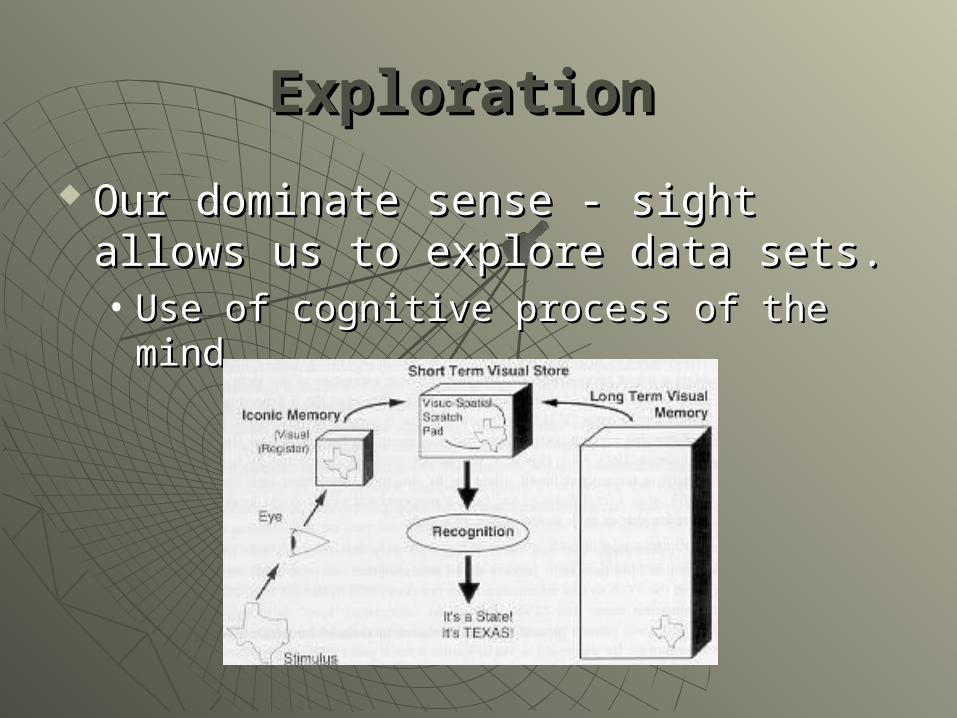
ExplorationExploration
Our dominate sense - sight allows us Our dominate sense - sight allows us to explore data sets.to explore data sets.• Use of cognitive process of the mindUse of cognitive process of the mind
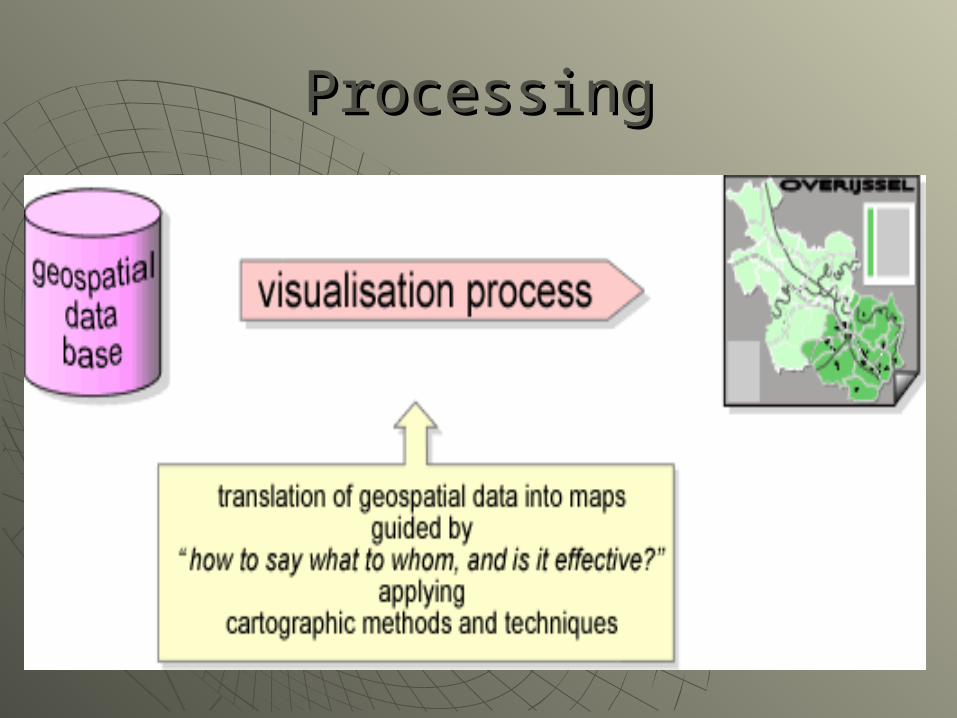
ProcessingProcessing
The evolution of GIS and The evolution of GIS and VisualizationVisualization
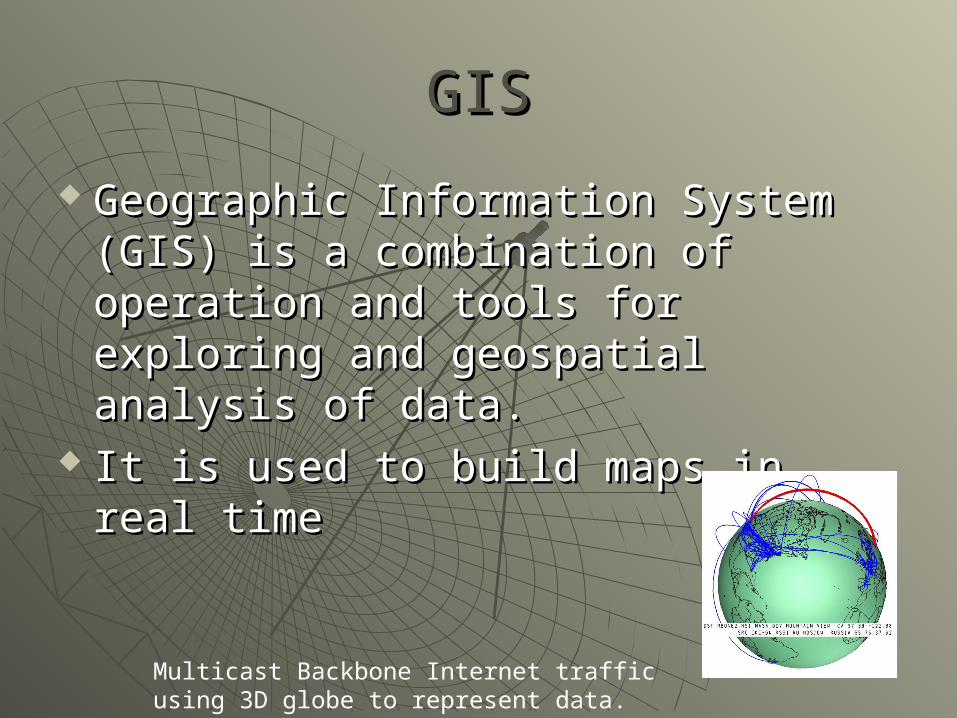
GGIISS
Geographic Information System (GIS) Geographic Information System (GIS) is a combination of operation and is a combination of operation and tools for exploring and geospatial tools for exploring and geospatial analysis of data. analysis of data.
It is used to build maps in real timeIt is used to build maps in real time
Multicast Backbone Internet traffic using 3D globe to represent data.
Geovisualiztion Geovisualiztion
Representation of geospatial information
Integration of computational and visual methods
Effective interface designs for geovisualization tools
Usability of geovisualization
Levels of GIS and VisualizationLevels of GIS and Visualization
Rudimentary: minimal data sharingRudimentary: minimal data sharing Operational: consistencyOperational: consistency Functional: transparent Functional: transparent
communicationcommunication Merged: one environmentMerged: one environment
Automatic Derivation of Electronic Automatic Derivation of Electronic Maps from X3D/VRML WorldsMaps from X3D/VRML Worlds
Use of web-base tools like:Use of web-base tools like:• VRML (Virtual Reality Modeling VRML (Virtual Reality Modeling
Language)Language)• High-end systems:High-end systems:
Mmersive workbenches, CAVEs, Power WallsMmersive workbenches, CAVEs, Power Walls
3D “worlds”3D “worlds”• Advantages: creating virtual “supper Advantages: creating virtual “supper
environments”environments”
Factors that contribute to the Factors that contribute to the virtuality of the “supper virtuality of the “supper
environments”environments”
Immersion (sensation of being in)Immersion (sensation of being in) Interactivity (virtual experience)Interactivity (virtual experience) Information intensity (details)Information intensity (details) Intelligence (realism)Intelligence (realism)
ChallengesChallenges How to show a mass of data How to show a mass of data How to show multiple information How to show multiple information Exploration of dataExploration of data Cumbersome productions of animationCumbersome productions of animation Data registration Data registration Development of virtual environment that could Development of virtual environment that could
lead to immersion on a geographic scalelead to immersion on a geographic scale Balancing abstraction and realismBalancing abstraction and realism Intelligence of objectsIntelligence of objects CollaborationCollaboration
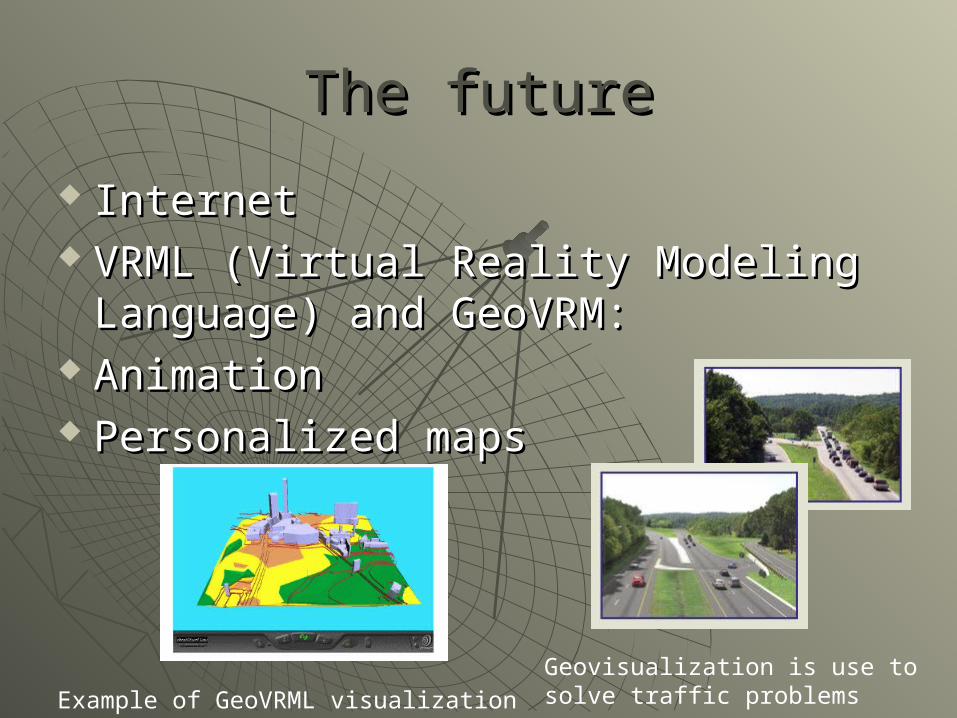
The futureThe future
InternetInternet VRML (Virtual Reality Modeling VRML (Virtual Reality Modeling
Language) and GeoVRM:Language) and GeoVRM: AnimationAnimation Personalized mapsPersonalized maps
Example of GeoVRML visualizationGeovisualization is use to solve traffic problems
ReferencesReferences
Spencer, R. Spencer, R. Information Visualization.Information Visualization. , (2001),, (2001), New York, NY: ACM Press New York, NY: ACM Press Books Books
Visvalingam M, (1995), “Visualization Visvalingam M, (1995), “Visualization in GIS, cartography and ViSC”, in GIS, cartography and ViSC”, Visualization in Geographical Visualization in Geographical Information Systems, Chapt 3, p18 Information Systems, Chapt 3, p18