Embed Size (px)
Citation preview
Seeing Is Believing: Experimental Evidence on theImpact of Eyeglasses on Academic Performance,Aspirations, and Dropout among Junior HighSchool Students in Rural China
jingchun nieShaanxi Normal University
xiaopeng pangRenmin University of China
lei wangShaanxi Normal University
scott rozelleShaanxi Normal University and StanfordUniversity
sean sylviaUniversity of North Carolina, Chapel Hill
I. IntroductionIt is estimated that 10%–15%of school-age children in developing countries arevisually impaired (Resnikoff et al. 2008; Pascolini andMariotti 2012). The vastmajority of these cases are because of refractive error (e.g., myopia) that can beeffectively addressedwith properly fitted eyeglasses, yet eyeglasses are taken up atlow rates (Resnikoff et al. 2008; Pascolini andMariotti 2012). Like other healthconditions affecting children, uncorrected vision problems among school-agechildren may have significant, long-term consequences if these problems nega-tively affect demand for education, school performance, and ultimate schoolingattainment.
Visual impairment may pose a significant constraint to children’s develop-ment in China, particularly in rural areas. One study has shown that nearly halfof all vision problems among children in the world occur in China (46%;Resnikoff et al. 2008). A large sample population-based study has also foundthat 24% of children with an average age of 10 from western rural China hadvisual problems (Yi et al. 2015a). It is estimated that the prevalence of myopiain rural China may exceed 60%, with two-thirds or more of rural children hav-ing no accurate correction (Congdon et al. 2008; Ma et al. 2014). Although no
This work was supported by the 111 Project (grant B16031). Contact the corresponding author, LeiWang, at [email protected].
Electronically published December 12, 2019© 2019 by The University of Chicago. All rights reserved. 0013-0079/2020/6802-0001$10.00
one knows precisely why the rates of myopia for students in China are higherthan elsewhere, this may be the result of the complex interaction between ge-netic and environmental factors unique to Asian children, such as genetic sus-ceptibility, living in a congested environment, and highly competitive educa-tion systems (namely, increased near-work activity and intense schooling; seeFan et al. 2004).
In this article, we report the results of a randomized trial in poor regions ofwestern China where free eyeglasses were distributed to myopic junior highschool students. We examine the effects of this intervention on student perfor-mance measured by standardized exams in math, aspirations for further school-ing, and dropout behavior over the course of a school year. At baseline, 50.4%of the children needed eyeglasses, yet only 31% of the myopic children ownedthem. We offered free eyeglasses to the students in the treatment group whileproviding prescriptions to the students in the control group (thus it is considereda standard-of-care control group). We find that offering free eyeglasses to stu-dents increases the average score of standardized exams by 0.14 standard devi-ation, raises aspirations to attend academic high school by 9 percentage points,and reduces dropout rate by 44%, or 2 percentage points (from 4.8% to 2.7%).The performance gap between students with and without vision problems atbaseline was 0.18 standard deviations; therefore, the treatment effect of provid-ing free eyeglasses closed this gap by 78%. Considering that the result is actuallythe effect of free eyeglass provision versus no eyeglass provision, conditional onboth sets of students knowing they need eyeglasses, we believe that this effectshould be considered quite large.
These findings build on recent studies that evaluated the effects of providingeyeglasses to youngermyopic students in primary schools on examperformance.Ma et al. (2014) find that the impact of providing free eyeglasses on the averagescores of standardized exams is 0.11 standard deviations. Glewwe, Park, andZhao (2016) find that wearing eyeglasses for 1 school year increases the averagescores of visually impaired students by 0.16–0.22 standard deviations, an im-provement equivalent to 0.3–0.5 additional years of schooling.1
Our results add to these previous studies by showing that free eyeglasses areeffective in raising academic achievement among older children in junior highschool and that they also affect outcomes related to ultimate schooling attain-ment that may not be captured by standardized exams alone. Although previousstudies have focused primarily on academic performance, this study’s findings
1 According to the assessment of our experts group (and international assessments), the expectedgrowth in scores for one more year of schooling is usually estimated to be about 0.30–0.40 standarddeviations for mathematics (Frenette 2008).
336 E C O N O M I C D E V E L O P M E N T A N D C U L T U R A L C H A N G E
include insights into the impact of free eyeglasses on dropout rates, showing thateyeglasses can improve actual schooling attainment rather than performancealone. Factors related to educational outcomes are particularly important tostudy at the junior high level because junior high students have higher ratesof poor vision on account of their age and because high-stakes testing at theend of junior high level places an increased premium on school performance.
Although previous studies have shown effects of free eyeglasses on academicachievement among primary school-age students, the effects of providing freeeyeglasses could differ among junior high students for several reasons. First, stu-dents may wear eyeglasses with different frequency and for different reasonsthan primary school students. Previous studies show that the beliefs and atti-tudes of individuals about eyeglasses and their social environment, especiallytheir parents, peers, and teachers, may interfere with the use (wearing) of eye-glasses (Lynch and Cicchetti 1997; Hanushek et al. 2003; Odedra et al. 2008).The academic environment of junior high school students differs from that ofprimary school students in terms of academic pressure from upcoming exams,increased understanding of the importance and usage of eyeglasses, and free-dom to make decisions independent of the input of parents. This means juniorhigh students may use eyeglasses with different frequency and at different timesthan primary school students, thus changing the impact of eyeglasses provision.Second, the older age of students might have an impact on the effectiveness ofthe program. Past research has been limited to primary school students and hasnot made clear whether interventions as late as junior high school can still beeffective. Our results indicate that the distribution of eyeglasses at the juniorhigh level can lead to academic improvements and can even allow students tobegin to close learning gaps caused by many years of poor eyesight.
Beyond improvement in exam performance, our results also show that ad-dressing uncorrected vision problems—a key health constraint to learning indeveloping countries—can have substantial effects on a broader range of out-comes extending to school progression. Evidence of these downstream bene-fits strengthens the argument for subsidization or free provision of eyeglassesto disadvantaged students in developing countries. These results also suggestthat, relative to interventions targeting students in primary schools, interven-tions targeting older children can also have meaningful effects and be highlycost-effective.
The remainder of this article is organized as follows: Section II describes theresearch design, data collection, and our statistical approach. In Section III, wereport our findings, focusing on whether the availability of free eyeglasses hasan impact on eyeglasses usage, academic performance, academic aspirations,and school dropout rates. In this section, we also examine whether there is
Nie et al. 337
any heterogeneity in the impacts of our intervention. Section IV presents ourconclusions.
II. Sampling, Randomization and Intervention, Data Collection,and Statistical Approach
A. SamplingOur experiment took place in three nationally designated poverty counties inYulin Prefecture, located in northern Shaanxi Province.2 To choose our sampleof schools and students, we followed a three-step process. First, we constructeda sampling frame using a list of all rural junior high schools in the three counties.There were a total of 47 junior high schools on this list. Second, we randomlychose 32 junior high schools from this list. This sample size was determinedbased on power calculations indicating that we required 16 schools per group.3
One school left the study after the baseline survey, leaving 31 schools in the finalsample. Third, within each school, the students from one class in each grade(grades 7 and 8) were surveyed. In the 16 cases where there was more than oneclass per grade, we randomly included one of these classes in impact evaluation.4
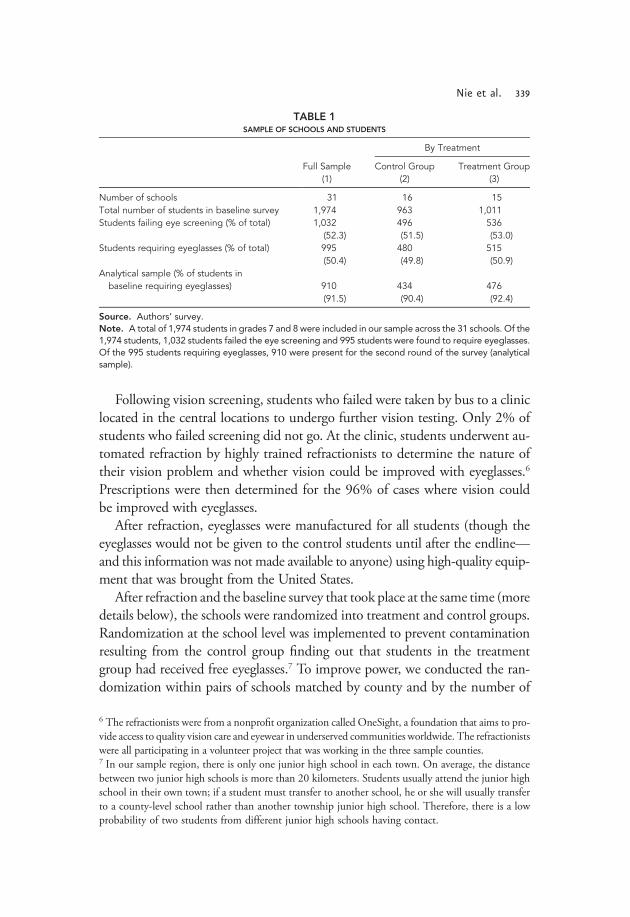
Sampled in this way, a total of 1,974 students in grades 7 and 8 were includedin the final sample across the 31 schools. A description of the sample is shown intable 1.
B. Randomization and InterventionAs part of the baseline survey (described later), all students were screened formyopia by a team of optometrists employed for the study. These optometristswere all trained by trainers from the Zhongshan Ophthalmic Center, SunYat-senUniversity (among the top ophthalmic centers inChina), to ensure stan-dardization and quality. Visual acuity (VA) was tested separately for each eye us-ing tumbling E charts.5 Students failed screening if they were determined tohave an uncorrected VA less than or equal to 6/12 in either eye. Approximately,one-half of the students failed the vision screening (table 1).
2 The net income of Shaanxi’s rural residents was ¥9,730 ($1,569) in 2014 (Government of Yulin2015), close to that year’s average level of income for all of China (¥9,892, or $1,569; NBSPRC2015). In the late 1990s, the national government selected around 600 of China’s 2,800 countiesas nationally designated poverty counties. Selection was based on rural income. Nationally designatedpoverty counties are recipients of a variety of government-sponsored poverty alleviation programs.3 We calculated that we needed 16 schools per experimental arm to detect a minimum effect size of0.25 math score with 80% power at a 5% significance level. We assumed an adjusted intraclustercorrelation of .10 (the realized intracluster correlation is .049 when adjusted for students’ character-istics and strata fixed effects), a pre- and postintervention correlation of .5 and 15% loss to follow-up.4 Students in treatment schools (described later) who were not in classes selected for the sample stillreceived free eyeglasses during the intervention period.5 E charts are accepted as the standard for accurate VA measurement (Camparini et al. 2001).
338 E C O N O M I C D E V E L O P M E N T A N D C U L T U R A L C H A N G E
Following vision screening, students who failed were taken by bus to a cliniclocated in the central locations to undergo further vision testing. Only 2% ofstudents who failed screening did not go. At the clinic, students underwent au-tomated refraction by highly trained refractionists to determine the nature oftheir vision problem and whether vision could be improved with eyeglasses.6
Prescriptions were then determined for the 96% of cases where vision couldbe improved with eyeglasses.
After refraction, eyeglasses were manufactured for all students (though theeyeglasses would not be given to the control students until after the endline—and this information was not made available to anyone) using high-quality equip-ment that was brought from the United States.
After refraction and the baseline survey that took place at the same time (moredetails below), the schools were randomized into treatment and control groups.Randomization at the school level was implemented to prevent contaminationresulting from the control group finding out that students in the treatmentgroup had received free eyeglasses.7 To improve power, we conducted the ran-domization within pairs of schools matched by county and by the number of
TABLE 1SAMPLE OF SCHOOLS AND STUDENTS
By Treatment
Full Sample Control Group Treatment Group(1) (2) (3)
Number of schools 31 16 15Total number of students in baseline survey 1,974 963 1,011Students failing eye screening (% of total) 1,032 496 536
(52.3) (51.5) (53.0)Students requiring eyeglasses (% of total) 995 480 515
(50.4) (49.8) (50.9)Analytical sample (% of students in
baseline requiring eyeglasses) 910 434 476(91.5) (90.4) (92.4)
Source. Authors’ survey.Note. A total of 1,974 students in grades 7 and 8 were included in our sample across the 31 schools. Of the1,974 students, 1,032 students failed the eye screening and 995 students were found to require eyeglasses.Of the 995 students requiring eyeglasses, 910 were present for the second round of the survey (analyticalsample).
6 The refractionists were from a nonprofit organization called OneSight, a foundation that aims to pro-vide access to quality vision care and eyewear in underserved communities worldwide. The refractionistswere all participating in a volunteer project that was working in the three sample counties.7 In our sample region, there is only one junior high school in each town. On average, the distancebetween two junior high schools is more than 20 kilometers. Students usually attend the junior highschool in their own town; if a student must transfer to another school, he or she will usually transferto a county-level school rather than another township junior high school. Therefore, there is a lowprobability of two students from different junior high schools having contact.
Nie et al. 339
students found to require eyeglasses in the schools. Our analysis takes this ran-domization procedure into account by controlling for dummy variables for eachmatched pair (Bruhn and McKenzie 2009).
Following the randomization, free eyeglasses were distributed in treatmentschools to the students found to require eyeglasses, regardless of whether theyalready had eyeglasses. Refractionists visited the schools and dispensed the eye-glasses, adjusting them to make sure they fit well, and answered any questionsstudents had about wearing and caring for their eyeglasses.
Students in control group schools were only provided with an eyeglass prescrip-tion and asked to take the prescription to their parents. It was not until after theendline survey was complete that the students in this group received free eyeglasses,and students and teachers in control group schools were unaware that they wouldbe receiving free eyeglasses. It is important to remember, however, that students inthis group did receive an eyeglass prescription and information that they were my-opic (so it might also be appropriate to call this group a standard-of-care controlgroup). We are therefore comparing a policy of providing free prescription eye-glasses to one of providing only eye screening and prescriptions.
C. Data CollectionThe research group conducted baseline and endline surveys. The baseline surveywas conducted in September 2013 (prior to the start of the intervention), whichwas at the beginning of the 2013–14 academic year. The endline survey wasconducted in May 2014, close to the end of the 2013–14 academic year.
In each round of the survey, the data collection effort consisted of two parts.First, our enumerators (graduate students from Shaanxi Normal University whowere trained in enumeration techniques) administered questionnaires to stu-dents and teachers to collect information on student, family, and school char-acteristics. In addition to basic student and household characteristics, studentsurveys also asked about eyeglasses ownership and the use of eyeglasses. Usageof eyeglasses is defined by whether a student wears his or her eyeglasses andwas measured with self-reported survey responses of whether children wore eye-glasses regularly in class. We also asked the students about their plans after ju-nior high school or their academic aspirations. Specifically, we wanted to knowif students intended (a) to attend academic high school, (b) to attend vocationalhigh school, (c) to finish junior high school, or (d ) to go to work (or drop out)before the end of junior high school.
In the second part of the survey, each student was given a standardized mathexam. The questions used in the math exam were drawn from a bank of ques-tions developed by the Trends in International Mathematics and Science Study(TIMSS) testing service. The TIMSS test is an international assessment of
340 E C O N O M I C D E V E L O P M E N T A N D C U L T U R A L C H A N G E
mathematics and science achievement for primary and junior high school stu-dents. To ensure coherence with the national curriculum, the test questionswere chosen with assistance from educators in the local bureaus of education.We pretested the exam repeatedly to ensure its relevance and that the time limitswere appropriate. The exam was timed carefully and proctored closely by twoenumerators at each school. No feedback was given after the baseline test,and no indication was given that we would administer another exam in the fu-ture. For the analysis part of our study, scores for the standardizedmath tests arenormalized by the distribution of scores in each grade in the control group.
As part of the baseline survey, we administered the VA screening test referredto earlier. To calculate and compare different levels of VA in the empirical exer-cises in the rest of this article, VA is measured by LogMAR, which is among themost commonly used continuous scales in the field of ophthalmology/optom-etry (Bailey and Lovie 1976;Grosvendor 2007). The higher the LogMAR value,the worse is one’s vision.
Dropout was determined as part of the endline survey. For each student notin the classroom at the time of the endline survey (i.e., attrited), the survey teamworked with homeroom teachers to determine whether the student was merelyabsent or whether he or she (a) had transferred to another school, (b) was out onleave, or (c) had dropped out of school. In the analysis, dropout is a binary var-iable taking a value of 1 if a student dropped out of school between the baselineand endline surveys and 0 otherwise.
D. Summary Statistics and Baseline BalanceOf the 1,974 students given eye examinations at baseline, 995 (50.4%) werefound to need eyeglasses (table 1). Such rates of poor vision, although high byinternational standards (Maul et al. 2000; Murthy et al. 2002), are similar tofindings of previous studies among junior high students in China (He et al.2007). Only these students are included in the analysis sample.
Table 2 shows descriptive statistics and tests of balance between the treat-ment and control groups for the analytical sample. This is the sample of studentswho failed the vision check, whose eyesight could be improved with eyeglasses,and who were included in the endline survey. An analogous table using thepreattrition sample is table A1.8 At baseline, only 31% of the students whoneeded glasses owned them. This rate of uncorrected myopia (69%) is sim-ilar to findings in the literature for younger children (Congdon et al. 2008;
8 During the survey, we identified 85 students as attriters (8.5%, 46 in the control group and 39 inthe treatment group) who dropped out or transferred schools for various reasons (most commonly,they had moved to a nearby city with their parents).
Nie et al. 341
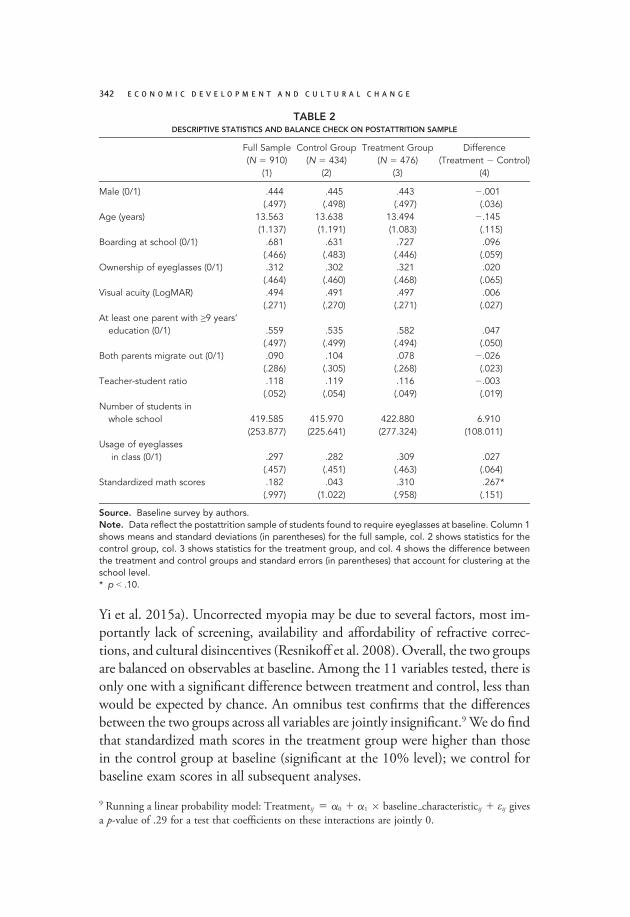
Yi et al. 2015a). Uncorrected myopia may be due to several factors, most im-portantly lack of screening, availability and affordability of refractive correc-tions, and cultural disincentives (Resnikoff et al. 2008). Overall, the two groupsare balanced on observables at baseline. Among the 11 variables tested, there isonly one with a significant difference between treatment and control, less thanwould be expected by chance. An omnibus test confirms that the differencesbetween the two groups across all variables are jointly insignificant.9 We do findthat standardized math scores in the treatment group were higher than thosein the control group at baseline (significant at the 10% level); we control forbaseline exam scores in all subsequent analyses.
TABLE 2DESCRIPTIVE STATISTICS AND BALANCE CHECK ON POSTATTRITION SAMPLE
Full Sample(N 5 910)
Control Group(N 5 434)
Treatment Group(N 5 476)
Difference(Treatment 2 Control)
(1) (2) (3) (4)
Male (0/1) .444 .445 .443 2.001(.497) (.498) (.497) (.036)
Age (years) 13.563 13.638 13.494 2.145(1.137) (1.191) (1.083) (.115)
Boarding at school (0/1) .681 .631 .727 .096(.466) (.483) (.446) (.059)
Ownership of eyeglasses (0/1) .312 .302 .321 .020(.464) (.460) (.468) (.065)
Visual acuity (LogMAR) .494 .491 .497 .006(.271) (.270) (.271) (.027)
At least one parent with ≥9 years’education (0/1) .559 .535 .582 .047
(.497) (.499) (.494) (.050)Both parents migrate out (0/1) .090 .104 .078 2.026
(.286) (.305) (.268) (.023)Teacher-student ratio .118 .119 .116 2.003
(.052) (.054) (.049) (.019)Number of students in
whole school 419.585 415.970 422.880 6.910(253.877) (225.641) (277.324) (108.011)
Usage of eyeglassesin class (0/1) .297 .282 .309 .027
(.457) (.451) (.463) (.064)Standardized math scores .182 .043 .310 .267*
(.997) (1.022) (.958) (.151)
Source. Baseline survey by authors.Note. Data reflect the postattrition sample of students found to require eyeglasses at baseline. Column 1shows means and standard deviations (in parentheses) for the full sample, col. 2 shows statistics for thecontrol group, col. 3 shows statistics for the treatment group, and col. 4 shows the difference betweenthe treatment and control groups and standard errors (in parentheses) that account for clustering at theschool level.* p < .10.
9 Running a linear probability model: Treatmentij 5 a0 1 a1 � baseline characteristicij 1 εij givesa p-value of .29 for a test that coefficients on these interactions are jointly 0.
342 E C O N O M I C D E V E L O P M E N T A N D C U L T U R A L C H A N G E
E. Statistical ApproachWe estimate the treatment effects of providing free eyeglasses with ordinaryleast squares regression. Only the students who were found to require eye-glasses at baseline are included in the analysis sample. We estimate the follow-ing regression:
Yij 5 a0 1 a1Treatmentj 1 X 0i a2 1 J0
pa3 1 εij, (1)
where Yij is the outcome variable at the endline survey for student i in school jamong the students requiring eyeglasses. In the analysis that follows, Yij is one ofseveral outcome variables: (a) the usage of eyeglasses, (b) standardized mathscores (normalized by the distribution in the control group), (c) aspiration forfurther schooling, or (d ) dropout. On the right-hand side of equation (1),Treatmentj is a dummy variable that is equal to 1 if the student is in a treatmentschool, Xi is a set of baseline controls, Jp is a vector of dummy variables for ran-domization strata (to account for the stratified randomization procedure), andɛij is an error term that is correlated within schools. The parameter a1 givesthe estimate of the causal effect of receiving free eyeglasses. Specifically, becausethe Treatmentj variable is equal to 1 regardless of whether students wore eye-glasses they were given, a1 gives the intention-to-treat (ITT) estimate of treat-ment effects, or the effects of distributing free eyeglasses regardless of take-up.
In the analysis that follows, we present results excluding and including an ex-panded set of baseline controls, Xi, including characteristics of students andschools at baseline: student gender, student age, whether the student boardsat school, ownership of eyeglasses at baseline, student VAmeasured in LogMAR(a continuous variable), standardized math score at baseline, whether both par-ents have migrated elsewhere for work, whether a parent attained more than9 years of schooling, teacher-student ratio at the student’s school, and the totalnumber of students in the school.
Motivated by the differences that exist between the students who did and didnot own eyeglasses at baseline, we test the effects of free eyeglasses using the fullsample as well as within subgroups of students with and without eyeglasses atbaseline. In all of the regressions, we calculate robust standard errors to adjustfor clustering by school.
III. ResultsWe examine the effects of providing free eyeglasses on three sets of outcomes.First, we test effects on the use of eyeglasses. Next, we test effects on outcomesintermediate to dropout behavior, including academic performance (as mea-sured using standardized exams in math) and aspirations for final schooling. Fi-nally, we examine ultimate effects on dropout behavior during the school year.
Nie et al. 343
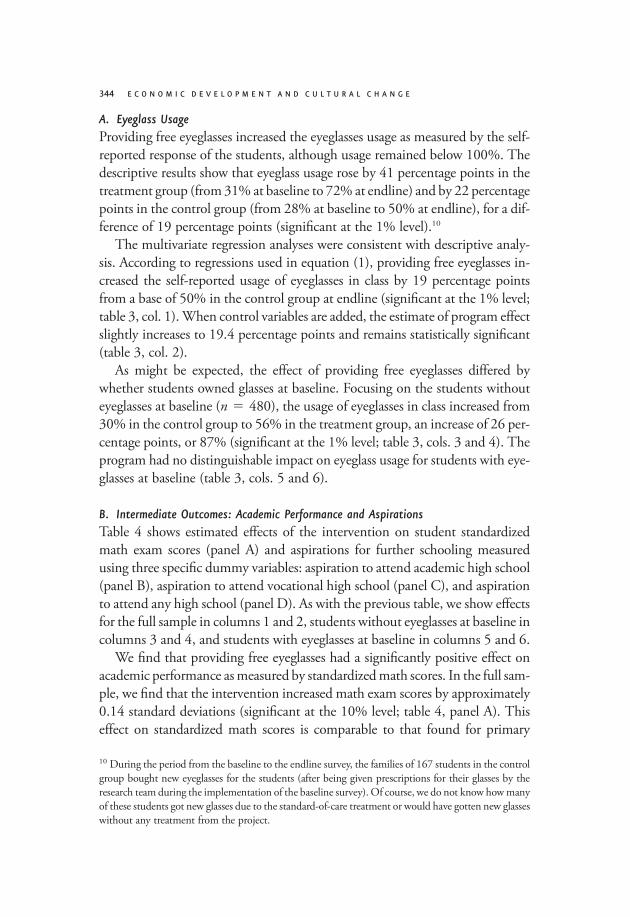
A. Eyeglass UsageProviding free eyeglasses increased the eyeglasses usage as measured by the self-reported response of the students, although usage remained below 100%. Thedescriptive results show that eyeglass usage rose by 41 percentage points in thetreatment group (from31% at baseline to 72% at endline) and by 22 percentagepoints in the control group (from 28% at baseline to 50% at endline), for a dif-ference of 19 percentage points (significant at the 1% level).10
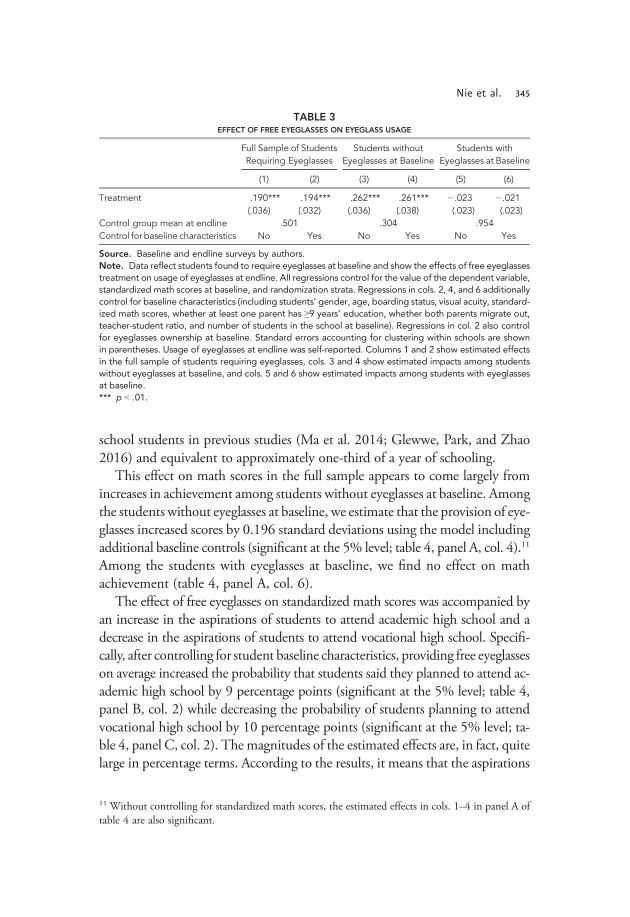
The multivariate regression analyses were consistent with descriptive analy-sis. According to regressions used in equation (1), providing free eyeglasses in-creased the self-reported usage of eyeglasses in class by 19 percentage pointsfrom a base of 50% in the control group at endline (significant at the 1% level;table 3, col. 1).When control variables are added, the estimate of program effectslightly increases to 19.4 percentage points and remains statistically significant(table 3, col. 2).
As might be expected, the effect of providing free eyeglasses differed bywhether students owned glasses at baseline. Focusing on the students withouteyeglasses at baseline (n 5 480), the usage of eyeglasses in class increased from30% in the control group to 56% in the treatment group, an increase of 26 per-centage points, or 87% (significant at the 1% level; table 3, cols. 3 and 4). Theprogram had no distinguishable impact on eyeglass usage for students with eye-glasses at baseline (table 3, cols. 5 and 6).
B. Intermediate Outcomes: Academic Performance and AspirationsTable 4 shows estimated effects of the intervention on student standardizedmath exam scores (panel A) and aspirations for further schooling measuredusing three specific dummy variables: aspiration to attend academic high school(panel B), aspiration to attend vocational high school (panel C), and aspirationto attend any high school (panel D). As with the previous table, we show effectsfor the full sample in columns 1 and 2, students without eyeglasses at baseline incolumns 3 and 4, and students with eyeglasses at baseline in columns 5 and 6.
We find that providing free eyeglasses had a significantly positive effect onacademic performance asmeasured by standardizedmath scores. In the full sam-ple, we find that the intervention increased math exam scores by approximately0.14 standard deviations (significant at the 10% level; table 4, panel A). Thiseffect on standardized math scores is comparable to that found for primary
10 During the period from the baseline to the endline survey, the families of 167 students in the controlgroup bought new eyeglasses for the students (after being given prescriptions for their glasses by theresearch team during the implementation of the baseline survey). Of course, we do not know howmanyof these students got new glasses due to the standard-of-care treatment or would have gotten new glasseswithout any treatment from the project.
344 E C O N O M I C D E V E L O P M E N T A N D C U L T U R A L C H A N G E
school students in previous studies (Ma et al. 2014; Glewwe, Park, and Zhao2016) and equivalent to approximately one-third of a year of schooling.
This effect on math scores in the full sample appears to come largely fromincreases in achievement among students without eyeglasses at baseline. Amongthe students without eyeglasses at baseline, we estimate that the provision of eye-glasses increased scores by 0.196 standard deviations using the model includingadditional baseline controls (significant at the 5% level; table 4, panel A, col. 4).11
Among the students with eyeglasses at baseline, we find no effect on mathachievement (table 4, panel A, col. 6).
The effect of free eyeglasses on standardized math scores was accompanied byan increase in the aspirations of students to attend academic high school and adecrease in the aspirations of students to attend vocational high school. Specifi-cally, after controlling for student baseline characteristics, providing free eyeglasseson average increased the probability that students said they planned to attend ac-ademic high school by 9 percentage points (significant at the 5% level; table 4,panel B, col. 2) while decreasing the probability of students planning to attendvocational high school by 10 percentage points (significant at the 5% level; ta-ble 4, panel C, col. 2). The magnitudes of the estimated effects are, in fact, quitelarge in percentage terms. According to the results, it means that the aspirations
TABLE 3EFFECT OF FREE EYEGLASSES ON EYEGLASS USAGE
Full Sample of StudentsRequiring Eyeglasses
Students withoutEyeglasses at Baseline
Students withEyeglasses at Baseline
(1) (2) (3) (4) (5) (6)
Treatment .190*** .194*** .262*** .261*** 2.023 2.021(.036) (.032) (.036) (.038) (.023) (.023)
Control group mean at endline .501 .304 .954Control for baseline characteristics No Yes No Yes No Yes
Source. Baseline and endline surveys by authors.Note. Data reflect students found to require eyeglasses at baseline and show the effects of free eyeglassestreatment on usage of eyeglasses at endline. All regressions control for the value of the dependent variable,standardized math scores at baseline, and randomization strata. Regressions in cols. 2, 4, and 6 additionallycontrol for baseline characteristics (including students’ gender, age, boarding status, visual acuity, standard-ized math scores, whether at least one parent has ≥9 years’ education, whether both parents migrate out,teacher-student ratio, and number of students in the school at baseline). Regressions in col. 2 also controlfor eyeglasses ownership at baseline. Standard errors accounting for clustering within schools are shownin parentheses. Usage of eyeglasses at endline was self-reported. Columns 1 and 2 show estimated effectsin the full sample of students requiring eyeglasses, cols. 3 and 4 show estimated impacts among studentswithout eyeglasses at baseline, and cols. 5 and 6 show estimated impacts among students with eyeglassesat baseline.*** p < .01.
11 Without controlling for standardized math scores, the estimated effects in cols. 1–4 in panel A oftable 4 are also significant.
Nie et al. 345
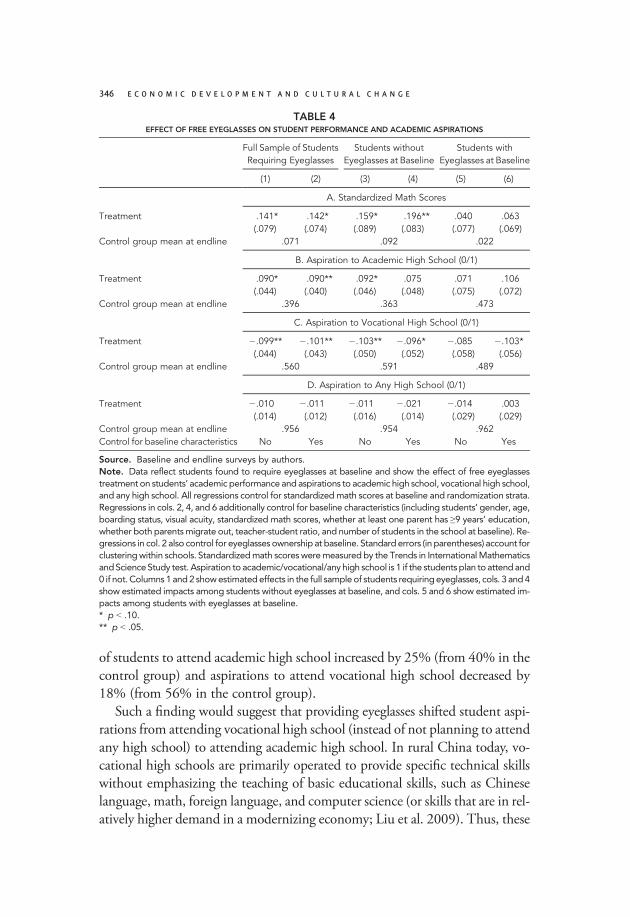
of students to attend academic high school increased by 25% (from 40% in thecontrol group) and aspirations to attend vocational high school decreased by18% (from 56% in the control group).
Such a finding would suggest that providing eyeglasses shifted student aspi-rations from attending vocational high school (instead of not planning to attendany high school) to attending academic high school. In rural China today, vo-cational high schools are primarily operated to provide specific technical skillswithout emphasizing the teaching of basic educational skills, such as Chineselanguage, math, foreign language, and computer science (or skills that are in rel-atively higher demand in a modernizing economy; Liu et al. 2009). Thus, these
TABLE 4EFFECT OF FREE EYEGLASSES ON STUDENT PERFORMANCE AND ACADEMIC ASPIRATIONS
Full Sample of StudentsRequiring Eyeglasses
Students withoutEyeglasses at Baseline
Students withEyeglasses at Baseline
(1) (2) (3) (4) (5) (6)
A. Standardized Math Scores
Treatment .141* .142* .159* .196** .040 .063(.079) (.074) (.089) (.083) (.077) (.069)
Control group mean at endline .071 .092 .022
B. Aspiration to Academic High School (0/1)
Treatment .090* .090** .092* .075 .071 .106(.044) (.040) (.046) (.048) (.075) (.072)
Control group mean at endline .396 .363 .473
C. Aspiration to Vocational High School (0/1)
Treatment 2.099** 2.101** 2.103** 2.096* 2.085 2.103*(.044) (.043) (.050) (.052) (.058) (.056)
Control group mean at endline .560 .591 .489
D. Aspiration to Any High School (0/1)
Treatment 2.010 2.011 2.011 2.021 2.014 .003(.014) (.012) (.016) (.014) (.029) (.029)
Control group mean at endline .956 .954 .962Control for baseline characteristics No Yes No Yes No Yes
Source. Baseline and endline surveys by authors.Note. Data reflect students found to require eyeglasses at baseline and show the effect of free eyeglassestreatment on students’ academic performance and aspirations to academic high school, vocational high school,and any high school. All regressions control for standardizedmath scores at baseline and randomization strata.Regressions in cols. 2, 4, and 6 additionally control for baseline characteristics (including students’ gender, age,boarding status, visual acuity, standardized math scores, whether at least one parent has ≥9 years’ education,whether both parentsmigrate out, teacher-student ratio, and number of students in the school at baseline). Re-gressions in col. 2 also control for eyeglasses ownership at baseline. Standard errors (in parentheses) account forclusteringwithin schools. Standardizedmath scores weremeasured by the Trends in InternationalMathematicsandScienceStudy test. Aspiration to academic/vocational/any high school is 1 if the students plan toattend and0 if not. Columns 1 and2 showestimatedeffects in the full sampleof students requiringeyeglasses, cols. 3 and4show estimated impacts among students without eyeglasses at baseline, and cols. 5 and 6 show estimated im-pacts among students with eyeglasses at baseline.* p < .10.** p < .05.
346 E C O N O M I C D E V E L O P M E N T A N D C U L T U R A L C H A N G E
patterns of changes in student aspiration for further schooling (as a result of eye-glasses provision) hint that students changed their plans in a way that might en-hance their future human capital (i.e., if they were ultimately able tomatriculateinto academic high school).
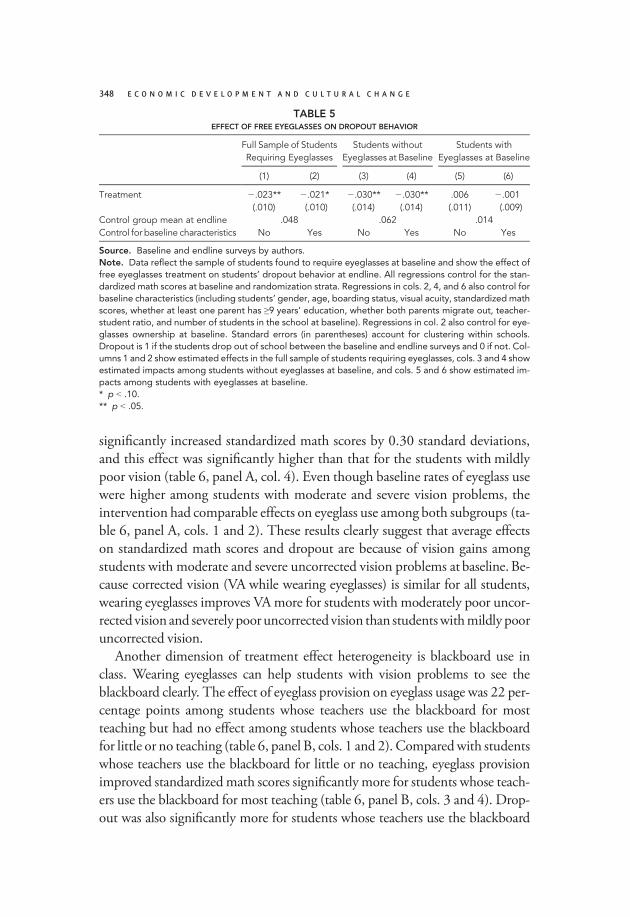
C. DropoutTable 5 reports estimated effects on dropout behavior. We find that providingfree eyeglasses reduces dropout during the school year. Although the 9 monthsthat elapsed between the baseline and endline surveys is not a very long time,there was still a large number of students dropping out of school during thisperiod. Overall, approximately 5% of students dropped out over the courseof the study in the control group. The rate of dropout also was higher amongstudents in the control group without eyeglasses at baseline (6%) than studentswith eyeglasses at baseline (1%). In the full sample, we find that free eyeglassesreduced dropout by approximately 2 percentage points. In the specificationthat included control variables, the estimated effect on the dropout rate is2.1 percentage points (significant at the 10% level; table 5, col. 2).12 This rep-resents a decrease of 44% (from 4.8% in the control group). Again, as in ourresults in the previous subsection, the estimated effect on dropping out is con-centrated among students without eyeglasses at baseline (table 5, cols. 3 and 4).For these students, the rate of dropout decreased by 48% from 6.2% in controlgroup (significant at the 5% level; table 5, and col. 4). There is no significanteffect for the students with eyeglasses at baseline (table 5, col. 6).
D. Heterogeneous Effects on Subgroups of StudentsThe multivariate analysis examining heterogeneous effects suggests that effectdifferences exist among various subgroups of students. Perhaps themost obviousdimension along which the impact of eyeglasses would vary is the uncorrectedVA of students. The results demonstrate that free eyeglasses have larger positiveeffects for students with moderately poor vision or severely poor vision whencompared with students with mildly poor vision. In particular, providing freeeyeglasses significantly increased standardized math scores by 0.18 standard de-viations and significantly decreased the dropout rate by 3 percentage points forstudents with moderately poor vision or severely poor vision, whereas there wasno significant effect for students with mildly poor vision (table 6, panel A,cols. 3 and 5). Such heterogeneous effects were evenmore pronounced focusingonly on the students without eyeglasses at baseline. Providing free eyeglasses
12 The results were similar if a logit model was used; the marginal effect was 2.3 percentage pointsand also significant.
Nie et al. 347
significantly increased standardized math scores by 0.30 standard deviations,and this effect was significantly higher than that for the students with mildlypoor vision (table 6, panel A, col. 4). Even though baseline rates of eyeglass usewere higher among students with moderate and severe vision problems, theintervention had comparable effects on eyeglass use among both subgroups (ta-ble 6, panel A, cols. 1 and 2). These results clearly suggest that average effectson standardized math scores and dropout are because of vision gains amongstudents with moderate and severe uncorrected vision problems at baseline.Be-cause corrected vision (VA while wearing eyeglasses) is similar for all students,wearing eyeglasses improves VA more for students with moderately poor uncor-rected vision and severely poor uncorrected vision than studentswithmildly pooruncorrected vision.
Another dimension of treatment effect heterogeneity is blackboard use inclass. Wearing eyeglasses can help students with vision problems to see theblackboard clearly. The effect of eyeglass provision on eyeglass usage was 22 per-centage points among students whose teachers use the blackboard for mostteaching but had no effect among students whose teachers use the blackboardfor little or no teaching (table 6, panel B, cols. 1 and 2). Compared with studentswhose teachers use the blackboard for little or no teaching, eyeglass provisionimproved standardizedmath scores significantly more for students whose teach-ers use the blackboard for most teaching (table 6, panel B, cols. 3 and 4). Drop-out was also significantly more for students whose teachers use the blackboard
TABLE 5EFFECT OF FREE EYEGLASSES ON DROPOUT BEHAVIOR
Full Sample of StudentsRequiring Eyeglasses
Students withoutEyeglasses at Baseline
Students withEyeglasses at Baseline
(1) (2) (3) (4) (5) (6)
Treatment 2.023** 2.021* 2.030** 2.030** .006 2.001(.010) (.010) (.014) (.014) (.011) (.009)
Control group mean at endline .048 .062 .014Control for baseline characteristics No Yes No Yes No Yes
Source. Baseline and endline surveys by authors.Note. Data reflect the sample of students found to require eyeglasses at baseline and show the effect offree eyeglasses treatment on students’ dropout behavior at endline. All regressions control for the stan-dardized math scores at baseline and randomization strata. Regressions in cols. 2, 4, and 6 also control forbaseline characteristics (including students’ gender, age, boarding status, visual acuity, standardized mathscores, whether at least one parent has ≥9 years’ education, whether both parents migrate out, teacher-student ratio, and number of students in the school at baseline). Regressions in col. 2 also control for eye-glasses ownership at baseline. Standard errors (in parentheses) account for clustering within schools.Dropout is 1 if the students drop out of school between the baseline and endline surveys and 0 if not. Col-umns 1 and 2 show estimated effects in the full sample of students requiring eyeglasses, cols. 3 and 4 showestimated impacts among students without eyeglasses at baseline, and cols. 5 and 6 show estimated im-pacts among students with eyeglasses at baseline.* p < .10.** p < .05.
348 E C O N O M I C D E V E L O P M E N T A N D C U L T U R A L C H A N G E
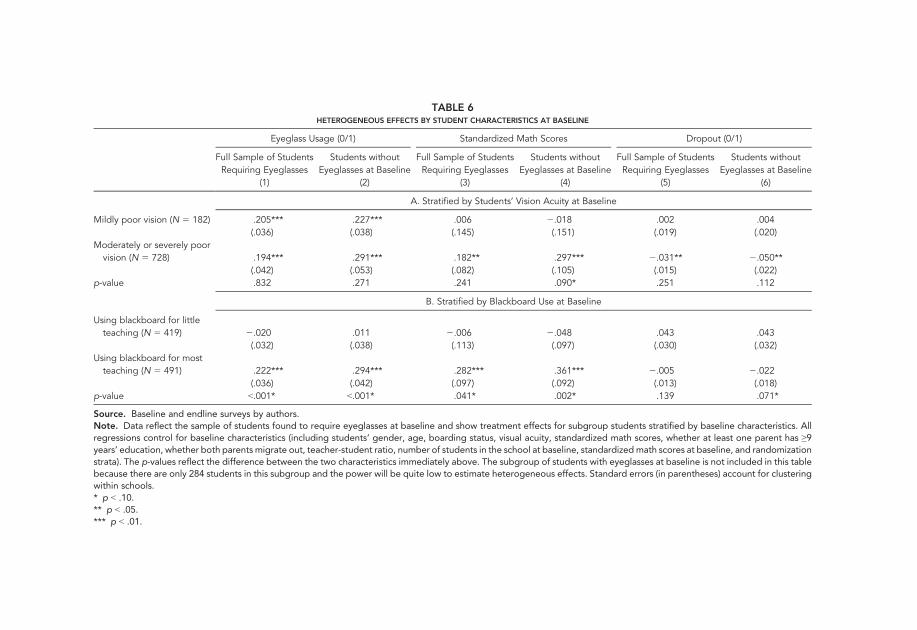
TABLE 6HETEROGENEOUS EFFECTS BY STUDENT CHARACTERISTICS AT BASELINE
Eyeglass Usage (0/1) Standardized Math Scores Dropout (0/1)
Full Sample of StudentsRequiring Eyeglasses
Students withoutEyeglasses at Baseline
Full Sample of StudentsRequiring Eyeglasses
Students withoutEyeglasses at Baseline
Full Sample of StudentsRequiring Eyeglasses
Students withoutEyeglasses at Baseline
(1) (2) (3) (4) (5) (6)
A. Stratified by Students’ Vision Acuity at Baseline
Mildly poor vision (N 5 182) .205*** .227*** .006 2.018 .002 .004(.036) (.038) (.145) (.151) (.019) (.020)
Moderately or severely poorvision (N 5 728) .194*** .291*** .182** .297*** 2.031** 2.050**
(.042) (.053) (.082) (.105) (.015) (.022)p-value .832 .271 .241 .090* .251 .112
B. Stratified by Blackboard Use at Baseline
Using blackboard for littleteaching (N 5 419) 2.020 .011 2.006 2.048 .043 .043
(.032) (.038) (.113) (.097) (.030) (.032)Using blackboard for mostteaching (N 5 491) .222*** .294*** .282*** .361*** 2.005 2.022
(.036) (.042) (.097) (.092) (.013) (.018)p-value <.001* <.001* .041* .002* .139 .071*
Source. Baseline and endline surveys by authors.Note. Data reflect the sample of students found to require eyeglasses at baseline and show treatment effects for subgroup students stratified by baseline characteristics. Allregressions control for baseline characteristics (including students’ gender, age, boarding status, visual acuity, standardized math scores, whether at least one parent has ≥9years’ education, whether both parents migrate out, teacher-student ratio, number of students in the school at baseline, standardized math scores at baseline, and randomizationstrata). The p-values reflect the difference between the two characteristics immediately above. The subgroup of students with eyeglasses at baseline is not included in this tablebecause there are only 284 students in this subgroup and the power will be quite low to estimate heterogeneous effects. Standard errors (in parentheses) account for clusteringwithin schools.* p < .10.** p < .05.*** p < .01.
among students who did not own glasses at baseline, though these estimates areimprecise (table 6, panel B, col. 6).
IV. Conclusion and DiscussionThis article reports results from a randomized trial testing the effects of provid-ing free eyeglasses on academic outcomes of myopic junior high school studentsin a poor region of western China. We find that the intervention has significantpositive effects on performance on standardized math exams and student aspi-rations for further schooling and reduces dropout during the school year. ITTestimates show that the provision of free eyeglasses increased performance onstandardized math exams by 0.14 standard deviations, increased student aspira-tions to attend academic high school by 9 percentage points, and reduced drop-out by 44% during the school year. Program effects on standardized math examscores and dropout were concentrated among students who did not own eye-glasses at baseline.
Even without considering potential benefits in terms of nonacademic out-comes (e.g., effects on quality of lifemore generally), the intervention is relativelycost-effectivemerely as an educational intervention. The cost of the interventionrelative to the control groupwas approximately ¥376 ($60) per child.13 Focusingon the effects of the intervention on dropout behavior, these costs imply a cost-effectiveness ratio of ¥179 ($28) per percentage point decrease in dropout overthe course of the school year. It appears that the cost-effectiveness of eyeglassesprovision in this study compares favorably with other interventions focused ondropout of junior high students (Mo et al. 2013; Yi et al. 2015b). Moreover, ac-counting for the gain in academic performance measured by standardized mathscores, this study shows that eyeglass provision to junior high students seems tobe more cost-effective relative to such intervention with primary students (¥269and ¥347 per 0.1 standard deviations, respectively; Sylvia et al. 2015).
Although our data do not allowus to fully examine the channels throughwhichthese effects occurred, we hypothesize that academic outcomes improved throughthree main mechanisms. First, providing eyeglasses increases the motivation ofstudents to learn. One possible explanation for increased motivation is that my-opic students found it difficult to keep up with instruction without being able toclearly read and followwork on a blackboard. This explanation is supported by thedifference in effect between students whose teachers frequently use the blackboard
13 We followed the methodologies discussed in McEwan (2012) and Dhaliwal et al. (2013). Costsof the program included the cost of eyeglasses (¥180,250, or $28,611) and delivery of eyeglasses(¥13,760, or $2,184). The total cost of the program was thus ¥376 ($60) per child. The costs ofeye examinations are excluded because these were also administered in the control group. This cal-culation does not consider other social costs, including student and teacher time and taxes.
350 E C O N O M I C D E V E L O P M E N T A N D C U L T U R A L C H A N G E
and those who rarely use the blackboard. Second, addressing the barrier to learn-ing posed by uncorrected vision problemsmay have worked to crowd in other ed-ucational investments. Because the returns to other educational investments areincreased when students are able to see clearly, students, parents, and teachersmay have investedmore time and resources into learning. Finally,myopic studentsmay have been made more confident that they could compete with their peers.This final mechanism could be important given China’s competitive educationsystem and that this competitive environment intensifies in junior high school(Loyalka et al. 2013).
The results we present come with twomain caveats. First, our study took placein one poor region of western China, and results may not apply to other settings.Second, we are only able to examine effects on dropout and other outcomes overthe course of the school year. It is possible that the interventionmerely delayed thedecisions of students to leave school until after the end of the school year. If true,however, this would still constitute an increase in schooling attainment.
Despite these caveats, we believe this study clearly demonstrates the academicbenefits of a program providing free eyeglasses to myopic junior high school stu-dents in China. These results add to previous studies in primary schools showingthe effect of similar programs on student performance on standardized exams. Inaddition to showing effectiveness among older children, this study also shows thatbenefits extend to additional academic outcomes and implies that such a programmay even have effects on ultimate schooling attainment. These additional resultsprovide further justification for the subsidization of eyeglasses for myopic stu-dents in China and potentially other developing countries. Important questionsfor future research include how subsidization and distribution should take place(including alternative subsidization levels and methods of distribution), testingways of encouraging the use of eyeglasses once distributed, and examining effectson additional outcomes beyond the academic as well as effects on longer-termoutcomes such as ultimate schooling attainment and earnings later in life.
Nie et al. 351
Appendix
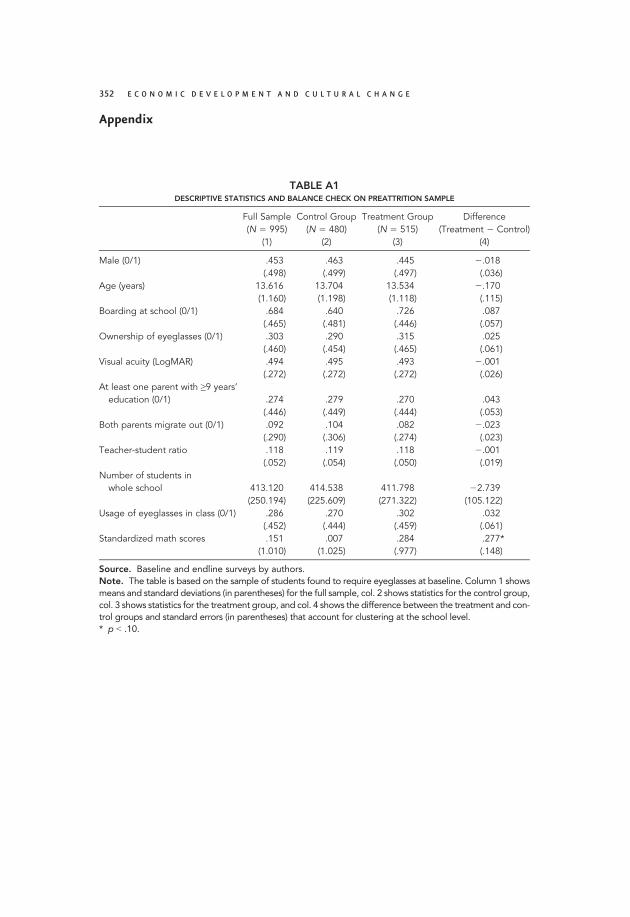
TABLE A1DESCRIPTIVE STATISTICS AND BALANCE CHECK ON PREATTRITION SAMPLE
Full Sample(N 5 995)
Control Group(N 5 480)
Treatment Group(N 5 515)
Difference(Treatment 2 Control)
(1) (2) (3) (4)
Male (0/1) .453 .463 .445 2.018(.498) (.499) (.497) (.036)
Age (years) 13.616 13.704 13.534 2.170(1.160) (1.198) (1.118) (.115)
Boarding at school (0/1) .684 .640 .726 .087(.465) (.481) (.446) (.057)
Ownership of eyeglasses (0/1) .303 .290 .315 .025(.460) (.454) (.465) (.061)
Visual acuity (LogMAR) .494 .495 .493 2.001(.272) (.272) (.272) (.026)
At least one parent with ≥9 years’education (0/1) .274 .279 .270 .043
(.446) (.449) (.444) (.053)Both parents migrate out (0/1) .092 .104 .082 2.023
(.290) (.306) (.274) (.023)Teacher-student ratio .118 .119 .118 2.001
(.052) (.054) (.050) (.019)Number of students in
whole school 413.120 414.538 411.798 22.739(250.194) (225.609) (271.322) (105.122)
Usage of eyeglasses in class (0/1) .286 .270 .302 .032(.452) (.444) (.459) (.061)
Standardized math scores .151 .007 .284 .277*(1.010) (1.025) (.977) (.148)
Source. Baseline and endline surveys by authors.Note. The table is based on the sample of students found to require eyeglasses at baseline. Column 1 showsmeans and standard deviations (in parentheses) for the full sample, col. 2 shows statistics for the control group,col. 3 shows statistics for the treatment group, and col. 4 shows the difference between the treatment and con-trol groups and standard errors (in parentheses) that account for clustering at the school level.* p < .10.
352 E C O N O M I C D E V E L O P M E N T A N D C U L T U R A L C H A N G E
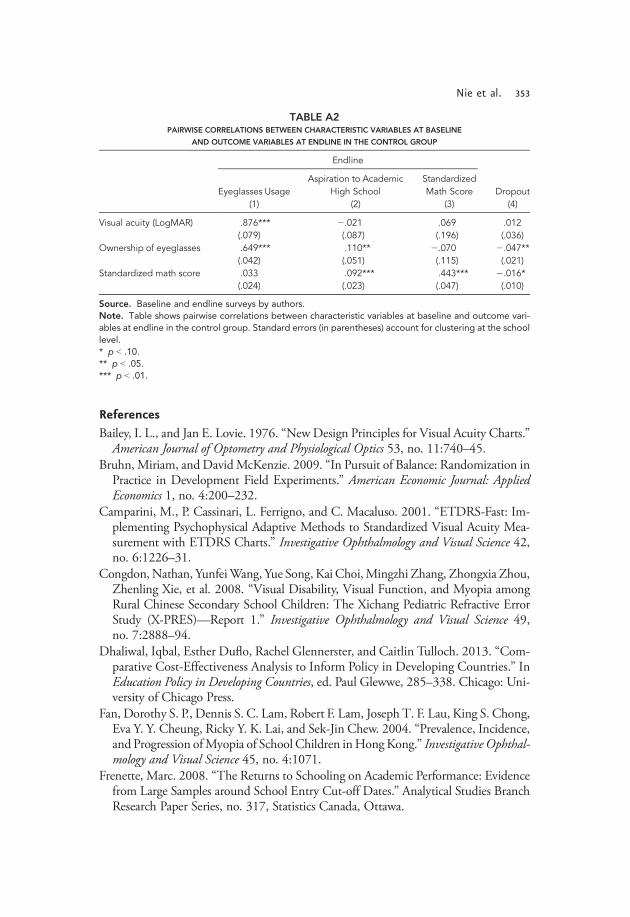
TABLE A2PAIRWISE CORRELATIONS BETWEEN CHARACTERISTIC VARIABLES AT BASELINE
AND OUTCOME VARIABLES AT ENDLINE IN THE CONTROL GROUP
Endline
DropoutEyeglasses UsageAspiration to Academic
High SchoolStandardizedMath Score
(1) (2) (3) (4)
Visual acuity (LogMAR) .876*** 2.021 .069 .012(.079) (.087) (.196) (.036)
Ownership of eyeglasses .649*** .110** 2.070 2.047**(.042) (.051) (.115) (.021)
Standardized math score .033 .092*** .443*** 2.016*(.024) (.023) (.047) (.010)
Source. Baseline and endline surveys by authors.Note. Table shows pairwise correlations between characteristic variables at baseline and outcome vari-ables at endline in the control group. Standard errors (in parentheses) account for clustering at the schoollevel.* p < .10.** p < .05.*** p < .01.
ReferencesBailey, I. L., and Jan E. Lovie. 1976. “NewDesign Principles for Visual Acuity Charts.”American Journal of Optometry and Physiological Optics 53, no. 11:740–45.
Bruhn, Miriam, and DavidMcKenzie. 2009. “In Pursuit of Balance: Randomization inPractice in Development Field Experiments.” American Economic Journal: AppliedEconomics 1, no. 4:200–232.
Camparini, M., P. Cassinari, L. Ferrigno, and C. Macaluso. 2001. “ETDRS-Fast: Im-plementing Psychophysical Adaptive Methods to Standardized Visual Acuity Mea-surement with ETDRS Charts.” Investigative Ophthalmology and Visual Science 42,no. 6:1226–31.
Congdon,Nathan, YunfeiWang, Yue Song, Kai Choi,Mingzhi Zhang, Zhongxia Zhou,Zhenling Xie, et al. 2008. “Visual Disability, Visual Function, and Myopia amongRural Chinese Secondary School Children: The Xichang Pediatric Refractive ErrorStudy (X-PRES)—Report 1.” Investigative Ophthalmology and Visual Science 49,no. 7:2888–94.
Dhaliwal, Iqbal, Esther Duflo, Rachel Glennerster, and Caitlin Tulloch. 2013. “Com-parative Cost-Effectiveness Analysis to Inform Policy in Developing Countries.” InEducation Policy in Developing Countries, ed. Paul Glewwe, 285–338. Chicago: Uni-versity of Chicago Press.
Fan, Dorothy S. P., Dennis S. C. Lam, Robert F. Lam, Joseph T. F. Lau, King S. Chong,Eva Y. Y. Cheung, Ricky Y. K. Lai, and Sek-Jin Chew. 2004. “Prevalence, Incidence,and Progression ofMyopia of School Children inHong Kong.” Investigative Ophthal-mology and Visual Science 45, no. 4:1071.
Frenette, Marc. 2008. “The Returns to Schooling on Academic Performance: Evidencefrom Large Samples around School Entry Cut-off Dates.” Analytical Studies BranchResearch Paper Series, no. 317, Statistics Canada, Ottawa.
Nie et al. 353
Glewwe, Paul, Albert Park, and Meng Zhao. 2016. “A Better Vision for Development:Eyeglasses and Academic Performance in Rural Primary Schools in China.” Journal ofDevelopment Economics 122 (September): 170–82.
Government of Yulin. 2015. National Economic and Social Development Statistics Bulle-tin of Yulin in 2014. http://www.yl.gov.cn/P/C/35662.htm.
Grosvendor, T. 2007. Primary Care Optometry. Boston: Elsevier.Hanushek, Eric A., John F. Kain, Jacob M. Markman, and Steven G. Rivkin. 2003.“Does Peer Ability Affect Student Achievement?” Journal of Applied Econometrics18, no. 5:527–44.
He, Mingguang, Wenyong Huang, Yingfeng Zheng, Li Huang, and Leon B. Ellwein.2007. “Refractive Error andVisual Impairment in School Children inRural SouthernChina.” Ophthalmology 114, no. 2:374–82.
Liu, Chengfang, Linxiu Zhang, Renfu Luo, Scott Rozelle, Brian Sharbono, and YaojiangShi. 2009. “Development Challenges, Tuition Barriers, and High School Educationin China.” Asia Pacific Journal of Education 8791 (November): 503–20.
Loyalka, Prashant, Chengfang Liu, Yingquan Song, Hongmei Yi, Xiaoting Huang,Jianguo Wei, Linxiu Zhang, Yaojiang Shi, James Chu, and Scott Rozelle. 2013.“Can Information and Counseling Help Students from Poor Rural Areas Go to HighSchool? Evidence fromChina.” Journal of Comparative Economics 41, no. 4:1012–25.
Lynch, Michael, and Dante Cicchetti. 1997. “Children’s Relationships with Adults andPeers: An Examination of Elementary and Junior High School Students.” Journal ofSchool Psychology 35, no. 1:81–99.
Ma, Xiaochen, Zhongqiang Zhou, Hongmei Yi, Xiaopeng Pang, Yaojiang Shi, QianyunChen, Mirjam E.Meltzer, et al. 2014. “Effect of Providing Free Glasses on Children’sEducational Outcomes in China: Cluster Randomized Controlled Trial.” BMJ 349:g5740.
Maul, E., S. Barroso, S. R.Munoz, R.D. Sperduto, and L. B. Ellwein. 2000. “RefractiveError Study in Children: Results from La Florida, Chile.” American Journal of Oph-thalmology 129, no. 4:445–54.
McEwan, Patrick J. 2012. “Cost-Effectiveness Analysis of Education and Health Inter-ventions inDevelopingCountries.” Journal of Development Effectiveness 4, no. 2:189–213.
Mo, D., L. X. Zhang, H. M. Yi, R. F. Luo, S. Rozelle, and C. Brinton. 2013. “SchoolDropouts and Conditional Cash Transfers: Evidence from a Randomised ControlledTrial in Rural China’s Junior High Schools.” Journal of Development Studies 49,no. 2:190–207.
Murthy, G. V., Sanjeev K. Gupta, Leon B. Ellwein, Sergio R.Muñoz, Gopal P. Pokharel,Lalit Sanga, and Damodar Bachani. 2002. “Refractive Error in Children in an UrbanPopulation in New Delhi.” Investigative Ophthalmology and Visual Science 43, no. 3(March): 623–31.
NBSPRC (National Bureau of Statistics of the People’s Republic of China). 2015.“National Economic and Social Development Statistics Bulletin of China in 2014.”Beijing. http://www.stats.gov.cn/tjsj/zxfb/201502/t20150226_685799.html.
Odedra, Nita, Susanne H. Wedner, Zachayo S. Shigongo, Kija Nyalali, and Clare Gil-bert. 2008. “Barriers to Spectacle Use in Tanzanian Secondary School Students.”Ophthalmic Epidemiology 15, no. 6:410–17.
354 E C O N O M I C D E V E L O P M E N T A N D C U L T U R A L C H A N G E
Pascolini, D., and S. P.Mariotti. 2012. “Global Estimates of Visual Impairment: 2010.”British Journal of Ophthalmology 96, no. 5:614–18.
Resnikoff, Serge, Donatella Pascolini, Silvio P. Mariotti, and Gopal P. Pokharel. 2008.“Global Magnitude of Visual Impairment Caused by Uncorrected Refractive Errorsin 2004.” Bulletin of the World Health Organization 86, no. 1:63–70.
Sylvia, S., X.Ma, Y. Shi, S. Rozelle, andC.-Y. C. L. Lawell. 2015. “OrdealMechanisms,Information and the Cost-Effectiveness of Subsidies: Evidence from Subsidized Eye-glasses in Rural China.”Working paper, Department of Economics, RenminUniver-sity of China, Beijing.
Yi, Hongmei, Linxiu Zhang, Xiaochen Ma, Nathan Congdon, Yaojiang Shi, XiaopengPang, Junxia Zeng, LeiWang,Matthew Boswell, and Scott Rozelle. 2015a. “Poor Vi-sion among China’s Rural Primary School Students: Prevalence, Correlates and Con-sequences.” China Economic 33:247–62.
Yi, Hongmei, Yingquan Song, Chengfang Liu, Xiaoting Huang, Linxiu Zhang, YunliBai, Baoping Ren, et al. 2015b. “Giving Kids a Head Start: The Impact and Mech-anisms of Early Commitment of Financial Aid on Poor Students in Rural China.”Journal of Development Economics 113:1–15.
Nie et al. 355