Embed Size (px)
Citation preview
1Seeing Beyond the Visible with IRDye® Infrared Dyes
Introduction
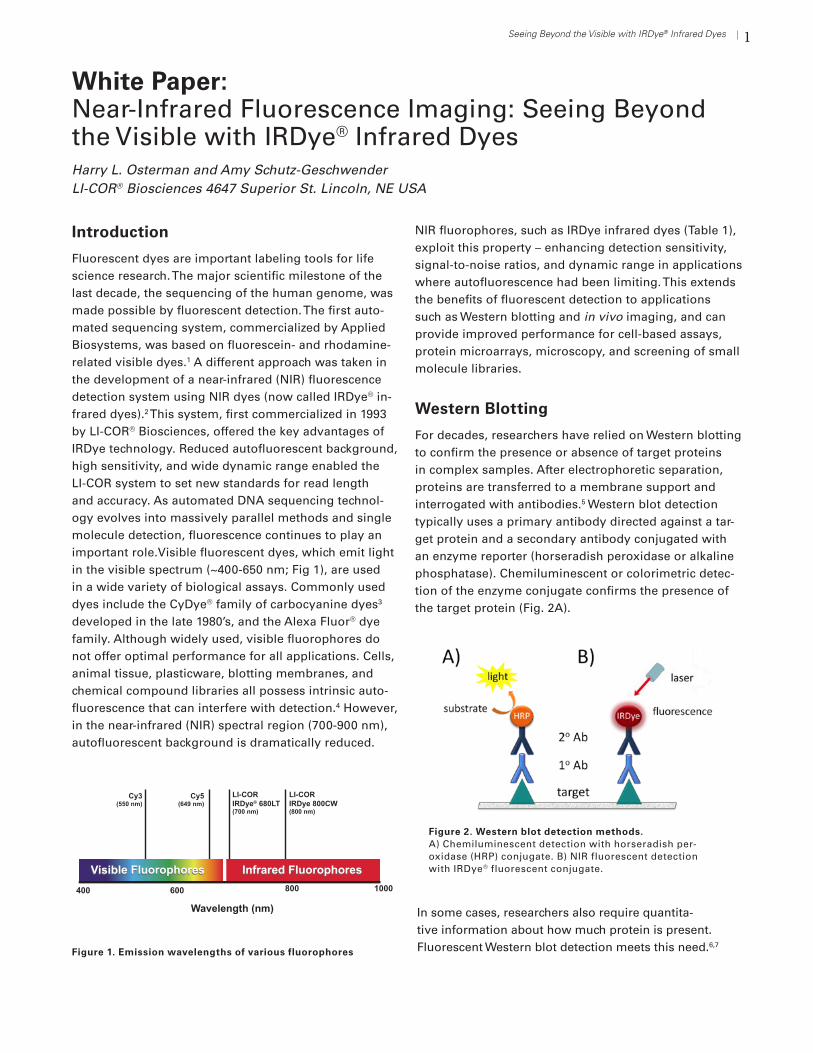
Fluorescent dyes are important labeling tools for life science research. The major scientific milestone of the last decade, the sequencing of the human genome, was made possible by fluorescent detection. The first auto-mated sequencing system, commercialized by Applied Biosystems, was based on fluorescein- and rhodamine-related visible dyes.1 A different approach was taken in the development of a near-infrared (NIR) fluorescence detection system using NIR dyes (now called IRDye® in-frared dyes).2 This system, first commercialized in 1993 by LI-COR® Biosciences, offered the key advantages of IRDye technology. Reduced autofluorescent background, high sensitivity, and wide dynamic range enabled the LI-COR system to set new standards for read length and accuracy. As automated DNA sequencing technol-ogy evolves into massively parallel methods and single molecule detection, fluorescence continues to play an important role.Visible fluorescent dyes, which emit light in the visible spectrum (~400-650 nm; Fig 1), are used in a wide variety of biological assays. Commonly used dyes include the CyDye® family of carbocyanine dyes3 developed in the late 1980’s, and the Alexa Fluor® dye family. Although widely used, visible fluorophores do not offer optimal performance for all applications. Cells, animal tissue, plasticware, blotting membranes, and chemical compound libraries all possess intrinsic auto-fluorescence that can interfere with detection.4 However, in the near-infrared (NIR) spectral region (700-900 nm), autofluorescent background is dramatically reduced.
NIR fluorophores, such as IRDye infrared dyes (Table 1), exploit this property – enhancing detection sensitivity, signal-to-noise ratios, and dynamic range in applications where autofluorescence had been limiting. This extends the benefits of fluorescent detection to applications such as Western blotting and in vivo imaging, and can provide improved performance for cell-based assays, protein microarrays, microscopy, and screening of small molecule libraries.
Western Blotting
For decades, researchers have relied on Western blotting to confirm the presence or absence of target proteins in complex samples. After electrophoretic separation, proteins are transferred to a membrane support and interrogated with antibodies.5 Western blot detection typically uses a primary antibody directed against a tar-get protein and a secondary antibody conjugated with an enzyme reporter (horseradish peroxidase or alkaline phosphatase). Chemiluminescent or colorimetric detec-tion of the enzyme conjugate confirms the presence of the target protein (Fig. 2A).
In some cases, researchers also require quantita-tive information about how much protein is present. Fluorescent Western blot detection meets this need.6,7
White Paper: Near-Infrared Fluorescence Imaging: Seeing Beyond the Visible with IRDye® Infrared DyesHarry L. Osterman and Amy Schutz-GeschwenderLI-COR® Biosciences 4647 Superior St. Lincoln, NE USA
Figure 1. Emission wavelengths of various fluorophores
Cy3(550 nm)
600400 800
Wavelength (nm)
1000
Cy5(649 nm)
LI-CORIRDye® 680LT(700 nm)
LI-CORIRDye 800CW(800 nm)
Visible Fluorophores Infrared FluorophoresVisible Fluorophores Infrared Fluorophores
Figure 2. Western blot detection methods. A) Chemiluminescent detection with horseradish per-oxidase (HRP) conjugate. B) NIR fluorescent detection with IRDye® fluorescent conjugate.
2 Seeing Beyond the Visible with IRDye® Infrared Dyes
Secondary antibodies are labeled with NIR fluorescent dyes (such as IRDye 800CW, IRDye 680RD, or IRDye 680LT) for direct and non-enzymatic detection (Fig. 2B). Blots are then documented with an NIR imager such as the Odyssey® Classic, Odyssey CLx, Odyssey Fc, or Odyssey Sa Imagers from LI-COR Biosciences. With this ratiometric approach, fluorescent signal is directly pro-portional to the amount of target protein present. NIR fluorescent detection dramatically improves quantitative accuracy and reproducibility – with excellent sensitivity for detection of endogenous protein levels.7 Fluorescent signals are stable indefinitely, so blots can be stored and re-imaged later. Multiplexing of NIR dyes (Fig. 3) allows two targets to be detected simultaneously, making nor-malization against an internal control easier and more accurate than comparison of two different blots (Fig. 4).
Quantitative analysis can be very important in life science research, and IRDye fluorescence outper-forms other Western blot detection methods. Studies comparing che-miluminescent and IRDye detection methods have demonstrated that IRDye detection is quantitative over a much broader linear dynamic range than ECLTM (Fig. 5).6,7, 8 Fluorescent conjugates avoid the enzyme kinetics and substrate availability limitations of chemiluminescence. This produc-es more consistent, straightforward, and accurate quantification.7, 8
In carefully controlled experiments, absolute quantification can be per-formed. Wang et al8 examined the stoichiometric relationships between p53 and its negative regulators. Cell numbers in each sample were care-fully counted before lysis. Hdm2, HdmX, and p53 were then detected
on NIR fluorescent Western blots. Results were normal-ized against an internal control protein. Cell extracts were compared against dilution curves of purified target pro-teins of known concentration, allowing the authors to estimate actual numbers of protein molecules per cell. Their results suggest that the stoichiometric balance be-tween Hdm2, HdmX, and p53 is important for regulation of p53 activity.
Biological samples can be challenging for quantification. Because endogenous protein levels span an extremely wide dynamic range (an estimated 4-10 orders of mag-nitude)9,10,11 the ability to image both low-abundance and high-abundance targets is critical. IRDye detection
Dye Exmax
(nm)
Emmax
(nm)
Reactive Group Recommended for labeling
LI-CORchannel
IRDye 800CW 778 794 NHS ester
Maleimide
Proteins
Peptides
800 nm
IRDye 800RS 770 786 NHS ester Nucleic acids 800 nm
IRDye 680RD 680 694 NHS ester
Maleimide
Proteins
Peptides
700 nm
IRDye 680LT 680 694 NHS ester
Maleimide
Proteins
Peptides
700 nm
IRDye 700DX 680 687 NHS ester Proteins
Peptides
700 nm
IRDye 750 766 776 NHS ester
Maleimide
Proteins
Peptides–
IRDye 650 651 668 NHS ester
Maleimide
Proteins
Peptides–
IRDye 700 685 705 Phosphoramidite Oligos 700 nm
IRDye 800 795 819 Phosphoramidite Oligos 800 nm
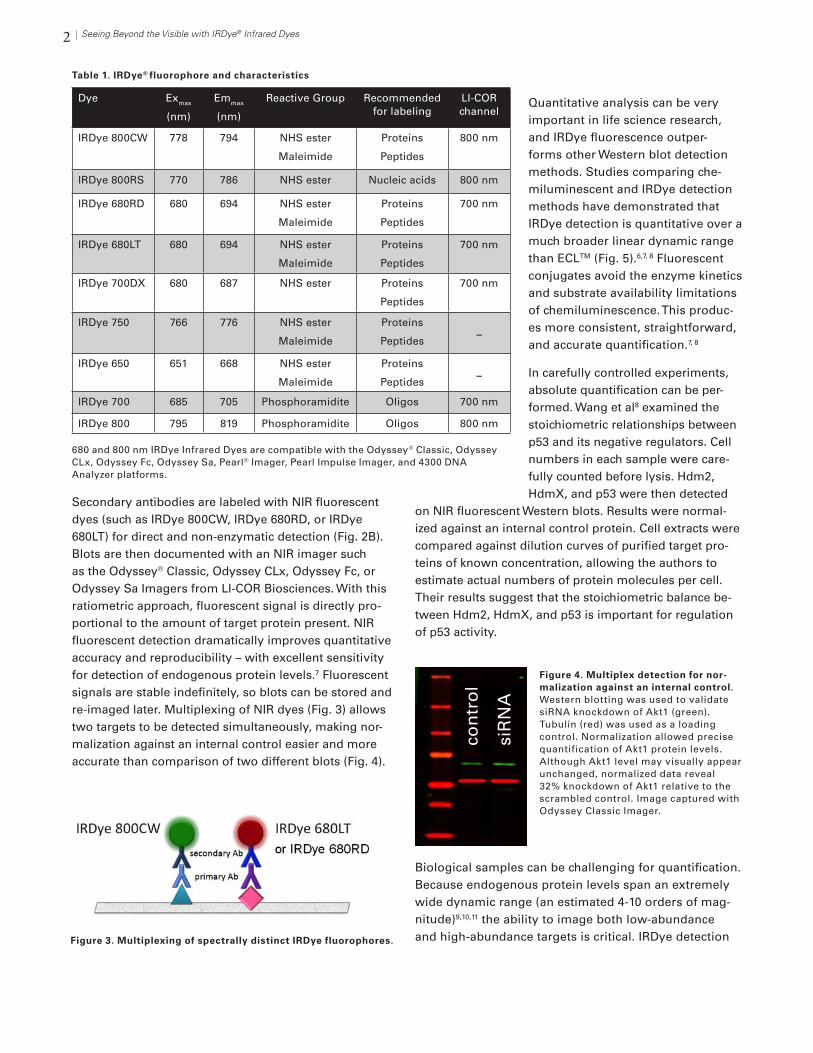
Table 1. IRDye® fluorophore and characteristics
680 and 800 nm IRDye Infrared Dyes are compatible with the Odyssey® Classic, Odyssey CLx, Odyssey Fc, Odyssey Sa, Pearl® Imager, Pearl Impulse Imager, and 4300 DNA Analyzer platforms.
Figure 3. Multiplexing of spectrally distinct IRDye fluorophores.
Figure 4. Multiplex detection for nor-malization against an internal control. Western blotting was used to validate siRNA knockdown of Akt1 (green). Tubulin (red) was used as a loading control. Normalization allowed precise quantification of Akt1 protein levels. Although Akt1 level may visually appear unchanged, normalized data reveal 32% knockdown of Akt1 relative to the scrambled control. Image captured with Odyssey Classic Imager.
con
tro
l
siR
NA
3Seeing Beyond the Visible with IRDye® Infrared Dyes
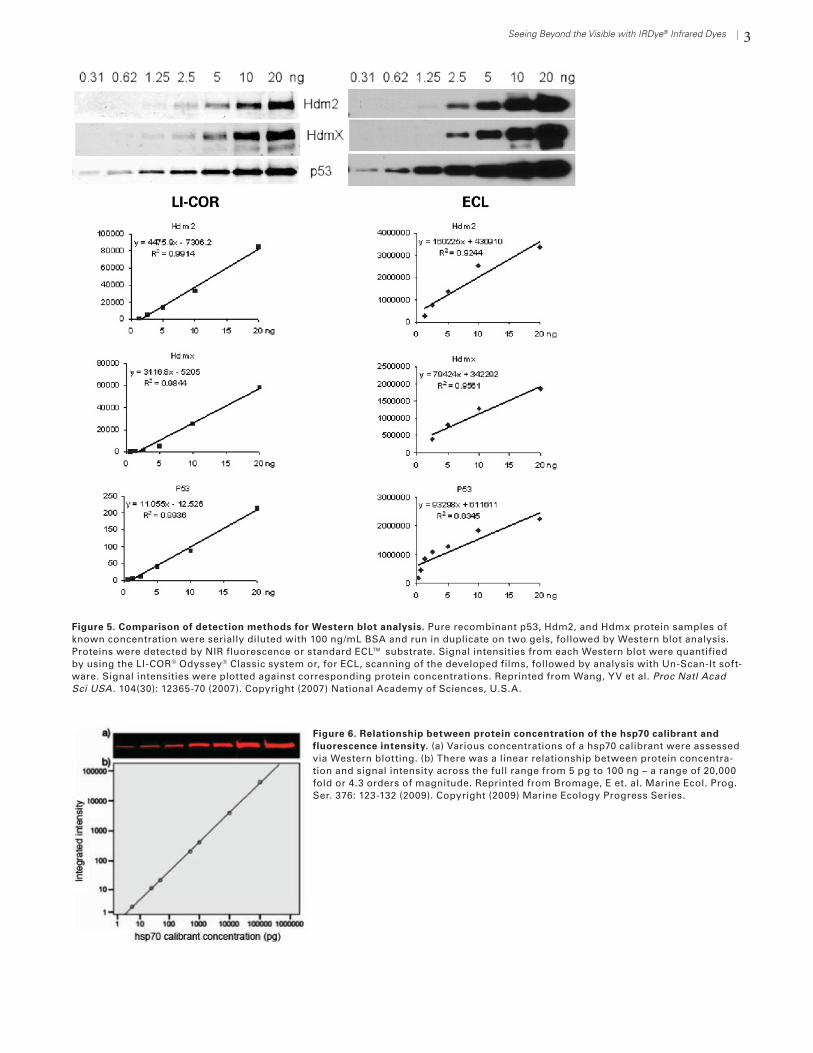
Figure 5. Comparison of detection methods for Western blot analysis. Pure recombinant p53, Hdm2, and Hdmx protein samples of known concentration were serially diluted with 100 ng/mL BSA and run in duplicate on two gels, followed by Western blot analysis. Proteins were detected by NIR fluorescence or standard ECL™ substrate. Signal intensities from each Western blot were quantified by using the LI-COR® Odyssey® Classic system or, for ECL, scanning of the developed films, followed by analysis with Un-Scan-It soft-ware. Signal intensities were plotted against corresponding protein concentrations. Reprinted from Wang, YV et al. Proc Natl Acad Sci USA . 104(30): 12365-70 (2007). Copyright (2007) National Academy of Sciences, U.S.A.
Figure 6. Relationship between protein concentration of the hsp70 calibrant and fluorescence intensity. (a) Various concentrations of a hsp70 calibrant were assessed via Western blotting. (b) There was a linear relationship between protein concentra-tion and signal intensity across the full range from 5 pg to 100 ng – a range of 20,000 fold or 4.3 orders of magnitude. Reprinted from Bromage, E et. al. Marine Ecol. Prog. Ser. 376: 123-132 (2009). Copyright (2009) Marine Ecology Progress Series.
4 Seeing Beyond the Visible with IRDye® Infrared Dyes
with the Odyssey family of imagers provides the wid-est linear dynamic range reported for any Western blot method. Detection of Hsp70 was reported to be linear over 4.3 orders of magnitude (up to 20,000 fold), from 5 pg to 100 ng12 (Fig. 6). Wide linear range allows all nec-essary information to be extracted from a single blot or image, without multiple exposures.
Multiplex Phosphorylation Analysis
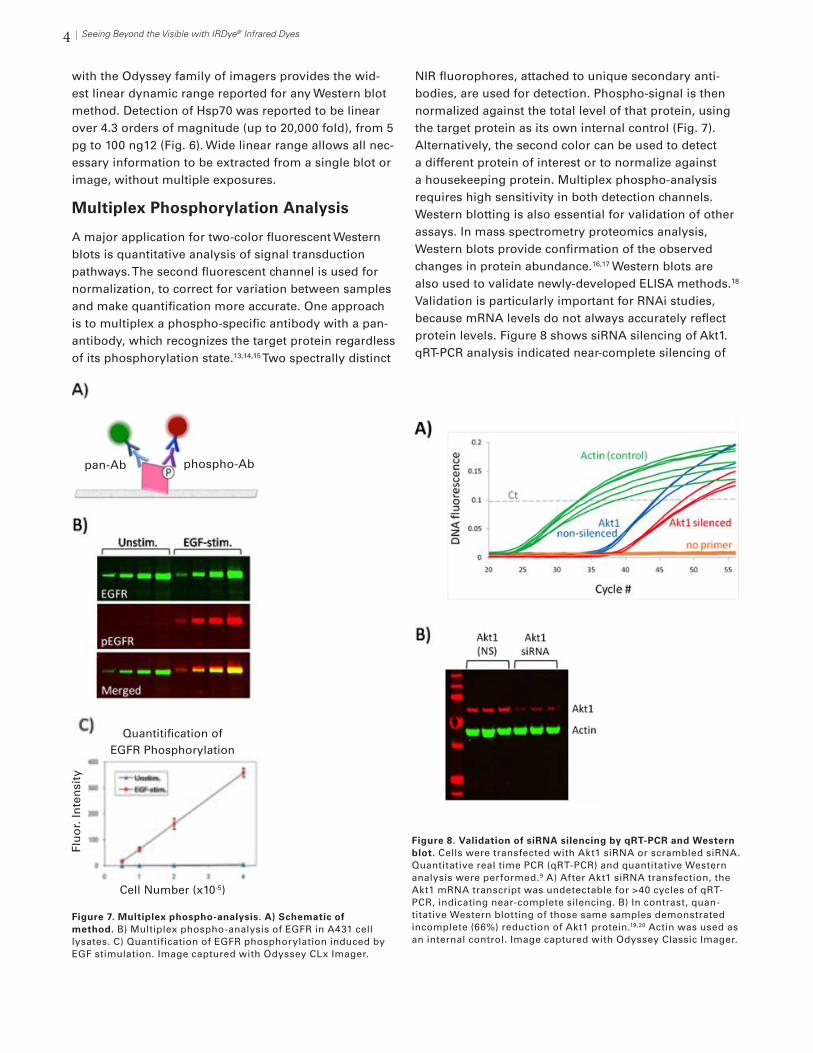
A major application for two-color fluorescent Western blots is quantitative analysis of signal transduction pathways. The second fluorescent channel is used for normalization, to correct for variation between samples and make quantification more accurate. One approach is to multiplex a phospho-specific antibody with a pan-antibody, which recognizes the target protein regardless of its phosphorylation state.13,14,15 Two spectrally distinct
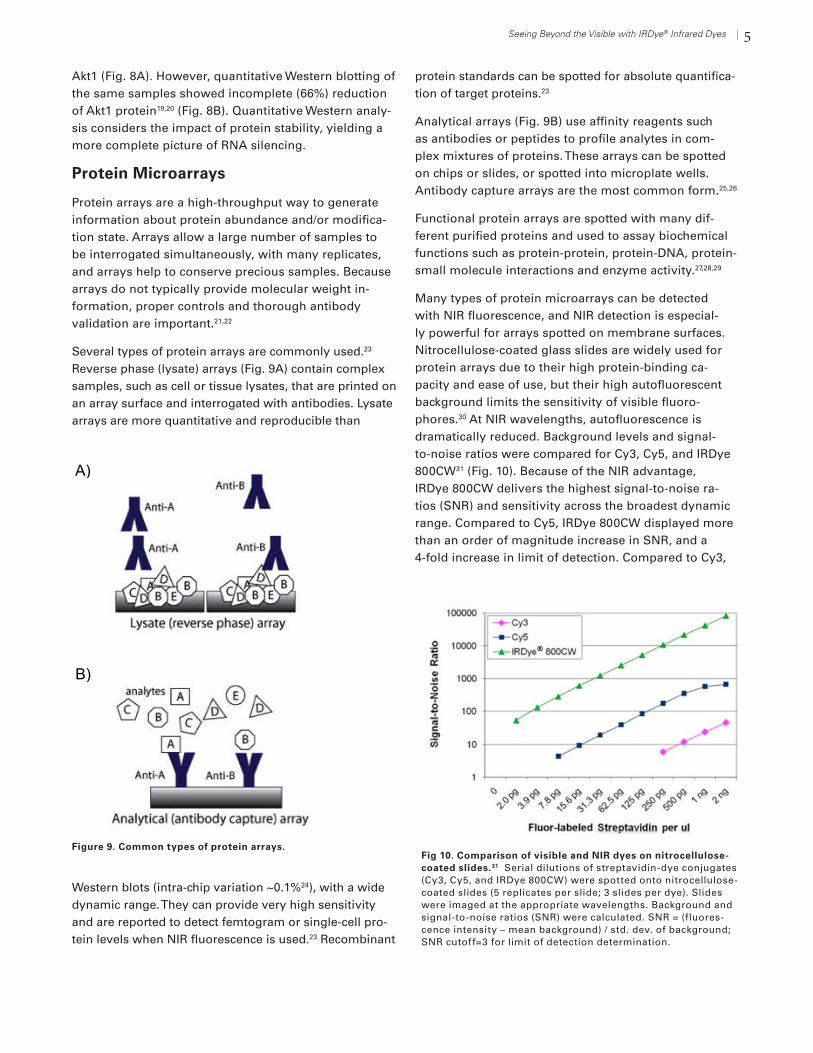
NIR fluorophores, attached to unique secondary anti-bodies, are used for detection. Phospho-signal is then normalized against the total level of that protein, using the target protein as its own internal control (Fig. 7). Alternatively, the second color can be used to detect a different protein of interest or to normalize against a housekeeping protein. Multiplex phospho-analysis requires high sensitivity in both detection channels.Western blotting is also essential for validation of other assays. In mass spectrometry proteomics analysis, Western blots provide confirmation of the observed changes in protein abundance.16,17 Western blots are also used to validate newly-developed ELISA methods.18 Validation is particularly important for RNAi studies, because mRNA levels do not always accurately reflect protein levels. Figure 8 shows siRNA silencing of Akt1. qRT-PCR analysis indicated near-complete silencing of
Figure 7. Multiplex phospho-analysis. A) Schematic of method. B) Multiplex phospho-analysis of EGFR in A431 cell lysates. C) Quantification of EGFR phosphorylation induced by EGF stimulation. Image captured with Odyssey CLx Imager.
Figure 8. Validation of siRNA silencing by qRT-PCR and Western blot. Cells were transfected with Akt1 siRNA or scrambled siRNA. Quantitative real time PCR (qRT-PCR) and quantitative Western analysis were performed.9 A) After Akt1 siRNA transfection, the Akt1 mRNA transcript was undetectable for >40 cycles of qRT-PCR, indicating near-complete silencing. B) In contrast, quan-titative Western blotting of those same samples demonstrated incomplete (66%) reduction of Akt1 protein.19,20 Actin was used as an internal control. Image captured with Odyssey Classic Imager.
pan-Ab phospho-Ab
Quantitification of EGFR Phosphorylation
Flu
or.
Inte
nsi
ty
Cell Number (x10-5)
5Seeing Beyond the Visible with IRDye® Infrared Dyes
Akt1 (Fig. 8A). However, quantitative Western blotting of the same samples showed incomplete (66%) reduction of Akt1 protein19,20 (Fig. 8B). Quantitative Western analy-sis considers the impact of protein stability, yielding a more complete picture of RNA silencing.
Protein Microarrays
Protein arrays are a high-throughput way to generate information about protein abundance and/or modifica-tion state. Arrays allow a large number of samples to be interrogated simultaneously, with many replicates, and arrays help to conserve precious samples. Because arrays do not typically provide molecular weight in-formation, proper controls and thorough antibody validation are important.21,22
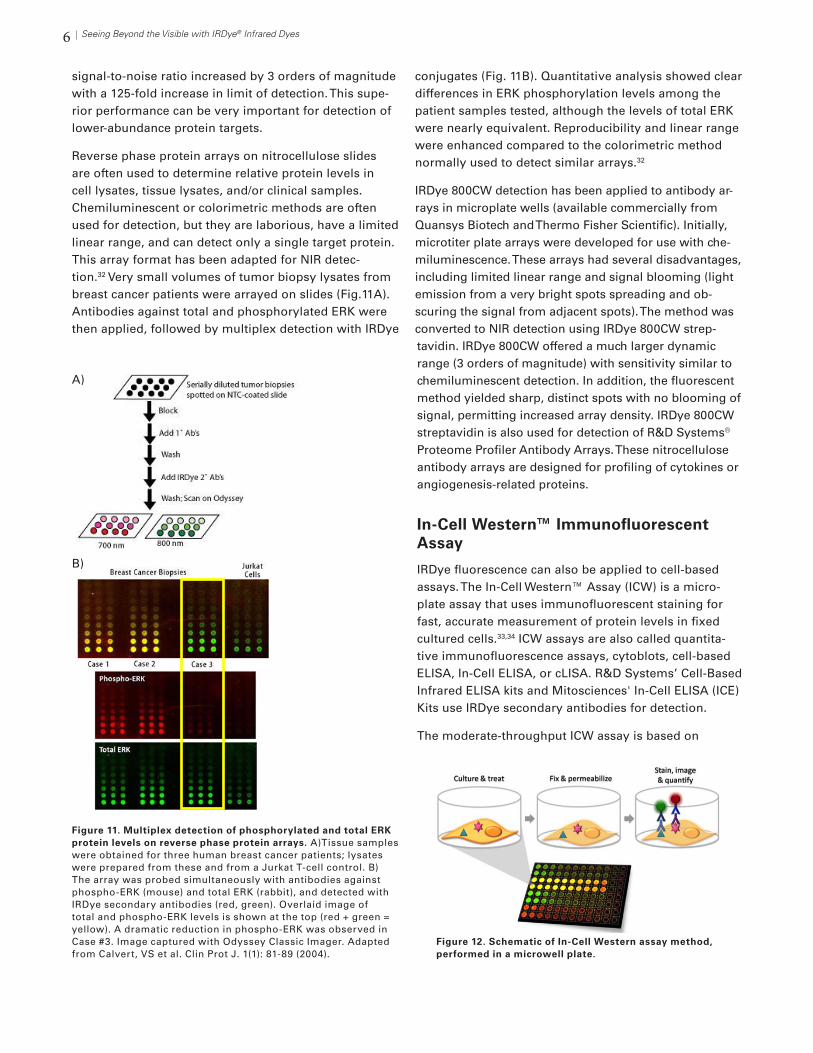
Several types of protein arrays are commonly used.23 Reverse phase (lysate) arrays (Fig. 9A) contain complex samples, such as cell or tissue lysates, that are printed on an array surface and interrogated with antibodies. Lysate arrays are more quantitative and reproducible than
Western blots (intra-chip variation ~0.1%24), with a wide dynamic range. They can provide very high sensitivity and are reported to detect femtogram or single-cell pro-tein levels when NIR fluorescence is used.23 Recombinant
protein standards can be spotted for absolute quantifica-tion of target proteins.23
Analytical arrays (Fig. 9B) use affinity reagents such as antibodies or peptides to profile analytes in com-plex mixtures of proteins. These arrays can be spotted on chips or slides, or spotted into microplate wells. Antibody capture arrays are the most common form.25,26
Functional protein arrays are spotted with many dif-ferent purified proteins and used to assay biochemical functions such as protein-protein, protein-DNA, protein-small molecule interactions and enzyme activity.27,28,29
Many types of protein microarrays can be detected with NIR fluorescence, and NIR detection is especial-ly powerful for arrays spotted on membrane surfaces. Nitrocellulose-coated glass slides are widely used for protein arrays due to their high protein-binding ca-pacity and ease of use, but their high autofluorescent background limits the sensitivity of visible fluoro-phores.30 At NIR wavelengths, autofluorescence is dramatically reduced. Background levels and signal-to-noise ratios were compared for Cy3, Cy5, and IRDye 800CW31 (Fig. 10). Because of the NIR advantage, IRDye 800CW delivers the highest signal-to-noise ra-tios (SNR) and sensitivity across the broadest dynamic range. Compared to Cy5, IRDye 800CW displayed more than an order of magnitude increase in SNR, and a 4-fold increase in limit of detection. Compared to Cy3,
A) B)
A) B)
Figure 9. Common types of protein arrays.Fig 10. Comparison of visible and NIR dyes on nitrocellulose-coated slides.31 Serial dilutions of streptavidin-dye conjugates (Cy3, Cy5, and IRDye 800CW) were spotted onto nitrocellulose-coated slides (5 replicates per slide; 3 slides per dye). Slides were imaged at the appropriate wavelengths. Background and signal-to-noise ratios (SNR) were calculated. SNR = (fluores-cence intensity – mean background) / std. dev. of background; SNR cutoff=3 for limit of detection determination.
6 Seeing Beyond the Visible with IRDye® Infrared Dyes
signal-to-noise ratio increased by 3 orders of magnitude with a 125-fold increase in limit of detection. This supe-rior performance can be very important for detection of lower-abundance protein targets.
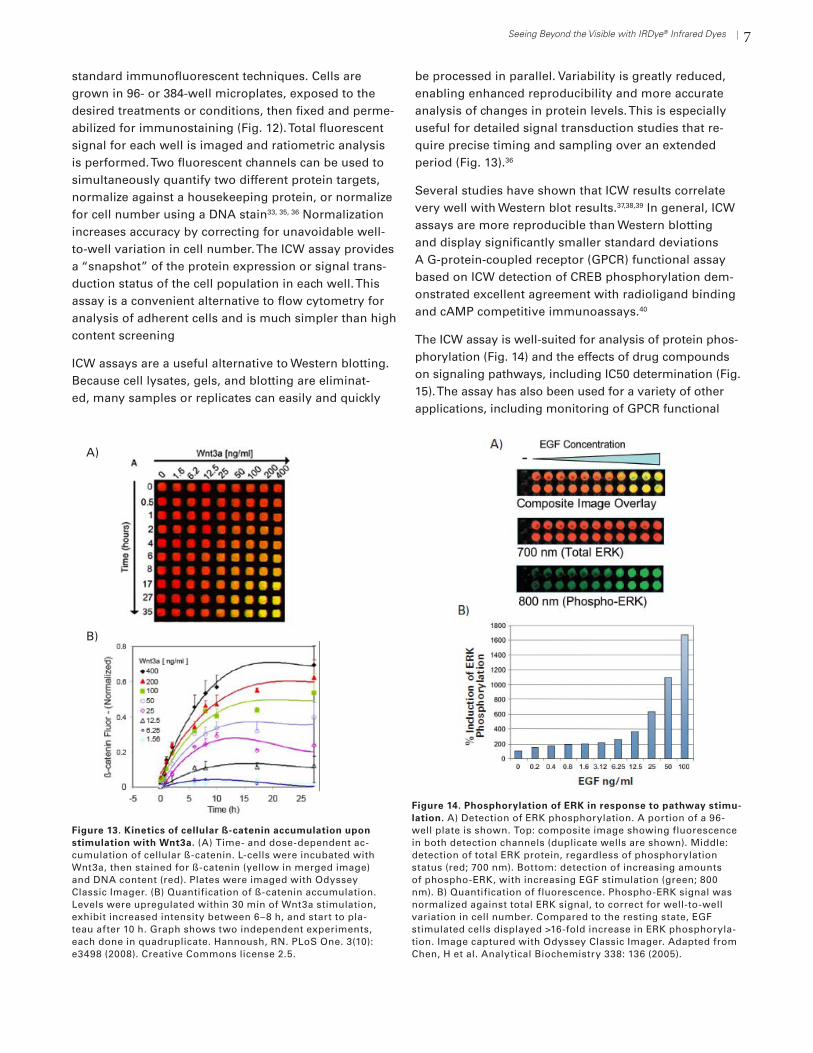
Reverse phase protein arrays on nitrocellulose slides are often used to determine relative protein levels in cell lysates, tissue lysates, and/or clinical samples. Chemiluminescent or colorimetric methods are often used for detection, but they are laborious, have a limited linear range, and can detect only a single target protein. This array format has been adapted for NIR detec-tion.32 Very small volumes of tumor biopsy lysates from breast cancer patients were arrayed on slides (Fig.11A). Antibodies against total and phosphorylated ERK were then applied, followed by multiplex detection with IRDye
conjugates (Fig. 11B). Quantitative analysis showed clear differences in ERK phosphorylation levels among the patient samples tested, although the levels of total ERK were nearly equivalent. Reproducibility and linear range were enhanced compared to the colorimetric method normally used to detect similar arrays.32
IRDye 800CW detection has been applied to antibody ar-rays in microplate wells (available commercially from Quansys Biotech and Thermo Fisher Scientific). Initially, microtiter plate arrays were developed for use with che-miluminescence. These arrays had several disadvantages, including limited linear range and signal blooming (light emission from a very bright spots spreading and ob-scuring the signal from adjacent spots). The method was converted to NIR detection using IRDye 800CW strep-tavidin. IRDye 800CW offered a much larger dynamic range (3 orders of magnitude) with sensitivity similar to chemiluminescent detection. In addition, the fluorescent method yielded sharp, distinct spots with no blooming of signal, permitting increased array density. IRDye 800CW streptavidin is also used for detection of R&D Systems® Proteome Profiler Antibody Arrays. These nitrocellulose antibody arrays are designed for profiling of cytokines or angiogenesis-related proteins.
In-Cell Western™ Immunofluorescent Assay
IRDye fluorescence can also be applied to cell-based assays. The In-Cell Western™ Assay (ICW) is a micro-plate assay that uses immunofluorescent staining for fast, accurate measurement of protein levels in fixed cultured cells.33,34 ICW assays are also called quantita-tive immunofluorescence assays, cytoblots, cell-based ELISA, In-Cell ELISA, or cLISA. R&D Systems’ Cell-Based Infrared ELISA kits and Mitosciences' In-Cell ELISA (ICE) Kits use IRDye secondary antibodies for detection.
The moderate-throughput ICW assay is based on
Figure 12. Schematic of In-Cell Western assay method, performed in a microwell plate.
Figure 11. Multiplex detection of phosphorylated and total ERK protein levels on reverse phase protein arrays. A)Tissue samples were obtained for three human breast cancer patients; lysates were prepared from these and from a Jurkat T-cell control. B) The array was probed simultaneously with antibodies against phospho-ERK (mouse) and total ERK (rabbit), and detected with IRDye secondary antibodies (red, green). Overlaid image of total and phospho-ERK levels is shown at the top (red + green = yellow). A dramatic reduction in phospho-ERK was observed in Case #3. Image captured with Odyssey Classic Imager. Adapted from Calvert, VS et al. Clin Prot J. 1(1): 81-89 (2004).
A)
B)
7Seeing Beyond the Visible with IRDye® Infrared Dyes
standard immunofluorescent techniques. Cells are grown in 96- or 384-well microplates, exposed to the desired treatments or conditions, then fixed and perme-abilized for immunostaining (Fig. 12). Total fluorescent signal for each well is imaged and ratiometric analysis is performed. Two fluorescent channels can be used to simultaneously quantify two different protein targets, normalize against a housekeeping protein, or normalize for cell number using a DNA stain33, 35, 36 Normalization increases accuracy by correcting for unavoidable well-to-well variation in cell number. The ICW assay provides a “snapshot” of the protein expression or signal trans-duction status of the cell population in each well. This assay is a convenient alternative to flow cytometry for analysis of adherent cells and is much simpler than high content screening
ICW assays are a useful alternative to Western blotting. Because cell lysates, gels, and blotting are eliminat-ed, many samples or replicates can easily and quickly
be processed in parallel. Variability is greatly reduced, enabling enhanced reproducibility and more accurate analysis of changes in protein levels. This is especially useful for detailed signal transduction studies that re-quire precise timing and sampling over an extended period (Fig. 13).36
Several studies have shown that ICW results correlate very well with Western blot results.37,38,39 In general, ICW assays are more reproducible than Western blotting and display significantly smaller standard deviations A G-protein-coupled receptor (GPCR) functional assay based on ICW detection of CREB phosphorylation dem-onstrated excellent agreement with radioligand binding and cAMP competitive immunoassays.40
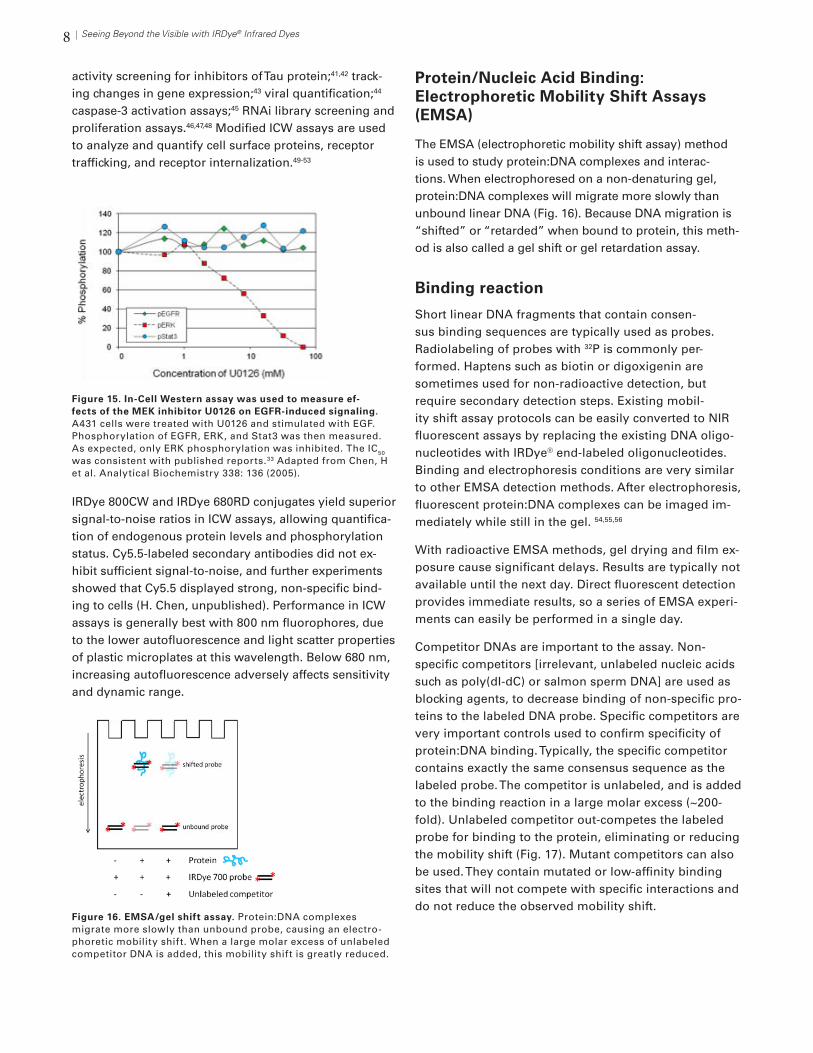
The ICW assay is well-suited for analysis of protein phos-phorylation (Fig. 14) and the effects of drug compounds on signaling pathways, including IC50 determination (Fig. 15). The assay has also been used for a variety of other applications, including monitoring of GPCR functional
Figure 14. Phosphorylation of ERK in response to pathway stimu-lation. A) Detection of ERK phosphorylation. A portion of a 96-well plate is shown. Top: composite image showing fluorescence in both detection channels (duplicate wells are shown). Middle: detection of total ERK protein, regardless of phosphorylation status (red; 700 nm). Bottom: detection of increasing amounts of phospho-ERK, with increasing EGF stimulation (green; 800 nm). B) Quantification of fluorescence. Phospho-ERK signal was normalized against total ERK signal, to correct for well-to-well variation in cell number. Compared to the resting state, EGF stimulated cells displayed >16-fold increase in ERK phosphoryla-tion. Image captured with Odyssey Classic Imager. Adapted from Chen, H et al. Analytical Biochemistry 338: 136 (2005).
Figure 13. Kinetics of cellular ß-catenin accumulation upon stimulation with Wnt3a. (A) Time- and dose-dependent ac-cumulation of cellular ß-catenin. L-cells were incubated with Wnt3a, then stained for ß-catenin (yellow in merged image) and DNA content (red). Plates were imaged with Odyssey Classic Imager. (B) Quantification of ß-catenin accumulation. Levels were upregulated within 30 min of Wnt3a stimulation, exhibit increased intensity between 6–8 h, and start to pla-teau after 10 h. Graph shows two independent experiments, each done in quadruplicate. Hannoush, RN. PLoS One. 3(10): e3498 (2008). Creative Commons license 2.5.
A)
B)
8 Seeing Beyond the Visible with IRDye® Infrared Dyes
activity screening for inhibitors of Tau protein;41,42 track-ing changes in gene expression;43 viral quantification;44 caspase-3 activation assays;45 RNAi library screening and proliferation assays.46,47,48 Modified ICW assays are used to analyze and quantify cell surface proteins, receptor trafficking, and receptor internalization.49-53
IRDye 800CW and IRDye 680RD conjugates yield superior signal-to-noise ratios in ICW assays, allowing quantifica-tion of endogenous protein levels and phosphorylation status. Cy5.5-labeled secondary antibodies did not ex-hibit sufficient signal-to-noise, and further experiments showed that Cy5.5 displayed strong, non-specific bind-ing to cells (H. Chen, unpublished). Performance in ICW assays is generally best with 800 nm fluorophores, due to the lower autofluorescence and light scatter properties of plastic microplates at this wavelength. Below 680 nm, increasing autofluorescence adversely affects sensitivity and dynamic range.
Protein/Nucleic Acid Binding: Electrophoretic Mobility Shift Assays (EMSA)
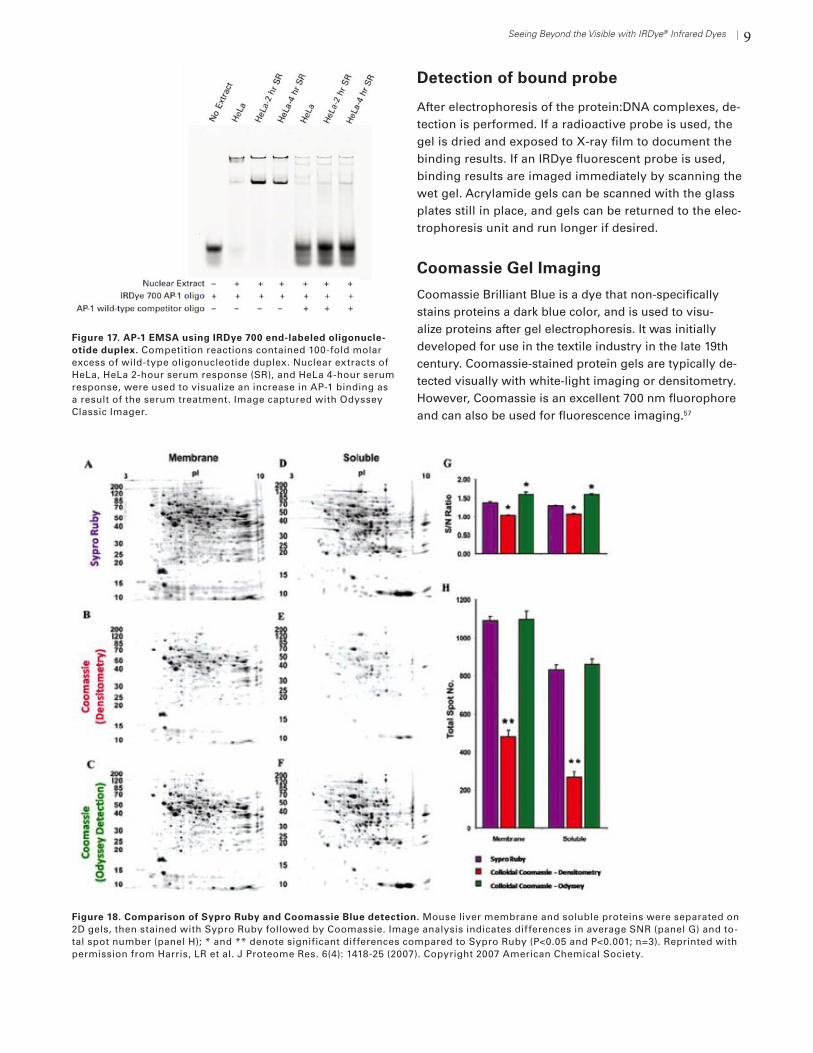
The EMSA (electrophoretic mobility shift assay) method is used to study protein:DNA complexes and interac-tions. When electrophoresed on a non-denaturing gel, protein:DNA complexes will migrate more slowly than unbound linear DNA (Fig. 16). Because DNA migration is “shifted” or “retarded” when bound to protein, this meth-od is also called a gel shift or gel retardation assay.
Binding reaction
Short linear DNA fragments that contain consen-sus binding sequences are typically used as probes. Radiolabeling of probes with 32P is commonly per-formed. Haptens such as biotin or digoxigenin are sometimes used for non-radioactive detection, but require secondary detection steps. Existing mobil-ity shift assay protocols can be easily converted to NIR fluorescent assays by replacing the existing DNA oligo-nucleotides with IRDye® end-labeled oligonucleotides. Binding and electrophoresis conditions are very similar to other EMSA detection methods. After electrophoresis, fluorescent protein:DNA complexes can be imaged im-mediately while still in the gel. 54,55,56
With radioactive EMSA methods, gel drying and film ex-posure cause significant delays. Results are typically not available until the next day. Direct fluorescent detection provides immediate results, so a series of EMSA experi-ments can easily be performed in a single day.
Competitor DNAs are important to the assay. Non-specific competitors [irrelevant, unlabeled nucleic acids such as poly(dI-dC) or salmon sperm DNA] are used as blocking agents, to decrease binding of non-specific pro-teins to the labeled DNA probe. Specific competitors are very important controls used to confirm specificity of protein:DNA binding. Typically, the specific competitor contains exactly the same consensus sequence as the labeled probe. The competitor is unlabeled, and is added to the binding reaction in a large molar excess (~200-fold). Unlabeled competitor out-competes the labeled probe for binding to the protein, eliminating or reducing the mobility shift (Fig. 17). Mutant competitors can also be used. They contain mutated or low-affinity binding sites that will not compete with specific interactions and do not reduce the observed mobility shift.
Figure 15. In-Cell Western assay was used to measure ef-fects of the MEK inhibitor U0126 on EGFR-induced signaling. A431 cells were treated with U0126 and stimulated with EGF. Phosphorylation of EGFR, ERK, and Stat3 was then measured. As expected, only ERK phosphorylation was inhibited. The IC50
was consistent with published reports.33 Adapted from Chen, H et al. Analytical Biochemistry 338: 136 (2005).
Figure 16. EMSA/gel shift assay. Protein:DNA complexes migrate more slowly than unbound probe, causing an electro-phoretic mobility shift. When a large molar excess of unlabeled competitor DNA is added, this mobility shift is greatly reduced.
9Seeing Beyond the Visible with IRDye® Infrared Dyes
Detection of bound probe
After electrophoresis of the protein:DNA complexes, de-tection is performed. If a radioactive probe is used, the gel is dried and exposed to X-ray film to document the binding results. If an IRDye fluorescent probe is used, binding results are imaged immediately by scanning the wet gel. Acrylamide gels can be scanned with the glass plates still in place, and gels can be returned to the elec-trophoresis unit and run longer if desired.
Coomassie Gel Imaging
Coomassie Brilliant Blue is a dye that non-specifically stains proteins a dark blue color, and is used to visu-alize proteins after gel electrophoresis. It was initially developed for use in the textile industry in the late 19th century. Coomassie-stained protein gels are typically de-tected visually with white-light imaging or densitometry. However, Coomassie is an excellent 700 nm fluorophore and can also be used for fluorescence imaging.57
Figure 17. AP-1 EMSA using IRDye 700 end-labeled oligonucle-otide duplex. Competition reactions contained 100-fold molar excess of wild-type oligonucleotide duplex. Nuclear extracts of HeLa, HeLa 2-hour serum response (SR), and HeLa 4-hour serum response, were used to visualize an increase in AP-1 binding as a result of the serum treatment. Image captured with Odyssey Classic Imager.
Figure 18. Comparison of Sypro Ruby and Coomassie Blue detection. Mouse liver membrane and soluble proteins were separated on 2D gels, then stained with Sypro Ruby followed by Coomassie. Image analysis indicates differences in average SNR (panel G) and to-tal spot number (panel H); * and ** denote significant differences compared to Sypro Ruby (P<0.05 and P<0.001; n=3). Reprinted with permission from Harris, LR et al. J Proteome Res. 6(4): 1418-25 (2007). Copyright 2007 American Chemical Society.
10 Seeing Beyond the Visible with IRDye® Infrared Dyes
Fluorescence imaging of Coomassie with the Odyssey family of imagers yields high sensitivity and quanti-tative protein detection, with a reported linear range from ~10 ng to 20 mg.57 Fluorescence imaging is more sensitive than white-light imaging of Coomassie-stained gels (Fig. 18).58 It yields detection sensitivity comparable to Sypro Ruby (Fig. 18) 57, 58 with improved SNR (Fig. 18G) and substantially reduced cost. IRDye Blue Protein Stain, a Coomassie-based stain, is a convenient, safe alternative for gel staining. Unlike traditional Coomassie stains, which require methanol and acetic acid for staining and destaining, IRDye Blue Protein Stain is water-based and requires no hazardous solvents. This stain offers excellent detection sensi-tivity in the 700 nm channel of the Odyssey family of imagers (5 ng of BSA can be reliably detected).
IRDye FRET Assays for Protease Activity
Fluorescent dyes play an important role in screen-ing chemical libraries for inhibitors of various enzyme targets, such as kinase and proteases. Background fluorescence from biological components, library compounds, and other external sources can produce false positives and reduce sensitivity. The use of IRDye 800CW can substantially reduce or eliminate back-ground fluorescence by shifting the assay to higher wavelengths, thus reducing false positives.59
Many FRET (fluorescence resonance energy transfer) protease assays are based on non-fluorescent pep-tide substrates that become fluorescent upon cleavage. These quenched substrates have a fluorescent dye at
one terminus and a quencher on the opposite side of the cleavage site. Cleavage by the protease physically separates the dye from the quencher, allowing the dye to fluoresce (Fig. 19). These homogeneous assays do not require further processing or purification.
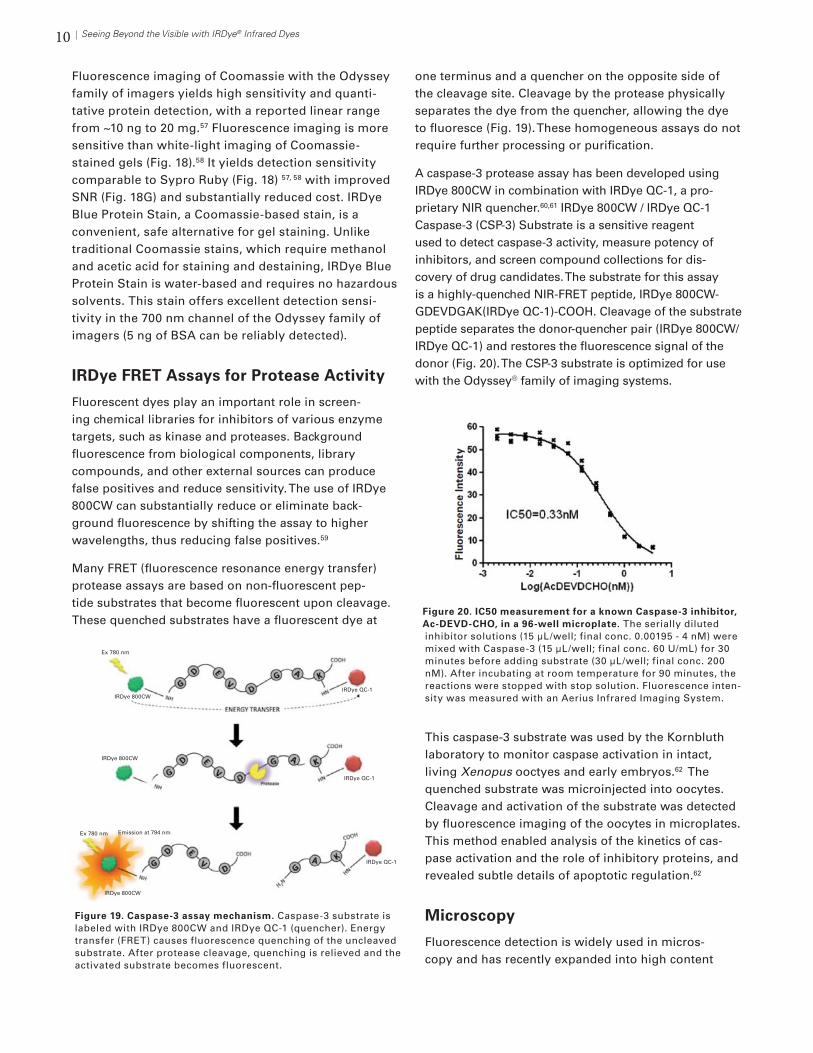
A caspase-3 protease assay has been developed using IRDye 800CW in combination with IRDye QC-1, a pro-prietary NIR quencher.60,61 IRDye 800CW / IRDye QC-1 Caspase-3 (CSP-3) Substrate is a sensitive reagent used to detect caspase-3 activity, measure potency of inhibitors, and screen compound collections for dis-covery of drug candidates. The substrate for this assay is a highly-quenched NIR-FRET peptide, IRDye 800CW-GDEVDGAK(IRDye QC-1)-COOH. Cleavage of the substrate peptide separates the donor-quencher pair (IRDye 800CW/ IRDye QC-1) and restores the fluorescence signal of the donor (Fig. 20). The CSP-3 substrate is optimized for use with the Odyssey® family of imaging systems.
This caspase-3 substrate was used by the Kornbluth laboratory to monitor caspase activation in intact, living Xenopus ooctyes and early embryos.62 The quenched substrate was microinjected into oocytes. Cleavage and activation of the substrate was detected by fluorescence imaging of the oocytes in microplates. This method enabled analysis of the kinetics of cas-pase activation and the role of inhibitory proteins, and revealed subtle details of apoptotic regulation.62
Microscopy
Fluorescence detection is widely used in micros-copy and has recently expanded into high content
Figure 20. IC50 measurement for a known Caspase-3 inhibitor, Ac-DEVD-CHO, in a 96-well microplate. The serially diluted inhibitor solutions (15 μL/well; final conc. 0.00195 - 4 nM) were mixed with Caspase-3 (15 μL/well; final conc. 60 U/mL) for 30 minutes before adding substrate (30 μL/well; final conc. 200 nM). After incubating at room temperature for 90 minutes, the reactions were stopped with stop solution. Fluorescence inten-sity was measured with an Aerius Infrared Imaging System.
Figure 19. Caspase-3 assay mechanism. Caspase-3 substrate is labeled with IRDye 800CW and IRDye QC-1 (quencher). Energy transfer (FRET) causes fluorescence quenching of the uncleaved substrate. After protease cleavage, quenching is relieved and the activated substrate becomes fluorescent.
IRDye 800CW
Ex 780 nm
Ex 780 nm Emission at 794 nm
IRDye 800CW
IRDye 800CW
IRDye QC-1
IRDye QC-1
IRDye QC-1
11Seeing Beyond the Visible with IRDye® Infrared Dyes
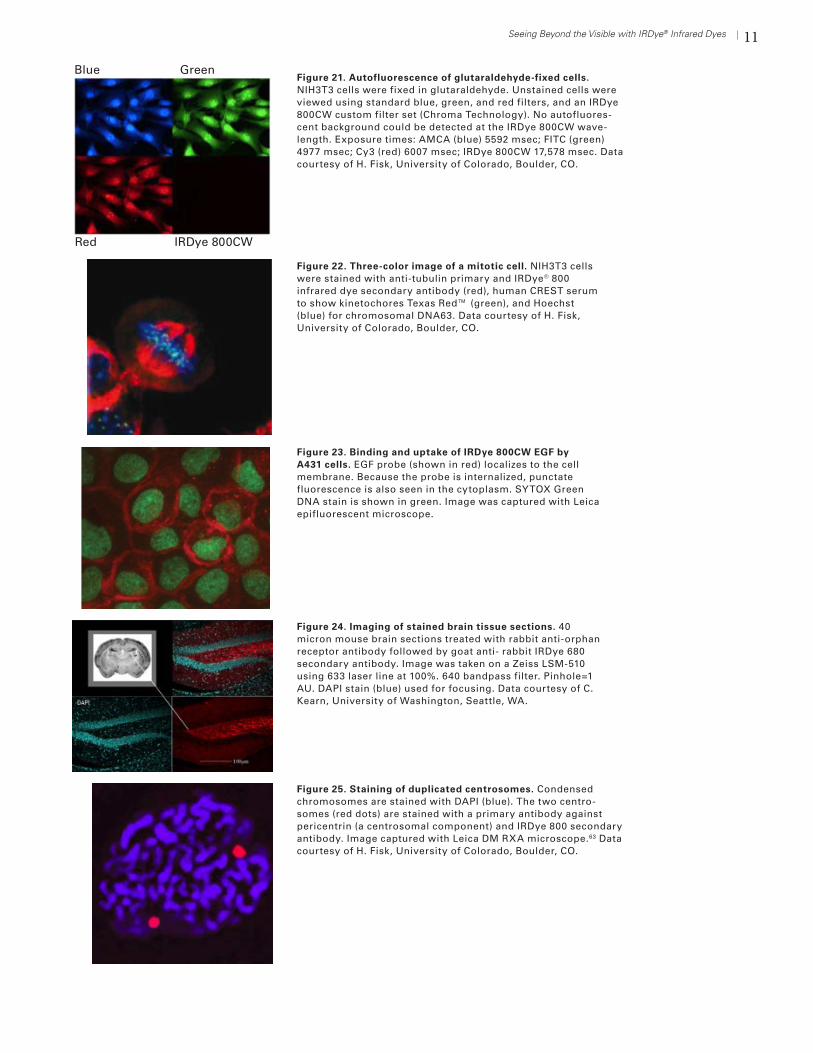
Figure 22. Three-color image of a mitotic cell. NIH3T3 cells were stained with anti-tubulin primary and IRDye® 800 infrared dye secondary antibody (red), human CREST serum to show kinetochores Texas Red™ (green), and Hoechst (blue) for chromosomal DNA63. Data courtesy of H. Fisk, University of Colorado, Boulder, CO.
Figure 23. Binding and uptake of IRDye 800CW EGF by A431 cells. EGF probe (shown in red) localizes to the cell membrane. Because the probe is internalized, punctate fluorescence is also seen in the cytoplasm. SYTOX Green DNA stain is shown in green. Image was captured with Leica epifluorescent microscope.
Figure 24. Imaging of stained brain tissue sections. 40 micron mouse brain sections treated with rabbit anti-orphan receptor antibody followed by goat anti- rabbit IRDye 680 secondary antibody. Image was taken on a Zeiss LSM-510 using 633 laser line at 100%. 640 bandpass filter. Pinhole=1 AU. DAPI stain (blue) used for focusing. Data courtesy of C. Kearn, University of Washington, Seattle, WA.
Figure 25. Staining of duplicated centrosomes. Condensed chromosomes are stained with DAPI (blue). The two centro-somes (red dots) are stained with a primary antibody against pericentrin (a centrosomal component) and IRDye 800 secondary antibody. Image captured with Leica DM RXA microscope.63 Data courtesy of H. Fisk, University of Colorado, Boulder, CO.
Figure 21. Autofluorescence of glutaraldehyde-fixed cells. NIH3T3 cells were fixed in glutaraldehyde. Unstained cells were viewed using standard blue, green, and red filters, and an IRDye 800CW custom filter set (Chroma Technology). No autofluores-cent background could be detected at the IRDye 800CW wave-length. Exposure times: AMCA (blue) 5592 msec; FITC (green) 4977 msec; Cy3 (red) 6007 msec; IRDye 800CW 17,578 msec. Data courtesy of H. Fisk, University of Colorado, Boulder, CO.
Blue
Red
Green
IRDye 800CW
12 Seeing Beyond the Visible with IRDye® Infrared Dyes
screening. IRDye infrared dyes can provide additional colors for multicolor immunofluorescence imaging at NIR wavelengths, where cells and tissue have low auto-fluorescence (Fig. 21). These additional colors offer wide spectral separation from commonly used visible fluoro-phores. To image NIR wavelengths, microscopes must be equipped with appropriate filter sets, a CCD camera responsive in the NIR, and a light source with sufficient excitation energy at NIR wavelengths (such as a xenon lamp; for details, visit www.licor.com/microscopy).
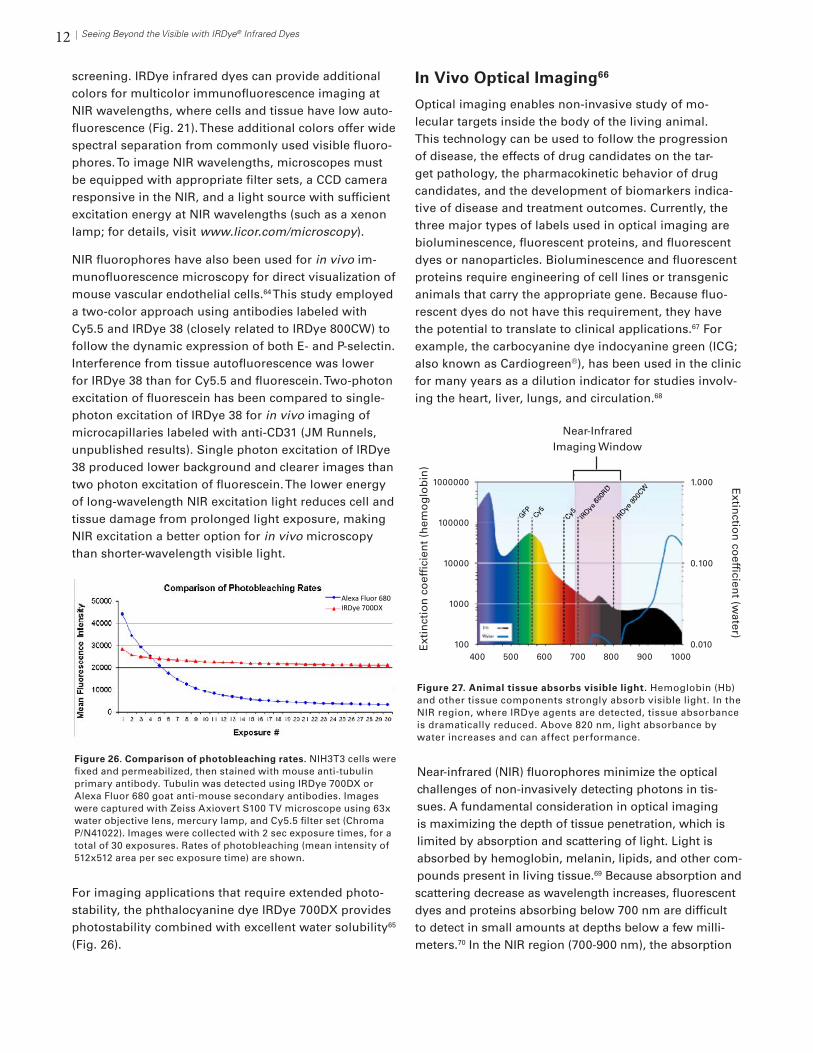
NIR fluorophores have also been used for in vivo im-munofluorescence microscopy for direct visualization of mouse vascular endothelial cells.64 This study employed a two-color approach using antibodies labeled with Cy5.5 and IRDye 38 (closely related to IRDye 800CW) to follow the dynamic expression of both E- and P-selectin. Interference from tissue autofluorescence was lower for IRDye 38 than for Cy5.5 and fluorescein. Two-photon excitation of fluorescein has been compared to single-photon excitation of IRDye 38 for in vivo imaging of microcapillaries labeled with anti-CD31 (JM Runnels, unpublished results). Single photon excitation of IRDye 38 produced lower background and clearer images than two photon excitation of fluorescein. The lower energy of long-wavelength NIR excitation light reduces cell and tissue damage from prolonged light exposure, making NIR excitation a better option for in vivo microscopy than shorter-wavelength visible light.
For imaging applications that require extended photo-stability, the phthalocyanine dye IRDye 700DX provides photostability combined with excellent water solubility65 (Fig. 26).
In Vivo Optical Imaging66
Optical imaging enables non-invasive study of mo-lecular targets inside the body of the living animal. This technology can be used to follow the progression of disease, the effects of drug candidates on the tar-get pathology, the pharmacokinetic behavior of drug candidates, and the development of biomarkers indica-tive of disease and treatment outcomes. Currently, the three major types of labels used in optical imaging are bioluminescence, fluorescent proteins, and fluorescent dyes or nanoparticles. Bioluminescence and fluorescent proteins require engineering of cell lines or transgenic animals that carry the appropriate gene. Because fluo-rescent dyes do not have this requirement, they have the potential to translate to clinical applications.67 For example, the carbocyanine dye indocyanine green (ICG; also known as Cardiogreen®), has been used in the clinic for many years as a dilution indicator for studies involv-ing the heart, liver, lungs, and circulation.68
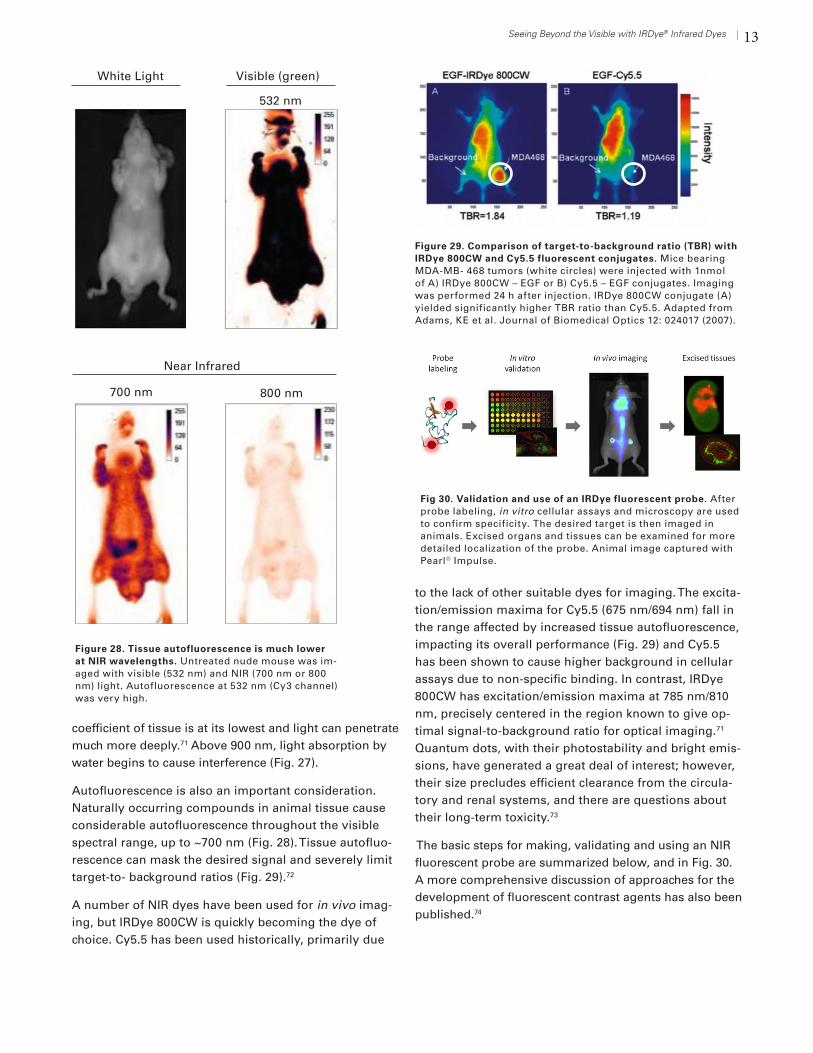
Near-infrared (NIR) fluorophores minimize the optical challenges of non-invasively detecting photons in tis-sues. A fundamental consideration in optical imaging is maximizing the depth of tissue penetration, which is limited by absorption and scattering of light. Light is absorbed by hemoglobin, melanin, lipids, and other com-pounds present in living tissue.69 Because absorption and scattering decrease as wavelength increases, fluorescent dyes and proteins absorbing below 700 nm are difficult to detect in small amounts at depths below a few milli-meters.70 In the NIR region (700-900 nm), the absorption
Figure 26. Comparison of photobleaching rates. NIH3T3 cells were fixed and permeabilized, then stained with mouse anti-tubulin primary antibody. Tubulin was detected using IRDye 700DX or Alexa Fluor 680 goat anti-mouse secondary antibodies. Images were captured with Zeiss Axiovert S100 TV microscope using 63x water objective lens, mercury lamp, and Cy5.5 filter set (Chroma P/N41022). Images were collected with 2 sec exposure times, for a total of 30 exposures. Rates of photobleaching (mean intensity of 512x512 area per sec exposure time) are shown.
Alexa Fluor 680 IRDye 700DX
Figure 27. Animal tissue absorbs visible light. Hemoglobin (Hb) and other tissue components strongly absorb visible light. In the NIR region, where IRDye agents are detected, tissue absorbance is dramatically reduced. Above 820 nm, light absorbance by water increases and can affect performance.
Extin
ction
coeffi
cient (w
ater)
Ext
inct
ion
co
effi
cien
t (h
emo
glo
bin
)
100
1000
0.010
10000 0.100
100000
1.0001000000
400 500 600 700 800 900 1000
Near-Infrared Imaging Window
13Seeing Beyond the Visible with IRDye® Infrared Dyes
coefficient of tissue is at its lowest and light can penetrate much more deeply.71 Above 900 nm, light absorption by water begins to cause interference (Fig. 27).
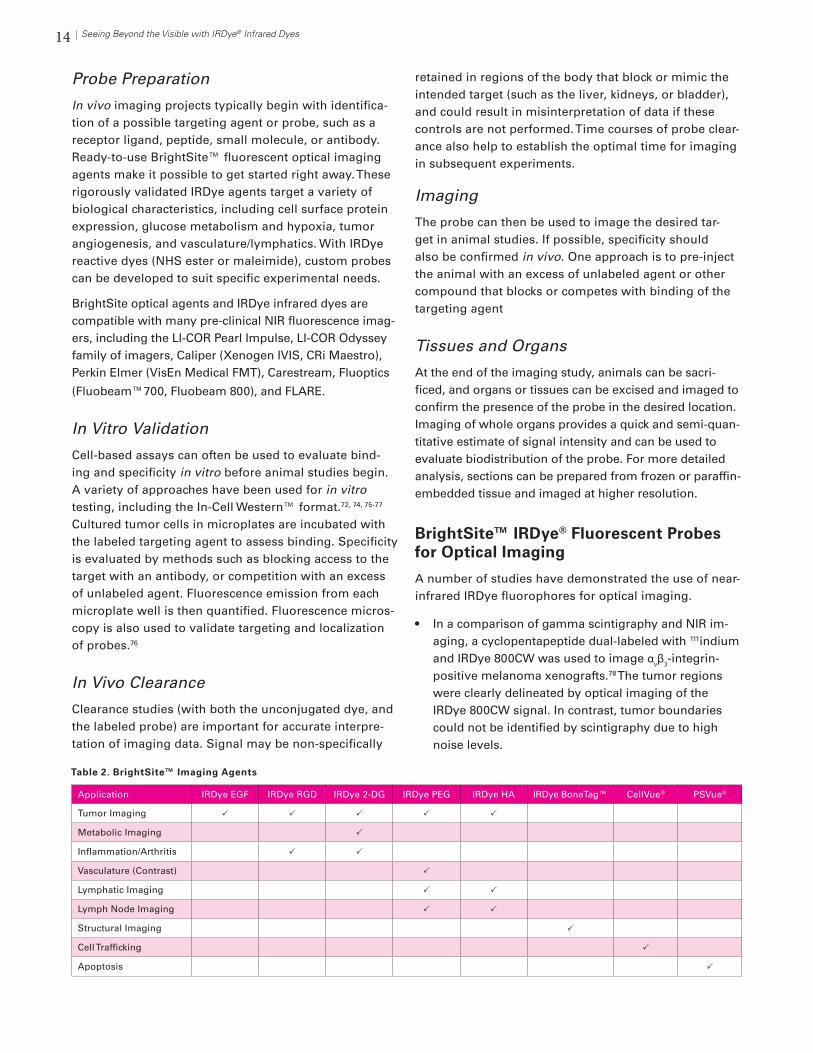
Autofluorescence is also an important consideration. Naturally occurring compounds in animal tissue cause considerable autofluorescence throughout the visible spectral range, up to ~700 nm (Fig. 28). Tissue autofluo-rescence can mask the desired signal and severely limit target-to- background ratios (Fig. 29).72
A number of NIR dyes have been used for in vivo imag-ing, but IRDye 800CW is quickly becoming the dye of choice. Cy5.5 has been used historically, primarily due
to the lack of other suitable dyes for imaging. The excita-tion/emission maxima for Cy5.5 (675 nm/694 nm) fall in the range affected by increased tissue autofluorescence, impacting its overall performance (Fig. 29) and Cy5.5 has been shown to cause higher background in cellular assays due to non-specific binding. In contrast, IRDye 800CW has excitation/emission maxima at 785 nm/810 nm, precisely centered in the region known to give op-timal signal-to-background ratio for optical imaging.71 Quantum dots, with their photostability and bright emis-sions, have generated a great deal of interest; however, their size precludes efficient clearance from the circula-tory and renal systems, and there are questions about their long-term toxicity.73
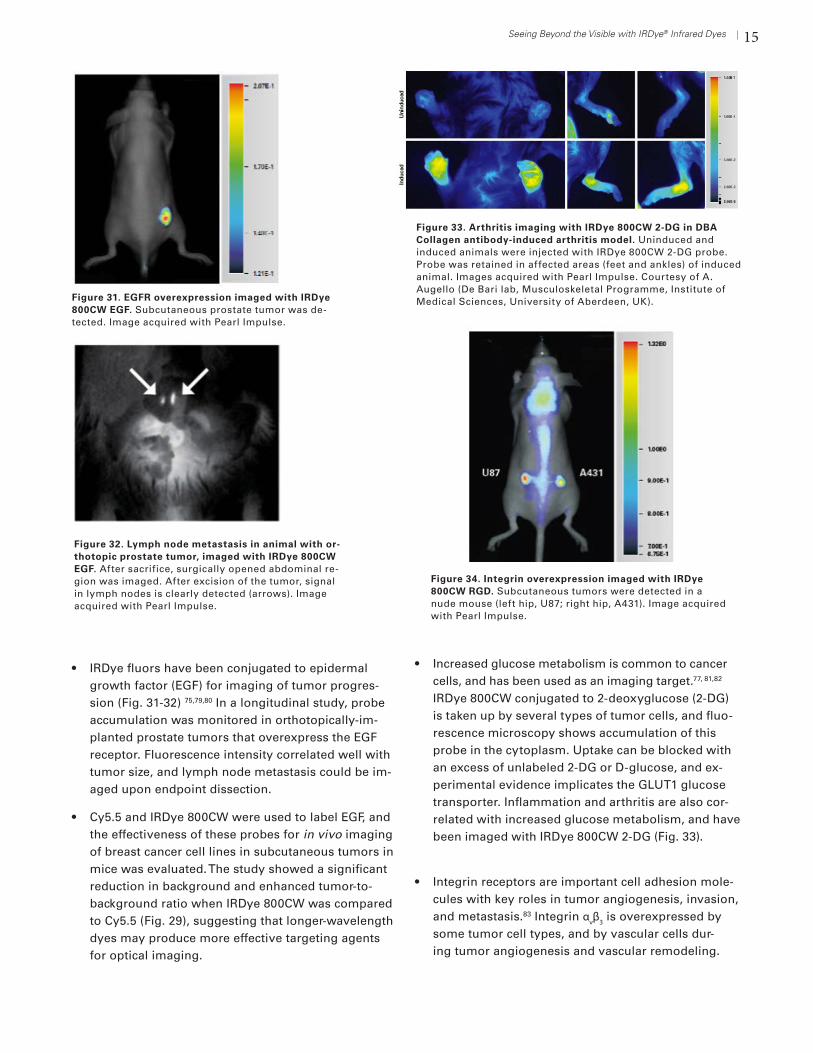
The basic steps for making, validating and using an NIR fluorescent probe are summarized below, and in Fig. 30. A more comprehensive discussion of approaches for the development of fluorescent contrast agents has also been published.74
Fig 30. Validation and use of an IRDye fluorescent probe. After probe labeling, in vitro cellular assays and microscopy are used to confirm specificity. The desired target is then imaged in animals. Excised organs and tissues can be examined for more detailed localization of the probe. Animal image captured with Pearl® Impulse.
Figure 29. Comparison of target-to-background ratio (TBR) with IRDye 800CW and Cy5.5 fluorescent conjugates. Mice bearing MDA-MB- 468 tumors (white circles) were injected with 1nmol of A) IRDye 800CW – EGF or B) Cy5.5 – EGF conjugates. Imaging was performed 24 h after injection. IRDye 800CW conjugate (A) yielded significantly higher TBR ratio than Cy5.5. Adapted from Adams, KE et al. Journal of Biomedical Optics 12: 024017 (2007).
Figure 28. Tissue autofluorescence is much lower at NIR wavelengths. Untreated nude mouse was im-aged with visible (532 nm) and NIR (700 nm or 800 nm) light. Autofluorescence at 532 nm (Cy3 channel) was very high.
White Light
Near Infrared
700 nm 800 nm
Visible (green)
532 nm
14 Seeing Beyond the Visible with IRDye® Infrared Dyes
Probe Preparation
In vivo imaging projects typically begin with identifica-tion of a possible targeting agent or probe, such as a receptor ligand, peptide, small molecule, or antibody. Ready-to-use BrightSite™ fluorescent optical imaging agents make it possible to get started right away. These rigorously validated IRDye agents target a variety of biological characteristics, including cell surface protein expression, glucose metabolism and hypoxia, tumor angiogenesis, and vasculature/lymphatics. With IRDye reactive dyes (NHS ester or maleimide), custom probes can be developed to suit specific experimental needs.
BrightSite optical agents and IRDye infrared dyes are compatible with many pre-clinical NIR fluorescence imag-ers, including the LI-COR Pearl Impulse, LI-COR Odyssey family of imagers, Caliper (Xenogen IVIS, CRi Maestro), Perkin Elmer (VisEn Medical FMT), Carestream, Fluoptics
(Fluobeam™700, Fluobeam 800), and FLARE.
In Vitro Validation
Cell-based assays can often be used to evaluate bind-ing and specificity in vitro before animal studies begin. A variety of approaches have been used for in vitro testing, including the In-Cell Western™ format.72, 74, 75-77 Cultured tumor cells in microplates are incubated with the labeled targeting agent to assess binding. Specificity is evaluated by methods such as blocking access to the target with an antibody, or competition with an excess of unlabeled agent. Fluorescence emission from each microplate well is then quantified. Fluorescence micros-copy is also used to validate targeting and localization of probes.76
In Vivo Clearance
Clearance studies (with both the unconjugated dye, and the labeled probe) are important for accurate interpre-tation of imaging data. Signal may be non-specifically
retained in regions of the body that block or mimic the intended target (such as the liver, kidneys, or bladder), and could result in misinterpretation of data if these controls are not performed. Time courses of probe clear-ance also help to establish the optimal time for imaging in subsequent experiments.
Imaging
The probe can then be used to image the desired tar-get in animal studies. If possible, specificity should also be confirmed in vivo. One approach is to pre-inject the animal with an excess of unlabeled agent or other compound that blocks or competes with binding of the targeting agent
Tissues and Organs
At the end of the imaging study, animals can be sacri-ficed, and organs or tissues can be excised and imaged to confirm the presence of the probe in the desired location. Imaging of whole organs provides a quick and semi-quan-titative estimate of signal intensity and can be used to evaluate biodistribution of the probe. For more detailed analysis, sections can be prepared from frozen or paraffin-embedded tissue and imaged at higher resolution.
BrightSite™ IRDye® Fluorescent Probes for Optical Imaging
A number of studies have demonstrated the use of near-infrared IRDye fluorophores for optical imaging.
• In a comparison of gamma scintigraphy and NIR im-aging, a cyclopentapeptide dual-labeled with 111indium and IRDye 800CW was used to image ανβ3-integrin-positive melanoma xenografts.78 The tumor regions were clearly delineated by optical imaging of the IRDye 800CW signal. In contrast, tumor boundaries could not be identified by scintigraphy due to high noise levels.
Application IRDye EGF IRDye RGD IRDye 2-DG IRDye PEG IRDye HA IRDye BoneTag™ CellVue® PSVue®
Tumor Imaging
Metabolic Imaging
Inflammation/Arthritis
Vasculature (Contrast)
Lymphatic Imaging
Lymph Node Imaging
Structural Imaging
Cell Trafficking
Apoptosis
Table 2. BrightSite™ Imaging Agents
15Seeing Beyond the Visible with IRDye® Infrared Dyes
• IRDye fluors have been conjugated to epidermal growth factor (EGF) for imaging of tumor progres-sion (Fig. 31-32) 75,79,80 In a longitudinal study, probe accumulation was monitored in orthotopically-im-planted prostate tumors that overexpress the EGF receptor. Fluorescence intensity correlated well with tumor size, and lymph node metastasis could be im-aged upon endpoint dissection.
• Cy5.5 and IRDye 800CW were used to label EGF, and the effectiveness of these probes for in vivo imaging of breast cancer cell lines in subcutaneous tumors in mice was evaluated. The study showed a significant reduction in background and enhanced tumor-to-background ratio when IRDye 800CW was compared to Cy5.5 (Fig. 29), suggesting that longer-wavelength dyes may produce more effective targeting agents for optical imaging.
• Increased glucose metabolism is common to cancer cells, and has been used as an imaging target.77, 81,82 IRDye 800CW conjugated to 2-deoxyglucose (2-DG) is taken up by several types of tumor cells, and fluo-rescence microscopy shows accumulation of this probe in the cytoplasm. Uptake can be blocked with an excess of unlabeled 2-DG or D-glucose, and ex-perimental evidence implicates the GLUT1 glucose transporter. Inflammation and arthritis are also cor-related with increased glucose metabolism, and have been imaged with IRDye 800CW 2-DG (Fig. 33).
• Integrin receptors are important cell adhesion mole-cules with key roles in tumor angiogenesis, invasion, and metastasis.83 Integrin ανβ3 is overexpressed by some tumor cell types, and by vascular cells dur-ing tumor angiogenesis and vascular remodeling.
Figure 33. Arthritis imaging with IRDye 800CW 2-DG in DBA Collagen antibody-induced arthritis model. Uninduced and induced animals were injected with IRDye 800CW 2-DG probe. Probe was retained in affected areas (feet and ankles) of induced animal. Images acquired with Pearl Impulse. Courtesy of A. Augello (De Bari lab, Musculoskeletal Programme, Institute of Medical Sciences, University of Aberdeen, UK).
Figure 34. Integrin overexpression imaged with IRDye 800CW RGD. Subcutaneous tumors were detected in a nude mouse (left hip, U87; right hip, A431). Image acquired with Pearl Impulse.
Figure 31. EGFR overexpression imaged with IRDye 800CW EGF. Subcutaneous prostate tumor was de-tected. Image acquired with Pearl Impulse.
Figure 32. Lymph node metastasis in animal with or-thotopic prostate tumor, imaged with IRDye 800CW EGF. After sacrifice, surgically opened abdominal re-gion was imaged. After excision of the tumor, signal in lymph nodes is clearly detected (arrows). Image acquired with Pearl Impulse.
16 Seeing Beyond the Visible with IRDye® Infrared Dyes
Inappropriate expression of integrin ανβ3 is believed to play a critical role in tumor growth, progression, and metastasis.84 The Arg-Gly-Asp (RGD) tripeptide is a specific ligand for ανβ3 and other integrins. Labeled IRDye RGD peptide ligands are used as imaging probes to monitor diseases related to integrin over-expression (Fig. 34).
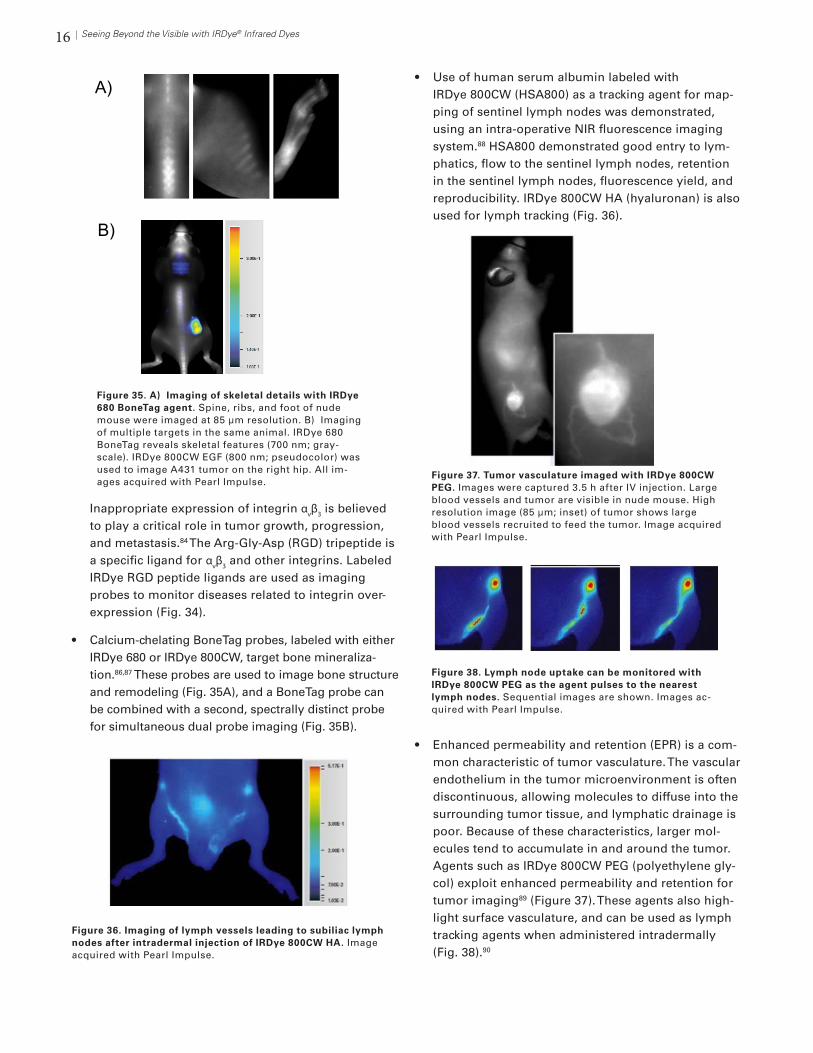
• Calcium-chelating BoneTag probes, labeled with either IRDye 680 or IRDye 800CW, target bone mineraliza-tion.86,87 These probes are used to image bone structure and remodeling (Fig. 35A), and a BoneTag probe can be combined with a second, spectrally distinct probe for simultaneous dual probe imaging (Fig. 35B).
• Use of human serum albumin labeled with IRDye 800CW (HSA800) as a tracking agent for map-ping of sentinel lymph nodes was demonstrated, using an intra-operative NIR fluorescence imaging system.88 HSA800 demonstrated good entry to lym-phatics, flow to the sentinel lymph nodes, retention in the sentinel lymph nodes, fluorescence yield, and reproducibility. IRDye 800CW HA (hyaluronan) is also used for lymph tracking (Fig. 36).
• Enhanced permeability and retention (EPR) is a com-mon characteristic of tumor vasculature. The vascular endothelium in the tumor microenvironment is often discontinuous, allowing molecules to diffuse into the surrounding tumor tissue, and lymphatic drainage is poor. Because of these characteristics, larger mol-ecules tend to accumulate in and around the tumor. Agents such as IRDye 800CW PEG (polyethylene gly-col) exploit enhanced permeability and retention for tumor imaging89 (Figure 37). These agents also high-light surface vasculature, and can be used as lymph tracking agents when administered intradermally (Fig. 38).90
Figure 37. Tumor vasculature imaged with IRDye 800CW PEG. Images were captured 3.5 h after IV injection. Large blood vessels and tumor are visible in nude mouse. High resolution image (85 μm; inset) of tumor shows large blood vessels recruited to feed the tumor. Image acquired with Pearl Impulse.
Figure 38. Lymph node uptake can be monitored with IRDye 800CW PEG as the agent pulses to the nearest lymph nodes. Sequential images are shown. Images ac-quired with Pearl Impulse.
A) B)
A) B)
A) B)
A) B)
Figure 35. A) Imaging of skeletal details with IRDye 680 BoneTag agent. Spine, ribs, and foot of nude mouse were imaged at 85 μm resolution. B) Imaging of multiple targets in the same animal. IRDye 680 BoneTag reveals skeletal features (700 nm; gray-scale). IRDye 800CW EGF (800 nm; pseudocolor) was used to image A431 tumor on the right hip. All im-ages acquired with Pearl Impulse.
Figure 36. Imaging of lymph vessels leading to subiliac lymph nodes after intradermal injection of IRDye 800CW HA. Image acquired with Pearl Impulse.

17Seeing Beyond the Visible with IRDye® Infrared Dyes
Summary
IRDye infrared dyes are excellent fluorescent labels for protein and cellular assays, biochemical assays, micros-copy, and in vivo molecular imaging. These dyes are bright, have excellent water solubility, and exhibit low non-specific binding. Background fluorescence from membranes, plastics, tissues, biological samples, and chemical compounds is substantially reduced at NIR wavelengths, enabling a variety of fluorescent applica-tions that were previously impractical. In addition, the ability of NIR light to penetrate deep into animal tissue opens new windows of opportunity for in vivo imaging of small animals and possible clinical translation.67
References1. Smith, LM et al. Nature 321: 674 (1986)
2. Middendorf, LR et al. Electrophoresis 13: 487 (1992)
3. Ernst, LA et al. Cytometry 10: 3 (1989)
4. Flanagan, JH Jr, et al. Bioconj Chem. 8:751-6 (1997)
5. Towbin, H et al. Proc Natl Acad Sci U S A. 76(9): 4350-4 (1979)
6. Schutz-Geschwender, A et al. Application Note, LI-COR Biosciences,(2004)
7. Gerk, PM. J Pharmacol Toxicol Methods. 63: 279-82 (2011)
8. Wang, YV et al. Proc Natl Acad Sci USA 104: 12365–12370 (2007)
9. Anderson, NL and NG Anderson. Mol Cell Prot. 1: 845–867 (2002)
10. Mitchell, P. Nature Biotechnol. 28: 665-670 (2010)
11. Malmström, J et al. Nature 460(7256): 762–765 (2009)
12. Bromage, E et al. Mar Ecol Prog Ser. 376: 123–132 (2009)
13. Wong, SKF. Anal Biochem. 333: 265 (2004)
14. Punn, A et al. Mol Endocrinol 20: 3179-95 (2006)
15. Bond, D et al. Biol Proced Online 10: 20-28 (2008)
16. Xun, Z et al. Mol Cell Prot. 7: 1191-1203 (2008)
17. Jenkins, LM et al. Mol Cell Prot. 7: 716-727 (2008)
18. Kobayashi, DT et al. PLoS One 6: e24269 (2011)
19. Weldon, S et al. Poster presentation: Biomolecular Screening Symposium:Advanced Applications Across Academia, Government& Industry (2010)
20. Schutz-Geschwender, A. Drug Discovery & Development, January (2011)
21. Ambroz, KL et al. Proteomics 8(12): 2379-83 (2008)
22. Ambroz, KL. Protein Microarrays: Methods and Protocols, Methods Mol Biol. 785: 13-21 (2011)
23. Hall, DA et al. Mech Ageing Dev. 128(1): 161-7 (2007)
24. Loebke, C et al. Proteomics. 7(4): 558-64 (2007)
25. Ivanov, SS et al. Mol Cell Proteomics 3: 788-96 (2004)
26. Yeretssian, G et al. Mol Cell Proteomics. 4(5): 605-17 (2005)
27. Ghochikyan, A et al. J Bacteriol. 184(23): 6602-1 (2002)
28. Glanzer, JG et al. Bioorg Med Chem. 19: 2589-95 (2011)
29. Korf, U et al. Proteomics 8(21): 4603-12 (2008)
30. Sheehan, KM et al. Mol Cell Proteomics 4(4): 346-55 (2005)
31. Ambroz, K et al. Poster Presentation: Chips to Hits (2005)
32. Calvert, VA et al. Clinical Proteomics Journal, 1: 81 (2004)
33. Chen, H et al. Analytical Biochemistry 338: 136 (2005)
34. Wong, SKF. Anal Biochem. 333: 265 (2004)
35. Hoffman, GR et al. ASSAY and Drug Development Technologies 8(2): 186-199 (2010)
36. Hannoush, RN. PLoS One. 3(10): e3498 (2008)
37. Coevoets, R et al. Eur J Hum Genet. 17: 301-10 (2009)
38. Kumar, N et al. Mol Pharmacol 73: 1668–1678 (2008)
39. Aguilar, HN et al. PLoS ONE 5: e9965 (2010)
40. Selkirk, JV et al. J. Biomol. Screen. 11: 351 (2006)
41. Dickey, CA et al. Curr. Alzheimer Res. 2: 231 (2005)
42. Dickey, CA et al. FASEB J. 20: 753 (2006)
43. Arredondo, J et al. FASEB J. 20: 2093 (2006)
44. Counihan, NA et al. J. Virol. Methods 133: 62 (2006)
45. Vergote, D et al. Proc. Natl. Acad. Sci. USA 103: 19182 (2006)
46. Williams, JP et al. Mol Cell Biol. 26: 1170 (2006)
47. Smolen, GA et al. Proc. Natl. Acad. Sci. USA 103: 2316 (2006)
48. Godin-Heymann, N et al. Mol Cancer Ther. 7: 874 (2008)
49. Hirsch, A et al. J. Clin. Endocrinol. Metab. , 96: E65-72 (2011)
50. Chan, LF et al. Proc Natl Acad Sci USA 106: 6146 – 6151 (2009)
51. Chang, X et al. J Cell Science 121: 2814 (2008)
52. Egorina, EM et al. Journal of Thrombosis and Haemostasis, 4: 614–620 (2006)
53. Gonzalez-Gronow, M et al. Cancer Res 66: 23 (2006)
54. Shaik, SS et al. J Biol Chem. 284(9): 5945-55 (2009)
55. Zhang, S et al. Proc Natl Acad Sci USA. 105(11): 4156-61 (2008)
56. Berg, DT et al. J Biol Chem. 280(15): 14943-7 (2005)
57. Luo, S et al. Anal Biochem. 350(3): 233–8 (2006)
58. Harris, LR et al. J Proteome Res. 6(4): 1418-25 (2007)
59. Peng, X et al. Proceedings of SPIE 6097: 60970F (2006)
60. Peng, X et al. Anal Biochem. 388: 220-28 (2009)
61. Osterman, H. Whitepaper, LI-COR Biosciences (2009)
62. Johnson, CE et al. Cell Death and Differentiation 17: 170–179 (2010)
63. Schutz, AR et al. Poster presentation: American Society for Cell Biology Annual Meeting (2000)
64. Runnels, JM et al. Mol Imaging 5: 31 (2006)
65. Peng, X et al. Proceedings of SPIE 6097: 60970E (2006)
66. Osterman, H and A Schutz-Geschwender. Intl Pharm Indus. 3: 38-41 (2011)
18 Seeing Beyond the Visible with IRDye® Infrared Dyes
67. Keereweer, S et al. Mol Imaging Biol. 13: 199-207 (2010)
68. Nahimisa, T and J Tokai. Exp. Clin. Med. 7: 419 (1982)
69. Licha, K. Topics Curr. Chem. 222: 1 (2002)
70. Frangioni, JV. Curr. Opinion. Chem. Biol. 7: 626 (2003)
71. Hawryz, DJ and EM Sevick-Muraca. Neoplasia 2: 388 (2000)
72. Adams, KE et al. Journal of Biomedical Optics 12: 024017(2007)
73. Shah, K and R Weissleder. J. Amer. Soc. Exp. Neurother. 2: 215 (2005)
74. Kovar, JL et al. Anal. Biochem. 367: 1 (2007)
75. Kovar, JL et al. Am. J. Pathol. 169: 1415 (2006)
76. Gong, H et al. Neoplasia 12: 139 (2010)
77. Kovar, JL et al. Anal. Biochem. 384: 254 (2009)
78. Houston, JP et al. J. Biomed. Optics 10: 054010 (2005)
79. Gibbs-Strauss, SL et al. Acad Radiol. 17: 7-17 (2010)
80. Pogue, BW et al. J Biomed Opt. 15 030513 (2010)
81. Spiotto, MT et al. Cancer Res. 70: 78-88 (2010)
82. Zhou, H et al. PLoS One 4: e8051 (2009)
83. Aplin, AE et al. Pharmacol Rev 50: 197– 263 (1998)
84. Jin, H and J Varner. Br J Cancer. 90: 561-5 (2004)
85. Chen, K et al. Mol Imaging 8: 65-73 (2009)
86. Kovar, JL et al. Anal Biochem. 416(2): 167-73 (2011)
87. Snoeks, TJA et al. Bone 48: 106 (2011)
88. Ohnishi, S et al. Mol. Imaging 4: 172 (2005)
89. Billaud, M et al. Microcirculation 18(3): 163-71 (2011)
90. Kovar, J et al. Poster presentation: World Molecular Imaging Congress (2009)
4647 Superior Street | PO Box 4000 | Lincoln, Nebraska 68504 USA
LI-COR Biosciences North America: 800-645-4267 | 402-467-0700
Fax: 402-467-0819 | Technical Support: 800-645-4260
LI-COR GmbH (Serving Europe, Africa, and the Middle East) +49 (0) 6172 17 771
LI-COR UK Ltd. (Serving UK, Ireland, and Scandinavia) +44 (0) 1223 422104
In other countries, contact LI-COR Biosciences or a local LI-COR distributor: www.licor.com/distributors | www.licor.com/bio
LI-COR is an ISO 9001 registered company. ©2012 LI-COR, Inc. Specifications subject to change. LI-COR, In-Cell Western, Odyssey, IRDye, Pearl, BoneTag, and BrightSite are trademarks or registered trademarks of LI-COR, Inc. in the United States and other countries. CellVue and PSVue are registered trademarks of MTTI Research, Inc. All other trademarks belong to their respective owners. The Odyssey family of imagers, Pearl Impulse Imager, and IRDye Infrared Dye technologies are covered by U.S. patents, foreign equivalents, and other patents pending.
979-12879 3/12