Embed Size (px)
Citation preview

GEOIMAGE2121
GEOIMAGESpecialists in Satellite Imagery
and GeoSpatial Solutions
2121
Specialists in Satellite Imagery and GeoSpatial Solutions
See the World
as Never Before:
WorldView-2 Satellite
Imagery in 8 Bands
Improved
feature extraction
See the detail at 50cm
© DigitalGlobe 2010

A note from our CEO, Bob WalkerThe recent launch and operational deployment of the WorldView-2 satellite by DigitalGlobe has remote sensing experts around the world in a state of excitement. Not only does this advanced new satellite offer extremely high resolution imagery with 50cm pixels, but the 8 bands that it collects promise greater insight into classifying and mapping the world in which we live. Besides the visible colour imagery that allows us to create natural colour backdrops to maps, the new Coastal, Yellow, Red Edge and additional Near Infrared Band will improve our ability to analyse shallow water and coastal areas, as well as natural and built form features, in ways that we never have been able to do before.
Here at Geoimage, we are thrilled to be working on various test datasets from WorldView-2 to understand more about the possibilities that this new satellite can offer. Some of our recent analyses and results are presented in this flier as case studies, along with all the information that you will need to understand how imagery from WorldView-2 can benefit your organisation.
Geoimage has teamed with DigitalGlobe to jointly host the Australian version of the WorldView-2 Roadshow, touring Perth, Brisbane and Sydney in March and regional centres later. This informative seminar series will introduce you to this world-class satellite, help you understand how it works and what imagery it produces, and details how it can add value to your business, be it in the mining, engineering, environmental or planning sectors.
I hope you enjoy meeting our enthusiastic Geoimage staff and discussing how WorldView-2 imagery can help you make those important decisions.
Best wishes to you allBob
Overview of DigitalGlobe and GeoimageDigitalGlobe is a leading global provider of commercial, high resolution imagery products. With advanced collection sources, a comprehensive image library and a range of products and services, DigitalGlobe acquires imagery that enables clients to access and integrate imagery seamlessly into business operations and applications. DigitalGlobe offers the most comprehensive constellation with three very high resolution satellites: QuickBird, WorldView-1 and WorldView-2.
Geoimage is Australia’s foremost supplier of satellite imagery, image processing and geospatial services. We are an official reseller of DigitalGlobe products for clients based in Australia, New Zealand, Papua New Guinea and the Pacific Islands, and offers professional advice on the supply and application of satellite imagery and spatial datasets. Geoimage offers targeted solutions integrating, analysing, modelling and visualising spatial information.
DigitalGlobe Constellation of Satellites.Features QuickBird WorldView-1 WorldView-2
Launch Date 18 October 2001 18 September 2007 8 October 2009
No. of Bands Panchromatic: 1Multispectral: 4
Panchromatic: 1Multispectral: 0
Panchromatic: 1Multispectral: 8
Bands – Spectral Range Blue (450 - 520nm) Green (520 – 600nm)Red (630 – 690nm)Near InfraRed (760 – 900nm)Panchromatic (450-900nm)
Panchromatic (400-900nm) Coastal (400 - 450nm)Blue (450 - 510nm) Green (510 – 580nm)Yellow (585 – 625nm)Red (630 – 690nm)Red-Edge (705 – 745)Near InfraRed (770 – 895nm)Near InfraRed 2 (860 – 1040nm)Panchromatic (450-800nm)
Pixel Resolution Panchromatic:
Pansharpened Colour:
Multispectral:
0.6m
0.6m
2.4m
0.5m 0.5m (resampled from 0.46m)
0.5m (resampled from 0.46m)
2m (resampled from 1.84m)
Stereo Capability No Yes Yes
Raw Accuracy 23m (CE90) exclusive of terrain 6.5m (CE90) exclusive of terrain 6.5m (CE90) exclusive of terrain
Revisit Frequency at latitude 40o N
4.1 days 3.8 days 2.7 days
Swathe Width 16.5 km at nadir 17.6 km at nadir 16.4 km at nadir
Radiometric 11bit 11bit 11bit
Minimum Area Library (Archive): New Tasking: 25 sqkm
79 sqkm25 sqkm79 sqkm
25 sqkm79 sqkm
Cloud cover <15% <15% <15%
Max Viewing Angle +/- 45 degrees off nadir +/- 45 degrees off nadir +/- 45 degrees off nadir
Orbit Altitude 450 km 496 km 770 km
Orbit Type Sun synchronous Sun synchronous Sun synchronous
Overpass Time 10:30am 10:30am 10:30am

WORLDVIEW-2
The pan band on WV-2 has a much narrower band pass than on QuickBird or WV-1 and includes less of the infrared. The top image is WV-1 pan collected 31 May 2008 at 23 deg off-nadir and the bottom image is WV-2 pan collected 05 January 2010 at near nadir collection. The WV-2 pan shows better discrimination of vegetated and non-vegetated areas and often better differentiation of vegetation type. © DigitalGlobe 2010.
On October 8th, 2009, witnessed by some of the Geoimage team and our two competition winners, WorldView-2 was successfully launched from Vandenberg Air Force Base California and was declared fully operational on January 6, 2010. The new sensor is capable of collecting up to 975 000 sq km of imagery per day and will effectively double the DigitalGlobe collection capacity. The WorldView-2 system offers unsurpassed accuracy, agility, capacity and spectral diversity and will allow DigitalGlobe to substantially expand its imagery product offerings within Australia.
Collection CapabilitiesThe high collection capacity of WV2 is due to a combination of factors including-1. the 16.4km wide imaging swath,2. bi-directional scanning,3. rapid retargeting using Control
Moment Gyros , which give a slew time of 9 seconds for a shift of 300 km on the ground, compared to a slew time of 62 seconds for the control wheels on QuickBird,
4. on-board storage of 2,199 Gb,5. use of the ground reception station
based at Troll, Antartica,6. the high altitude of the satellite at
770 km, which enables more frequent revisits at angles closer to nadir producing higher resolution images.
Geolocational AccuracyThe geolocational accuracy of the imagery without ground control is published as 6.5 m CE90 excluding terrain and off-nadir effects. Operational results from WorldView-1 give typical performance in the range 4.0 to 5.5 m CE90 at nadir and early examples of Worldview-2 imagery examined by Geoimage over south-east Queensland show locational errors of less than two metres. This allows the creation of accurate maps in remote locations without the need for ground control.
Spectral BandsMuch of the excitement surrounding WV-2 centers on the four extra spectral bands on the sensor over and above the four traditional multispectral bands. Although some of the new individual bands have specific applications, probably the greatest use will be in the separation of land cover in high resolution images, for example, vegetation, buildings, bare soil, water and shadow; the potential to generate derived algorithms or functions from new band combinations for feature extraction and the improved classification that will result.
The eight spectal bands on WV2 are:Coastal band(400-450nm): This band supports vegetation identification and analysis, and supports bathymetric studies based upon its chlorophyll and water penetration characteristics. Also, this band is subject to atmospheric scattering and can be used to investigate atmospheric correction techniques.Blue band(450-510nm):Blue is designed for water body penetration, making it useful for coastal water mapping. Also, useful for soil/vegetation discrimination, forest type mapping and cultural feature identification.Green band(510-580nm):Green is useful for measuring green reflectance of vegetation. It can also be used for cultural feature identification and offers great potential for bathymetric mapping.Yellow band(585-625nm):Used to identify “yellow-ness” characteristics of targets and important for vegetation applications. This band will assist in the development of “true-color” hue correction for human vision representation and has been seen to offer improved discrimination
in marine and terrestrial vegetation mapping and some mineral.Red band(630-690nm):Red is sensitive to chlorophyll absorption region. It is useful for vegetation analysis and can even be used to differentiate some plant types. It is also useful for cultural feature identification.Red Edge band(705-745nm):Aids in the analysis of vegetative condition. Directly related to plant health revealed through chlorophyll production.Near infrared(NIR1)(770-895nm):This band is useful for determining vegetation types, vigour and biomass survey, delineating water bodies, and for soil moisture discrimination.Near infrared(NIR2)(860-1040nm):This band overlaps the NIR 1 band but is less affected by atmospheric influence. It supports vegetation analysis and biomass studies.
Application areas where the new combination of bands are expected to be of particular relevance are:1. the Coastal-blue bands for bathymetry, benthic mapping, coastal wetlands mapping
and for modelling of the atmosphere,2. the red-Red Edge-NIR1 band to better identify plant health and age.3. Yellow band in conjunction with the Red Edge band for precision agricultural
applications, and4. the Yellow, red and Red Edge bands to potentially map iron oxide mineralogy.
Standard collection scenarious for WorldView-2
Comparison of the pan and multispectral bands on Quickbird, WorldView-1 and Worldview-2.
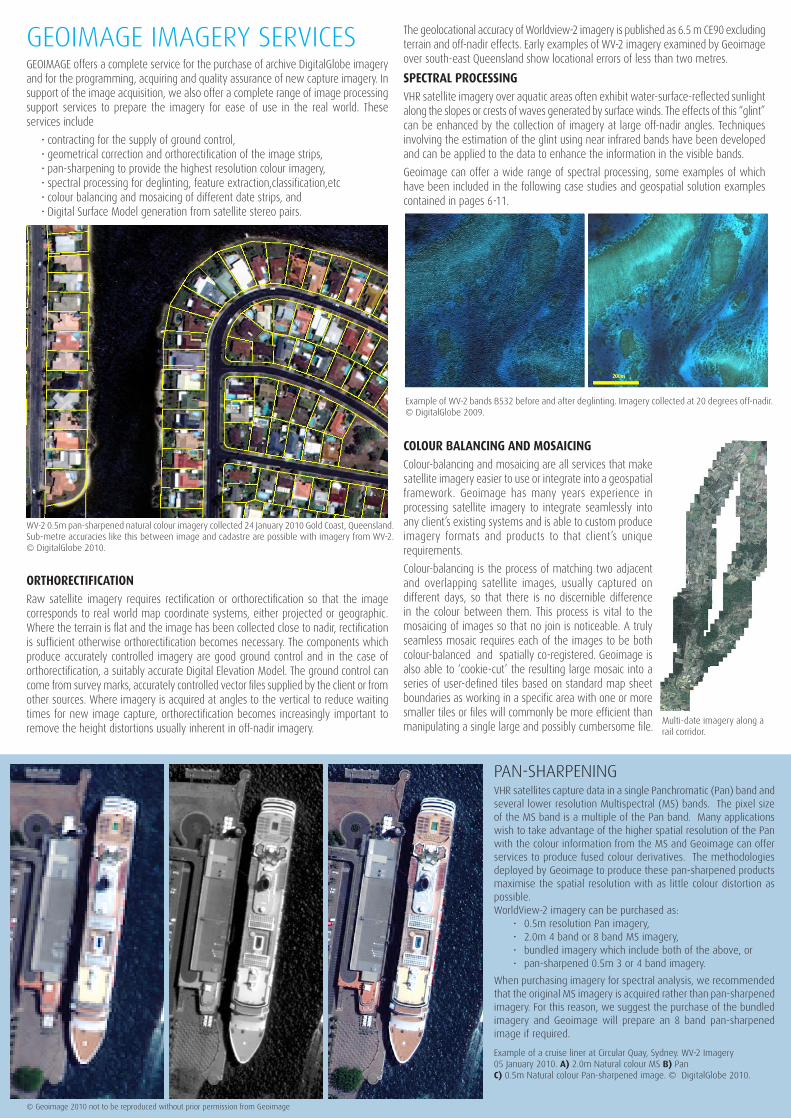
PAN-SHARPENINGVHR satellites capture data in a single Panchromatic (Pan) band and several lower resolution Multispectral (MS) bands. The pixel size of the MS band is a multiple of the Pan band. Many applications wish to take advantage of the higher spatial resolution of the Pan with the colour information from the MS and Geoimage can offer services to produce fused colour derivatives. The methodologies deployed by Geoimage to produce these pan-sharpened products maximise the spatial resolution with as little colour distortion as possible.WorldView-2 imagery can be purchased as:
• 0.5m resolution Pan imagery, • 2.0m 4 band or 8 band MS imagery, • bundled imagery which include both of the above, or • pan-sharpened 0.5m 3 or 4 band imagery.
When purchasing imagery for spectral analysis, we recommended that the original MS imagery is acquired rather than pan-sharpened imagery. For this reason, we suggest the purchase of the bundled imagery and Geoimage will prepare an 8 band pan-sharpened image if required.
Example of a cruise liner at Circular Quay, Sydney. WV-2 Imagery 05 January 2010. A) 2.0m Natural colour MS B) Pan C) 0.5m Natural colour Pan-sharpened image. © DigitalGlobe 2010.
WV-2 0.5m pan-sharpened natural colour imagery collected 24 January 2010 Gold Coast, Queensland. Sub-metre accuracies like this between image and cadastre are possible with imagery from WV-2. © DigitalGlobe 2010.
Multi-date imagery along a rail corridor.
GEOIMAGE IMAGERY SERVICESGEOIMAGE offers a complete service for the purchase of archive DigitalGlobe imagery and for the programming, acquiring and quality assurance of new capture imagery. In support of the image acquisition, we also offer a complete range of image processing support services to prepare the imagery for ease of use in the real world. These services include
• contracting for the supply of ground control,• geometrical correction and orthorectification of the image strips,• pan-sharpening to provide the highest resolution colour imagery,• spectral processing for deglinting, feature extraction,classification,etc• colour balancing and mosaicing of different date strips, and• Digital Surface Model generation from satellite stereo pairs.
ORTHORECTIFICATIONRaw satellite imagery requires rectification or orthorectification so that the image corresponds to real world map coordinate systems, either projected or geographic. Where the terrain is flat and the image has been collected close to nadir, rectification is sufficient otherwise orthorectification becomes necessary. The components which produce accurately controlled imagery are good ground control and in the case of orthorectification, a suitably accurate Digital Elevation Model. The ground control can come from survey marks, accurately controlled vector files supplied by the client or from other sources. Where imagery is acquired at angles to the vertical to reduce waiting times for new image capture, orthorectification becomes increasingly important to remove the height distortions usually inherent in off-nadir imagery.
The geolocational accuracy of Worldview-2 imagery is published as 6.5 m CE90 excluding terrain and off-nadir effects. Early examples of WV-2 imagery examined by Geoimage over south-east Queensland show locational errors of less than two metres.
SPECTRAL PROCESSINGVHR satellite imagery over aquatic areas often exhibit water-surface-reflected sunlight along the slopes or crests of waves generated by surface winds. The effects of this “glint” can be enhanced by the collection of imagery at large off-nadir angles. Techniques involving the estimation of the glint using near infrared bands have been developed and can be applied to the data to enhance the information in the visible bands.
Geoimage can offer a wide range of spectral processing, some examples of which have been included in the following case studies and geospatial solution examples contained in pages 6-11.
COLOUR BALANCING AND MOSAICINGColour-balancing and mosaicing are all services that make satellite imagery easier to use or integrate into a geospatial framework. Geoimage has many years experience in processing satellite imagery to integrate seamlessly into any client’s existing systems and is able to custom produce imagery formats and products to that client’s unique requirements.
Colour-balancing is the process of matching two adjacent and overlapping satellite images, usually captured on different days, so that there is no discernible difference in the colour between them. This process is vital to the mosaicing of images so that no join is noticeable. A truly seamless mosaic requires each of the images to be both colour-balanced and spatially co-registered. Geoimage is also able to ‘cookie-cut’ the resulting large mosaic into a series of user-defined tiles based on standard map sheet boundaries as working in a specific area with one or more smaller tiles or files will commonly be more efficient than manipulating a single large and possibly cumbersome file.
Example of WV-2 bands B532 before and after deglinting. Imagery collected at 20 degrees off-nadir. © DigitalGlobe 2009.
© Geoimage 2010 not to be reproduced without prior permission from Geoimage
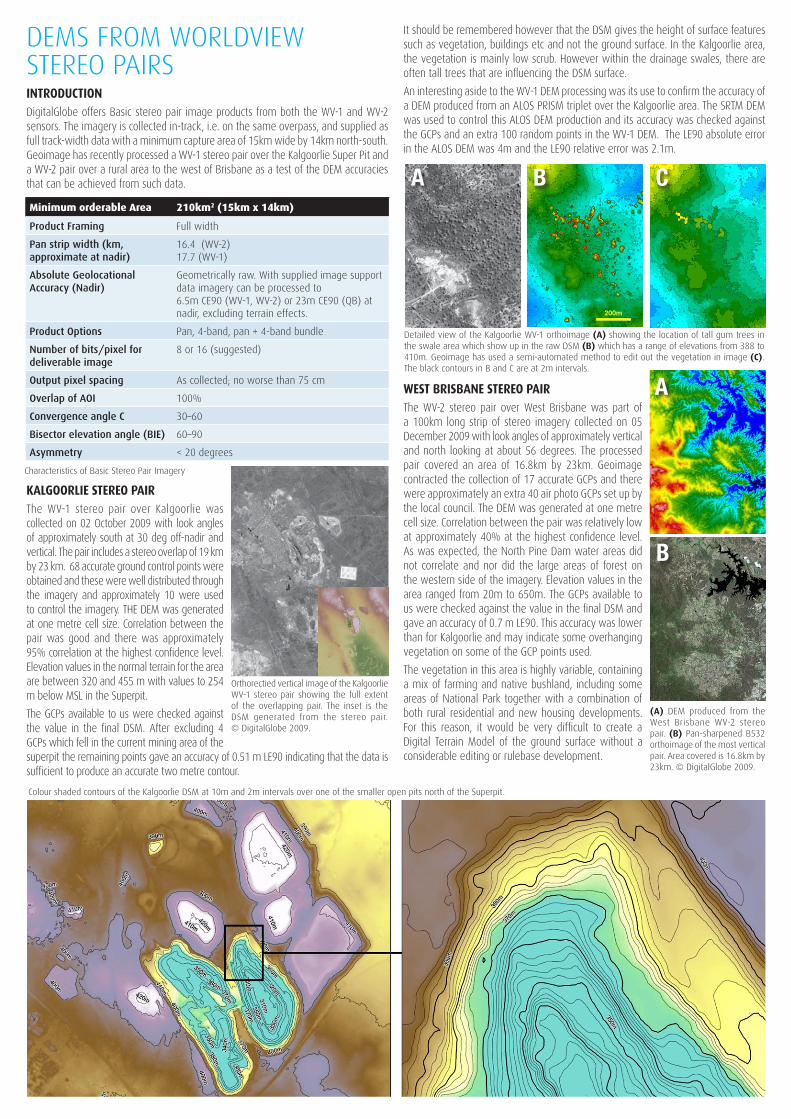
DEMS FROM WORLDVIEW STEREO PAIRSINTRODUCTIONDigitalGlobe offers Basic stereo pair image products from both the WV-1 and WV-2 sensors. The imagery is collected in-track, i.e. on the same overpass, and supplied as full track-width data with a minimum capture area of 15km wide by 14km north-south. Geoimage has recently processed a WV-1 stereo pair over the Kalgoorlie Super Pit and a WV-2 pair over a rural area to the west of Brisbane as a test of the DEM accuracies that can be achieved from such data.
KALGOORLIE STEREO PAIRThe WV-1 stereo pair over Kalgoorlie was collected on 02 October 2009 with look angles of approximately south at 30 deg off-nadir and vertical. The pair includes a stereo overlap of 19 km by 23 km. 68 accurate ground control points were obtained and these were well distributed through the imagery and approximately 10 were used to control the imagery. THE DEM was generated at one metre cell size. Correlation between the pair was good and there was approximately 95% correlation at the highest confidence level. Elevation values in the normal terrain for the area are between 320 and 455 m with values to 254 m below MSL in the Superpit.
The GCPs available to us were checked against the value in the final DSM. After excluding 4 GCPs which fell in the current mining area of the superpit the remaining points gave an accuracy of 0.51 m LE90 indicating that the data is sufficient to produce an accurate two metre contour.
It should be remembered however that the DSM gives the height of surface features such as vegetation, buildings etc and not the ground surface. In the Kalgoorlie area, the vegetation is mainly low scrub. However within the drainage swales, there are often tall trees that are influencing the DSM surface.
An interesting aside to the WV-1 DEM processing was its use to confirm the accuracy of a DEM produced from an ALOS PRISM triplet over the Kalgoorlie area. The SRTM DEM was used to control this ALOS DEM production and its accuracy was checked against the GCPs and an extra 100 random points in the WV-1 DEM. The LE90 absolute error in the ALOS DEM was 4m and the LE90 relative error was 2.1m.
WEST BRISBANE STEREO PAIRThe WV-2 stereo pair over West Brisbane was part of a 100km long strip of stereo imagery collected on 05 December 2009 with look angles of approximately vertical and north looking at about 56 degrees. The processed pair covered an area of 16.8km by 23km. Geoimage contracted the collection of 17 accurate GCPs and there were approximately an extra 40 air photo GCPs set up by the local council. The DEM was generated at one metre cell size. Correlation between the pair was relatively low at approximately 40% at the highest confidence level. As was expected, the North Pine Dam water areas did not correlate and nor did the large areas of forest on the western side of the imagery. Elevation values in the area ranged from 20m to 650m. The GCPs available to us were checked against the value in the final DSM and gave an accuracy of 0.7 m LE90. This accuracy was lower than for Kalgoorlie and may indicate some overhanging vegetation on some of the GCP points used.
The vegetation in this area is highly variable, containing a mix of farming and native bushland, including some areas of National Park together with a combination of both rural residential and new housing developments. For this reason, it would be very difficult to create a Digital Terrain Model of the ground surface without a considerable editing or rulebase development.
Minimum orderable Area 210km2 (15km x 14km)
Product Framing Full width
Pan strip width (km, approximate at nadir)
16.4 (WV-2)17.7 (WV-1)
Absolute Geolocational Accuracy (Nadir)
Geometrically raw. With supplied image support data imagery can be processed to6.5m CE90 (WV-1, WV-2) or 23m CE90 (QB) at nadir, excluding terrain effects.
Product Options Pan, 4-band, pan + 4-band bundle
Number of bits/pixel fordeliverable image
8 or 16 (suggested)
Output pixel spacing As collected; no worse than 75 cm
Overlap of AOI 100%
Convergence angle C 30–60
Bisector elevation angle (BIE) 60–90
Asymmetry < 20 degrees
A
A
B
B
C
Characteristics of Basic Stereo Pair Imagery
Orthorectied vertical image of the Kalgoorlie WV-1 stereo pair showing the full extent of the overlapping pair. The inset is the DSM generated from the stereo pair. © DigitalGlobe 2009.
(A) DEM produced from the West Brisbane WV-2 stereo pair. (B) Pan-sharpened B532 orthoimage of the most vertical pair. Area covered is 16.8km by 23km. © DigitalGlobe 2009.
Colour shaded contours of the Kalgoorlie DSM at 10m and 2m intervals over one of the smaller open pits north of the Superpit.
Detailed view of the Kalgoorlie WV-1 orthoimage (A) showing the location of tall gum trees in the swale area which show up in the raw DSM (B) which has a range of elevations from 388 to 410m. Geoimage has used a semi-automated method to edit out the vegetation in image (C). The black contours in B and C are at 2m intervals.

GEOIMAGE GEOSPATIAL SOLUTIONSGeoimage offers a comprehensive range of services that support the integration of spatial data into business. Our team has extensive knowledge of the application of advanced spectral processing to extract information to integrate into other spatially-enabled systems. We at Geoimage have been working with a wide range of imagery products since the 1980s and attest to the potential being offered by the latest very high resolution satellite, WV-2. The improved spatial and spectral resolutions offer potential for feature extraction and classification that has not been seen before from a commercial satellite and in this era of increasing reliance on evidence derived from spatial sources, the application potential of WV-2 imagery is extensive. In saying that, we are acutely aware of the limitations associated with remotely sensed imagery and can offer support and guidance in the selection and adoption of imagery, procedures for the validation of results and reporting on accuracies obtained and how best to integrate geospatial solutions into your business.
Advanced spectral processing for feature extractionWith 8 spectral bands, WV-2 provides an extended range of options for the generation of derived products. A wide range of features can be extracted using the traditional four spectral bands, but the addition of the Coastal, Yellow, Red Edge, and shorter wave Near Infrared bands provide a wider range of potential derivatives that can assist in detecting subtle variations in land cover, moisture content, mineralogy, coastal features and vegetation types. Geoimage has been working with sample imagery from the Chowilla region in South Australia, within the Murray-Darling Basin, to assess the potential of WV-2 in discriminating features. Several derivatives and indices have proven to identify
variability in vegetation canopy, in the health of cropping, in water/soil separability, identification of infrastructure and in the discrimination of vegetation communities.
Although our testing is in initial phases, the potential for feature extraction of this exciting new dataset appears to be great.
Geoimage are well placed to offer classification services to industry. We have both traditional, pixel-based capability as well as Object Based Image Analysis (OBIA) tools. The team at Geoimage includes members of the remote sensing community who were instrumental in bringing OBIA to the commercial geospatial services market in Australia and we are well versed in adopting methodologies that include imagery, such as WV-2 imagery, combined with other spatial thematic datasets including LiDAR. Following is a brief outline of just some of the potential areas of application, but Geoimage is happy to discuss your specific needs with you.
Environmental Performance ReportingEvidence-based reporting is now required by most levels of government. To support this level of scrutiny, industry is dependent increasingly on the adoption of innovative practices to demonstrate environmental performance. Geoimage has been involved in the adoption of satellite imagery to support evidence of clearance or rehabilitation of land, particularly to demonstrate the presence, absence or management of woody vegetation and grassland. Whether adopted as part of a mine rehabilitation framework or to assist landholders in the management of the assessable vegetation on properties, very high resolution satellite imagery can provide a baseline scenario of current and past land cover at a site level. Within Queensland, the clearing of native vegetation is regulated by the vegetation management framework and includes the Vegetation Management Act 1999 (VMA) and the Integrated Planning Act 1997 (IPA). Property-scale maps that show the location, boundary and status of vegetation are used to determine the location of vegetation assessable under the VMA.
Scientists working with satellite imagery have typically needed to balance spectral resolution, spatial resolution and project scale to determine the most appropriate image source. WV-2 imagery provides both sub-metre spatial accuracy, with appropriate ground control, to assist in mapping the location and boundary of vegetation, coupled with improved spectral discrimination potential to map the status of vegetation communities in more detail, based on vegetation structure, composition, condition and rigour. The near-infra red bands coupled with the Red Edge and Yellow bands have been seen to contribute to vegetation mapping, in the form of derivatives, indices and through the adoption of Principal Component Analysis (PCA) transformations, with the 8 band combination offering broader discrimination than previously seen with other very high resolution sensors. We believe that the adoption of WV-2 imagery to support change detection, mapping of rehabilitation or assessable vegetation will offer clients a more robust, repeatable and defensible solution when reporting to government, to stakeholders or to shareholders.
Presentation of up-to-date image maps, clearly showing the area proposed for clearing is essential for reporting to government in the approval process. Investment in mapping can then be reused to assist in instructing field operators once approval has been granted and for ongoing environmental management requirements.
Bands 532 to RGB True Colour compositeThis traditional representation of WV-2 imagery demonstrates how dry the managed lands around this property, as contrasted to the native vegetation along the river. WV-2 imagery enables discrimination of horticulture from other intensive cropping based on row spacing
Bands 753 to RGB False Colour Composite clearly identifies healthy vegetationThe use of the near infrared channel to highlight vegetation assists in the interpretation of land cover. The horticulture activity surrounding the property is clearly identified and the stages of growth, either representing age of planting or condition can be quantified.
Vegetation Index using NIR1 and red bandsA standard NDVI highlights variation in plant vigour in both the natural and managed vegetation around the property.
Red Edge and NIR1 derivativeSubtle differences in soil moisture, salinisation and vegetation stubble may be more clearly visible using the Red Edge band with Near Infrared.
This pseudo coloured image highlights non vegetated areas, within the water channel and in terrestrial areas and clearly demonstrates the variability in vegetation health between the native riparian vegetation and within the irrigated horticultural paddocks
This pseudo-coloured derivative highlights the variability within the non-vegetated regions, possibly discriminating differences in water quality, soil moisture and micro-soil conditions, exposed tracks alongside the river are clearly distinguished. Variability within the saline exposed ground is more evident
The incorporation of the Red Edge offers more sensitivity to some of the exposed lands adjacent to the river channel, potentially reflecting differences in soil salinisation. Both the near infra red and Red Edge bands appear to offer improved discrimination of both native and managed vegetation cover.
© Geoimage 2010 not to be reproduced without prior permission from Geoimage

Natural Resource Management
Vegetation habitat value and risk assessmentSatellite imagery, particularly the spectral characteristics of the imagery, has been used to map land cover, land use, vegetation extent and vegetation communities. How this information is used tends to relate back to the specific planning controls or measures relating to biodiversity, bushfire and flood hazard risk and climate change risk assessments. Recent developments have extended the use of vegetation presence to incorporate an assessment of how valuable that vegetation is to particular fauna species, for example koalas. Geoimage offers clients a range of options for the generation of derived datasets based purely on the image source or based on integration with other spatially-referenced data sources. In many instances, satellite imagery forms part of the solution but its true value becomes apparent when it is combined with other field-based or data-based reference material. The concept of value or risk needs to be supported through the adoption of rugged and robust rules, typically developed by discipline experts and endorsed through peer-review.
WV-2 offers the potential to refine bushfire risk assessments, through improved vegetation mapping based on the spectral characteristics of the imagery and through the development of Digital Surface Model derivatives for slope and aspect from this stereo capable imagery. Geoimage has experience in integrating data, particularly WV-2 imagery, into natural resource management decision support systems to improve outcomes for our clients.
Viticulture, horticulture and agricultural mapping and management practicesThe spatial and spectral resolutions of WV-2 imagery are well suited to assisting viticulture, horticultural and agricultural mapping and management practices. Satellite imagery can complement traditional aerial photography through the interrogation of the spectral bands that demonstrate variability in crop production. Throughout Australia and New Zealand, significant investment has been made in the lucrative wine industry, with Australia being the 4th largest wine exporter in the world. Industry bodies encourage the adoption of scientific rigour and innovation to improve performance of its growers1. Very high resolution satellite imagery, with a spatial accuracy of less than 1m, is considered to be suitable for the identification of vineyards as distinct
from other market garden or horticulture practices, due to the spacing of the rows2. Imagery has often been used as a backdrop for farm management plans, but with the new spectral bands, an improved understanding of current farm management practices can be considered. WV-2 imagery, with the additional Yellow, Red Edge and Near Infrared bands, coupled with the slightly narrower spectral bandwidths of the traditional four bands offers discrimination of subtle productivity related features at the intra-vineyard or farm-paddock scale. Geoimage can generate derived datasets, such as NDVI, Red Edge/NIR derivatives, modified Soil Adjusted Indices, multi-band PCA that identify variability in crop productivity potentially related management practices such as watering and fertilizer regimes and to natural variations in soils, micro-climate and micro-relief. Initial results indicate that Red Edge band may be more sensitive to younger or smaller vegetation thus providing input at the earlier critical phases in production. Outcomes from these derived datasets can be captured for integration into a property management plan, used to directly influence management regimes or to offer suggestions to inform mitigation practices, such as location of drainage.1 AWRI Seven Year Research, Development and Extension Plan.2 Phylloxera Board of South Australia report reference.
This Natural Colour Composite of Myrtleford Victoria, using bands 532 to RGB generates a clear, natural looking image, presenting the native vegetation to the south east and plantations in the west of the image contrasted against the intensive land management along the waterway.
Principal Components Analysis was undertaken on bands 3-8, removing the shorter wavelengths traditionally containing less vegetation significant information. This composite displays PC132 to RGB, clearly highlighting the cropping in red, the viticulture in orange and less vigorous vegetation as green-cyan.
Another commonly used indices for assessing the health of vegetation is the Normalised Difference Vegetation Index. With WV-2, vegetation indices can be generated using either near infra red bands together with red or the Red Edge, depending on the specific targets to be identified.
WV-2 Images. © DigitalGlobe 2009.
A. Natural Colour WV_2 image over Western Brisbane (Bands 532 to RGB). Areas of natural and managed vegetation are clearly defined on the imagery. Current State vegetation mapping identifies non remnant and remnant vegetation but at 1:100k scale. Imagery fills in the gaps.
B. Digital Surface Model over same project extent derived from stereo WV-2 imagery. High quality surface model provides improved sensitivity in elevation and landform, which is used to improve associated slope and aspect models, essential to the mapping of bushfire risk.
C. Slope classes in percent rise derived from Digital Surface Model. Slopes are grouped according to QLD State Planning Policy 1/03: Mitigating the adverse impacts of flood, bushfire and landslide. Slopes impact the speed intensity and direction of fires.
D. Aspect classes in cardinals derived from Digital Surface Model. Aspect categories are grouped according to QLD State Planning Policy 1/03. Aspect influences the dryness of vegetated fuel and exposure to low humidity winds which impact fire intensity.
E. Vegetation classes derived from classifying the imagery, grouped into fire behaviour clumps. Different vegetation communities accumulate dry fuel and different rates and influence their associated fire behaviour and hazard scores. Accurate vegetation mapping is critical to mapping fire hazards.
F. Fire Hazard Map. Bushfire hazard severity is a combination of vegetation community hazard score, slope hazard scope and aspect hazard score. These values are summed and rated into severity zones.
A
D
B
E
C
F

BUILT FORMInfrastructure Planning, Urban Planning and Visual Impact AssessmentEarly phases in the planning of major infrastructure or the remodelling of existing built form rely on the availability of current spatially-referenced data to inform decision makers of design options. At the pre-feasibility, feasibility or Pre-Front End Engineering Design (Pre-FEED) phases, concepts are often being discussed with options testing being undertaken by a wide range of disciplines, including those sensitive to constructability, planning, environmental and social impacts and of course the cost of construction or remodelling. Typically, detailed design requires imagery and terrain data to be at the highest resolution possible over the exact extent of the project, to enable engineering from that data. Prior to locking in the design, innovative solutions require more freedom around the potential design options and can benefit from a VHR satellite source rather than a more expensive aerial solution.
At these earlier phases, both imagery and terrain or digital surfaces can be at a broader scale to enable more extensive coverage to accommodate variability in design concepts and visualization of the infrastructure within a broader context. WV-2 imagery provides 0.5m panchromatic and pan-sharpened imagery ideally suited to options testing including constraints mapping, capturing of existing infrastructure and sensitive receptors, discrimination of zones of environmental sensitivity and assisting with the ecological assessment phases of the project, greatly assisted by the 8-band spectral capability of this sensor. The mapping of vegetation extents, for example, can alleviate the need for timely environmental approvals if State government accepts certified amendments based on current vegetation extents.
The improved acquisition cycle offered by DigitalGlobe enables rapid repeat coverage of events within a few days of each other, through the greater agility of the sensor and higher capacity/faster revisit capability. WV-2 can acquire imagery in stereo mode, to generate Digital Surface Models (DSMs) that are within 1m vertical accuracy. This flexibility suggests WV-2 solution has the potential to greatly assist infrastructure and urban planning projects.
Geoimage has seen how a multi-tiered approach to data acquisition within an infrastructure planning framework can take advantage of both very high resolution satellite imagery and derived surface models prior to locking in the exact design, site or route of the infrastructure. This approach potentially reduces upfront data costs, offering a solution that requires collection of high resolution aerial data only when the design has been formalised. This inherently provides more flexibility around concept design options and generates a comprehensive baseline record of environmental features within the project extent. Furthermore, the ability to cost-effectively capture imagery over the broader project region before, during and after construction will facilitate reporting of both project-specific impacts and cumulative impacts from multiple projects within the same region and enable visual impact assessment through 3D and real-time model development over the proposed project region.
Impervious surface and built form mappingTraditionally, both local governments and State Government maintain spatial representations of surveyed parcels, the digital cadastre. Within the spatial dataset, additional information about the property is stored, as a series of attributes relating to land ownership, title and tenure. This valuable data source does not record the amount of land that is developed on any given parcel and often this is important in terms of understanding the amount of storm water runoff generated in normal and extreme events and the associated infrastructure required to mitigate the threat of flooding and to reduce the amount of dirty water entering our natural and manmade waterways. Very high resolution imagery such as WV-2 provides an ideal baseline to capture the nature and extent of impervious surfaces within a given parcel. This
information can be used to improve the understanding of hydrological processes, in monitoring and mitigating climate change strategies and in the comprehension of built form characterizations and planning strategies. Geoimage has worked with very high resolution imagery, together with digital terrain or without, to map the extent of impervious surfaces.
At a local government and social level, there is a significant problem in Australia with backyard drowning. The management of installations and adoption of child safe fencing is compounded by the lack of accurate databases identifying which properties have pools.
Identifying swimming pools on natural colour photography is challenging due to the diversity in pool material, shape or design, water colour and position in land parcel. The spatial and spectral characteristics of WV-2 imagery can assist with improved feature discrimination within the urban context. OBIA approaches can also consider shape, size and neighbouring objects in offering a pool identification methodology that incurs less manual classification. Obviously, overhanging vegetation and obstruction from adjacent buildings and shadows will still cause issues, but together with other datasets, WV-2 has the potential to make a difference to this continual concern and linked within a GIS framework, the selected householders can be targeted specifically.
A
D
B
C
(A) Greyscale Pan image over study area with cadastral boundaries
(B) Digital Surface Model generated from WV-2 imagery, with system generated contours, drainage and stormwater network
(C) Classification of impervious surfaces
(D) Rating of properties based on connection to stormwater and proportion of parcel currently covered by impervious surfaces. This measure of Effective Impervious Surface is directly correlated to natural and manmade waterway health.
© Geoimage 2010 not to be reproduced without prior permission from Geoimage
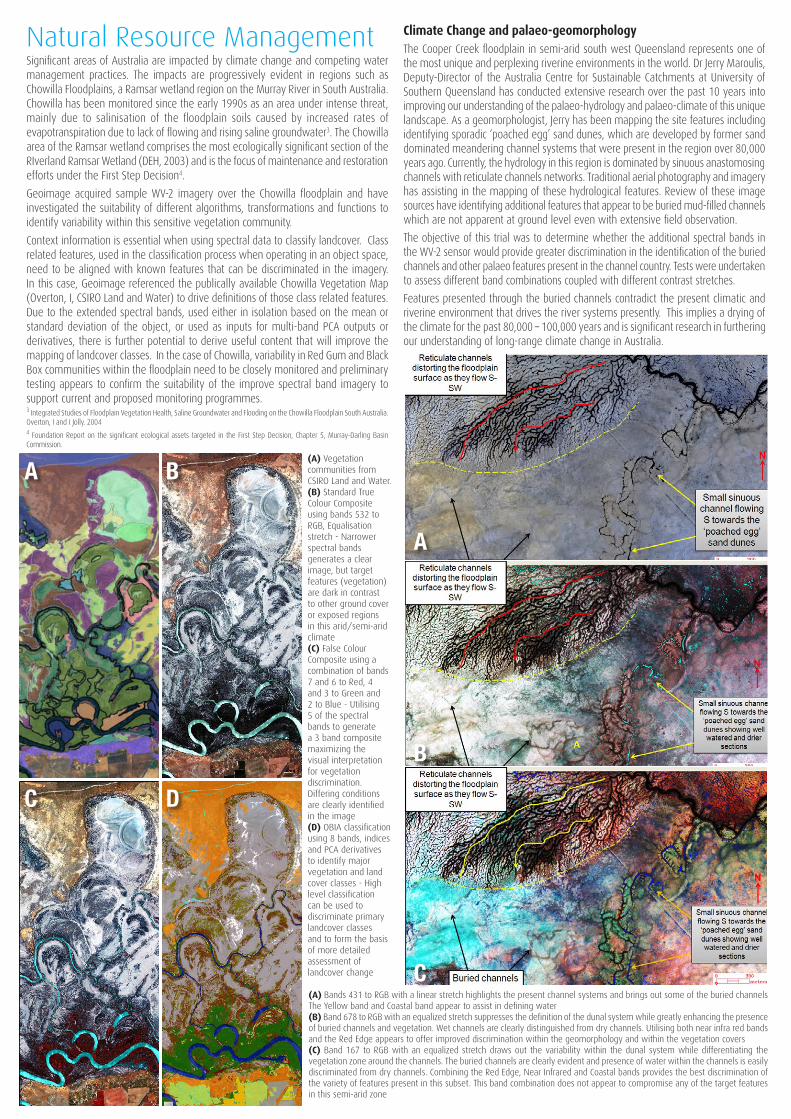
(A) Vegetation communities from CSIRO Land and Water.(B) Standard True Colour Composite using bands 532 to RGB, Equalisation stretch - Narrower spectral bands generates a clear image, but target features (vegetation) are dark in contrast to other ground cover or exposed regions in this arid/semi-arid climate(C) False Colour Composite using a combination of bands 7 and 6 to Red, 4 and 3 to Green and 2 to Blue - Utilising 5 of the spectral bands to generate a 3 band composite maximizing the visual interpretation for vegetation discrimination. Differing conditions are clearly identified in the image(D) OBIA classification using 8 bands, indices and PCA derivatives to identify major vegetation and land cover classes - High level classification can be used to discriminate primary landcover classes and to form the basis of more detailed assessment of landcover change
(A) Bands 431 to RGB with a linear stretch highlights the present channel systems and brings out some of the buried channels The Yellow band and Coastal band appear to assist in defining water(B) Band 678 to RGB with an equalized stretch suppresses the definition of the dunal system while greatly enhancing the presence of buried channels and vegetation. Wet channels are clearly distinguished from dry channels. Utilising both near infra red bands and the Red Edge appears to offer improved discrimination within the geomorphology and within the vegetation covers(C) Band 167 to RGB with an equalized stretch draws out the variability within the dunal system while differentiating the vegetation zone around the channels. The buried channels are clearly evident and presence of water within the channels is easily discriminated from dry channels. Combining the Red Edge, Near Infrared and Coastal bands provides the best discrimination of the variety of features present in this subset. This band combination does not appear to compromise any of the target features in this semi-arid zone
A
B
C
D
BA
C
Natural Resource ManagementSignificant areas of Australia are impacted by climate change and competing water management practices. The impacts are progressively evident in regions such as Chowilla Floodplains, a Ramsar wetland region on the Murray River in South Australia. Chowilla has been monitored since the early 1990s as an area under intense threat, mainly due to salinisation of the floodplain soils caused by increased rates of evapotranspiration due to lack of flowing and rising saline groundwater3. The Chowilla area of the Ramsar wetland comprises the most ecologically significant section of the RIverland Ramsar Wetland (DEH, 2003) and is the focus of maintenance and restoration efforts under the First Step Decision4.
Geoimage acquired sample WV-2 imagery over the Chowilla floodplain and have investigated the suitability of different algorithms, transformations and functions to identify variability within this sensitive vegetation community.
Context information is essential when using spectral data to classify landcover. Class related features, used in the classification process when operating in an object space, need to be aligned with known features that can be discriminated in the imagery. In this case, Geoimage referenced the publically available Chowilla Vegetation Map (Overton, I, CSIRO Land and Water) to drive definitions of those class related features. Due to the extended spectral bands, used either in isolation based on the mean or standard deviation of the object, or used as inputs for multi-band PCA outputs or derivatives, there is further potential to derive useful content that will improve the mapping of landcover classes. In the case of Chowilla, variability in Red Gum and Black Box communities within the floodplain need to be closely monitored and preliminary testing appears to confirm the suitability of the improve spectral band imagery to support current and proposed monitoring programmes.3 Integrated Studies of Floodplain Vegetation Health, Saline Groundwater and Flooding on the Chowilla Floodplain South Australia. Overton, I and I Jolly. 20044 Foundation Report on the significant ecological assets targeted in the First Step Decision, Chapter 5, Murray-Darling Basin Commission.
Climate Change and palaeo-geomorphologyThe Cooper Creek floodplain in semi-arid south west Queensland represents one of the most unique and perplexing riverine environments in the world. Dr Jerry Maroulis, Deputy-Director of the Australia Centre for Sustainable Catchments at University of Southern Queensland has conducted extensive research over the past 10 years into improving our understanding of the palaeo-hydrology and palaeo-climate of this unique landscape. As a geomorphologist, Jerry has been mapping the site features including identifying sporadic ‘poached egg’ sand dunes, which are developed by former sand dominated meandering channel systems that were present in the region over 80,000 years ago. Currently, the hydrology in this region is dominated by sinuous anastomosing channels with reticulate channels networks. Traditional aerial photography and imagery has assisting in the mapping of these hydrological features. Review of these image sources have identifying additional features that appear to be buried mud-filled channels which are not apparent at ground level even with extensive field observation.
The objective of this trial was to determine whether the additional spectral bands in the WV-2 sensor would provide greater discrimination in the identification of the buried channels and other palaeo features present in the channel country. Tests were undertaken to assess different band combinations coupled with different contrast stretches.
Features presented through the buried channels contradict the present climatic and riverine environment that drives the river systems presently. This implies a drying of the climate for the past 80,000 – 100,000 years and is significant research in furthering our understanding of long-range climate change in Australia.

Coastal and Reef MappingRecent research conducted by the University of Queensland Centre for Spatial Environmental Research has focused on two key areas of mapping from satellite imagery; bathymetry and habitats at specific spatial scales. The team at UQ has worked with Geoimage on collaborations in the past and was approached to trial the WV-2 imagery in the context of these two important applications. Sample data were acquired over both Heron Reef, Southern Great Barrier Reef, the site of UQ’s research station, and for the Eastern Banks, Moreton Bay, an area with sandy substrate and significant sea grass communities. Both locations are subject to environmental and human impacts and require continual assessment for sustainable use.
HERON ISLANDHeron Island has benefited from extensive research by students and academia for over 50 years and is an internationally renowned facility for coral reef research. UQ were able to compare and contrast results from the trial of WV-2 imagery against other very high resolution image sources such as QuickBird, IKONOS and CASI imagery. Various assessments were made of the utility of the traditional and additional spectral bands.
Heron Reef has been used to test bathymetric calculations using satellite imagery over recent years. UQ applied a bathymetry estimation method, where a simple log transform of the radiative equation is solved using a linear regression analysis with the field data. The results were validation using 2007 field data. Various bands were tested and the green band appeared to generate most effective results. The coastal band has a very high return signal and does not contain sufficient depth-related variation for a regression analysis with water depth. The trial bathymetry mapping used a method where depth estimation is trained on light substrates with high albedo, resulting in areas of darker substrate having an overestimated depth result. Results from using the WV-2 Green band appeared to be more accurate than previous Blue and Green band estimates using alternative VHR satellite imagery. This may in part be due to the slightly narrower bandwidth of the spectral channels. These spectral characteristics should also allow the use of more intensive empirical approaches, to obtain significantly more accurate estimation of water depth simultaneously over varying substrates.
Various techniques were adopted by UQ to assess the value of WV-2 in the mapping of the reef environment at three hierarchical spatial scales: 1) land, reef, deep water; 2) Geomorphological zonation, and 3) benthic communities. All three levels were mapped u s i ng an ob j e c t- ba sed approach (GEOBIA), where the benthic community level was also mapped using pixel based supervised classification. All image classification was undertaken on imagery which had been corrected for sun glint. This means that the near infrared bands were not incorporated into the analyses
EASTERN BANKS, MORETON BAYMoreton Bay is a recognised Marine Park in South East Queensland. The same approach was used to estimate water depth in the Eastern Banks region of Moreton Bay using a WV-2 image collected 16 December 2009. The Green band provides the best estimates over similar albedo substrates and from visual inspection and field knowledge, the Eastern Banks estimates appear to be accurate. Due to the sandy substrate, the utility of the Coastal band appeared to be diminished as the definition of shallow sand features was not possible. The GEOBIA approach was applied to the Eastern Banks, creating maps at three spatial scales or hierarchical levels and a supervised classification was applied to create a percentage seagrass cover map.
OBSERVED BENEFITS OF WORLDVIEW-2 IMAGERYObservations including adoption of Red Edge band to differentiate land from not land and the use of a Coastal/green ratio to mask deep water, as opposed to the traditional blue/green ratio appeared to offer best results. The blue band appeared to contribute more in the discrimination of reef cover features. The increased band options similarly provided more options in mapping reef communities as for geomorphic zones. The field verification of these differences is still required to determine if they are artefacts of the imagery or reflect subtle variation in reef formation, substrate or marine habitat.
From preliminary work undertaken by UQ, it appears that there is a potential for WV-2 imagery, due to the improved spatial and spectral resolution of the data, to enable the mapping of features based on the band content only, rather than based on abstract derivatives such as NDVI or PCAs. Environmental variables, particularly related to water depth, biomass, pigment concentration, leaf-area, quantity of vegetated cover or exposed ground, all appear to be potentially quantifiable without the requirement of complex algorithms. This will assist in offering solutions to clients that are more easily understandable and are accepted more readily by stakeholders and the community
Eastern banks, Moreton Bay showing classes for land, shallow water and shallow water with sand together with deep water. Note area of cloud are masked as grey. Similar processes were adopted to those undertaken at Heron Reef to discriminate land from water and within the water. Blue and green channels appeared to offer best separability of these core features.
Further discrimination of shallow water characteristics into areas with low and high seagrass cover. Ratios of green and blue were used to assist in determining shallow water extents and areas covered by seagrass or sand.
GEOBIA approach to mapping sea grass communities within the Eastern Banks regions. Some communities contain one seagrass species, where others contain a combination of seagrass species. The blue band appeared to contribute more in the discrimination between sea grass species. Increased bands provided more options for the generation of rulesets, including ratios between the green, yellow and red bands, which appear to correlate with the distribution of sea grass beds.
Supervised Image classification, into seagrass % cover, using all available visible WV-2 bands and applying training areas generated for processing QuickBird imagery based on field data collected in 2007. Within the 2-4m range, there appears to be improved definition of sea grass extents, possibly due to the adoption of the yellow band and the tighter bandwidth of the other contributing bands. Field verification of these differences is still required to determine if they are artifacts of the imagery or reflect subtle variation in water depth, substrate or marine habitat.
WorldView-2 Test Case Studies
Results of bathymetry estimation from band 3 (TOP) and B532 image before sun glint removal (Bottom) Heron Reef from a WV-2 image collected 22 December 2009. © DigitalGlobe 2009.
Geomorphic zonation map, each colour represents a geomorphic zone, of Heron Reef resulting from GEOBIA on sun glint corrected WV-2 image and the land,reef, deep water classification.
Benthic communities map, each colour represents a benthic community (e.g. sand, Coral+Rock) of Heron Reef resulting from GEOBIA on sun glint corrected WV-2 image and the geomorphic zone classification.
© Geoimage 2010 not to be reproduced without prior permission from Geoimage

WV-2 orthoimage B532 in RGB. Assets can be digitised from the pan-sharpened imagery for integration into mine planning and management systems. Where infrastructure is rapidly changing, being able to reference current scenarios from up-to-date imagery can greatly assist critical mine planning. WV-2 image collected 24 December 2009. © DigitalGlobe 2009.
(A) WV-2 orthoimageB532 in RGB. (B) The MSAVI is a complex vegetation Index that can be created using the Red and Near-Infrared Bands of WV-2. It is less affected by soil reflection than the traditional NDVI, so is particularly applicable in the semi-arid regions of Western Australia. Areas with abundant, healthy vegetation show up as red, whilst sparely vegetated/stressed vegetation displays as greens and non-vegetated areas are blues.WV-2 imagery collected 18 December 2009. © DigitalGlobe 2009.
(A) WV-2 orthoimage B532 in RGB. WV-2 image collected 24 December 2009. © DigitalGlobe 2009.
(B) Red Band divided by the Blue Band. The tradition ‘iron enhancement’, developed using Landsat imagery. Red polygons outline the Marra Mamba iron formation. As can be seen, this ratio also highlights other lithological units, not directly relevant to iron ore exploration.
(C) Modified Iron Ratio.Incorporation the Yellow band of WV-2, the iron ratio, developed by Geoimage through preliminary processing, better distinguishes the Marra Mamba formation.
(D) PCA image. The first, fourth and fifth PCs resulting from PCA using all of WV-2’s eight bands. Intricate variations in the surface geology can be emphasised on a never before seen level, thanks to WV-2’s superior spatial resolution.
Exploration and Mine Management - Pilbara Iron ore mineWith a strong technical background in geology, Geoimage has a significant client base in the mining and exploration sector. The way in which imagery is utilised varies between clients and it is proving to be a valuable asset to be used across many mining and exploration disciplines.
As an asset management tool, WV-2 enables users to quickly and accurately perform feature extraction of roads, rail lines, buildings and other pieces of critical infrastructure. With relatively low cost and frequent revisit capability, orthorectified WV-2 imagery is an ideal base for 1:2000 scale mapping. Decision makers can use WV-2 when route planning for transport corridors and use the imagery to monitor construction for new developments.
When trying to achieve triple bottom line outcomes for business, WV-2 provides the necessary basis for informed analysis on environmental and safety issues. With highly accurate surface elevation models created from WV-2 imagery, environmental managers
can create contingency plans for significant weather events such as flooding which may impact on infrastructure and operations. Through recurring captures, vegetation health can be monitored and classified to form a vital component in environmental reporting throughout the project lifecycle.
WV-2 ‘s unique eight high resolution spectral bands can be utilised to highlight structure and geology at a scale never before seen from satellites. Preliminary test processing performed by Geoimage has recognised the importance of the Yellow band in defining areas of alteration and mineralogical variation, especially where iron ore is a target. The ratio of the red and blue bands has long been used with Landsat imagery to highlight ferrous iron areas. However, this ratio also tends to emphasise other geological units that may not be directly relevant to iron ore exploration. Through the inclusion of the Yellow band, 8-band WV-2 imagery may better delineate areas of iron enrichment. WV-2’s 8 spectral bands can also be used in a variety of other image processing techniques, including decorrelation stretches, PCA and object-oriented image analysis and classification.
In this instance, abstract algorithms do appear to offer improved discrimination of features that are not apparent from the visible or simple band combinations.
B
B
D
A
A
C

Geoimage Australia’s leading provider of Satellite Imagery and GeoSpatial ServicesGeoimage has been offering professional and independent advice on the supply, processing, analysis and integration of satellite imagery and spatial datasets since 1988. Geoimage’s unsurpassed reputation for timely delivery, dedicated follow-up and professional customer service is evident from our extensive client list spanning the mining and exploration, environmental, planning, engineering and government sectors.
Data Content SupplierEstablished long-term partnerships with the widest range of international satellite suppliers allow Geoimage to provide clients with archive and new capture satellite imagery ranging from 50cm to 30m resolution, suitable to most applications requiring a spatial context, either as a reference or from which to extract derived information.
Geoimage has partnered with DigitalGlobe since 2007, providing Australian customers with access to one of the most advanced global high resolution satellite constellations ever available.
Extended Remote Sensing and GeoSpatial ServicesThe comprehensive services offered by Geoimage provide customers with a coordinated solution for their geospatial requirements. Not only is Geoimage renowned for superior image processing, including orthorectification/spatial correction, colour balancing and mosaicing, and Digital Elevation Models, but some of our geospatial services include:
• Advanced spectral processing for feature extraction, including Object Based classification and analysis
• Generation of derived datasets based on spectral characteristics, particularly for change detection using temporal image stacks
• Integration of satellite imagery with other geospatial data themes to generate comprehensive spatial data stores for decision support
Typical applications that benefit from the establishment of a geospatial framework include:
• Natural Resource Management including habitat value and environmental risk assessment
• Infrastructure planning including site and route assessments and visualisation
• Environmental performance reporting including change detection, vegetation rehabilitation and evidence-based reporting
• Climate change risk assessment and modelling including natural and built form threat identification
• Urban planning and design, including Visual impact assessment
• Corporate and project-based geo-enabling, including the dissemination of data via new technologies including webGIS solutions
Why do clients select Geoimage?
Geoimage’s clients repeatedly return because they appreciate our:
• Professional and independent advice
• Excellent customer service
• Superior processing capabilities
• Breadth of processing, analysis and value added services using remote sensing and geospatial technologies
• Confidential opinions and support from a specialist firm who is not competing for their business.
Please contact us at:
Brisbane PO Box 789, Indooroopilly Qld 4068 | 13/180 Moggill Road, Taringa QLD 4068
| Tel +61 7 3871 0088 | Fax +61 7 3871 0042 | [email protected]
Perth PO Box 8013, Subiaco East WA 6008 | 27A Townshend Road, Subiaco WA 6008
| Tel +61 8 9381 7099 | Fax +61 8 9381 7399 | [email protected]
Sydney PO Box 208, Crows Nest NSW 1585 | Tel +61 2 9460 0929 | Fax +61 2 9460 0929 | [email protected]
www.geoimage.com.au
Sydney area. 0.5m Natural Colour pan-sharpened Worldview-2 Imagery 05 January 2010. © DigitalGlobe 2010.


![Remote Sens. 2014 OPEN ACCESS remote sensing · red-edge bands. Eckert [37] referred to NDVI1 using NIR1 and red and NDVI2 using NIR2 and red. From the 64 possible two band combinations](https://img.pdfslide.us/doc/110x75/5f9935f0ec101d3a220601e0/remote-sens-2014-open-access-remote-sensing-red-edge-bands-eckert-37-referred.jpg)