Embed Size (px)
Citation preview

SEDIMENT TRANSPORT CAPACITY AND EROSION PROCESSES:MODEL CONCEPTS AND REALITY
C. HUANG*, L. K. WELLS, AND L. D. NORTON
USDA-ARS National Soil Erosion Research Laboratory, 1196 SOIL Bldg, Purdue University, West Lafayette, IN 47907-1196, USA
Received 24 April 1998; Revised 8 October 1998; Accepted 19 October 1998
ABSTRACT
Sediment transport capacity, Tc, defined as the maximum amount of sediment that a flow can carry, is the basicconcept in determining detachment and deposition processes in current process-based erosion models. Althoughdefined conceptually and used extensively in modelling erosion, Tc was rarely measured. Recently, a series oflaboratory studies designed to quantify effects of surface hydrologic conditions on erosion processes produced datasets feasible to evaluate the concept of Tc. A dual-box system, consisting of a 1´8m long sediment feeder box and a 5mlong test box, was used. Depending on the relative magnitudes of sediment delivery from feeder and test boxes, fivescenarios are proposed ranging from deposition-dominated to transport-dominated sediment regimes. Results showedthat at 5 per cent slope under seepage or 10 per cent slope under drainage conditions, the runoff from the feeder boxcaused additional sediment transport in the test box, indicating a transport-dominated sediment regime. At 5 per centslope under drainage conditions, deposition occurred at low rainfall intensities. Increases in slope steepness, rainfallintensity and soil erodibility shifted the dominant erosion process from deposition to transport. Erosion processconcepts from the Meyer±Wischmeier, Foster±Meyer and Rose models were compared with the experimental data,and the Rose model was found to best describe processes occurring during rain. A process-based erosion model needsto have components that can represent surface conditions and physical processes and their dynamic interactions.Copyright # 1999 John Wiley & Sons, Ltd.
KEY WORDS: soil erosion; sediment transport; erosion model
INTRODUCTION
During rainfall, many physical processes occur simultaneously at the soil surface. Building a conceptualframework for understanding erosion processes started more than 50 years ago when Ellison (1944,1947a, b, c) and his co-worker (Ellison and Ellison, 1947a, b) proposed to divide erosion processes intofour sub-processes: detachment by raindrop impact (DR), transport by rainsplash (TR), detachment bysurface flow (DF) and transport by surface flow (TF). Meyer and Wischmeier (1969), based on Ellison'smodel, proposed the `rate-limiting concept' that sediment delivery, qs, was limited by either thedetachment rate (DR +DF) or the transport capacity (TR +TF) depending on which had a lower value.Although Meyer and Wischmeier (1969) used different equations for each of the individual processes,the detachment and transport processes are quantified without an explicit coupling between them. Thismodel is called the Meyer±Wischmeier model here.
Foster and Meyer (1972, 1975) proposed a first-order detachment and transport coupling model forrill flow (hereafter called the Foster±Meyer model). This model relates the detachment or depositionrate, D, to the difference between transport capacity, Tc, and sediment load, qs, or:
D = a (Tc ± qs)
where a is a rate control constant. When qs 5 Tc, the flow will cause additional sediment detachmentand when qs 4 Tc, the excessive sediment will deposit. The value Tc, a predefined hypothetical number,becomes the key in determining whether detachment or deposition occurs. The combination of
Earth Surface Processes and LandformsEarth Surf. Process. Landforms 24, 503±516 (1999)
CCC 0197-9337/99/060503±14 $17.50Copyright # 1999 John Wiley & Sons, Ltd.
* Correspondence to: Dr. C. Huang, National Soil Erosion Research Laboratory, 1196 Soil Bldg, Purdue University, West Lafayette, IN 47907-1196, USA. Email: [email protected]

conceptual frameworks for rainfall-dominated interrill and runoff-dominated rill erosion processes(Meyer et al., 1975) and the Foster±Meyer detachment±transport coupling model for rill erosion led toprincipal erosion equations in the process-based Water Erosion Prediction Project (WEPP) model(Nearing et al., 1989). In our paper, the Foster±Meyer model is generalized for erosion processesoccurring on a plane slope element, an extension beyond the original rill channel definition.
Unlike the Foster±Meyer model which is based on values of qs and Tc for the net amount ofdetachment or deposition, Rose et al. (1983; also Rose, 1985) proposed a dynamic model which includesthree continuous and simultaneous processes: rainfall detachment, runoff detachment and sedimentdeposition (hereafter the Rose model). In the Rose model, sediment delivery is the balance of these threeprocesses and it does not require a prior calculation of Tc and a coupling relationship to eitherdetachment or deposition process for the final sediment delivery. Another difference between the WEPPand Rose models is the need in the WEPP model to separate into interrill and rill areas forcorresponding interrill and rill processes, while such separation is not required in the Rose model (Rose,1985).
In the past decade, significant efforts have been invested into the development and validation of theWEPP model in the USA. Unfortunately, little work was done to quantify sediment transport capacityand test the validity of the detachment±transport coupling concept. The difficulty of testing these erosionprocess model concepts is due to the lack of proper experimental procedures and data. Most of thesemodels were defined in a differential sense, in other words, the mass balance equation was written for aunit area on the soil surface. On the other hand, erosion data are mostly collected as sediment delivery atthe outlet, representing an integral quantity which has been integrated over space and time. Since it isvery difficult to make measurements in a small unit area on the soil surface during the rainfall event in atrue differential sense, a less desirable but possible alternative is to measure sediment delivery at differentspatial and temporal scales. Under steady-state conditions, this means a data set of sediment deliveryfrom different-sized plots.
Huang et al. (1996) conducted a field study on three US midwest soils to evaluate sedimentdetachment and transport coupling in flow channels. Their data showed that the rill detachment rate waslimited to a certain rate despite an increase in the transport capacity of the flow, indicating the lack of adirect coupling between transport and detachment processes. Consequently, Huang et al. (1996)concluded that the rate-limiting concept of Meyer±Wischmeier appears to fit the experimental databetter than the rate-coupling concept of Foster±Meyer.
Recent laboratory studies further showed that changing the near-surface hydraulic gradient and slopesteepness caused changes in both the dominant erosion process and the controlling sediment regime(Huang and Laflen, 1996; Gabbard et al., 1998; Huang, 1998). Under seepage or exfiltration conditions,the surface became more erodible and rilling was the dominant erosion process. The sediment regimebecame transport limiting. Under drainage (or infiltration) conditions, surface rilling did not occur andsediment delivery was detachment limited. These studies show that rilling can result from a lowering ofsurface soil strength as the pore water pressure was increased, not just from the flow shear alone.
Since the hydrologic condition can be controlled to create either a detachment-limiting or a transport-limiting sediment regime in the laboratory, it is possible to use this capability in a dual-box arrangementto further study processes of erosion. A dual-box system consists of a sediment source box upslope to atest box. By feeding the sediment from the source box and measuring the sediment output from the testbox, we can evaluate the erosion processes occurring in the test box.
Let S(A) be the sediment delivery from the feeder box, S(B) the sediment from the test box withoutthe feeder input and S(C) the sediment delivery from the test box with the feeder input. Depending onmagnitudes of S(A), S(B) and S(C), there are five possible scenarios in the test box:
Scenario 1: S(C) < S(A), net deposition in the test box;Scenario 2: S(C) = S(A), simultaneous erosion and deposition, erosion = deposition;Scenario 3: S(A) < S(C) < S(A)+S(B), simultaneous erosion and deposition, erosion > deposition;
Copyright # 1999 John Wiley & Sons, Ltd. Earth Surf. Process. Landforms 24, 503±516 (1999)
C. HUANG ET AL.504
Scenario 4: S(C) = S(A)+S(B), equilibrium, no effects from feeder runoff in the text box;Scenario 5: S(C) > S(A)+S(B), additional erosion in the test box from the feeder runoff.
Using this dual-box system and prior knowledge of the controlling sediment regime as the hydrologiccondition of the test box is changed, we can study conditions when a specific scenario takes place.
The objective of this paper is to identify dominant erosion processes as the surface condition ischanged through a series of laboratory rainfall simulations on a dual-box system. Variables changed tocreate different surface conditions are slope steepness, seepage and drainage, and rainfall intensity. Thesedata sets are used to evaluate the conceptual framework for sediment detachment, deposition andtransport processes, especially on the role of sediment transport capacity. Results of this study willfurther the understanding of erosion processes and provide a framework for developing a process-basederosion model.
A trial run was also conducted to isolate seepage effects on sediment delivery from the increasedrunoff due to the background seepage flow.
MATERIALS AND METHODS
Soil sample collection and experimental setup
The soil used in this study was an Ava silt loam (fine-silty, mixed, mesic Typic Fragiudalf with 15 percent sand, 70 per cent silt and 15 per cent clay) collected from Sullivan County, Indiana. The soil wassampled from a grassy area, up to 0´3m deep, along the shoulder area of a hill. Sufficient soil wastransported back to the laboratory for the experiment.
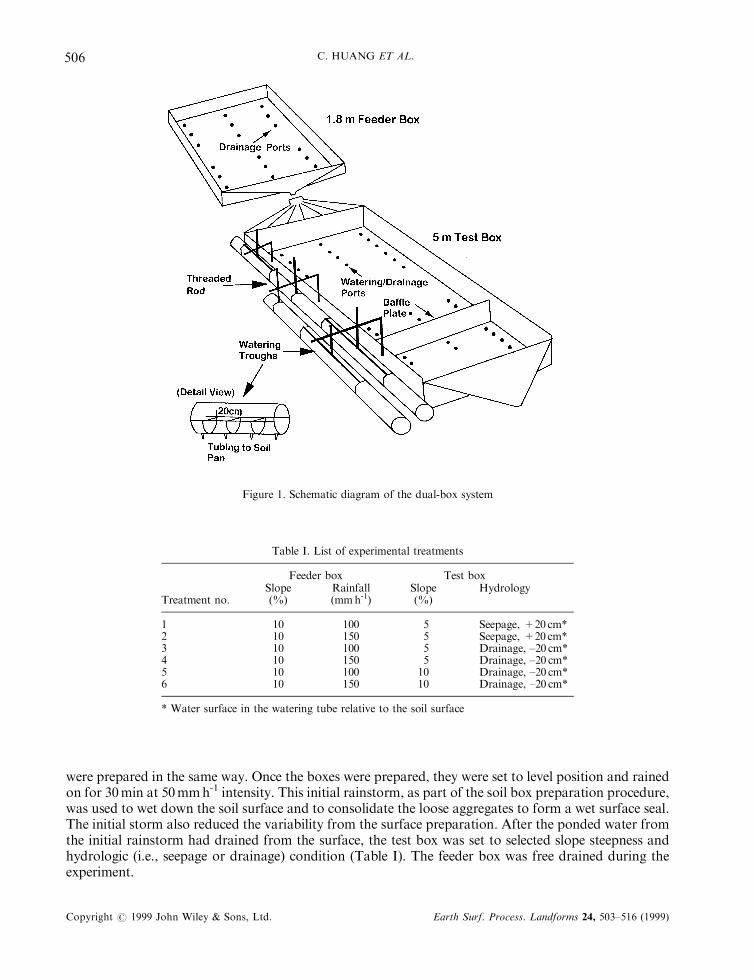
The study was conducted on a dual-box system consisting of a 5m long test box and a 1´8m longfeeder box (Figure 1). Both boxes are 1´2m wide and 0.3m deep. The feeder box sat upslope of the testbox. These two boxes can be connected by a connecting piece such that runoff from the feeder box canbe fed to the upper end of the test box. When disconnected, runoff samples can be collected separatelyfrom each box. The connection and disconnection can be done quickly without stopping the rain.
The slope of the test box was adjustable from 0 to 40 per cent in 5 per cent increments. The test boxhad 75 watering (or drainage) holes (6mm diameter) at the bottom. A water circulation system wasdesigned to supply water to the bottom of the test box with a capability of maintaining a constant waterlevel of any position relative to the soil surface. A seepage or exfiltration condition was created when thewater level in the water supply tubes was above the soil surface forcing water flow upward through thesoil and exfiltrate at the surface. Alternatively, the water supply tubes were lowered below the soilsurface to create a tension-assisted drainage condition or disconnected to let the test box drain undergravity. A detailed description of the test box and water circulation system was given by Huang andLaflen (1996) and Gabbard et al. (1998).
The feeder box can be set to any slope steepness by hoisting up its upslope end using a pulley-chainsystem. The feeder box has 27 holes at the bottom (6mm diameter) for seepage or drainage control. Inthis study, these holes were open for free drainage.
For both boxes, the depth of soil fill was approximately 25 cm, overlying a 2 cm layer of sand at thebottom. These two boxes were placed under two sets of oscillating-nozzle, programmable rainfallsimulation troughs (Foster et al., 1979). There are five rainfall troughs spaced 1m apart for the test boxand three troughs at 0´84m spacing for the feeder box. Each rain trough had two VeeJet nozzles (PartNo. 80100, Spraying Systems Co. Wheaton, IL, USA) spaced 1´07m apart. Vertical distance between thenozzle and soil surface was approximately 2´8m for the test box and 2´4m for the feeder box. Duringrainfall simulation, the nozzle pressure was kept at 41´4kPa (6 psi). These two sets of rainfall simulatorscan be set to selected rainfall intensities, ranging from 25 to 200 mm h-1 by programming the oscillatingfrequency of the nozzles, and controlled independently for different rain intensities on each box.
Preparation of the soil box included adding fresh soil collected from the field, breaking up clods to 2±3 cm in size, and smoothing out the visual irregularities on the surface by hand or a rake. Both boxes
MODELLING SEDIMENT TRANSPORT CAPACITY 505
Copyright # 1999 John Wiley & Sons, Ltd. Earth Surf. Process. Landforms 24, 503±516 (1999)
were prepared in the same way. Once the boxes were prepared, they were set to level position and rainedon for 30min at 50mmh-1 intensity. This initial rainstorm, as part of the soil box preparation procedure,was used to wet down the soil surface and to consolidate the loose aggregates to form a wet surface seal.The initial storm also reduced the variability from the surface preparation. After the ponded water fromthe initial rainstorm had drained from the surface, the test box was set to selected slope steepness andhydrologic (i.e., seepage or drainage) condition (Table I). The feeder box was free drained during theexperiment.
Figure 1. Schematic diagram of the dual-box system
Table I. List of experimental treatments
Feeder box Test boxSlope Rainfall Slope Hydrology
Treatment no. (%) (mmh-1) (%)
1 10 100 5 Seepage, +20 cm*2 10 150 5 Seepage, +20 cm*3 10 100 5 Drainage, ±20 cm*4 10 150 5 Drainage, ±20 cm*5 10 100 10 Drainage, ±20 cm*6 10 150 10 Drainage, ±20 cm*
* Water surface in the watering tube relative to the soil surface
Copyright # 1999 John Wiley & Sons, Ltd. Earth Surf. Process. Landforms 24, 503±516 (1999)
C. HUANG ET AL.506

Experimental procedure
The erosion study was conducted 24h after the initial rain. The run consisted of continuous rainfallevents of four rainfall intensities (50, 25, 75 and 150mmh-1) on the test box. The run started with the 50mm h-1 storm on the test box. The rainfall on the feeder box also started at the same time at either 100 or150 mm h-1 for low or high sediment feed rates. Runoff samples from both boxes were collected in 8 lbuckets every 3min. After collecting 10 runoff samples, the two boxes were connected to let the runofffrom the feeder box feed to the upper end of the test box. After a waiting period of 1 to 2min for thesurface to `equilibrate' to the new condition, four runoff samples were collected from the test box whichwas receiving runoff input from the feeder box. After sampling with the two boxes connected, theconnecting piece was removed and two additional runoff samples were collected from each boxseparately. These two final samples were used to account for the temporal changes of the sedimentdelivery as the surface is being eroded.
After all the runoff samples were collected for the 50mmh-1 rain, the rain intensity for the test boxwas switched to 25 mm h-1 and the sequence of collecting runoff samples was repeated: from both boxesseparately, from test box with runoff input from the feeder box, and again from both boxes separately.The same sampling protocol was repeated for 75 and 150mmh-1 rainstorms on the test box. Instead oftaking 10 runoff samples before the feeder box was connected, as was being done during the 50mmh-1,only four runoff samples were taken for the 25, 75 and 150mmh-1 storms. Throughout the rainsequence, the intensity of the feeder box remained constant, at either 100 or 150mmh-1. The entire runlasted about 2 h.
After each run, 10 to 20ml of saturated alum (AlK(SO4)2) solution was added to the buckets toflocculate the suspended sediment. After settling overnight, the excess water was poured out of thebuckets and the sediment was transferred into 1 l bottles. The bottles were placed in ovens at 1058C forat least 24 h or until the sediment samples were dried. Dry weights were then taken to calculate thesediment delivery rate and concentration.
Following the run, the soil boxes were drained and dried under a large fan. After the soil surface wasdried, the soil was then turned by a shovel for additional drying of the newly exposed subsurface soil.Fresh, air-dried soil was added to the surface during preparation for the next run. Each run wasreplicated twice.
The experiments were conducted for combinations of slope steepness, hydraulic gradient, and level ofrunoff/sediment feed from the feeder box (Table I). These combinations were designed to representhydrologic conditions that would be expected for a 5m segment of a hillslope in various topographicpositions.
Runs to show seepage effects under similar rainfall and runoff rates
In order to compare the seepage and drainage effects under the same rainfall and runoff intensities,trial runs were made during another study using the same soil. The runs were conducted with the testbox first under the seepage condition at 5 per cent slope. After collecting sediment samples, the soil boxwas drained and additional water was added to the top of the test box to compensate for the runoffdifference between background seepage and infiltration. Thus, the subsequent run made under drainageconditions had similar surface morphology, rainfall and runoff intensities to those under seepagecondition. Two runs were made, one at 50mmh-1 and the other one at 100 mm h-1 rainfall intensity.Two levels of feeder sediment content were also created by covering and uncovering the feeder boxsurface with a landscape fabric.
Data processing and tabulation
Runoff (R) and sediment (S) rates were averaged from six samples, four before connection and twoafter disconnection, for both test and feeder boxes and from four samples when two boxes are
MODELLING SEDIMENT TRANSPORT CAPACITY 507
Copyright # 1999 John Wiley & Sons, Ltd. Earth Surf. Process. Landforms 24, 503±516 (1999)
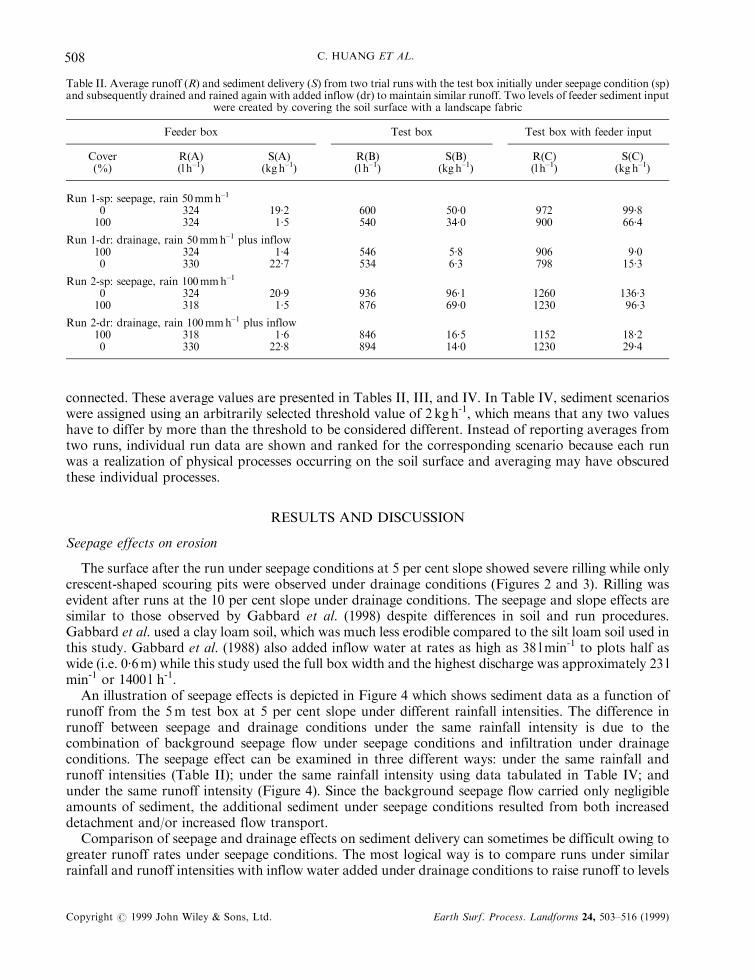
connected. These average values are presented in Tables II, III, and IV. In Table IV, sediment scenarioswere assigned using an arbitrarily selected threshold value of 2 kgh-1, which means that any two valueshave to differ by more than the threshold to be considered different. Instead of reporting averages fromtwo runs, individual run data are shown and ranked for the corresponding scenario because each runwas a realization of physical processes occurring on the soil surface and averaging may have obscuredthese individual processes.
RESULTS AND DISCUSSION
Seepage effects on erosion
The surface after the run under seepage conditions at 5 per cent slope showed severe rilling while onlycrescent-shaped scouring pits were observed under drainage conditions (Figures 2 and 3). Rilling wasevident after runs at the 10 per cent slope under drainage conditions. The seepage and slope effects aresimilar to those observed by Gabbard et al. (1998) despite differences in soil and run procedures.Gabbard et al. used a clay loam soil, which was much less erodible compared to the silt loam soil used inthis study. Gabbard et al. (1988) also added inflow water at rates as high as 38 lmin-1 to plots half aswide (i.e. 0´6m) while this study used the full box width and the highest discharge was approximately 23 lmin-1 or 1400 l h-1.
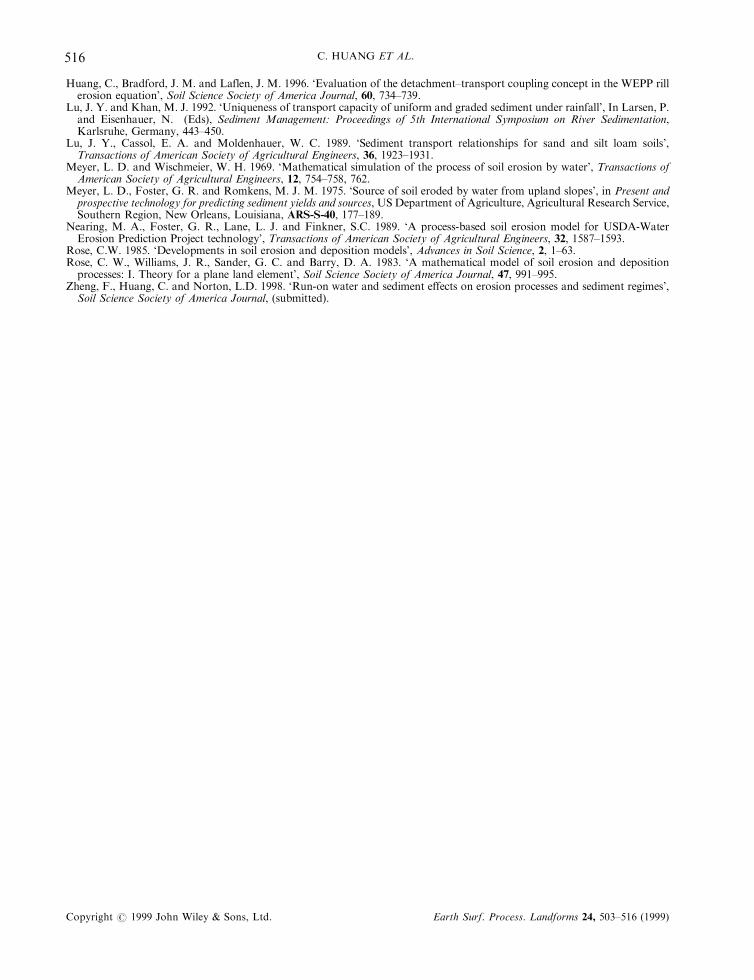
An illustration of seepage effects is depicted in Figure 4 which shows sediment data as a function ofrunoff from the 5m test box at 5 per cent slope under different rainfall intensities. The difference inrunoff between seepage and drainage conditions under the same rainfall intensity is due to thecombination of background seepage flow under seepage conditions and infiltration under drainageconditions. The seepage effect can be examined in three different ways: under the same rainfall andrunoff intensities (Table II); under the same rainfall intensity using data tabulated in Table IV; andunder the same runoff intensity (Figure 4). Since the background seepage flow carried only negligibleamounts of sediment, the additional sediment under seepage conditions resulted from both increaseddetachment and/or increased flow transport.
Comparison of seepage and drainage effects on sediment delivery can sometimes be difficult owing togreater runoff rates under seepage conditions. The most logical way is to compare runs under similarrainfall and runoff intensities with inflow water added under drainage conditions to raise runoff to levels
Table II. Average runoff (R) and sediment delivery (S) from two trial runs with the test box initially under seepage condition (sp)and subsequently drained and rained again with added inflow (dr) to maintain similar runoff. Two levels of feeder sediment input
were created by covering the soil surface with a landscape fabric
Feeder box Test box Test box with feeder input
Cover(%)
R(A)(l h±1)
S(A)(kg h±1)
R(B)(l h±1)
S(B)(kg h±1)
R(C)(l h±1)
S(C)(kg h±1)
Run 1-sp: seepage, rain 50mmh±1
0 324 19´2 600 50´0 972 99´8100 324 1´5 540 34´0 900 66´4
Run 1-dr: drainage, rain 50mmh±1 plus inflow100 324 1´4 546 5´8 906 9´00 330 22´7 534 6´3 798 15´3
Run 2-sp: seepage, rain 100mmh±1
0 324 20´9 936 96´1 1260 136´3100 318 1´5 876 69´0 1230 96´3
Run 2-dr: drainage, rain 100mmh±1 plus inflow100 318 1´6 846 16´5 1152 18´20 330 22´8 894 14´0 1230 29´4
Copyright # 1999 John Wiley & Sons, Ltd. Earth Surf. Process. Landforms 24, 503±516 (1999)
C. HUANG ET AL.508

Table III. Average run off, R, from individual runs collected from feeder box, R(A), test box alone, R(B) and test box with feeder input R(C)
Run 1 Run 2
Feeder box Test boxTest box withfeeder input Feeder box Test box
Test box withfeeder input
R(A)(l h±1)
Rain(mmh±1)
R(B)(l h±1)
R(A)+R(B)(l h±1)
R(C)(l h±1)
R(A)(l h±1)
Rain(mmh±1)
R(B)(l h±1)
R(A)+R(B)(l h±1)
R(C)(l h±1)
Treatment 1, Feeder box: rain 100mm ±1; Test box: slope: 5%, +20 cm seepage203 25 365 568 597 193 25 447 641 635204 50 520 724 735 192 50 577 768 790203205
75150
6851112
8881317
9041377
199203
75150
7411170
9401373
9351396
Treatment 2, Feeder box: rain 150mm ±1; Test box: slope: 5%, +20 cm seepage292296296297
255075150
3564926421080
6477889391377
6217629151369
301300299306
255075150
3564966381030
6577969371336
6197999481346
Treatment 3, Feeder box: rain 100mmh±1; Test box: slope: 5%, ±20 cm drainage192194196197
255075150
154256426665
347449621862
328404614847
193189193197
255075150
161280433779
354469626976
351467625978
Treatment 4, Feeder box: rain 150mmh±1; Test box: slope 5%, ±20 cm drainage300306305307
255075150
195321471817
4956277761124
4816087701132
296299297301
255075150
182304457850
4786037541151
4735977631155
Treatment 5, Feeder box: rain 100mmh±1; Test box: slope: 10%, ±10 cm drainage200201201198
255075150
156280423793
355480624990
352481626950
194194194195
255075150
156282424752
350476618947
351475608975
Treatment 6, Feeder box: rain 150mmh±1; Test box: slope: 10%, ±10 cm drainage290292297301
255075150
172292437803
4625847341104
4605797311113
313306310313
255075150
178304449833
4906107591147
4906277671141
MODELLIN
GSEDIM
ENT
TRANSPORT
CAPACIT
Y509
Copyrig
ht#
1999Jo
hnWiley
&Sons,
Ltd.
Earth
Surf.
Process.
Landform
s24,503±516(1999)
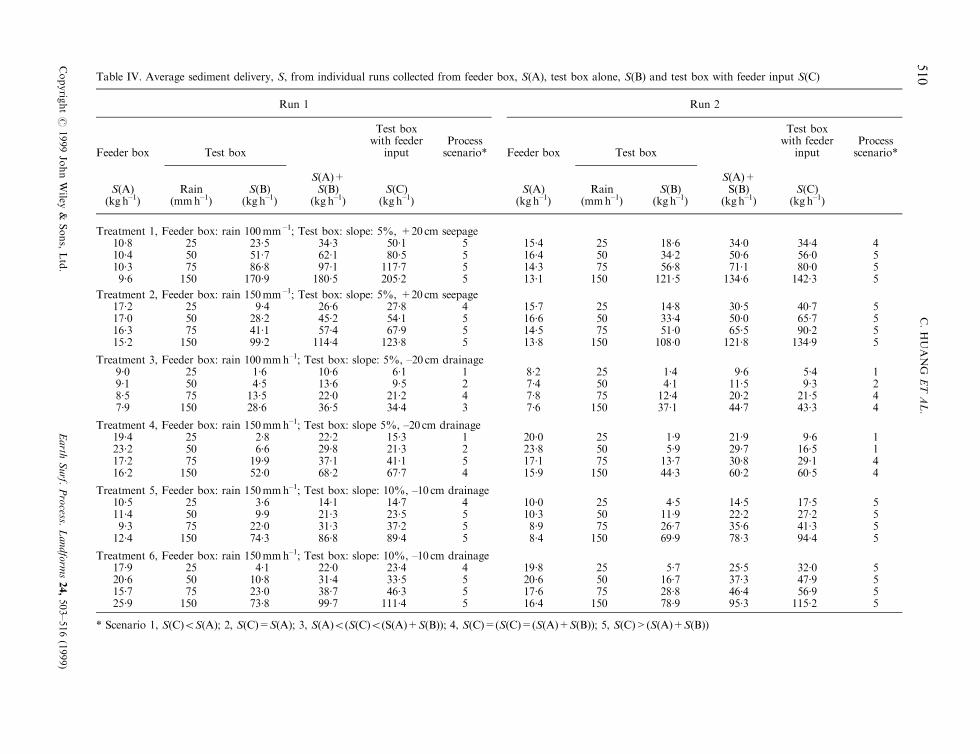
Table IV. Average sediment delivery, S, from individual runs collected from feeder box, S(A), test box alone, S(B) and test box with feeder input S(C)
Run 1 Run 2
Feeder box Test box
Test boxwith feeder
inputProcessscenario* Feeder box Test box
Test boxwith feeder
inputProcessscenario*
S(A)(kg h±1)
Rain(mmh±1)
S(B)(kg h±1)
S(A)+S(B)
(kg h±1)S(C)
(kg h±1)S(A)
(kg h±1)Rain
(mmh±1)S(B)
(kg h±1)
S(A)+S(B)
(kg h±1)S(C)
(kg h±1)
Treatment 1, Feeder box: rain 100mm±1; Test box: slope: 5%, +20 cm seepage10´810´410´39´6
255075150
23´551´786´8170´9
34´362´197´1180´5
50´180´5117´7205´2
5555
15´416´414´313´1
255075150
18´634´256´8121´5
34´050´671´1134´6
34´456´080´0142´3
4555
Treatment 2, Feeder box: rain 150mm±1; Test box: slope: 5%, +20 cm seepage17´217´016´315´2
255075150
9´428´241´199´2
26´645´257´4114´4
27´854´167´9123´8
4555
15´716´614´513´8
255075150
14´833´451´0108´0
30´550´065´5121´8
40´765´790´2134´9
5555
Treatment 3, Feeder box: rain 100mmh±1; Test box: slope: 5%, ±20 cm drainage9´09´18´57´9
255075150
1´64´513´528´6
10´613´622´036´5
6´19´521´234´4
1243
8´27´47´87´6
255075150
1´44´112´437´1
9´611´520´244´7
5´49´321´543´3
1244
Treatment 4, Feeder box: rain 150mmh±1; Test box: slope 5%, ±20 cm drainage19´423´217´216´2
255075150
2´86´619´952´0
22´229´837´168´2
15´321´341´167´7
1254
20´023´817´115´9
255075150
1´95´913´744´3
21´929´730´860´2
9´616´529´160´5
1144
Treatment 5, Feeder box: rain 150mmh±1; Test box: slope: 10%, ±10 cm drainage10´511´49´312´4
255075150
3´69´922´074´3
14´121´331´386´8
14´723´537´289´4
4555
10´010´38´98´4
255075150
4´511´926´769´9
14´522´235´678´3
17´527´241´394´4
5555
Treatment 6, Feeder box: rain 150mmh±1; Test box: slope: 10%, ±10 cm drainage17´920´615´725´9
255075150
4´110´823´073´8
22´031´438´799´7
23´433´546´3111´4
4555
19´820´617´616´4
255075150
5´716´728´878´9
25´537´346´495´3
32´047´956´9115´2
5555
* Scenario 1, S(C)5S(A); 2, S(C)=S(A); 3, S(A)5(S(C)5(S(A)+S(B)); 4, S(C)=(S(C)=(S(A)+S(B)); 5, S(C)>(S(A)+S(B))
Copyrig
ht#
1999Jo
hnWiley
&Sons,
Ltd.
Earth
Surf.
Process.
Landform
s24,503±516(1999)
C.HUANG
ET
AL.
510

similar to those under seepage conditions. Making runs first under seepage and later under drainageconditions from the same soil box further ensured a similar surface morphology between seepage anddrainage runs, and changes in sediment delivery were indeed only caused by the reversal of the near-surface hydraulic gradient. Data in Table II showed that under both rainfall intensities, i.e. 50 and100mmh-1, sediment delivery was greatly reduced either with or without the feeder input as the soil boxwas shifted from a seepage condition to a drainage one. The data also indicate an interaction betweenupslope (feeder) sediment content and sediment detachment in the downslope test box. (A detaileddiscussion on the upslope sediment effects is presented by Zheng et al. (1998).) This data set provides
Figure 2. Soil surface morphology after a run made under drainage conditions showing crescent-shaped surface scours
Figure 3. Soil surface morphology after a run made under seepage conditions showing severe rilling
MODELLING SEDIMENT TRANSPORT CAPACITY 511
Copyright # 1999 John Wiley & Sons, Ltd. Earth Surf. Process. Landforms 24, 503±516 (1999)
additional confirmation to the attribution of seepage condition as a key factor for increased rilling anderosion on hillslopes. (Huang and Laflen, 1996; Gabbard et al., 1998).
Erosion process scenario
Runoff data shown in Table III indicated a reasonable water balance between total runoff from bothboxes separated, i.e. R(A)+R(B), and the runoff from the test box with feeder input R(C). On the otherhand, erosion process scenarios shown in Table IV depicted all five possible scenarios but appeared tofollow distinct patterns as both surface hydrologic condition and slope gradient were changed.Therefore, the existence of different sediment scenarios cannot be attributed to runoff intensity aloneand has resulted from changes in surface condition and slope gradient.
Under drainage conditions at 5 per cent slope, the erosion process in the test box changed from netdeposition (Scenario 1) to equilibrium (Scenario 4) as the rainfall intensity was increased from 25 to 150mm h-1. The occurrence of a Scenario 5 situation at 75 mm h-1 rainfall intensity may have been caused bythe variability in surface condition and sampling error. When the slope steepness was increased to 10 percent or when the hydrologic condition was changed to seepage conditions, the erosion process mostlyfollowed Scenario 5, i.e. the feeder water caused additional sediment delivery from the test box, exceptthat some Scenario 4 cases occurred under 25 mm h-1 rainfall.
The Scenario 1 net deposition in the test box is caused by both excessive sediment input from thefeeder box and insufficient sediment-carrying capacity of the flow in the test box at low slope and rainfallintensity. This scenario is possible because the feeder box was set to 10 per cent slope and rained at either100 or 150 mm h-1 while the test box was at 5 per cent slope and under 25 to 50 mm h-1 rainfall. In fieldconditions, Scenario 1 simulates erosion processes at a concave shoulder portion of a hillslope or runofffrom a highly erosive and erodible region to a lower one. An increase in raindrop impact and flowtransport from increased rainfall intensity shifted the sediment deposition regime to an equilibriumcondition at which the runon water and sediment from the feeder box caused neither additionaldetachment nor deposition in the test box.
Under seepage conditions, the soil strength is low and sediment is easily detached and transported.The flow from the runon water caused additional sediment delivery from the test box. The change inslope gradient to 10 per cent increased the sediment transport capacity of the flow, despite an increased
Figure 4. Sediment delivery from the test box without feeder under seepage and drainage conditions
Copyright # 1999 John Wiley & Sons, Ltd. Earth Surf. Process. Landforms 24, 503±516 (1999)
C. HUANG ET AL.512

soil strength under drainage conditions; the increased sediment transport capacity also brought forthadditional sediments from the test box. The process of additional flow detachment for the Scenario 5situation is therefore triggered by increasing either soil erodibility or flow transport capacity. Scenario 5can be considered as a transport-dominated regime in the sense that sediment delivery is dictated by theflow transport capacity because of low soil strength and high flow shear. In field conditions, the Scenario5 regime represents processes at the backslope or footslope locations.
Sediment transport capacity: contradictions and reality
Data from the dual-box study presented in Table IV revealed contradictions and challenges to thesediment transport capacity concept in the current US erosion process model, i.e. WEPP derived formthe Foster±Meyer model. In this model, the transport capacity, Tc, sets the upper limit of sedimenttransport and a transport-limiting (TL) sediment regime indicates that sediment in the runoff has reachedits maximum capacity. Under the TL regime, any additional sediment added to the runoff would bedeposited. The association of the deposition process with the TL regime is the basis of severalexperimental studies designed to quantify Tc (Lu et al., 1989; Lu and Khan, 1992). Our data from the 5per cent slope, drainage conditions and 25mmh-1 rainfall appeared to be an example of the TLdeposition process. The sediment discharge rates of 5 to 15kgh-1 obtained under 5 per cent slope and25mmh-1 rainfall with both low and high feeder inputs could be considered as the values of Tc for runoffintensities ranging from 330 to 480 l h-1.
Recent papers on surface hydrologic conditions and sediment regimes have associated a TL regime toseepage conditions and a detachment-limiting (DL) sediment regime to drainage conditions because theincreased soil strength would limit the amount of sediment detachment and, consequently, transport(Gabbard et al., 1998; Huang, 1998). Therefore, it is likely that the soil box at 5 per cent slope anddrainage conditions is also in a DL regime. This drainage-associated DL regime is further supported bythe sediment data from seepage conditions. Under seepage conditions, rainfall at 25mmh-1 alonewithout added inflow produced sediment rates ranging from 9 to 24kgh-1 with runoff intensities from355 to 447 l h-1. Apparently, the flow under seepage conditions can carry more sediment than the flowunder drainage conditions for identical rainfall and similar runoff intensities. If the sediment under theseepage condition is under a TL regime, then the lower sediment rates from the drainage conditionwould imply a DL sediment regime. The apparent coexistence of TL and DL regimes for the drainagecondition is a contradiction.
Another data set that showed the apparent TL and DL contradiction is from 5 per cent slope,50mmh-1 rainfall with a high sediment addition. A Scenario 1 deposition regime was assigned to thedrainage condition with total sediment delivery ranging from 17 to 21kgh-1 and runoff intensities from597 to 608 l h-1. Alone without the feeder input, the sediment delivery at 50mmh-1 rainfall under seepageconditions ranged from 28 to 51kgh-1 while the runoff varied from 492 to 577 l h-1. Lesser runoff underseepage conditions produced a greater amount of sediment as compared to a slightly greater runoffunder drainage conditions with an apparent deposition but a lower amount of sediment delivery: again,a TL±DL contradiction.
Another way of phrasing the TL±DL contradiction is: `If sediment delivery is already at its Tc underdrainage conditions, from the evidence of deposition, then what would be the meaning of greatersediment delivery rates under seepage conditions without signs of deposition?' These contradictionsindicate that there is a need to revise the current transport capacity concept and its relationships todetachment and deposition in developing process-based erosion models.
Revised sediment transport and erosion process model concept
Our data suggested that sediment transport capacity is not just a function of sediment properties andflow hydraulics, as currently known and used in `process-based erosion models'. Surface hydrologic
MODELLING SEDIMENT TRANSPORT CAPACITY 513
Copyright # 1999 John Wiley & Sons, Ltd. Earth Surf. Process. Landforms 24, 503±516 (1999)

conditions, such as seepage and drainage, affect soil erodibility and have an important role in controllingthe transport capacity and sediment regime. Many alternatives are possible in reformulating the erosionprocess model concept.
One alternative is to redefine sediment transport capacity as a function of soil properties, flowhydraulics and surface conditions and still use a detachment±transport coupling model such as theFoster±Meyer model to relate Tc and qs to sediment detachment and deposition. If the erosion processmodel continues to use Tc as the criterion for erosion process separation, the value of Tc has to bequantified for many different surface conditions as demonstrated in this study. One problem stillremaining is how to measure Tc experimentally. The dual-box system is excellent in studying erosionprocesses, but not suitable for routine soil testing because of the large quantity of soil needed to fill thebox and the extensive preparation work required for each run. Since seepage cannot be readily recreatedin the field, the experimental procedure probably has to be conducted in the laboratory. It is a challengefor erosion scientists to come up with a procedure for measuring Tc.
Another alternative is to use the Meyer±Wischmeier concept with separate detachment and transportcomponents for DL and TL sediment regimes. From a field study on three midwestern soils, Huang etal. (1996) showed the advantage of using the Meyer±Wischmeier model to describe sediment detachmentand transport in flow channels. Recent laboratory rainfall simulation studies also showed distinctive DLand TL regimes associated with drainage and seepage conditions (Gabbard et al., 1998; Huang, 1998).Although the Meyer±Wischmeier model concept may appear to be a better alternative than the Foster±Meyer model, the difficulty is to identify the proper sediment regime and functional relationships for aspecific regime under different rainfall, slope and soil surface conditions. Still, the association of thedeposition process with a TL regime in the Meyer±Wischmeier model is an area that needs to be revised.
Instead of fitting a preconceived DL/TL process regime, the most logical approach seems to be theRose model concept. The Rose model is a dynamic model with separate but simultaneous detachment,transport and deposition components. The dynamic balance dictates the controlling erosion process andsediment regime. In fact, changes from Scenario 1 to 5 may be caused by the shift in the dynamic balancefrom a deposition-dominated (Scenario 1) to detachment-dominated (Scenario 3) and finally atransport-dominated (Scenario 5) process regime. Scenario 2 is a transition between deposition- anddetachment-dominated processes, and likewise, Scenario 4 is a transition between detachment andtransport. The transition from Scenario 2 to Scenario 4 regimes may be explained by the re-entrainmentconcept, a further development of the Rose model to account for the redetachment of already detachedand subsequently deposited sediment (Hairsine and Rose, 1992). To test the re-entrainment concept,experimental procedures need to be developed to partition the total sediment delivery to its source areas.Until such procedures are in place, the re-entrainment concept will remain a hypothetical one.
The advantage of using a dynamic equilibrium model with simultaneous detachment, transport anddeposition processes alleviates the potential contradiction in the detachment/transport-limiting modelconcept. The designation of a particular sediment process scenario, as the outcome of the sediment massbalance, is to identify the dominating process occurring on the hillslope. Our data have shown a generaltrend for increasing slope steepness, rainfall intensity and soil erodibility to cause the shift in erosionprocess regime from Scenario 1 to 5. If the sediment delivery from the 5m test box represents a dynamicequilibrium for the specific condition, i.e. slope gradient, hydrologic condition, and rainfall and runoffintensities, these data can then be used to quantify the association between surface condition and theerosion processes. This hypothesis is currently being tested in the laboratory and preliminary results arepromising.
CONCLUSIONS AND IMPLICATIONS
Results of this study demonstrated the capability of a dual-box system to quantify erosion processscenarios from deposition-dominated to transport-dominated regimes. Our data show: (1) sedimentregime from the dual-box system can be categorized into five different sediment scenarios ranging from
Copyright # 1999 John Wiley & Sons, Ltd. Earth Surf. Process. Landforms 24, 503±516 (1999)
C. HUANG ET AL.514

deposition-dominated to detachment- and transport-dominated processes; (2) the dominant erosionprocess depends on slope gradient, rainfall intensity and soil erodibility; and (3) an increase in soilerodibility from the seepage condition triggers a transport-dominated regime while a decrease in soilerodibility from profile drainage limits sediment detachment and enhances sediment deposition. Thesescenarios were used to compare three proposed erosion process model concepts: Meyer±Wischmeier,Foster±Meyer and Rose models. The Rose model, which contains simultaneous deposition, detachmentand transport processes, appears to best describe the experimental findings. These findings may changefuture directions of erosion process research and prediction model development.
Erosion process model concepts have been proposed for many years, dating back to the pioneeringworks of Ellison (1944, 1947a, b, c), and are currently used in the development of process-based erosionprediction models. Physical processes of deposition, detachment and transport are well recognized in theconceptual development of erosion models. Unfortunately, experimental procedures to test conditionswhen all these processes are occurring have not been developed until recently. This dual-box systemallows us to examine conditions for different process scenarios.
Besides testing for different sediment scenarios, the dual-box system is capable of simulating thoseprocesses occurring at a portion of a hillslope. Changes in slope gradient, rainfall distribution and soilerodibility, and their effects on erosion processes, can be quantified by setting different conditions for thefeeder and test boxes. Experiments have begun to evaluate the upslope runon sediment effects on erosionprocesses downslope, by changing the sediment-to-water ratio of the feeder input. An expansion of thedual-box system to a triple-box setup is near completion and experiments will begin soon to quantifysediment transport processes in a complex slope geometry. These recent developments in laboratory soil-box procedures will yield valuable information for the understanding of erosion processes occurring at ascale similar to that occurring on hillslopes.
ACKNOWLEDGEMENT
The authors would like to thank Professor Fenli Zheng, Institute of Soil and Water Conservation,Yangling, Shaanxi, China, for providing the data set tabulated in Table II showing seepage and drainageeffects from her study on run-on water and sediment effects.
REFERENCES
Ellison, W. D. 1944. `Studies of raindrop erosion', Agricultural Engineering, 25, 131±136, 181±182.Ellison, W. D. 1947a. `Soil erosion studies ± Part I', Agricultural Engineering, 28, 145±146.Ellison, W. D. 1947b. `Soil erosion studies ± Part II: Soil detachment hazard by raindrop splash', Agricultural Engineering, 28,
197±201.Ellison, W. D. 1947c. `Soil erosion studies ± Part V: Soil transportation in the splash process', Agricultural Engineering, 28, 349±
353.Ellison, W. D. and Ellison, O. T. 1947a. `Soil erosion studies ± Part VI: Soil detachment by surface flow', Agricultural
Engineering, 28, 402±408.Ellison, W. D. and Ellison, O. T. 1947b. `Soil erosion studies ± Part VII: Soil transportation by surface flow', Agricultural
Engineering, 28, 442±444, 450.Foster, G. R. and Meyer, L. D. 1972. `A closed-form soil erosion equation for upland areas', in Shen, H. W. (Ed.),
Sedimentation. Colorado State University, Ft Collins, Colorado, 12-1±12-19.Foster, G. R. and Meyer, L. D. 1975. `Mathematical simulation of upland erosion by fundamental erosion mechanics', in Present
and prospective technology for predicting sediment yields and sources, US Department of Agriculture, Agricultural ResearchService, Southern Region, New Orleans, Louisiana, ARS-S-40, 190±207.
Foster, G. R., Eppert, F. P. and Meyer, L. D. 1979. `A programmable rainfall simulator for field Plots', Proceedings of RainfallSimulator Workshop, 7±9 March 1979, Tucson, Arizona, US Department of Agriculture, Science and EducationAdministration, Agricultural Reviews and Manuals, ARM-W-10, 45±59.
Gabbard, D. S., Huang, C., Norton, L. D. and Steinhardt, G. C. 1998. `Landscape position, surface hydraulic gradients anderosion processes', Earth Surface Processes and Landforms, 23, 83±93.
Hairsine, P. B. and Rose, C. W. 1992. `Modeling water erosion due to overland flow using physical principles: 1. Sheet flow',Water Resources Research, 28, 237±243.
Huang, C. 1998. `Sediment regimes under different slope and hydrologic conditions', Soil Science Society of America Journal, 62,423±430.
Huang, C. and Laflen, J. M. 1996. `Seepage and soil erosion for a clay loam soil', Soil Science Society of America Journal, 60,408±416.
MODELLING SEDIMENT TRANSPORT CAPACITY 515
Copyright # 1999 John Wiley & Sons, Ltd. Earth Surf. Process. Landforms 24, 503±516 (1999)
Huang, C., Bradford, J. M. and Laflen, J. M. 1996. `Evaluation of the detachment±transport coupling concept in the WEPP rillerosion equation', Soil Science Society of America Journal, 60, 734±739.
Lu, J. Y. and Khan, M. J. 1992. `Uniqueness of transport capacity of uniform and graded sediment under rainfall', In Larsen, P.and Eisenhauer, N. (Eds), Sediment Management: Proceedings of 5th International Symposium on River Sedimentation,Karlsruhe, Germany, 443±450.
Lu, J. Y., Cassol, E. A. and Moldenhauer, W. C. 1989. `Sediment transport relationships for sand and silt loam soils',Transactions of American Society of Agricultural Engineers, 36, 1923±1931.
Meyer, L. D. and Wischmeier, W. H. 1969. `Mathematical simulation of the process of soil erosion by water', Transactions ofAmerican Society of Agricultural Engineers, 12, 754±758, 762.
Meyer, L. D., Foster, G. R. and Romkens, M. J. M. 1975. `Source of soil eroded by water from upland slopes', in Present andprospective technology for predicting sediment yields and sources, US Department of Agriculture, Agricultural Research Service,Southern Region, New Orleans, Louisiana, ARS-S-40, 177±189.
Nearing, M. A., Foster, G. R., Lane, L. J. and Finkner, S.C. 1989. `A process-based soil erosion model for USDA-WaterErosion Prediction Project technology', Transactions of American Society of Agricultural Engineers, 32, 1587±1593.
Rose, C.W. 1985. `Developments in soil erosion and deposition models', Advances in Soil Science, 2, 1±63.Rose, C. W., Williams, J. R., Sander, G. C. and Barry, D. A. 1983. `A mathematical model of soil erosion and deposition
processes: I. Theory for a plane land element', Soil Science Society of America Journal, 47, 991±995.Zheng, F., Huang, C. and Norton, L.D. 1998. `Run-on water and sediment effects on erosion processes and sediment regimes',
Soil Science Society of America Journal, (submitted).
Copyright # 1999 John Wiley & Sons, Ltd. Earth Surf. Process. Landforms 24, 503±516 (1999)
C. HUANG ET AL.516