Embed Size (px)
Citation preview

Sediment Removal as aWater Management Strategy
2014 Sierra Water Workgroup Summit
June 13, 2014
Panel Overview• Introduction [Liz]
– The bill and preliminary coordination effort• Sedimentation basics [Minear]
• A planning tool to assess sediment removal [Yates]
• Evaluating sediment removal as one of a portfolio of strategies [Groves]
• SWWG project and outreach [Betancourt]• Discussion

Upper Watersheds
25 “Rim” watersheds delineated by land use and elevation
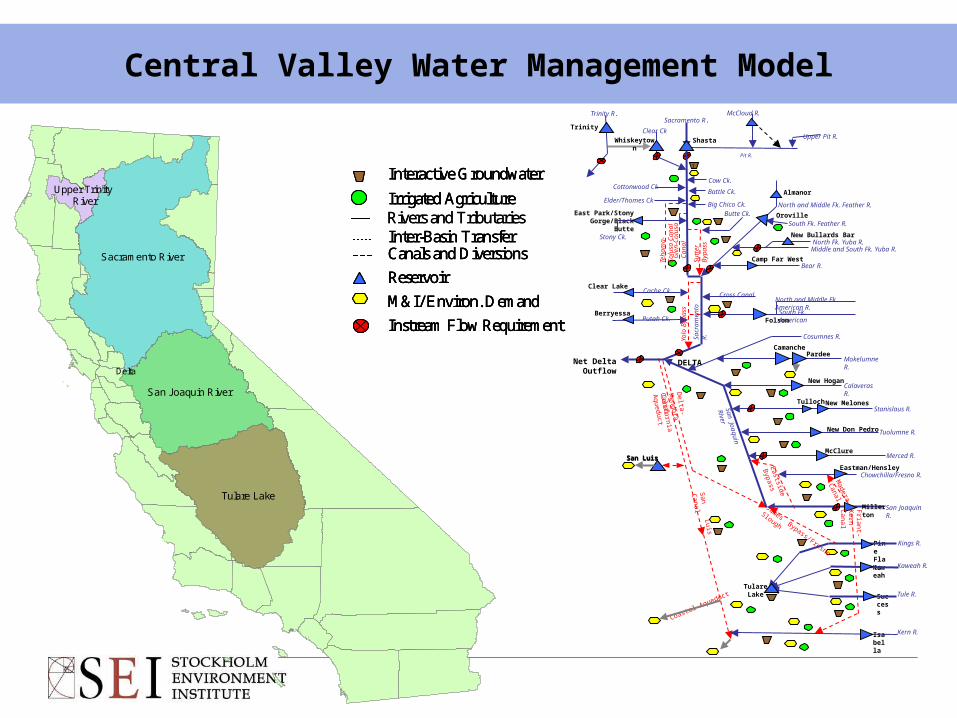
Central Valley Water Management Model
Rivers and TributariesIrrigated Agriculture
M&I/ Environ. Demand
Inter-Basin Transfer
Reservoir
Canals and Diversions
InstreamFlow Requirement
Interactive Groundwater
Rivers and TributariesIrrigated Agriculture
M&I/ Environ. Demand
Inter-Basin Transfer
Reservoir
Canals and Diversions
InstreamFlow Requirement
Interactive Groundwater
Irrigated Agriculture
M&I/ Environ. Demand
Inter-Basin Transfer
Reservoir
Canals and Diversions
InstreamFlow Requirement
Interactive Groundwater
Sacramento River
Tulare Lake
San Joaquin River
Upper Trinity River
Delta
Pit R.
Cow Ck.
Battle Ck.Cottonwood Ck
Shasta
Trinity R.
Clear Ck
OrovilleSouth Fk. Feather R.
Almanor
Big Chico Ck.Butte Ck.
Elder/Thomes Ck
East Park/Stony Gorge/Black Butte
Cache Ck.
New Bullards BarNorth Fk. Yuba R.
Bear R.
Folsom
Cross CanalNorth and Middle Fk. American R.
North and Middle Fk. Feather R.
Upper Pit R.
McCloud R.
1
Net Delta Outflow
Stanislaus R.
San Luis
San Joaquin R.
Delta-M
endota
Canal
Camp Far West
Mokelumne R.
Calaveras R.
Tuolumne R.
Merced R.
San Joaquin
River
Chowchilla/Fresno R.
Madera
Canal
Eastside
Bypass
Millerton
McClure
New Don Pedro
New Melones
New Hogan
Pardee
Putah Ck.
Yolo
Byp
ass South Fk. AmericanBerryessa
Clear Lake
Stony Ck.
Sacr
amen
to R
.
TrinitySacramento R.
Teha
ma-
Colu
sa
Cana
l Middle and South Fk. Yuba R.
Sutt
er
Byp
ass
Gle
n-Co
lusa
Ca
nal
Whiskeytown
Camanche
Cosumnes R.
California
Aqueduct
Tulloch
Eastman/Hensley
DELTA
San Luis
Friant-Kern
Canal
San Luis Canal
Kings R.Pine Flats
Kern R.Isabella
Tule R.Success
Kaweah R.Kaweah
James
Bypass/Fresno
Slough
TulareLake
Coastal Aqueduct
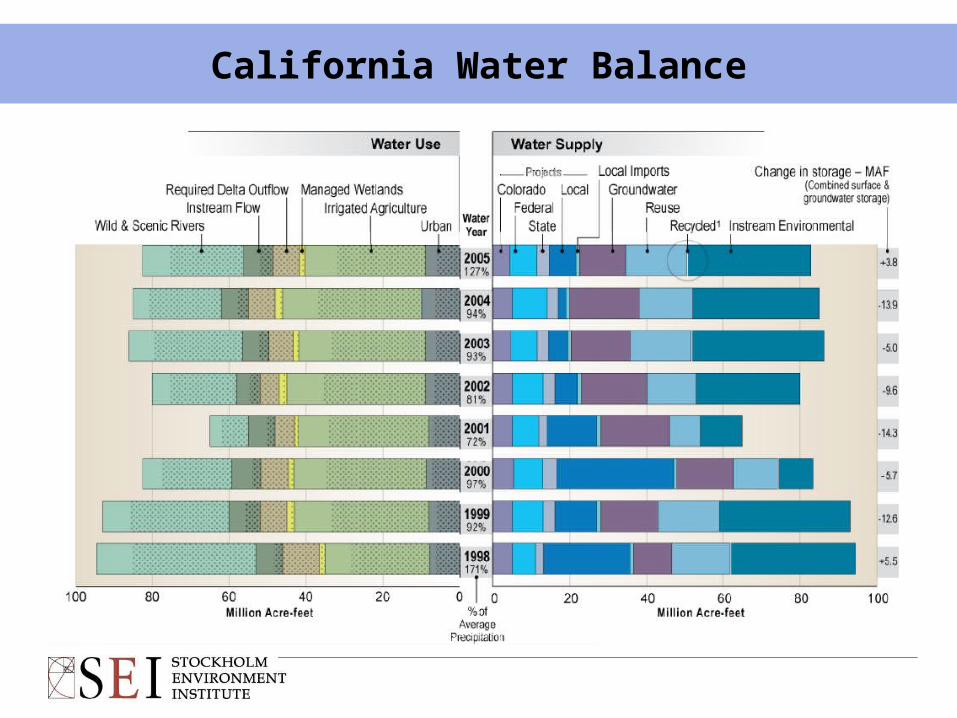
California Water Balance
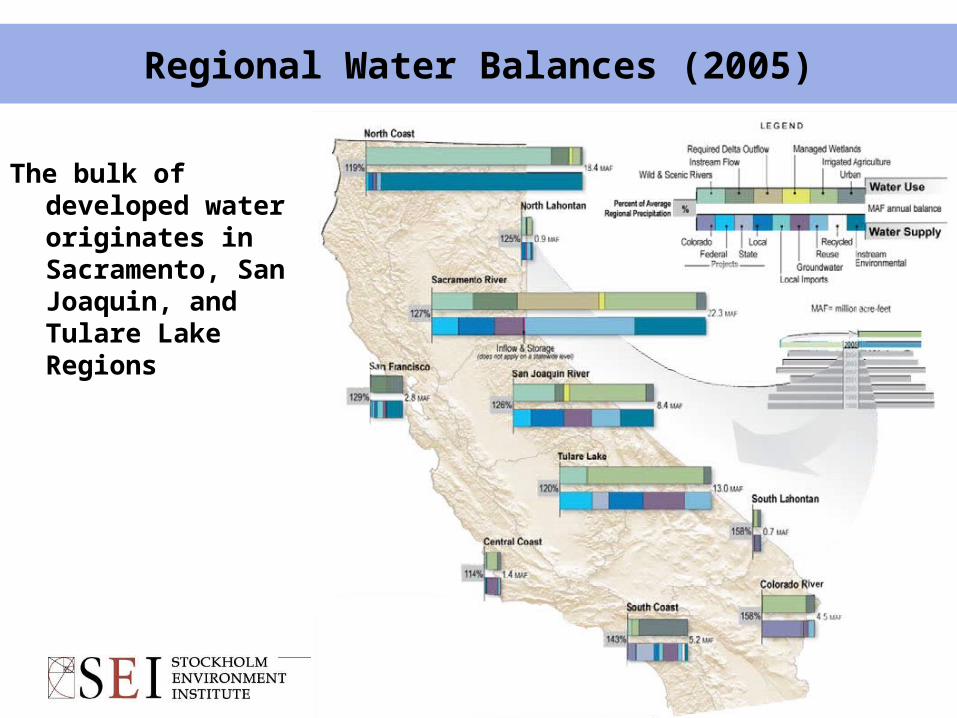
Regional Water Balances (2005)
The bulk of developed water originates in Sacramento, San Joaquin, and Tulare Lake Regions
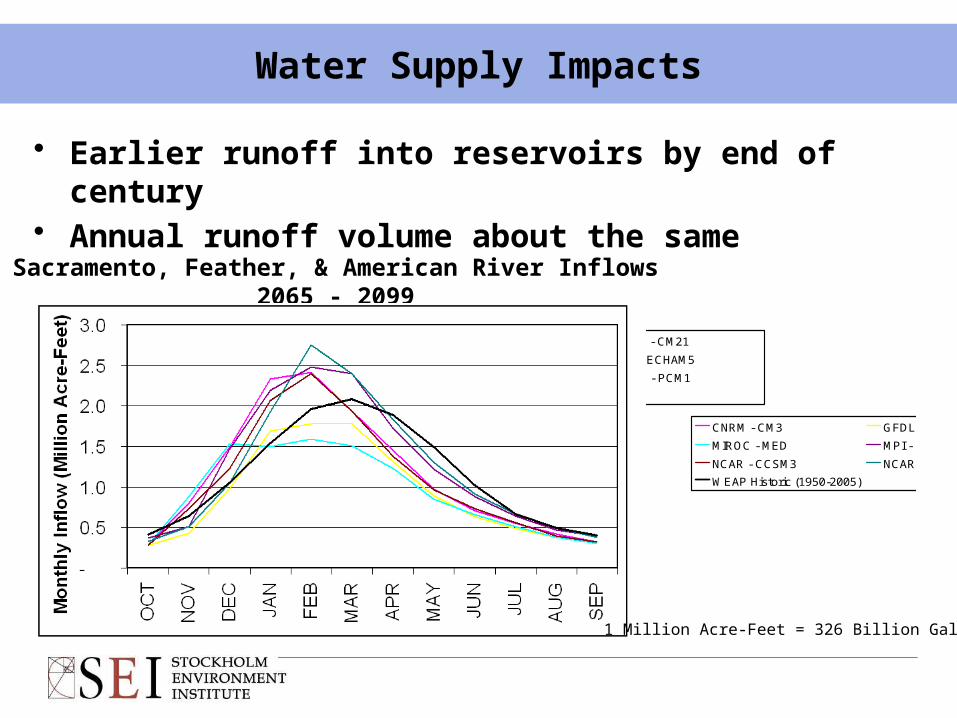
Sacramento, Feather, & American River Inflows2065 - 2099
Water Supply Impacts
• Earlier runoff into reservoirs by end of century• Annual runoff volume about the same
1.50
2.00
2.50
3.00
CNRM - CM3 GFDL - CM21
MIROC - MED MPI - ECHAM5
NCAR - CCSM3 NCAR - PCM1
WEAP Historic (1950-2005)
1.50
2.00
2.50
3.00
CNRM - CM3 GFDL - CM21
MIROC - MED MPI - ECHAM5
NCAR - CCSM3 NCAR - PCM1
WEAP Historic (1950-2005)
1 Million Acre-Feet = 326 Billion Gallons
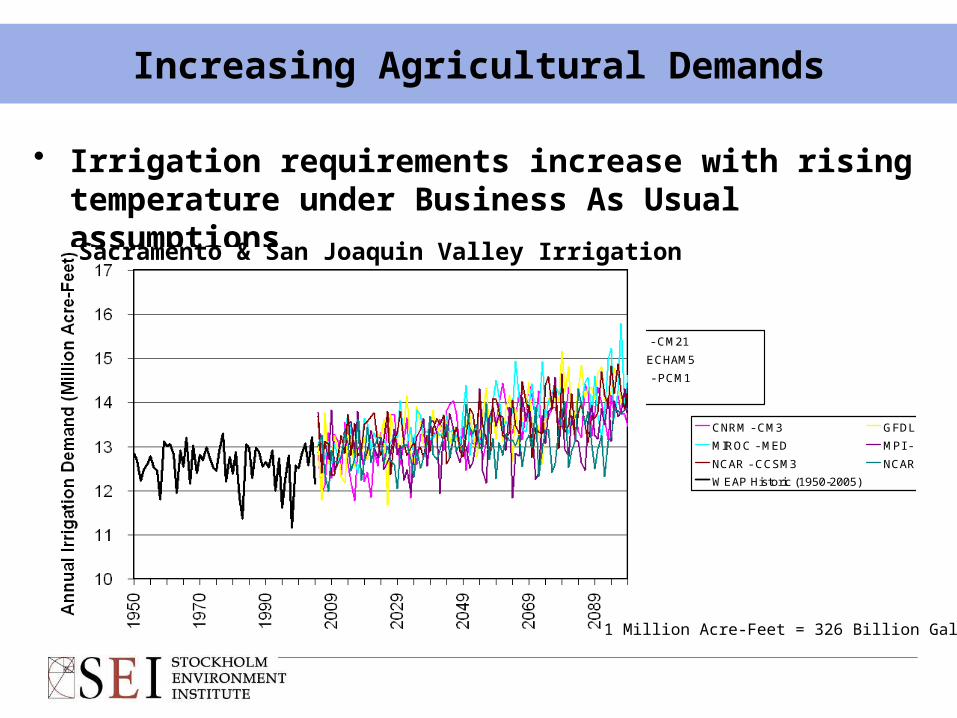
• Irrigation requirements increase with rising temperature under Business As Usual assumptions
Sacramento & San Joaquin Valley Irrigation
Increasing Agricultural Demands
1 Million Acre-Feet = 326 Billion Gallons
1.50
2.00
2.50
3.00
CNRM - CM3 GFDL - CM21
MIROC - MED MPI - ECHAM5
NCAR - CCSM3 NCAR - PCM1
WEAP Historic (1950-2005)
1.50
2.00
2.50
3.00
CNRM - CM3 GFDL - CM21
MIROC - MED MPI - ECHAM5
NCAR - CCSM3 NCAR - PCM1
WEAP Historic (1950-2005)

Zooming in to a regional Application
Mehta et al, 2011 “Potential Impacts on Hydrology and Hydropower Production Under Climate Warming of the Sierra Nevada.” Journal of Water and Climate Change 2, no. 1 (March 2011): 29. doi:10.2166/wcc.2011.054.

Example Output: New Bullards Bar Storage, Upstream Flows
Observed and Modeled Reservoir VolumeReservoir: New Bullards Bar, Weekly Average WY 1982-2012
Observed Volume Model Volume
Oct 7 Oct 21 Nov 4 Nov 18 Dec 2 Dec 16 Dec 31 Jan 14 Jan 28 Feb 11 Feb 25 Mar 11 Mar 25 Apr 8 Apr 22 May 6 May 20 Jun 3 Jun 17 Jul 1 Jul 15 Jul 29 Aug 12 Aug 26 Sep 9 Sep 23
Thou
sand
Acr
e-fo
ot
900
850
800
750
700
650
600
550
500
450
400
350
300
250
200
150
100
50
0
Streamflow Weekly Average WY 1982-2012, Yuba River North Fork
Modeled flow Observed Flow N YUBA 11413000
Oct 7 Oct 21 Nov 4 Nov 18 Dec 2 Dec 16 Dec 31 Jan 14 Jan 28 Feb 11 Feb 25 Mar 11 Mar 25 Apr 8 Apr 22 May 6 May 20 Jun 3 Jun 17 Jul 1 Jul 15 Jul 29 Aug 12 Aug 26 Sep 9 Sep 23
Cub
ic F
eet
per
Seco
nd
1,900
1,800
1,700
1,600
1,500
1,400
1,300
1,200
1,100
1,000
900
800
700
600
500
400
300
200
100
0

Example Output: Applied Irrigation Water

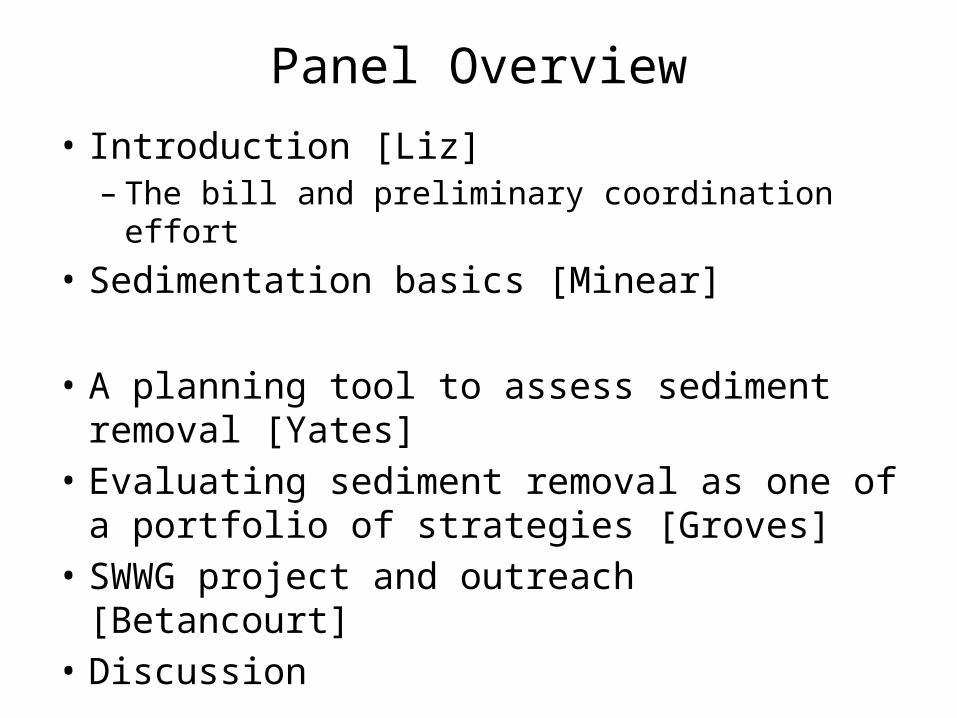
Example Output: Annual Hydropower
Hydropower GenerationScenario: ReferenceClimAnom, All weeks (52)
Narrows 2 Ph Narrows 1 Ph Colgate Ph
1982 1983 1984 1985 1986 1987 1988 1989 1990 1991 1992 1993 1994 1995 1996 1997 1998 1999 2000 2001 2002 2003 2004 2005 2006 2007 2008 2009 2010 2011 2012
Mill
ion
Meg
awat
t-H
our
3.0
2.8
2.6
2.4
2.2
2.0
1.8
1.6
1.4
1.2
1.0
0.8
0.6
0.4
0.2
0.0

THANK YOU
Evaluating Sediment Removal as Part of A Water Management Portfolio
• Recap Central Valley vulnerability and response option analysis for California Water Plan Update 2013
• Approach for incorporating sediment removal as a strategy

Slide 15
California Water Plan analysis looks into the uncertain future…
• How vulnerable is California’s water management system?
• How can the water managementcommunity reduce these vulnerabilities?
• Builds on the scenario analysis begun for California Water Plan 2005 Update
• Focuses on Central Valley
• Evaluates plausible futures out to 2050
• Uses new data and tools
South Lahontan
North Coast
Sacramento River
Tulare Lake
Colorado RiverSouth Coast
San Joaquin River
Central Coast
North Lahontan
San Francisco Bay
Upp
er T
rinity
Slide 16
Nine land use scenarios reflect uncertain population growth and land use patters
• Three population projections for the Central Valley– Low population: 11 million habitants – Current trends: 13 million habitants– High population: 16 million habitants
• Three urban density scenarios– Low: More single family homes, less irrigated
agricultural land– Current – High: More multi family homes, more irrigated
agricultural land
Slide 17
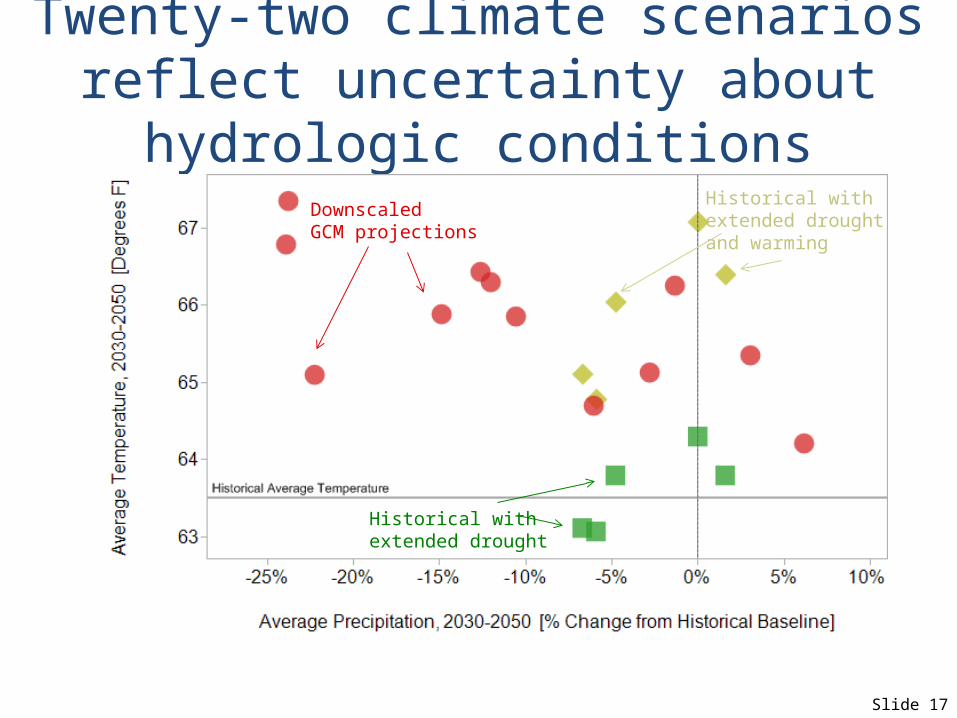
Twenty-two climate scenarios reflect uncertainty about
hydrologic conditionsDownscaledGCM projections
Historical withextended drought
Historical withextended drought and warming
Slide 18
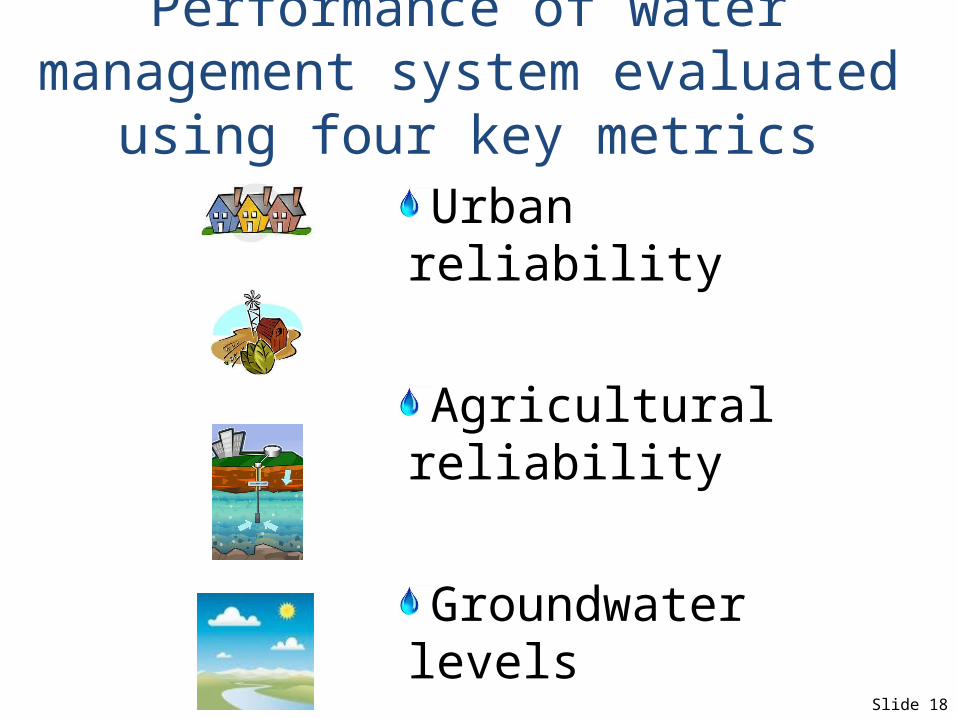
Performance of water management system evaluated
using four key metricsUrban reliability
Agricultural reliability
Groundwater levels
Environmental flows

Slide 19
Which management strategies can reduce these vulnerabilities?
Urban water use efficiency
Agricultural water use efficiency
Recycled municipal water
Conjunctive management
New environmental flow targets
Groundwater recovery targets
New surface storage
Sediment removal

Slide 20
How would sedimentremoval stack up?
• Sierra-wide assessment– How much sediment would need to be
removed to affect state-wide water objectives under climate change?
– What costs would be acceptable?
• Watershed assessment– Develop refined WEAP model of specific
watershed and operations– Evaluate broader range of uncertainties
and objectives20

Slide 21
SWWG Project - Overview• Based on SWWG structure –
IRWM-focus
• IRWM-based outreach– Regional groups (SNA, SNC, SBA,
MCWRA, etc.)– RWMGs– Interest-groups– Individuals
Slide 22
SWWG Project – Phased Approach
• Phase I– Outreach– Data gathering with dam
owners/managers– Screening-level analysis– Assessment of impact on regional and
statewide water resources management
– Identification of target detail area, based on:
• Interest of stakeholders• Results of assessment

Slide 23
SWWG Project – Phased Approach
• Phase II– Focus on specific
watershed/storage system• Based on stakeholder interest and
outcome of assessment
– Discuss and assess specific benefits:
• On a regional and statewide basis• Response to climate change and other
future uncertainty• General feasibility assessment:
cost/benefit
Slide 24
Discussion Questions
1. What critical uncertainties would affect sediment removal as a strategy?
2. What metrics should be used to evaluate sediment removal?
3. What more do we need to know?