Embed Size (px)
Citation preview

Sediment Loading from Crab Creek and Other Sources to Moses Lake, Washington, 2007 and 2008
Scientific Investigations Report 2010–5001
Prepared in cooperation with the Bureau of Reclamation
U.S. Department of the InteriorU.S. Geological Survey

Cover: Aerial photograph of Moses Lake, Washington, and the surrounding area. Image source: USDA-APFO National Agricultural Inventory Project, 2005.

Sediment Loading from Crab Creek and Other Sources to Moses Lake, Washington, 2007 and 2008
By Christopher S. Magirl, Stephen E. Cox, Mark C. Mastin, and Raegan L. Huffman
Prepared in cooperation with the Bureau of Reclamation
Scientific Investigations Report 2010–5001
U.S. Department of the InteriorU.S. Geological Survey

U.S. Department of the InteriorKEN SALAZAR, Secretary
U.S. Geological SurveyMarcia K. McNutt, Director
U.S. Geological Survey, Reston, Virginia: 2010
For more information on the USGS—the Federal source for science about the Earth, its natural and living resources, natural hazards, and the environment, visit http://www.usgs.gov or call 1-888-ASK-USGS
For an overview of USGS information products, including maps, imagery, and publications, visit http://www.usgs.gov/pubprod
To order this and other USGS information products, visit http://store.usgs.gov
Any use of trade, product, or firm names is for descriptive purposes only and does not imply endorsement by the U.S. Government.
Although this report is in the public domain, permission must be secured from the individual copyright owners to reproduce any copyrighted materials contained within this report.
Suggested citation:Magirl, C.S., Cox, S.E., Mastin, M.C., and Huffman, R.L., 2010, Sediment loading from Crab Creek and other sources to Moses Lake, Washington, 2007 and 2008: U.S. Geological Survey Scientific Investigations Report 2010-5001, 20 p.
iii
Contents
Abstract ..........................................................................................................................................................1Introduction ....................................................................................................................................................1
Purpose and Scope ..............................................................................................................................4Previous Studies ...................................................................................................................................4
Description of Study Area ............................................................................................................................4Moses Lake ............................................................................................................................................4Crab Creek..............................................................................................................................................5Sediment Sources into Moses Lake ..................................................................................................6
Methods...........................................................................................................................................................6Suspended-Sediment Sampling .........................................................................................................7Calculating Fluvial Sediment Loads ...................................................................................................8Lakebed Coring and Analysis .............................................................................................................8
Fluvial Sediment Load in Channels Feeding Moses Lake .......................................................................9Eolian Inputs .................................................................................................................................................13Lakebed Accumulation ...............................................................................................................................13Implications for Sedimentation from Crab Creek Bypass .....................................................................17Summary and Conclusions .........................................................................................................................18Acknowledgments .......................................................................................................................................18References Cited..........................................................................................................................................18
iv
Figures Figure 1. Map showing locations of surface-water sampling sites, Moses Lake, and Crab
Creek, Washington ……………………………………………………………… 2 Figure 2. Map showing locations of the sediment core sites, stream-gaging stations, and
three prominent branches of Moses Lake, Washington ………………………… 3 Figure 3. Graph showing annual peak streamflow for U.S. Geological Survey
stream-gaging station 12467000, Crab Creek near Moses Lake, Washington, for the period of record, 1943–2008 …………………………………………………… 6
Figure 4. Photographs of vesiculated Mount St. Helens ash shards shown under plane polarized light and with crossed polarized light ………………………………… 9
Figure 5. Graph showing suspended-sediment load as a function of discharge measured at six sampling sites near Moses Lake, Washington, 2007 and 2008 ……………… 11
Figure 6. Graph showing comparison of suspended-sediment load as a function of discharge with historical suspended-sediment load in central and southeastern Washington, October 2007–October 2008 ………………………………………… 11
Figure 7. Graph showing estimated annual sediment load from Crab Creek into Moses Lake, Washington, calculated using a regression equation, water years 1943–2008 …………………………………………………………………… 12
Figure 8. Map showing locations of sediment core samples and depth of sediment accumulation since the 1980 eruption of Mount St. Helens, Moses Lake, Washington ……………………………………………………………………… 15
Tables Table 1. Suspended-sediment sampling sites near Moses Lake, Washington …………… 7 Table 2. Suspended-sediment data collected near Moses Lake, Washington,
October 2007–October 2008 ……………………………………………………… 10 Table 3. Characteristics of sediment core samples collected from Moses Lake,
Washington, July and August 2008 ……………………………………………… 14

v
Conversion Factors and Datums
Conversion Factors
Inch/Pound to SI
Multiply By To obtain
Length
inch (in.) 2.54 centimeter (cm)foot (ft) 0.3048 meter (m)mile (mi) 1.609 kilometer (km)
Area
acre 0.4047 hectare (ha)square mile (mi2) 2.590 square kilometer (km2)
Volume
cubic yard per year (yd3/yr) 0.7646 cubic meter per year (m3/yr)
Flow rate
foot per year (ft/yr) 0.3048 meter per year (m/yr)cubic foot per second (ft3/s) 0.02832 cubic meter per second (m3/s)inch per year (in/yr) 25.4 millimeter per year (mm/yr)mile per hour (mi/h) 1.609 kilometer per hour (km/h)
Mass
pound, avoirdupois (lb) 0.4536 kilogram (kg) ton, short (2,000 lb) 0.9072 megagram (Mg) ton per day (ton/d) 0.9072 metric ton per dayton per year (ton/yr) 0.9072 metric ton per year
Pressure
pound per square foot (lb/ft2) 0.04788 kilopascal (kPa)
Density
pound per cubic foot (lb/ft3) 16.02 kilogram per cubic meter (kg/m3)
SI to Inch/Pound
Multiply By To obtain
Length
centimeter (cm) 0.3937 inch (in.)
vi
Temperature in degrees Fahrenheit (°F) may be converted to degrees Celsius (°C) as follows:
°C=(°F-32)/1.8.
Concentrations of chemical constituents in water are given either in milligrams per liter (mg/L) or micrograms per liter (µg/L).
Datums
Horizontal coordinate information is referenced to the North American Datum of 1983 (NAD 83).
Vertical coordinate information is referenced to the National Geodetic Vertical Datum of 1929 (NGVD 29).
Altitude, as used in this report, refers to distance above the vertical datum.
Conversion Factors and Datums—Continued
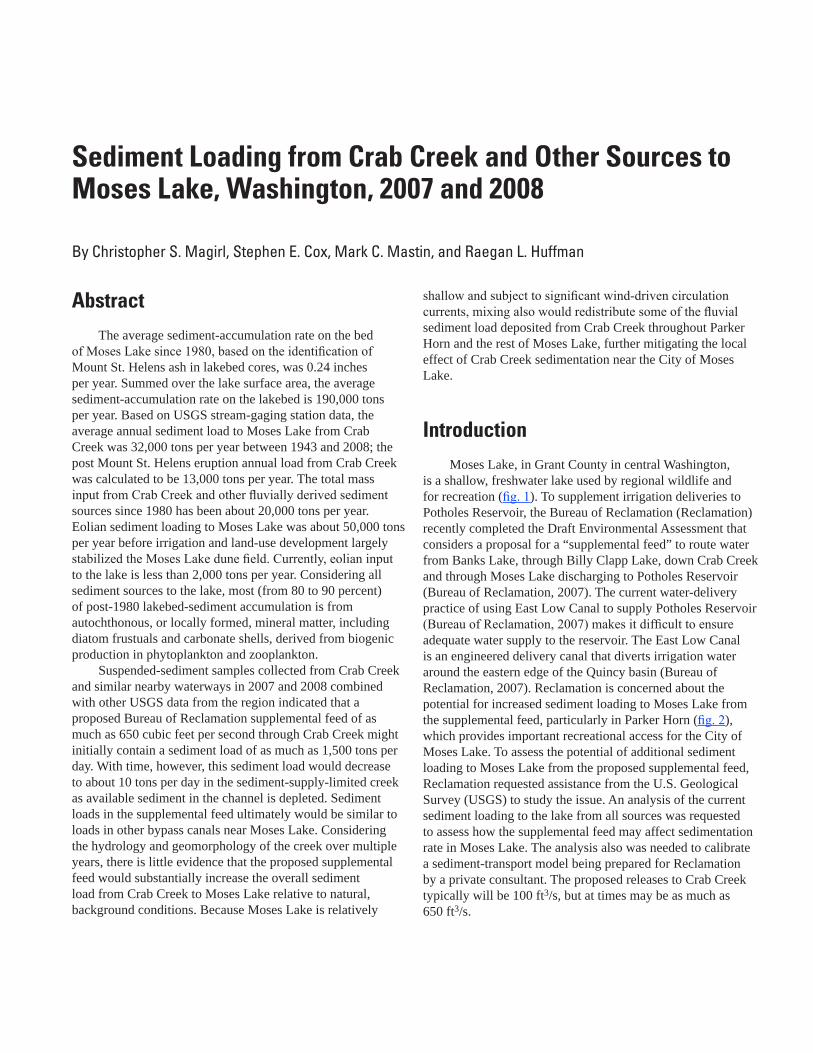
Abstract The average sediment-accumulation rate on the bed
of Moses Lake since 1980, based on the identification of Mount St. Helens ash in lakebed cores, was 0.24 inches per year. Summed over the lake surface area, the average sediment-accumulation rate on the lakebed is 190,000 tons per year. Based on USGS stream-gaging station data, the average annual sediment load to Moses Lake from Crab Creek was 32,000 tons per year between 1943 and 2008; the post Mount St. Helens eruption annual load from Crab Creek was calculated to be 13,000 tons per year. The total mass input from Crab Creek and other fluvially derived sediment sources since 1980 has been about 20,000 tons per year. Eolian sediment loading to Moses Lake was about 50,000 tons per year before irrigation and land-use development largely stabilized the Moses Lake dune field. Currently, eolian input to the lake is less than 2,000 tons per year. Considering all sediment sources to the lake, most (from 80 to 90 percent) of post-1980 lakebed-sediment accumulation is from autochthonous, or locally formed, mineral matter, including diatom frustuals and carbonate shells, derived from biogenic production in phytoplankton and zooplankton.
Suspended-sediment samples collected from Crab Creek and similar nearby waterways in 2007 and 2008 combined with other USGS data from the region indicated that a proposed Bureau of Reclamation supplemental feed of as much as 650 cubic feet per second through Crab Creek might initially contain a sediment load of as much as 1,500 tons per day. With time, however, this sediment load would decrease to about 10 tons per day in the sediment-supply-limited creek as available sediment in the channel is depleted. Sediment loads in the supplemental feed ultimately would be similar to loads in other bypass canals near Moses Lake. Considering the hydrology and geomorphology of the creek over multiple years, there is little evidence that the proposed supplemental feed would substantially increase the overall sediment load from Crab Creek to Moses Lake relative to natural, background conditions. Because Moses Lake is relatively
Sediment Loading from Crab Creek and Other Sources to Moses Lake, Washington, 2007 and 2008
By Christopher S. Magirl, Stephen E. Cox, Mark C. Mastin, and Raegan L. Huffman
shallow and subject to significant wind-driven circulation currents, mixing also would redistribute some of the fluvial sediment load deposited from Crab Creek throughout Parker Horn and the rest of Moses Lake, further mitigating the local effect of Crab Creek sedimentation near the City of Moses Lake.
Introduction Moses Lake, in Grant County in central Washington,
is a shallow, freshwater lake used by regional wildlife and for recreation (fig. 1). To supplement irrigation deliveries to Potholes Reservoir, the Bureau of Reclamation (Reclamation) recently completed the Draft Environmental Assessment that considers a proposal for a “supplemental feed” to route water from Banks Lake, through Billy Clapp Lake, down Crab Creek and through Moses Lake discharging to Potholes Reservoir (Bureau of Reclamation, 2007). The current water-delivery practice of using East Low Canal to supply Potholes Reservoir (Bureau of Reclamation, 2007) makes it difficult to ensure adequate water supply to the reservoir. The East Low Canal is an engineered delivery canal that diverts irrigation water around the eastern edge of the Quincy basin (Bureau of Reclamation, 2007). Reclamation is concerned about the potential for increased sediment loading to Moses Lake from the supplemental feed, particularly in Parker Horn (fig. 2), which provides important recreational access for the City of Moses Lake. To assess the potential of additional sediment loading to Moses Lake from the proposed supplemental feed, Reclamation requested assistance from the U.S. Geological Survey (USGS) to study the issue. An analysis of the current sediment loading to the lake from all sources was requested to assess how the supplemental feed may affect sedimentation rate in Moses Lake. The analysis also was needed to calibrate a sediment-transport model being prepared for Reclamation by a private consultant. The proposed releases to Crab Creek typically will be 100 ft3/s, but at times may be as much as 650 ft3/s.

2 Sediment Loading from Crab Creek and Other Sources to Moses Lake, Washington, 2007 and 2008
tac09-0413_fig01 Basemap location
I-90
I-90
Spok
ane
Eph
rata
Grand Coulee
Pullm
an
Con
nell
Oth
ello
Dav
enpo
rt
Hoo
per
Ritz
ville
Mos
es L
ake
Qui
ncy
Bas
in
Ephr
ata
Fan
Mos
es
Lake
Ban
ks
Lake
Bro
ok L
akeB
illy
Cla
pp
Lake
Poth
oles
Res
ervo
ir
Palo
use
R
CrRocky
Roc
ky C
oule
eW
aste
way
Eas
t Low
C
anal
Crab
Cre
ek
Crab Creek
L
ower
Cra
b
C
reek
Ford
Gran
tA
dam
sW
hitm
an
Fran
klin
Bent
on
Linc
oln
Spok
ane.
Wal
laW
alla
Colu
mbi
a
Garf
ield
EX
PLA
NAT
ION
1335
1000
Hyd
rolo
gic
unit
code
(HU
C) 8
Surf
ace-
wat
er sa
mpl
ing
site
and
stat
ion
num
ber
WAS
HIN
GTON
Mos
esLa
ke
Figu
relo
catio
n
Figu
re 2
lo
catio
n
1335
1000
1246
4770
1246
7200
1246
7200
1246
6020
1247
1003
1247
1002
1247
0500
1246
6020
1247
1003
1247
1002
1247
0620
1246
7000
1246
7000
1247
0500
118˚
120˚
47˚3
0' 47˚
46˚3
0'
010
2030
4050
MIL
ES
010
2030
4050
KIL
OMET
ERS
U.S.
Geol
ogic
al S
urve
y di
gita
l dat
a 1:
100,
000,
UTM
zone
11,
Nor
th A
mer
ican
Dat
um o
f 198
3 (N
AD83
)U.
S.Ge
olog
ical
Sur
vey
Nat
iona
l Ele
vatio
n Da
tase
t (N
ED) 2
000,
UTM
zone
11,
NAD
83
Figu
re 1
. Lo
catio
ns o
f sur
face
-wat
er s
ampl
ing
site
s, M
oses
Lak
e, a
nd C
rab
Cree
k, W
ashi
ngto
n.

Introduction 3
tac09-0413_fig02 Core & SW site location
PotholesReservoir
Park
erPe
lican
Rocky Ford Arm
Horn
Horn
Mos
esLa
ke
Crab Creek Rocky Ford Creek
O
IHG
F
C
E
B
K
J
NM
DA, L
P
Q
R
12467000
Moses Lake Dune Field
12467200
12471003
12471002
12470620
12471002
EXPLANATIONSediment core sample site with an identifier
Stream-gaging station and no.
E
Moses Lake
USGS digital data 1:100,000, UTM zone 11, NAD83USGS National Elevation Dataset (NED) 2000, UTM zone 11, NAD83
0 3 MILES1 2
0 3 KILOMETERS1 2
SR17
SR17
SR171
I-90
47˚10'
47˚05'
119°15'119°20'119°25'
Figure 2. Locations of the sediment core sites, stream-gaging stations, and three prominent branches of Moses Lake, Washington.

4 Sediment Loading from Crab Creek and Other Sources to Moses Lake, Washington, 2007 and 2008
Purpose and Scope
This report presents an analysis of the current (2009) and historical rates of sediment loading to Moses Lake. The specific goals of the study are to: (1) review the sources and trends of sediment deposition in Moses Lake, beginning when the first irrigation water from the Columbia Basin Project began to flow in the early 1950s; (2) estimate the relative amount of sediment loading from Crab Creek to Moses Lake compared to other sources of sedimentation to the lake; (3) estimate the instantaneous suspended-sediment loading from Crab Creek to Moses Lake for the range of discharges anticipated with the supplemental feed; and (4) assess the potential for the proposed Crab Creek supplemental feed, to increase sediment deposition in upper Parker Horn, relative to natural flow conditions.
Previous Studies
Although few studies have investigated the specific question of delivery of sediment load from Crab Creek to Moses Lake, some useful data are available. From 1992 to present (2009), periodic suspended-sediment measurements have been made in the upper catchment at USGS stream-gaging station 12464770, Crab Creek at Rocky Ford Road near Ritzville, under the USGS National Water-Quality Assessment (NAWQA) Program. These data are available from the National Water Information System (NWIS) at http://waterdata.usgs.gov/nwis. Additionally, the suspended-sediment record (1961–2004) was used from USGS stream-gaging station 13351000, Palouse River at Hooper. Although the Palouse River is outside the immediate study area, it is geomorphically and hydrologically similar to Crab Creek and represents a regional analog. These sediment-load datasets were used to augment the limited suspended-sediment data collected during the current study.
Working with the environmental consulting firm, CH2M HILL, Reclamation released a test discharge of 145 ft3/s from Billy Clapp Lake through the Crab Creek supplemental-feed route in October 2006. Discharge and sediment samples were collected at 11 locations along Crab Creek (Bureau of Reclamation, 2007). At the sampling site near the upper end of the study reach, the total suspended solids (TSS) concentration was 43 mg/L at a discharge of 91 ft3/s. At the sampling site at Road 7, co-located with USGS stream-gaging station 12467000, Crab Creek near Moses Lake. Reclamation determined that TSS was 7 mg/L at a discharge of 86.3 ft3/s. There can be a significant difference between TSS and suspended-sediment concentration for common samples, as determined by USGS laboratories, therefore, direct comparison of values can be difficult (Glysson and Gray, 2002). Reclamation data, therefore, were not used in the sediment-load calculations for this report, but the data are provided as a qualitative comparison.
Water quality and limnology of Moses Lake have been studied by the University of Washington (Welch and others, 1989), the Washington State Department of Ecology (Carroll and others, 2000; Carroll, 2006), and other investigators. Sediment accumulation rate in the lake, however, has received relatively little attention.
Description of Study AreaCrab Creek is a small, perennial creek flowing
through the arid and semiarid Columbia Plateau in central Washington. Crab Creek and Moses Lake lie within the Channeled Scablands of east-central Washington, a complex of anastomosing bedrock channels, rock basins, broad coarse-grained alluvial deposits, and loess islands created by a series of cataclysmic Pleistocene megafloods (Baker, 2008). The floods originated from the margins of the Cordilleran Ice Sheet, particularly Lake Missoula in Montana (Bretz, 1927) and, where focused into high-energy channels, scoured prominent pathways into the base geology of the Columbia River Basalt Group (Baker, 1973). Crab Creek flows through one of these scoured pathways. Grand Coulee is another channel where large volumes of flowing water scoured a channel about 1 mi wide. As the flood waters debouched from Grand Coulee and entered the Quincy basin, a structurally controlled depression in central Washington, flood-entrained sediment dropped from suspension and bedload, thereby emplacing the alluvial Ephrata Fan. The Ephrata Fan is composed of boulders and larger clasts at its northern extent near Grand Coulee and fines progressively southward from boulders to sands and finer material (Baker, 1973; Bandfield and others, 2002).
Moses Lake
Moses Lake is a shallow, elongated-branched lake in the Quincy basin, formed naturally by damming from the Moses Lake dune field; the dune field, in turn, was formed by eolian reworking of the outburst-flood deposits at the distal end of the Ephrata Fan (Bandfield and others, 2002). The lake lies in topographically lower channels incised into the southern extent of the Ephrata Fan and is made up of three prominent branches (fig. 2). Rocky Ford Arm is the longest branch and drains the outlet of Rocky Ford Creek at the northern extent of the lake. Parker Horn is the middle branch of the lake draining Crab Creek, and Pelican Horn is the southern-most branch with little surface-water input.
The pre-development elevation of the lake surface was about 1,028 ft. Early observations indicated that Moses Lake was fed by Crab Creek and that the lake was stagnant, alkaline, and, “unfit for any use” (Symons, 1882). The elevation of the lake reportedly increased by approximately
Description of Study Area 5
10 ft starting with early western development, then stabilized at about 1,038 ft by construction of a dam built around 1910 (Wolcott, 1973). The original dam failed and was subsequently replaced by the current outlet structures of Reclamation’s Columbia Basin Project. Lake-surface elevation is shown as 1,038 ft on the USGS 15-minute Moses Lake quadrangle maps of 1910 and 1949. A later (approximately 1956) edition of the map, following the initial construction of the Columbia Basin Project infrastructure, shows the lake elevation as 1,046 ft. The current lake outlet control structures maintain lake elevation at 1,046 ft during most of the year, although the lake water surface is often lowered 3–5 ft during winter.
The lake is used by Reclamation to convey water from the East Low Canal to Potholes Reservoir. The lake is shallow with an average depth of 18 ft and a maximum depth of 38 ft under full-pool conditions. The surface area of the lake is 6,800 acres.
During the 1960s and 1970s, water quality in Moses Lake was substantially affected by excess nutrient input derived from groundwater inflow and sewage treatment facilities. The lake was classified as hypereutrophic with phospate levels exceeding 50 µg/L (Welch and others, 1989). Restoration of lake water quality has been partially accomplished by the addition of dilution water at the rate of 287 ft3/s through Crab Creek beginning in 1977 (Welch and others, 1989). This water is not supplied every year, however, due to operational infrastructure limitations and (or) legal constraints. Reclamation provides dilution water on an “as available” basis, primarily when there is a need for additional water in the southern part of the Columbia Basin Project (Pitz, 2003).
Crab Creek
The section of Crab Creek upstream of Moses Lake (fig. 1) follows one of the anastomosing branches of the Channeled Scablands. In the section upstream of Brook Lake, Crab Creek follows an outburst flood coulee flowing over fractured, basaltic bedrock mantled with alluvium. Between Brook Lake and Moses Lake, Crab Creek follows the eastern edge of the Ephrata Fan, flowing on or adjacent to exposed bedrock as well as over the coarser substrate of the fan. Some of the surrounding catchment draining into Crab Creek, particularly in the upper watershed, is composed of topographically higher terraces of the Palouse Formation, Quaternary loess deposits that escaped scour and removal by the Lake Missoula floods. Although recruitment of suspended sediment into Crab Creek from the bedrock valley floor and the coarse-grained fan deposits is governed by weathering rates from otherwise immobile surfaces, more fine-grained sediment is presumably supplied by the Palouse Formation uplands when rainfall or snowmelt create runoff.
Annual rainfall in the Crab Creek basin draining into Moses Lake ranges from 7 to 16 in/yr (Mastin, 2009). Land use in the basin is predominantly agricultural (about 45 percent) and shrub and herbaceous cover (about
40 percent). Open water, developed land, and forest each cover less than 5 percent. The contributing drainage area to station 12467000, Crab Creek at Moses Lake, is 2,200 mi2.
The reach of Crab Creek that may carry the supplemental feed begins at the outlet of Brook Lake and runs 28 mi downstream to Moses Lake. The average channel slope is 0.0013 ft/ft, and the reach includes wetlands with many small lakes and springs. These wetlands are partly fed with irrigation return flows and are a productive wildlife habitat.
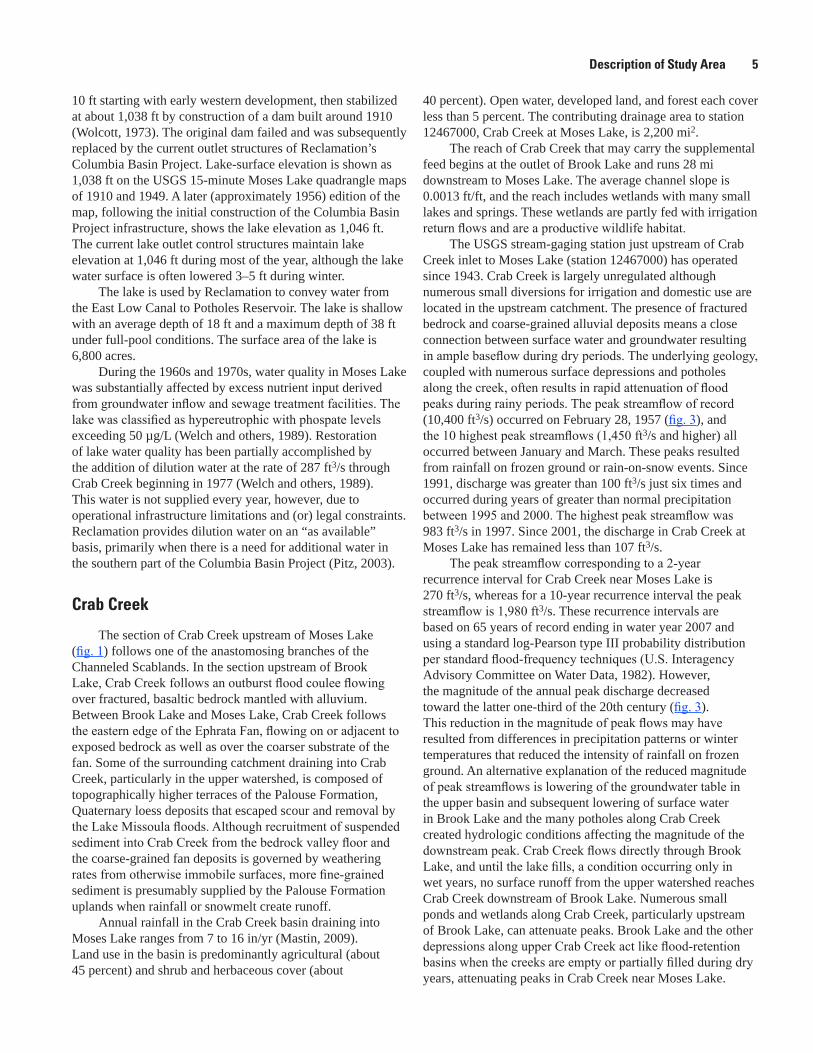
The USGS stream-gaging station just upstream of Crab Creek inlet to Moses Lake (station 12467000) has operated since 1943. Crab Creek is largely unregulated although numerous small diversions for irrigation and domestic use are located in the upstream catchment. The presence of fractured bedrock and coarse-grained alluvial deposits means a close connection between surface water and groundwater resulting in ample baseflow during dry periods. The underlying geology, coupled with numerous surface depressions and potholes along the creek, often results in rapid attenuation of flood peaks during rainy periods. The peak streamflow of record (10,400 ft3/s) occurred on February 28, 1957 (fig. 3), and the 10 highest peak streamflows (1,450 ft3/s and higher) all occurred between January and March. These peaks resulted from rainfall on frozen ground or rain-on-snow events. Since 1991, discharge was greater than 100 ft3/s just six times and occurred during years of greater than normal precipitation between 1995 and 2000. The highest peak streamflow was 983 ft3/s in 1997. Since 2001, the discharge in Crab Creek at Moses Lake has remained less than 107 ft3/s.
The peak streamflow corresponding to a 2-year recurrence interval for Crab Creek near Moses Lake is 270 ft3/s, whereas for a 10-year recurrence interval the peak streamflow is 1,980 ft3/s. These recurrence intervals are based on 65 years of record ending in water year 2007 and using a standard log-Pearson type III probability distribution per standard flood-frequency techniques (U.S. Interagency Advisory Committee on Water Data, 1982). However, the magnitude of the annual peak discharge decreased toward the latter one-third of the 20th century (fig. 3). This reduction in the magnitude of peak flows may have resulted from differences in precipitation patterns or winter temperatures that reduced the intensity of rainfall on frozen ground. An alternative explanation of the reduced magnitude of peak streamflows is lowering of the groundwater table in the upper basin and subsequent lowering of surface water in Brook Lake and the many potholes along Crab Creek created hydrologic conditions affecting the magnitude of the downstream peak. Crab Creek flows directly through Brook Lake, and until the lake fills, a condition occurring only in wet years, no surface runoff from the upper watershed reaches Crab Creek downstream of Brook Lake. Numerous small ponds and wetlands along Crab Creek, particularly upstream of Brook Lake, can attenuate peaks. Brook Lake and the other depressions along upper Crab Creek act like flood-retention basins when the creeks are empty or partially filled during dry years, attenuating peaks in Crab Creek near Moses Lake.

6 Sediment Loading from Crab Creek and Other Sources to Moses Lake, Washington, 2007 and 2008
In addition to Crab Creek, two other major waterways supply surface water to Moses Lake (fig. 1). The first waterway is Rocky Ford Creek, which drains into the northern branch of Moses Lake, is predominantly spring-fed, is supplemented with irrigation returns from groundwater, and is geomorphically similar to Crab Creek. The USGS operated stream-gaging station 12470500 on Rocky Ford Creek near Ephrata, from 1943 to 1991. The second waterway is Rocky Coulee Wasteway, which is an engineered canal that enters Crab Creek just upstream of Moses Lake. This wasteway primarily carries releases from the East Low Canal with some intermittent natural runoff from Rocky Coulee.
Sediment Sources into Moses Lake
During the past 50 years, sediment accumulated on the bed of Moses Lake from four primary sources. First, suspended sediment has been carried to the lake by fluvial processes, the bulk of which originates in the major tributaries feeding Moses Lake: Crab Creek, Rocky Coulee Wasteway, and Rocky Ford Creek (fig. 1). Second is eolian sediment of sand-sized and finer particles deposited directly in the lake. Third is autochthonous (or locally formed) sediment production from biologic processes inherent in the lake itself. Zooplankton and phytoplankton are numerous, and a significant part of lakebed material consists of organic material as well as silicates and carbonates produced by the
tac09-0413_fig03 Annual peak streamflow Crab creek
1940 1950 1960 1970 1980 1990 2000 2010
ANN
UAL
PEAK
STR
EAM
FLOW
, IN
CUB
IC F
EET
PER
SECO
ND
WATER YEAR
10
1
100
1,000
10,000
100,000
Figure 3. Annual peak streamflow for U.S. Geological Survey stream-gaging station 12467000, Crab Creek near Moses Lake, Washington, for the period of record, 1943–2008.
plankton. The fourth source of lakebed sediment is volcanic ash emplaced during the Mount St. Helens eruption in 1980. A primary focus of the current study is to evaluate and estimate the relative contributions of these four sediment sources to overall lakebed sediment accumulation.
MethodsIn addition to an analysis of data available in the
scientific literature, the USGS took suspended-sediment samples from the major channels flowing into and out of Moses Lake in order to estimate the current sediment loading to and from the lake. Combining these data with historical data collected in the basin enabled the construction of sediment-transport curves that were used to estimate sediment loading to Moses Lake for the range of anticipated supplemental feeds in Crab Creek. Eolian transport was not measured during the study, but was estimated from other eolian studies from the Columbian Plateau. Overall sediment deposition rate in the lake since 1980 was determined by identifying the Mount St. Helens ash layer in multiple sediment cores from the bottom of Moses Lake and calculating the deposition rate. Finally, comparing sedimentation estimates based on lakebed cores with estimates of fluvial and eolian loads allowed the calculation of the relative contribution of each sedimentation source.

Methods 7
Suspended-Sediment Sampling
Suspended-sediment samples were collected at six locations in the study area (fig. 1; table 1). One location was at USGS stream-gaging station 12466020, Crab Creek above Brook Lake, at Highway 28 near Stratford. This sampling site is just upstream of where the supplemental feed will enter Crab Creek. Three sampling locations at USGS stream-gaging stations were on the major surface inflows to Moses Lake: (1) 12467000, Crab Creek near Moses Lake; (2) 12467200, Rocky Coulee Wasteway at Road K, near Moses Lake; and (3) 12470620, Rocky Ford Creek below Drumheller Dam, near Ephrata. Two sampling locations at USGS stream-gaging stations were on the main outflows: (1) 12471002, North Moses Lake Outlet near Moses Lake; and (2) 12471003, South Moses Lake Outlet near Moses Lake. For all sampling locations, an attempt was made to collect data over a range of discharges to characterize fully the sediment-transport characteristics of each channel.
The equal-discharge-increment (EDI) method was used for all suspended-sediment samples collected at five verticals across the channel (Edwards and Glysson, 1999). Two EDI transects were collected for each measurement session. The
Station No. Site nameNorth American Datum 1927
(NAD27)
Latitude Longitude
Surface-water sites sampled during this study
12466020 Crab Creek above Brook Lake, at Highway 28 near Stratford 47°25’58” 119°13’02”12467000 Crab Creek near Moses Lake 47°11’23” 119°15’54”12467200 Rocky Coulee Wasteway at Road K, near Moses Lake 47°09’46” 119°15’20”12470620 Rocky Ford Creek below Drumheller Dam, near Ephrata 47°14’26” 119°26’53”12471002 North Moses Lake Outlet near Moses Lake 47°05’02” 119°19’54”12471003 South Moses Lake Outlet near Moses Lake 47°04’48” 119°19’57”
Sites sampled during earlier U.S. Geological Survey studies
12471090 Frenchman Hills Wasteway on SE C Road, near Moses Lake 46°58’28” 119°25’42”12464770 Crab Creek at Rocky Ford Road, near Ritzville 47°18’10” 118°22’05”13351000 Palouse River at Hooper 46°45’31” 118°08’52”
Table 1. Suspended-sediment sampling sites near Moses Lake, Washington.
USGS Cascades Volcano Observatory Sediment Laboratory in Vancouver, Washington, analyzed all suspended-sediment samples under standard USGS quality-control protocol (Gordon and others, 1999). For each measurement session, samples from one transect were composited and analyzed to determine suspended-sediment concentration while samples from the second transect were individually analyzed for suspended-sediment concentration. The combined average for the composited transect and the individually analyzed sampled transects was reported as a single concentration, C, in milligrams per liter. Channel discharge, Q, was measured concurrently with sediment sampling using an acoustic Doppler velocimeter and wading rod if the channel was wadeable or an acoustic Doppler current profiler (ADCP) on a tethered boat if the channel was too deep to wade. Discharge measurements allowed the suspended-sediment discharge, Qs, in tons per day, or the daily suspended-sediment load, to be computed using a unit-correction equation from Glysson (1987):
Q CQs=0 0027. . (1)

8 Sediment Loading from Crab Creek and Other Sources to Moses Lake, Washington, 2007 and 2008
Calculating Fluvial Sediment Loads
Sediment-transport relations between sediment load and discharge were determined by fitting linear regression equations to logarithmic transformations of sediment load and discharge for the available datasets (Glysson, 1987). Because a statistical bias is introduced into the retransformations of the “log space” regression back into “real space” variables (Cohn and others, 1989), the sediment-load estimates reported herein were corrected using a nonparametric or “smearing” estimate for bias correction (Helsel and Hirsch, 1992).
Lakebed Coring and Analysis
The May 18, 1980, eruption of Mount St. Helens covered much of eastern Washington with a layer of volcanic ash (Sarna-Wojcicki and others, 1981). The median grain size of the May 18 ash falling near Moses Lake was silt-sized and smaller (less than 62 microns) and the ash was composed predominantly of glassy fragments with smaller amounts of plagioclase feldspar and lithic (rock) fragments. Grains were typically angular, anhedral, and contained numerous vesicles. The Mount St. Helens ash covered the Moses Lake region to a depth of 1.2–1.6 in. (Sarna-Wojcicki and others, 1981). The ash layer was distinctively light gray in color and contained less interstitial water and was denser than typical lakebed deposits. The denser ash layer apparently sank within soft watery sediment of Moses Lake and initially inhibited the release of phosphorus from the underlying lake sediment (Welch and others, 1985). Additional observations from 1982 and 1984 indicated that downward displacement of the ash apparently stabilized about 2–4 in. below the lakebed surface and phosphorus recycling had resumed (Welch and others, 1985).
Lakebed deposition since about 1980, in theory, can be measured by analyzing Moses Lake sediment cores in which a Mount St. Helens ash layer could be identified. Sediment cores were collected at 18 locations within the main part of Moses Lake in July and August 2008 (fig. 2). Nine cores were collected in Rocky Ford Arm, five cores were collected in Parker Horn, which drains Crab Creek and Rocky Coulee Wasteway, and four cores were collected in Pelican Horn and the main lake closer to the lake outlets. The coring sites were selected to provide a spatially representative sample of bottom sediment in the reservoir. Core samples were collected using a 2-in. inside diameter Ogeechee™ hand-operated corer. To collect the cores, the coring device with hammer was lowered slowly to the sediment surface and allowed to settle slowly into the upper few inches of the bed sediment under its own weight before the driver hammer was used to push the core barrel farther into the sediment. The liner used for all cores was cellulose acetate transparent tubing with a 2-in. inside diameter.
Upon recovery of the core sample, the bottom and top of each sediment core liner were covered with plastic end caps secured to the liner with electrical tape. A 3/8-in. hole was drilled into the liner just above the water-sediment interface to allow most of the overlying water to drain from the core, thereby facilitating the transport of the core. The sediment cores were transported vertically to the USGS laboratory in Tacoma, Washington, where they were stored vertically and refrigerated at 39°F.
In the laboratory, caps were removed and the sediment cores were allowed to stand for several days to allow partial evaporation of the upper 1 in. of each sediment core. Cores were split lengthwise using a clean putty knife to expose undisturbed sediment. Noticeable differences in grain size and texture of the cores were noted and labeled alphabetically, starting with ‘A’ for the horizon beginning at the bottom (the end with the core catcher). The core then was photographed to document differences between cores collected in different areas. Identification of the Mount St. Helens ash layer was made by visual inspection. Measurements of sediment bulk density were determined gravimetrically using a known volume of sediment. The process was monitored to avoid inclusion of gas bubbles within the sediment slurry during measurements of sediment density. A constant mass-accumulation rate was assumed and reported as the weight of sediment per unit surface area per year (Van Metre and others, 2004).
The volcanic ash was identified in cores as grayish lighter-color silty sediment, which was readily apparent as a distinctive layer in only 1 wet core; however, after drying, lighter-colored ash became visible in 11 additional cores. Mount St. Helens ash could not be identified in 6 of the cores. The presence of volcanic ash was confirmed by petrographic examination of volcanic glass shards under crossed-Nicol-polarizer conditions (fig. 4). Ash grains were isolated from samples of core sediment following procedures described by Rose and others (1995). Sediments were cleaned using hydrogen peroxide, hydrochloric acid, and dilute sodium hydroxide. Inorganic sediment grains, including Mount St. Helens ash, were separated from copious diatom material present in the cores by settling in a 30-cm glass burette filled with distilled water. Settling time for ash fragments were determined by comparing with Mount St. Helens ash sediment samples collected adjacent to Moses Lake. Grain mounts were examined at 100× and 400× magnifications using a Leitz petrographic microscope, comparing observed clasts with archived samples of Mount St. Helens ash collected in Ephrata, Washington. Mount St. Helens ash was identified by its morphology, vesicularity, and isotropy under crossed polarized light (fig. 4) (Enache and Cumming, 2006).

Fluvial Sediment Load in Channels Feeding Moses Lake 9
tac09-0413_fig04 Vesiculated ash shards
A B
Figure 4. Vesiculated Mount St. Helens ash shards shown (A) under plane polarized light and (B) with crossed polarized light. Mineral grains are apparent, but glassy material, such as ash, is opaque and not observable.
Fluvial Sediment Load in Channels Feeding Moses Lake
Samples at the six suspended-sediment measurement locations were collected periodically from October 2007 to October 2008 (table 2). Only one sample was collected from stream-gaging station 12466020, Crab Creek above Brook Lake, in April 2008 when the discharge was 19.5 ft3/s; the suspended-sediment concentration for this discharge was 12 mg/L and the suspended-sediment discharge was 0.6 ton/d. Dry conditions during 2007 resulted in consistently low or zero discharge at this sampling site, precluding collection of additional data. At the Crab Creek near Moses Lake sampling location, station 12467000, four samples were collected at discharges ranging from 18.1 to 58.5 ft3/s with suspended-sediment concentrations from 10 to 34 mg/L and suspended-sediment discharge ranging from 0.5 to 4.5 ton/d. At the Rocky Ford Creek sampling site, station 12470620, four samples were collected at discharges ranging from 34.5 to 96.2 ft3/s with suspended-sediment concentrations from 13 to 26 mg/L and suspended-sediment discharge ranging from 2.4 to 4.4 ton/d.
Because of drier than normal conditions during the study period, October 1, 2007, to October 31, 2008, discharge was less than average in Crab Creek and Rocky Ford Creek near Moses Lake. During the study period, the stream-gaging station on Crab Creek near Moses Lake, station 12467000,
recorded relatively consistent flows controlled mostly by baseflow and return flows from agriculture. The mean discharge for this period was 35 ft3/s. The minimum discharge at this gaging station during the study period was 5.8 ft3/s in March 2008, and the maximum discharge recorded was 73 ft3/s in late September 2008. Similar flow conditions probably occurred in Rocky Ford Creek, but no continuous recorder was installed on this creek to verify the range in flows.
Three suspended-sediment samples were collected at Rocky Coulee Wasteway, station 12467200. Because Rocky Coulee Wasteway was used during the study period for irrigation deliveries to Moses Lake, a relatively wide range of discharges were measured, from 108 to 1,860 ft3/s. Despite the high discharge, suspended-sediment concentrations were low, ranging from 3 to 10 mg/L; the resulting suspended-sediment discharges ranged from 2.9 to 20 ton/d. Sediment loads were similar at the Moses Lake outlets. At the North Moses Lake Outlet, station 12471002, discharges during the sampling period ranged from 74.7 to 986 ft3/s, suspended-sediment concentrations ranged from 4 to 10 mg/L, and suspended-sediment discharges ranged from 0.9 to 16 ton/d. At the South Moses Lake Outlet, station 12471003, discharges during the sampling ranged from 105 to 744 ft3/s, suspended-sediment concentrations ranged from 4 to 6 mg/L, and suspended-sediment discharges ranged from 1.1 to 8.0 ton/d.

10 Sediment Loading from Crab Creek and Other Sources to Moses Lake, Washington, 2007 and 2008
The relation between suspended-sediment load and discharge for the sediment data collected during this study is shown in figure 5. All suspended-sediment samples collected in Crab Creek and Rocky Ford Creek, with natural channels predominantly influenced by baseflow and irrigation returns, were collected during discharges less than 100 ft3/s. In contrast, the sediment samples from the Rocky Coulee Wasteway and both Moses Lake outlets were collected in flows greater than 100 ft3/s and as high as 1,860 ft3/s. Fitting sediment data from all sediment samples collected during the study to a regression equation gives
Q Qs=0 1720 629. . . (2)
Sediment loads measured during the study were representative of sediment loads in irrigation deliveries, baseflow, or irrigation returns. No suspended-sediment samples were collected in flows influenced by rainfall runoff. Additionally, the stream-gaging data collected during the study period
indicated that little or no rainfall runoff entered Crab Creek near Moses Lake and sediment delivery to Crab Creek from tributaries probably was small. Because of these conditions, all sediment loads measured during this study were small, representing relatively clear flowing water. The sediment-transport curve of equation (2) roughly approximates the lighter sediment load in Crab Creek associated with irrigation deliveries in the absence of rainfall-runoff effects. This equation, however, could under-predict the historical sediment load in Crab Creek after the 1950s because the historical load presumably was heavily influenced by rainfall runoff.
To estimate the long-term sediment loads in Crab Creek, historical suspended-sediment data from Crab Creek at Rocky Ford Road near Ritzville, station 12464770, and the Palouse River at Hooper, station 13351000, also were analyzed (fig. 6). Consistent with suspended-sediment trends in most fluvial systems, large variations in the suspended-sediment data were documented at and between individual gaging stations.
Station No.
Station name DateDischarge
(ft3/s)
Suspended- sediment
concentration(mg/L)
Suspended-sediment discharge
(ton/d)
12466020 Crab Creek above Brook Lake, at Highway 28 near Stratford 04-15-08 19.5 12 0.612467000 Crab Creek near Moses Lake 10-22-07 49.3 34 4.5
04-16-08 18.1 10 .507-15-08 54.9 23 3.410-08-08 58.5 19 3.0
12470620 Rocky Ford Creek below Drumheller Dam, near Ephrata 10-23-07 96.2 17 4.404-17-08 34.5 26 2.407-17-08 65.4 22 3.910-09-08 69.4 13 2.4
12467200 Rocky Coulee Wasteway at Road K, near Moses Lake 04-17-08 1,860 4 2007-15-08 108 10 2.910-08-08 357 3 2.9
12471002 North Moses Lake Outlet near Moses Lake 10-23-07 103 10 2.804-16-08 986 6 1607-16-08 80.6 4 .910-09-08 74.7 6 1.2
12471003 South Moses Lake Outlet near Moses Lake 04-16-08 744 4 8.007-16-08 105 4 1.110-09-08 469 6 7.6
Table 2. Suspended-sediment data collected near Moses Lake, Washington, October 2007–October 2008.
[Abbreviations: ft3/s, cubic foot per second; mg/L, milligram per liter; ton/d, ton per day]

Fluvial Sediment Load in Channels Feeding Moses Lake 11
Figure 5. Suspended-sediment load as a function of discharge measured at six sampling sites near Moses Lake, Washington, 2007 and 2008.
tac09-0413_fig05 Suspended sediment load/discharge
0.1
1
10
100
1,000
1 10 100 1,000 10,000
SUSP
ENDE
D-SE
DIM
ENT
LOAD
, IN
TON
S PE
R DA
Y
DISCHARGE, IN CUBIC FEET PER SECOND
Crab Creek above Brook Lake (12466020)Crab Creek near Moses Lake (12467000)Rocky Ford Creek (12470620)Rocky Coulee Wasteway (12467200)North Moses Lake Outlet (12471002)South Moses Lake Outlet (12471003)
Qs = 0.172 Q 0.629
R 2 = 0.66
tac09-0413_fig06 Suspend sed load /Historical Suspend sed load
Qs = 0.00258 Q 2.045
R 2 = 0.87
Qs = 0.172 Q 0.629
R 2 = 0.66
0.01
0.1
1
10
100
1,000
10,000
100,000
1,000,000
10,000,000
1 10 100 1,000 10,000 100,000
SUSP
ENDE
D-SE
DIM
ENT
LOAD
, IN
TON
S PE
R DA
Y
DISCHARGE, IN CUBIC FEET PER SECOND
Crab Creek at Rocky Ford Road (12464770), period of record 1993–2009Palouse River at Hooper (13351000), period of record 1962–2009All data collected during this study
Figure 6. Comparison of suspended-sediment load as a function of discharge with historical suspended-sediment load in central and southeastern Washington, October 2007–October 2008.

12 Sediment Loading from Crab Creek and Other Sources to Moses Lake, Washington, 2007 and 2008
Nonetheless, the suspended-sediment data collected from Crab Creek and Rocky Ford Creek during this study are within the range of variation of the wider historical dataset. Fitting a regression equation to all available natural-flow data from Crab Creek, Rocky Ford Creek, and the Palouse River gives
Q Qs=0 002582 045. . . (3)
Historical sediment loading into Moses Lake by rainfall-runoff-influenced flows in Crab Creek can be roughly estimated using equation (3) combined with the daily-mean discharge record from the gaging station on Crab Creek at Moses Lake, station 12467000. Because equation (3) is strongly influenced by data from the Palouse River, a river with ample loess for source sediment, the historical sediment load in Crab Creek may be overestimated; nonetheless, it was determined that the suspended-sediment data from Crab Creek alone was inadequate. Moreover, using sediment-load data from geomorphically similar drainages is one technique to generate sediment-transport curves with limited available data for the stream of interest (for example, Glysson, 1977; Webb and others, 2000). The precision of the calculated load in Crab Creek using equation (3) is probably only as good as an order of magnitude, but this precision is sufficient for estimating the relative contribution of fluvial loading to Moses Lake relative to other sources. In other words, when calculating fluvial load
from Crab Creek (as well as Rocky Ford Creek), equation (3) offers precision adequate for the objectives of this study. More importantly, the precision from equation (3), although limited, is comparable to the approximate loading estimates calculated in this study for eolian and autochthonous input.
The total estimated annual sediment load in Crab Creek from water years 1943 to 2008 is shown in figure 7. The total annual load is significant even during the drier years during 1998–2008. The average annual sediment load in Crab Creek during water years 1943 to 2008 was 32,000 ton/yr. The post-eruption annual sediment load (1980–2008) in Crab Creek was 13,000 ton/yr, an important estimate when analyzing sediment accumulation on the lakebed that has occurred since 1980.
Using the daily-mean discharge record for the discontinued stream-gaging station on Rocky Ford Creek, station 12470500, the average annual sediment load from 1943 to 1991 into Moses Lake from Rocky Ford Creek was estimated to be 7,000 ton/yr. The annual sediment load from Rocky Ford Creek during the period following the eruption of Mount St. Helens (1980–91) was 5,000 ton/yr. Sediment loads from Rocky Coulee Wasteway, the other major surface-water source to Moses Lake, were not calculated due to lack of historical discharge records; nonetheless, because the flow in Rocky Coulee Wasteway is predominantly clear-water irrigation deliveries, the sediment load probably is small.
tac09-0413_fig07 estimated annual sed load Crab to Moses
100
1,000
10,000
100,000
1950 1960 1970 1980 1990 2000 2010
ANN
UAL
SEDI
MEN
T LO
AD, I
N T
ONS
WATER YEAR1940
1,000,000
Figure 7. Estimated annual sediment load from Crab Creek into Moses Lake, Washington, calculated using a regression equation, water years 1943–2008.

Lakebed Accumulation 13
Eolian InputsThe Moses Lake dune field attests to the presence of
strong winds and an adequate supply of fine-grained sediment to foster active eolian processes in the Quincy basin. The dune field is the largest basaltic dune field on Earth (Edgett, 1994), and the broader Columbia Plateau is home to Palouse loess, one of the oldest and thickest loess formations on Earth (Busacca, 1991). Loess is deposited eolian dust. The Moses Lake dune field lies to the southwest of Moses Lake. The dune field was formed throughout the late Pleistocene and Holocene from sand originating in the distal sections of the Ephrata Fan (Bandfield and others, 2002). The formation of the dune field and its migrating dunes, in turn, formed Moses Lake by damming Rocky Ford Creek and Crab Creek. Eolian sediment input to Moses Lake is composed of saltating sand particles of the moving dune field (see Bagnold, 1941) and the settling of finer particles, or dust, entrained in the troposphere during windy conditions.
Sand-dune migration rates in the Moses Lake dune field have decreased during the 20th century. Early residents in the region indicated the rate of movement was 30–60 ft/yr in the 1920s and 1930s (Petrone, 1970). As a result of the import of additional water and damming as part of the Columbia Basin Project, the dune field was subject to rising groundwater tables and stabilizing vegetation. Furthermore, the construction of the O’Sullivan Dam in 1952 created Potholes Reservoir, which submerged much of the dune field to the west and southwest of Moses Lake. The dune field is the primary source of eolian sediment to Moses Lake (Bandfield and others, 2002). Petrone (1970) estimated the rate of dune movement to be 7–23 ft/yr from 1941 to 1961. Edgett (1994) estimated the rate of dune movement to be 7–10 ft/yr in 1992 and determined that movement was slowed by mantling from Mount St. Helens ash and land-use changes. At present (2009), most of the dune field to the southwest of the lake is a wetland, further reducing eolian input to Moses Lake. A small part of the northwest dune field just west of Moses Lake is reserved for off-road recreational vehicle traffic and remains geologically active, thereby contributing eolian sediment to Moses Lake (Bandfield and others, 2002).
The rate of sand-sized eolian sedimentation to Moses Lake from dune migration can be estimated by multiplying the dune-migration rate by the cross-sectional area of the active dune field moving directly into the lake. This coarse approach gives an order of magnitude calculation of eolian sand input that can be compared to other sedimentation sources. For the purposes of this estimate, the dune height was assumed
to be 6 ft and the dune was assumed to occupy 50 percent of the area historically (based on aerial photographs). Before development, the active dune field moving into the lake was about 4 mi wide, resulting in an estimated predevelopment sand-flux of 35,000 yd3/yr moving into the southwestern part of Moses Lake. Considering only sand input from the still active section of the dune field (assume an active width of 0.5 mi) and a significantly smaller dune coverage (25 percent), the present eolian sand sedimentation rate probably is no more than 1,000 yd3/yr, or about 0.001 in/yr over the surface area of the lake. Assuming the bulk density of the sand on the lakebed is 1.4 ton/yd3 (Allen, 1985), the predevelopment eolian sand sedimentation rate to Moses Lake probably was about 50,000 ton/yr; the current eolian sand sedimentation rate is less than 2,000 ton/yr.
Finer-grained sediment, or dust, accumulation from eolian processes in and near Moses Lake has not been extensively measured; however, a study by Sweeney and others (2007) of Pleistocene and Holocene loess accumulation from Eureka Flat in south-central Washington can be used as a comparative proxy. Like the Ephrata Fan, Eureka Flat is a deflational plain within a depocenter of glacial outburst flood sediment and is a primary source of loess for the Palouse Formation (Sweeney and others, 2007). The most recent loess accumulation rate in the Palouse Formation has been as much as 160 in. over the past 15,000 years (Sweeney and others, 2007), representing a deposit rate of 0.01 in/yr. When compared to Eureka Flat, a prodigious source of loess, the dust deposition rate from the Ephrata Fan probably is significantly smaller. Regardless, when compared to other sediment sources to Moses Lake, sedimentation from eolian dust is negligible.
Lakebed AccumulationAccumulated sediment from Moses Lake was composed
primarily of silt. Typically, the surficial sediment appeared uniform with a light color and texture often containing gastropod shells and occasional plant-like organic fragments. The water content of the surficial sediment horizon was large, and measurements of sediment bulk densities were similar to the density of water, 62.4 lb/ft3. A distinctive Mount St. Helens ash layer, as reported by Welch and others (1985), was not readily observed in the wet Moses Lake cores, although a clean, distinctive ash lens, 0.1–0.3 in. thick, was observed in core M about 3.4 in. below the top of the core. Evidence of Mount St. Helens ash, however, was observed in 12 of the 18 dried sediment cores (table 3).

14 Sediment Loading from Crab Creek and Other Sources to Moses Lake, Washington, 2007 and 2008
Sediment accumulation since about 1980 is shown in figure 8. At core E in the northern reaches of Rocky Ford Arm, 4.5 in. of accumulated sediment was observed. At the southern end of Rocky Ford Arm, sediment accumulation was determined in four cores and varied from 4.3 to 7.1 in. In Parker Horn, the two cores closest to the outlet of Crab Creek (cores A and L) showed post-1980 accumulation of 7.1 and 8.7 in., respectively. Farther to the southwest in Parker Horn, cores D and M showed accumulation of 5.9 in. The largest measured accumulation was in the main lake at core R with 9.1 in. Finally, cores P and Q in Pelican Horn showed accumulation of 6.7 and 7.5 in., respectively.
The measurements of accumulated sediment from Moses Lake likely were affected by a sampling artifact referred to as ‘core shortening’ as well as density-driven settling of the
ash layer and sediment mixing with pre-1980 lake sediment. These factors likely affect estimates of rates of sediment accumulation in opposing ways.
Core shortening results in the recovery of less sediment within the core sampler than is penetrated by the core sampler (Emery and Hulsemann, 1964; Blomqvist, 1985; Morton and White, 1997). In softer sediment, such as the upper horizon of Moses Lake, core shortening probably results largely form thinning of the sediment rather than exclusion or bypassing of sediment from the core barrel that tends to occur in stiff and more compacted sediment (Morton and White, 1997). Empirical studies by Blomqvist (1985) suggested core shortening might have occurred in the upper 18 in. of soft sediment of Moses Lake; the shortening likely would be linear and result in under estimation of sediment accumulation by about 25 percent.
Sediment core site identifier
Date Time Latitude LongitudeCore
length (in.)
Overlying water depth
(ft)
Identifiable time
horizon
Depth to bottom of
time horizon (in.)
Sediment depth accumulation
rate (in/yr)
Average sediment density (lb/ft3)
Mass accumulation
rate [(lb/ft2)/yr]
A 07-18-08 1100 47°07’59” 119°16'43" 23.2 8.5 MSHd 7.1 0.25 74.9 1.58B 07-18-08 1230 47°09’53” 119°20'04" 20.1 25 MSHd 4.3 .15 40.6 .52C 08-21-08 0815 47°07’36” 119°17'38" 15.0 6 ? – – – –D 08-21-08 0800 47°07’36” 119°17'37" 23.6 5.2 MSHd 5.9 .21 74.9 1.32E 08-21-08 0915 47°13’08” 119°25'39" 22.4 4.2 MSHd 4.5 .16 25.0 .34F 08-21-08 0940 47°11’06” 119°24'56" 17.7 12.4 ? – – – –G 08-21-08 0950 47°11’06” 119°24'57" 15.4 12.2 ? – – – –H 08-21-08 1030 47°10’56” 119°21'50" 14.2 17.5 ? – – – –I 08-21-08 1100 47°10’48” 119°20'46" 7.9 17 ? – – – –J 08-21-08 1140 47°08’22” 119°20'42" 15.7 25 MSHd 6.7 .24 28.1 .56K 08-21-08 1150 47°09’32” 119°20'42" 33.9 25 MSHd 7.1 .25 87.4 1.84L 08-21-08 1442 47°08’00” 119°16'42" 24.8 8.3 MSHd 8.7 .31 87.4 2.25M 08-21-08 1525 47°06’50” 119°18'39" 29.1 15.2 MSHd 5.9 .21 63.1 1.11N 08-22-08 0750 47°06’57” 119°20'07" 34.3 25 MSHd 7.1 .25 87.4 1.84O 08-22-08 0830 47°05’56” 119°17'53" 19.7 9.2 ? – – – –P 08-22-08 0910 47°05’22” 119°18'25" 21.7 14 MSHd 6.7 .24 68.0 1.36Q 08-22-08 0950 47°04’48” 119°19'25" 32.7 29.8 MSHd 7.5 .27 47.4 1.06R 08-22-08 1010 47°05’38” 119°19'29" 34.6 30 MSHd 9.1 .32 69.3 1.87
Table 3. Characteristics of sediment core samples collected from Moses Lake, Washington, July and August 2008.
[Sediment core sample locations are shown in figure. 8. Latitude and Longitude in degrees, minutes, seconds. Abbreviations: in., inch; ft, foot; in/yr, inch per year; [(lb/ ft2)/yr], pound per square foot per year; MSHd, Mount St. Helens ash; ?, none identified; –, no data]

Lakebed Accumulation 15
tac09-0413_fig08 Depth of sed. post 5/80
PotholesReservoir
Park
erPe
lican
Rocky Ford Arm
Horn
Horn
Mos
esLa
ke
Crab Creek
O
IHG
F
C
E
B
K
J
NM
DA, L
P
Q
R
4.3
7.1
7.1
9.1
7.5
6.7
7.1
5.9
8.7
6.7
4.5
5.9
EXPLANATIONSediment core sample site and identifier
4.6
E
Depth to horizon, in inches
Moses Lake
U.S. Geological Survey digital data 1:100,000, UTM zone 11, North American Datum of 1983 (NAD83)U.S. Geological Survey National Elevation Dataset (NED) 2000, UTM zone 11, NAD83
0 3 MILES1 2
0 3 KILOMETERS1 2
I-90
SR17
SR17
SR171
47˚10'
47˚05'
119°15'119°20'119°25'
Figure 8. Locations of sediment core samples and depth of sediment accumulation, Moses Lake, Washington, since the 1980 eruption of Mount St. Helens.
16 Sediment Loading from Crab Creek and Other Sources to Moses Lake, Washington, 2007 and 2008
Sediment mixing can occur from bioturbation from carp and other near-bottom dwelling fish species as well as sediment-dwelling organisms. Additionally, windy conditions in the Quincy basin and the long fetch over the shallow depth of Moses Lake are conducive to wind-driven mixing of lake-bottom sediment that would have disturbed the Mount St. Helens ash layer. Divers observed wind-induced resuspension of lake-bottom sediment during a windstorm in September 1978 (Patmont, 1980). Although Patmont (1980) did not observe resuspension of bottom sediment at depths greater than 14 ft during the September windstorm, the absence of a well-defined ash layer in the cores collected at sites with water depths greater than 20 ft indicate that wind-induced mixing or bioturbation occurs in the deeper sections of Moses Lake. The uniform nature of the sediment cores indicates that mixing by bioturbation or sediment resuspension occurs commonly in Moses Lake sediment. Resuspension of lakebed sediment from high-wind events occurs episodically in shallow lakes and is a function of the depth and distribution of shear stress on the lakebed. Shear stress is affected by a combination of wind speed, lake fetch, lake-basin morphology, wave height, and duration of disturbance (for example, Sheng and Lick, 1979; Luettich and others, 1990). Laenen and LeTourneau (1996) reported benthic shear stress strong enough to entrain bed sediment in Upper Klamath Lake, Oregon, for diurnal winds of 10 mi/h or greater, and Wood and others (2008) showed extensive wind-driven circulation and mixing in Upper Klamath Lake. Prevailing winds over Moses Lake are from the southwest and often are strong, particularly during spring and autumn. Wind-driven circulation of the lake accounts for extensive mixing within the water volume (Carlson and Welch, 1983). Temperature measurements taken in 2001 confirmed thorough wind-driven mixing of the lake in the spring and autumn (Carroll, 2006).
Considering the opposing effects of core shortening and sediment mixing on accumulation rates, the best estimates of accumulation rates are obtained by not correcting for core shortening or sediment mixing. Therefore, the final calculated sediment accumulation rate was on the order of 0.15–0.32 in/yr, with a mean adjusted accumulation rate of 0.24 in/yr, and a standard deviation of 0.05 in/yr.
Sediment from one of the longer cores provides some supporting information. In core M, the lowest 7.9 in. of the core was composed almost entirely of diatoms frustules. Overlying the diatoms was the fine-grained sediment characteristic of modern sedimentation indicating a significant change in the hydrology of Moses Lake. Diatom deposits are common in the Quincy basin having been deposited in alkaline
lakes overlying Columbia River Basalts (Makin, 1947; Joseph, 1990). These diatoms at the base of core M may relate to the stagnant alkaline conditions described by Symons (1882), which predate agricultural development and settlement around Moses Lake. If the overlying 21.3 in. of sediment in core M represent accumulated sediment over 110 years, the apparent sediment accumulation rate, unadjusted for effects from core shortening or sediment mixing, would be about 0.19 in/yr. If the core interval between the diatoms and the Mount St Helens ash containing sediment (15.3 in.) represent the period from predevelopment to depositon of Mount St. Helens ash, the sediment accumulation rate would be about 0.17 in/yr. Although these estimates would essentially double if the change in sedimentation was initiated by the onset of surface-water irrigation, the overall estimate of sediment accumulation rate is similar to that observed since deposition of the Mount St. Helens ash.
A striking observation from the data is the relative uniformity of sediment accumulation throughout the lake. For example, overall accumulation at cores A and L in Parker Horn closest to Crab Creek was larger than the mean, but no discernible spike was observed in accumulation due to fluvial input from Crab Creek or from Rocky Ford Creek (core E).
The dry density of the sampled cores ranged from 25 to 87 lb/ft3 (the density of water at 70°F is 62.3 lb/ft3) with an average overall density of 63 lb/ft3. The post-1980 average mass-accumulation rate of all samples was 1.3 (lb/ft2)/yr. When integrated over the surface area of the lake, the average mass-accumulation rate was 190,000 ton/yr.
The relative uniformity in lakebed accumulation since 1980 attests to ample wind-driven circulation in the lake and significant autochthonous sediment production from biogenic processes. A qualitative assessment during the handling and processing of the lakebed cores indicated that about 20 percent of the total core volume was comprised of organic phytoplankton that was removed during sample preparation by baking, desiccation, or acid treatment. Of the sediment that remained in the core after processing, much of the material was inorganic biogenic material composed mostly of diatom frustules and carbonate shells. When the mean lakebed accumulation rate of 190,000 ton/yr is compared with post-eruption fluvial input from Crab Creek (13,000 ton/yr), Rocky Ford Creek (5,000 ton/yr), and eolian input (historically about 50,000 ton/yr and currently (2009) less than 2,000 ton/yr), the majority of lakebed sediment accumulation under current conditions appears to result from biogenic processes. This observation is consistent with the hypereutrophic nature of the lake.

Implications for Sedimentation from Crab Creek Bypass 17
Implications for Sedimentation from Crab Creek Bypass
Substantial uncertainty is associated with estimating suspended-sediment load from Crab Creek during the supplemental feed using the limited data collected during this study. Considering the larger regional dataset (equation 3), the average sediment load from a natural stream on the Columbia Plateau experiencing typical rainfall-runoff hydrologic conditions and discharge of 100 ft3/s would be 32 ton/d; the load for a natural-stream discharge of 650 ft3/s would be about 1,500 ton/d. The sediment-transport mechanics associated with the proposed supplemental feed in Crab Creek, however, would differ from sediment loading in natural creeks on the Columbia Plateau.
Crab Creek, which flows over basaltic bedrock and coarse-grained cobbles and boulders of the Ephrata Fan, is a supply-limited fluvial system. The sediment transport in the creek is governed by the sediment supply and grain size of sediment in the channel. On the Colorado River in the Grand Canyon, Rubin and Topping (2001) demonstrated that sediment transport decreases with time in grain-sized limited streams, in which the supply of sediment is limited and the river removes the smaller-sized sediment until only grains larger than the channel competence remain. Similarly, Einstein and Chien (1953) and Parker and Wilcock (1993) discussed the importance of grain-size limitations on overall transport, showing in flumes how sediment transport at constant discharge will decrease with time unless new sediment is supplied to the system.
If Crab Creek had not experienced a high natural flow before the release of the first supplemental feed, any accumulated sediment within the channel—due to, for example, localized rainfall runoff of hill-slope and tributary sediment—would be carried as load in the initial flushing flow. Although this initial flow might carry a large impulse of sediment, similar to the sediment loads predicted with equation (3), the sediment load in the flow would decrease over time as the hydraulic interaction between discharge and sediment transport achieved equilibrium. Eventually, the supplemental feed would have a sediment load similar to the clear-water conditions sampled during the drier conditions of this study. If sediment transport with the supplemental feed is similar to these clear-water deliveries (equation 2), the load with a 100 ft3/s feed would be 3 ton/d and the load with a 650 ft3/s feed would be 10 ton/d, which is significantly less than typical sediment loads in rainfall-runoff-influenced streams on the Columbia Plateau. This clear-water condition appears to have been documented during the 2006 test release of 145 ft3/s when TSS samples at Crab Creek near Moses Lake were 7 mg/L at a discharge of 86.3 ft3/s or an equivalent of 1.6 ton/d (Bureau of Reclamation, 2007).
Another factor to consider with the supplemental feed is the hydrologic differences between a routed bypass and the natural hydrologic response from a typical rainfall-runoff peak discharge. During a rainfall event, with its associated tributary input and overland flow, fine-grained sediment from the surrounding catchment is carried to the creek and transported downstream. The historical suspended-sediment data collected for natural flows in Crab Creek, Rocky Ford Creek, and the Palouse River were sampled while the respective rivers and streams were subjected to these natural hydrologic conditions. In contrast, during a supplemental feed routed through Crab Creek, fine-grained sediment from the surrounding catchment would not be deposited into the creek, causing less overall sediment transport during the bypass. Moreover, even if the supplemental feed is stopped and then restarted, unless additional fine-grained material had been deposited in the creek bed, the restarted supplemental feed would be generally clear.
Although Crab Creek was subjected to relatively lower discharges from drier climatic conditions from 1998 to 2008, 100 and 650 ft3/s are not large flows in the hydrologic context of the creek, that is, discharge values as much as 650 ft3/s are not uncommon or unusual geomorphically. Although the supplemental feed would temporarily increase the sediment-transport load into Parker Horn of Moses Lake relative to low-flow conditions, over the course of several years the supplemental feed would not greatly increase the overall sediment loading to the lake that would ordinarily occur under the current hydrologic regime in a decadal timeframe.
One complicating factor in the assessment of increased sedimentation potential from a supplemental feed is the unknown effect the supplemental feed might have on the hydrology of peak flows in Crab Creek near Moses Lake. Although a full hydrologic characterization of magnitude of runoff discharges in Crab Creek is beyond the scope of the current investigation, Brook Lake does act like a retention basin during dry years. If the Brook Lake water-surface elevation is low, floods from the upper basin can be partially or wholly retained in the lake resulting in attenuated floods downstream, a hydrologic condition observed and described by the Bureau of Reclamation (2007) during the test releases of October 2006. If Brook Lake were full from supplemental-feed operations, the lake could lose some of its capacity to retain high-flow waters, possibly resulting in increased peak flows downstream. This effect would be most pronounced for small and intermediate floods and would not increase flood frequency beyond historical values observed in the complete stream-gaging record. These floods, however, may carry additional sediment into Moses Lake for short periods.

18 Sediment Loading from Crab Creek and Other Sources to Moses Lake, Washington, 2007 and 2008
Summary and ConclusionsSuspended-sediment and lakebed core samples were
analyzed to assess the possible effects on sediment loading to Moses Lake, Washington, from a proposed supplemental feed routed through Crab Creek. The Bureau of Reclamation is responsible for irrigation deliveries to farmers under the Columbia Basin Project and has proposed water delivery to Potholes Reservoir using a supplemental feed of 100–650 ft3/s through Crab Creek. There is concern that such a supplemental feed would increase overall sediment loading to the Parker Horn arm of Moses Lake.
The average sediment-accumulation rate on the bed of Moses Lake since 1980, based on the identification of Mount St. Helens ash in 12 lakebed cores, was determined to be 0.24 inches per year. Summed over the lake surface area, the accumulation rate means 190,000 tons of sediment collect on the lake bottom each year. Using regional suspended-sediment concentration data and discharge data collected by the USGS, the average annual sediment load to Moses Lake from Crab Creek was 32,000 tons per year between 1943 and 2008; the post Mount St. Helens eruption load has been 13,000 tons per year. Rocky Ford Creek, the other major fluvial tributary to Moses Lake, had a calculated annual sediment load of 7,000 tons per year between 1943 and 1991. In all, the total mass input of fluvially derived sediment from Crab Creek, Rocky Ford Creek, and other unnamed tributaries since 1980 has been about 20,000 tons per year. Eolian sediment loading to Moses Lake was probably about 50,000 tons per year before irrigation and land-use development largely stabilized the Moses Lake dune field, located to the west and southwest of the lake. Currently, eolian input to the lake is probably less than 2,000 tons per year. Considering all sediment sources to the lake, most lakebed-sediment accumulation since 1980 has been from autochthonous, or locally formed, material.
Suspended-sediment samples from Crab Creek and similar nearby waterways collected in 2007 and 2008, combined with other USGS-collected data from the region, indicated that under natural hydrologic conditions, a natural flood of 650 ft3/s in Crab Creek would produce a sediment load as much as 1,500 tons per day. Crab Creek, however, is in a basin with limited sediment supply. In the absence of sediment deposition into the creek from tributaries and overland flow from heavy rainfall, any supplemental feed routed through Crab Creek would quickly approach sediment-transport conditions measured in other clear-water bypass canals within the Columbia Basin Project area. Using the sediment-transport curve derived for the clear-water bypass canals (equation 2), the best estimate for long-term sediment loads routed through Crab Creek with the supplemental feed would be about 10 tons per day. More importantly, considering the hydrology and geomorphology of the creek, there is little evidence to indicate that the proposed
supplemental feed would substantially increase the overall sediment load from Crab Creek to Moses Lake relative to natural, background conditions in a decadal timescale. Finally, because Moses Lake is relatively shallow and subject to significant wind-driven mixing, wind-driven circulation currents would redistribute some part of the fluvial sediment load deposited from Crab Creek throughout Parker Horn and the rest of Moses Lake further mitigating the local effect of Crab Creek sedimentation near the City of Moses Lake.
AcknowledgmentsRick Wagner, the water-quality specialist for the
USGS Washington Water Science Center provided historical suspended-sediment data and useful analytical recommendations.
References Cited
Allen, J.R.L., 1985, Principles of physical sedimentology: London, George Allen and Unwin Ltd., 272 p.
Bagnold, R.A., 1941, The physics of windblown sand and desert dunes: New York, Methuen.
Baker, V.R., 1973, Paleohydrology and sedimentology of Lake Missoula flooding in eastern Washington: Boulder, Colo., Geological Society of America Special Paper 144, 79 p.
Baker, V.R., 2008, The channeled scabland—A retrospective: Annual Reviews of Earth and Planetary Sciences, v. 37, p. 6.1-6.19, doi:10.1146/annurev.earth.061008.134726.
Bandfield, J.L., Edgett, K.S., and Christensen, P.R., 2002, Spectroscopic study of the Moses Lake dune field, Washington—Determination of compositional distributions and source lithologies: Journal Geophysical Research, v. 107, no. E11, 15 p.
Blomqvist, Sven, 1985, Reliability of core sampling of soft bottom sediment—An in-situ study: Sedimentology, v. 32, p. 605-612.
Bretz, J.H., 1927, Channeled scabland and the Spokane flood: Journal of the Washington Academy of Sciences, v. 17, p. 200-211.
Bureau of Reclamation, 2007, Potholes Reservoir supplemental feed route—Draft environmental assessment, Technical Memorandum Alternative A–Crab Creek: U.S. Department of the Interior, 69 p.

References Cited 19
Busacca, A.J., 1991, Loess deposits and soils of the Palouse and vicinity, in Morrison, R.B., ed., The Geology of North America: Boulder, Colo., Geological Society of America, p. 216-228.
Carlson, K.L., and Welch, E.B., 1983, Evaluation of Moses Lake dilution—Phase II: University of Washington Department of Civil and Environmental Engineering, Water Resources Series Technical Report No. 80, 168 p.
Carroll, J., 2006, Moses Lake phosphorus-response model and recommendations to reduce phosphorus loading: Olympia, Wash., Washington State Department of Ecology, Publication No. 06-03-011, accessed November 18, 2009, at http://www.ecy.wa.gov/biblio/0603011.html.
Carroll, J.V., Cusimano, R.F., and Ward, W.J., 2000, Moses Lake proposed phosphorus criterion and preliminary load allocations based on historical review: Olympia, Wash., Washington State Department of Ecology, Publication No. 00-03-036, accessed November 18, 2009, at http://www.ecy.wa.gov/biblio/0003036.html.
Cohn, T.A., DeLong, L.L., Gilroy, E.J., Hirsh, R.M., and Wells, D.K., 1989, Estimating constituent loads: Water Resources Research, v. 25, no. 5, p. 937-942.
Edgett, K.S., 1994, The basaltic aeolian dunes near Moses Lake, Washington, U.S.A.—Changes in twentieth century activity moderated by local human and volcanic influences [abs.], in Workshop on the Response of Eolian Processes to Global Change: Reno, Nev., Quaternary Sciences Center, Desert Research Institute, Occasional Paper, v. 2, p. 33-35.
Edwards, T.K., and Glysson, G.D., 1999, Field methods for measurement of fluvial sediment: U.S. Geological Survey Techniques of Water-Resources Investigations, book 3, chap. C2, 89 p.
Einstein, H.A., and Chien N., 1953, Transport of sediment mixtures with large ranges of grain sizes: Berkeley, Calif., Missouri River Division, U.S. Army Corps of Engineers, The University of California, Berkeley, 72 p.
Emery, K.O., and Hulsemann, J., 1964, Shortening of sediment cores collected in open barrel gravity corer: Sedimentology, v. 3, p. 144-154.
Enache, M.D., and Cumming, B.F., 2006, The morphology and optical properties of volcanic glass—A tool to assess the density-induced vertical migration of tephra in sediment cores: Journal of Paleolimnology, v. 35, p. 661-667.
Glysson, G.D., 1977, Sedimentation in Santa Margarita Lake, San Luis Obispo County, California: U.S. Geological Survey Water-Resources Investigations Report 77-56, 15 p.
Glysson, G.D., 1987, Sediment-transport curves: U.S. Geological Survey Open-File Report 87-218, 47 p.
Glysson, G.D., and Gray, J.R., 2002, Total suspended solids data for use in sediment studies: Reno, Nev., Turbidity and Other Sediment Surrogates Workshop, April 30–May 2, 2002, accessed September 2009 at http://water.usgs.gov/osw/techniques/TSS/glysson.pdf.
Gordon, J.D., Newland, C.A., and Gagliardi, S.T., 1999, Laboratory performance in the sediment laboratory quality-assurance project, 1996–98: U.S. Geological Survey Water-Resources Investigations Report 99-4184, 39 p.
Helsel, D.R., and Hirsch, R.M., 1992, Statistical methods in water resources: New York, Elsevier, 522 p.
Joseph, N.L., 1990, Industrial minerals in Washington—Production and potential: Washington Geologic News letter, v. 18, no. 4, p. 8–16.
Laenen, A., and LaTourneau, A.P., 1996, Upper Klamath basin nutrient-loading study—Estimate of wind-induced resuspension of bed sediment during periods of low lake elevation: U.S. Geological Survey Open-File Report 95-414, 11 p.
Luettich, R.A., Harleman, D.R.F., and Somlyody, L., 1990, Dynamic behavior of suspended sediment concentrations in a shallow lake perturbed by episodic wind events: Limnology and Oceanography, v. 35, no. 5, p. 150-1067.
Mackin, J.H., 1947, Diatomite deposits in eastern Wash ington: Northwest Science, v. 21, no. 1, p. 33.
Mastin, M.C., 2009, Watershed models for decision support for inflows to Potholes Reservoir, Washington: U.S. Geological Survey Scientific Investigations Report 2009-5081, 54 p.
Morton, R.A., and White, W.A., 1997, Characteristics of and corrections for core shortenting in unconsolidated sediments: Journal of Coastal Research, v. 13, p. 761-769.
Parker, G., and Wilcock, P.R., 1993, Sediment feed and recirculating flumes—Fundamental differences: Journal of Hydraulic Engineering, v. 119, no. 11, p. 1192-1204.
Patmont, C.R., 1980, Phytoplankton and nutrient responses to dilution in Moses Lake: Seattle, University of Washington, Department of Civil Engineering, M.S Thesis, 124 p.
Petrone, A., 1970, The Moses Lake sand dunes: Pullman, Wash., Washington State University, M.S. Thesis, 89 p.
Pitz, C.F., 2003, Moses Lake total maximum daily load groundwater study: Washington State Department of Ecology Environmental Assessment Program, Publication No. 03-03-005, 68 p.

20 Sediment Loading from Crab Creek and Other Sources to Moses Lake, Washington, 2007 and 2008
Rose, N.L., Golding, P.N.E., and Battarbee, R.W., 1995, Selective concentration and enumeration of tephra shards from lake sediment cores: The Holocene, v. 6, no. 2, p. 243-246.
Rubin, D.M., and Topping, D.J., 2001, Quantifying the relative importance of flow regulation and grain size regulation of suspended sediment transport α and tracking changes in grain size of bed sediment β: Water Resources Research, v. 37, no. 1, p. 133-146.
Sarna-Wojcicki, A.M., Shipley, S., Waitt, R.B., Dzurisin, D.W., and Spencer H., 1981, Areal distribution, thickness, mass, volume, and grain size of air-fall ash from the six major eruptions of 1980, in Lipman, P.W., and Mullineaux, D.R., eds., The 1980 Eruptions of Mount St. Helens, Washington: U.S. Geological Survey Professional Paper 1250, p. 577-600.
Sheng, Y.P., and Lick, W., 1979, The transport and resuspension of sediments in a shallow lake: Journal of Geophysical Research, v. 84, no. C4, p. 1809–1826.
Sweeney, M.R., Gaylord, D.R., and Busacca, A.J., 2007, Evolution of Eureka Flat—A dust-producing engine of the Palouse loess, USA: Quaternary International, v. 162-163, p. 76-96.
Symons, T.W., 1882, Report of an examination of the Upper Columbia River the territory in its vicinity in September and October 1881: U.S. Army Corps of Engineers, Report to U.S. Senate Ex. Doc. No. 186, 135 p.
U.S. Interagency Advisory Committee on Water Data, 1982, Guidelines for determining flood flow frequency: Bulletin 17-B of the Hydrology Subcommittee, Office of Water Data Coordination, U.S. Geological Survey, Reston, Va., 183 p., accessed November 18, 2009, at http://water.usgs.gov/osw/bulletin17b/bulletin_17B.html.
Van Metre, P.C., Wilson, J.T., Fuller, C.C., Callender, Edward, and Mahler, B.J., 2004, Collection, analysis, and age-dating of sediment cores from 56 U.S. lakes and reservoirs sampled by the U.S. Geological Survey, 1992-2001: U.S. Geological Survey Scientific Investigations Report 2004-5184 180 p.
Webb, R.H., Griffiths, P.G., Melis, T.S., and Hartley, D.R., 2000, Sediment delivery by ungaged tributaries of the Colorado River in Grand Canyon, Arizona: U.S. Geological Survey Water Resources Investigations Report, 00-4055, 67 p.
Welch, E.B., Jones, C.A., and Barbiero, R.P., 1989, Moses Lake quality—Results of dilution, sewage diversions and BMPS—1977 through 1988: University of Washington Department of Civil and Environmental Engineering, Water Resources Series Technical Report No. 118, 106 p.
Welch, E.B., Tomasek, M.D., and Spyridakis, D.E., 1985, Instability of the Mount St. Helen’s ashlayer in Moses Lake: Journal of Freshwater Ecology, v. 3, p. 103-112.
Wolcott, E.E., 1973, Lakes of Washington—Volume 2, Eastern Washington: Washington State Department of Ecology, Water Supply Bulletin No. 14, 655 p.
Wood, T.M., Cheng, R.T., Gartner, J.W., Hoilman, G.R., Lindenberg, M.K., and Wellman, R.E., 2008, Modeling hydrodynamics and heat transport in Upper Klamath Lake, Oregon, and implications for water quality: U.S. Geological Survey Scientific Investigations Report 2008-5076, 48 p.

Publishing support provided by the U.S. Geological SurveyPublishing Network, Tacoma Publishing Service Center
For more information concerning the research in this report, contact the Director, Washington Water Science Center
U.S. Geological Survey 934 Broadway, Suite 300 Tacoma, Washington 98402 http://wa.water.usgs.gov
Magirl and others—
Sediment Loading from
Crab Creek and Other Sources to M
oses Lake, Washington, 2007 and 2008 —
Scientific Investigations Report 2010–5001


![Hanks Crab Shack | Louisiana Seafood in Katy Texas · snow crab [Served with corn potato] — Snow Crab Shrimp [Served with corn potato]—.— — Dungeness Crab [Served with corn](https://img.pdfslide.us/doc/110x75/5f90e26740a0b71de11bd623/hanks-crab-shack-louisiana-seafood-in-katy-texas-snow-crab-served-with-corn-potato.jpg)