Embed Size (px)
Citation preview
1
Description of MARMAP Sampling
For thirty years, the Marine Resources Research Institute (MRRI) at the South Carolina Department of Natural Resources (SCDNR), through the Marine Resources Monitoring, Assessment and Prediction (MARMAP) program, has conducted fisheries-independent research on groundfish, reef fish, ichthyoplankton, and coastal pelagic fishes within the region between Cape Lookout, North Carolina, and Cape Canaveral, Florida. The overall mission of the program has been to determine distribution, relative abundance, and critical habitat of economically and ecologically important fishes of the South Atlantic Bight (SAB), and to relate these features to environmental factors and exploitation activities. Research toward fulfilling these goals has included trawl surveys (from 6-350 m depth); ichthyoplankton surveys; location and mapping of reef habitat; sampling of reefs throughout the SAB; life history and population studies of priority species; tagging studies of commercially important species and special studies directed at specific management problems in the region. Survey work has also provided a monitoring program that has allowed the standardized sampling of fish populations over time, and development of an historical base for future comparisons of long-term trends. Monitoring of Reef Species Since 1978, MARMAP has monitored reef fish abundance and collected specimens for life history studies. The primary gear types that have been used to sample reef fishes are Florida traps, blackfish traps, chevron traps, bottom longline, kali pole, vertical longline, and hook and line gear. From 1978 to 1987, Florida traps and blackfish traps baited with cut clupeids were soaked for approximately two hours during daylight at 12 study areas with known live-bottom and/or rocky ridges. In 1988 and 1989, Florida snapper and chevron traps were fished synoptically for approximately 90 minutes from a 33.5 m research vessel that was anchored over a randomly selected reef locations. After 1989, blackfish traps and Florida traps were discontinued. Only chevron traps were deployed at stations randomly selected by computer from a database of approximately 2,500 live bottom and shelf edge locations and buoyed for approximately 90 minutes. This database was compiled from MARMAP visual UWTV studies with additional locations added from catch records from the MARMAP and other MRRI projects. During the 1990s, additional sites were obtained for the North Carolina and south Florida area from scientific and commercial fisheries sources to facilitate expanding the overall sampling coverage. Sample sites are all located in the central SAB from 270 N to 340 N. Trapping has occurred to depths as great as 218 m but the majority of trap sampling has occurred at 16 to 91 m. During all years, sampling was conducted during daylight to eliminate light phase as a variable. Night hours were reserved for workup of fishes, steaming time between sites and for tagging and recapture of priority species. CTD profiles were taken after each trap set and before each longline set. Hook and line stations were fished during dawn and dusk periods, one hour preceding and after actual sunrise and sunset. Rods utilizing Electromate motors powered 6/0 Penn Senator reels and 36 kg test monofilament line were fished for 30 minutes by three anglers. The terminal tackle consisted of three 4/0 hooks on 23 kg monofilament leaders 0.25 m long and 0.3 m apart, weighted with sinkers 0.5 to 1 kg. The top and bottom hooks were baited with cut squid and the middle hook baited with cut cigar minnow (Decapterus sp.). This same method of sampling was used between 1978-2001. However, less emphasis has been placed on hook and line sampling during the 1990s to put more effort on tagging of fishes at night and running between stations. In 1997, we began using two types of longline gear to sample the snapper-grouper complex in depths greater than 90 m. Each type of long line was intended to sample one of two unique bottom types (smooth tilefish grounds or rough bottom). In the tilefish grounds (areas of smooth mud), a horizontal long line was deployed and in areas of rough bottom contours, a short vertical long line was used to follow the bottom profile. The horizontal long line consists of 1676 m of 3.2 mm galvanized cable deployed from a longline reel. A total of 1219 m of the cable is used as groundline and the remaining 457 m is buoyed to the surface. One hundred gangions, comprising of an AK snap, approximately 0.5 m of 90 kg monofilament and a #6 or #7 tuna circle hook, are baited with a whole squid and clipped to the ground cable at intervals of 12 m. The gear is set while running with the current at a speed of 4 - 5 knots. An 11 kg weight is
SEDAR10-DW-05
2
attached to the terminal end and 100 gangions are then attached to the ground line, followed by another weight at the terminal end of the ground line. The remaining cable is pulled off of the reel and buoyed with a Hi-Flyer and a polyball trailer buoy. The gear is soaked for 90 minutes and retrieved by fairleading the cable from a side davit of the vessel back on to the longline reel. A similar bottom longline was deployed by MARMAP during the 1980s, however, red porgy are not taken in the tilefish grounds. Where bottom type is rough at depths of 90 to 200 m, short vertical relief longlines consisted of 25.6 m of 6.4 mm solid braid dacron groundline dipped in green copper naphenate. The line is deployed by stretching the groundline along the vessel's gunwale with 11 kg weights attached at the ends of the line. Twenty gangions baited with a whole squid were placed 1.2 m apart on the groundline which was then brommelled to an appropriate length of poly warp and buoyed to the surface with a Hi-Flyer. Sets are made for 90 minutes and the gear is retrieved utilizing a pot hauler. This gear type has only been used since 1997 and a long term data set is not available. During the 1980s, kali pole gear was used on deep water reefs at depths ~150-200 m. Catch per unit effort for the longline gear is expressed as the number per 100 hooks. UWTV recordings were made using a Simrad-Osprey Subsea low light camera attached to a vane stabilized frame during day light hours. The camera is maintained off the bottom 1 - 2 m as the vessel either drifted with the wind and/or current or was towed at low speeds. Recordings for fish identification on bottom habitat and to document new live bottom sites for the MARMAP data base were made on VHS tape and archived for future analysis. Length-frequency data from the catches (to the nearest 1 cm) were recorded by a shipboard data acquisition system. This comprised of a Limnoterra FMB IV digital measuring board and a Toledo model 8142 digital scale, interfaced by an XT personal computer with customized software. During length frequency, subsample tables for priority species were also kept so specimens could be retained for additional life history studies. During length frequency workup, the only total length was recorded for black sea bass and fork length for vermilion snapper. After length frequency workup, fishes are stored on ice for life history workup during night. From the 1990s through the present, specimens for life history workup were collected from eight geographical areas designated by each whole degree of latitude from 270 N to 340 N. South of 320 N and north of 330 N, fifteen specimens of each 1 cm size class were retained from each trip for Centropristis striata, and Rhomboplites aurorubens. Fifty specimens for Pagrus pagrus and Balistes capriscus were retained. In mid latitudes, 320 N to 330 N, five specimens of each 1 cm size class were retained for Centropristis striata, Rhomboplites aurorubens, Balistes capriscus, Haemulon aurolineatum and Diplectrum formosum. Ten specimens were retained for Pagrus pagrus. All other priority specimens were kept for the entire sampling area. During the 1980s, all priority species (species of commercial and recreational important) caught were retained for life history workup. During life history workup, a Limnoterra fish measuring board with 1-mm resolution was used to measure priority species (SL, FL, and TL) with their weights determined by a triple beam balance to the nearest gram. This system was connected to an AT 486-type computer for life history data storage with a paper output as backup.
Mean CPUE of fish caught with traps or hook and line gear is calculated for each year by species as:
!
Mean CPUE (no. fish per trap - hr.) =
"no. fish caught
soak time (hr.)
no. samples
SEDAR10-DW-05
3
Changes in Vessels Three research vessels have been used by MARMAP since 1972, the R/V DOLPHIN, R/V OREGON I, R/V PALMETTO. During 1973-1980, MARMAP used the R/V DOLPHIN. This was a 105’ converted ocean tugboat. It had a single screw and an active rudder. It was outfitted for trawling, plankton work, hydro casts, trapping and was used by NMFS prior to MARMAP. The R/V OREGON I was used by MARMAP during 1981-1988. It was a 105’ vessel that was built by NMFS during WWII to trawl off Alaska. It was outfitted for trawling, plankton work, hydro casts, and trapping. From 1989 to the present, MARMAP has used the R/V PALMETTO. The R/V PALMETTO is 110’, maintains a 5 permanent member sea-going crew, 1 or 2 temporary deckhands, and has accommodations for 9 scientists. There is a 200 sq. ft. wet lab on the main deck with counter space, electronics rack, freshwater and seawater, a double stainless sink, 40 cu. ft. chest freezer, small bait freezer, 120 volts AC and 12 volts DC power supplies. The main deck has 1,014-sq. ft. of open deck space, with davits on both sides. There is a Sea Crane 120 on the main deck for loading, distributing and deploying gear, as well as the zodiac. It has two hydraulic long-line reels, two hydraulic reels for CTD casts and plankton work and a pot-hauler for retrieving traps. Changes in Captains There has been little change in individuals that were captains on these research vessels. Captain John Causby was the captain of the R/V Dolphin during 1973-1980, captain of the R/V OREGON I, and captain of the R/V PALMETTO during 1989-2000. Captain Julian Mikell who was the mate for John Causby since 1978 took over as captain of the R/V PALMETTO in 2000. Changes in Investigators and Chief Scientists The Principal Investigators of MARMAP have been: Victor Burrell, 1972-1976; Fred Berry, 1977-1978; Charlie Barans, 1979-1984; George Sedberry, 1985-1993; Jack McGovern, 1994-2003; and Patrick Harris, 2003-present. Since 1973, scientific personnel, including chief scientist have varied with each cruise. Individuals that functioned as chief scientist during the 1980s include (alphabetical order): Charlie Barans, Dan Machowski, Bill Roumillat, George Sedberry, Dave Schmidt, Charlie Wenner, and Dave Wyanski. Individuals that were chief scientist during the 1990s through 2002 are: Pat Harris, Josh Loefer, Dan Machowski, Jack McGovern, Dave Schmidt, George Sedberry, and Dave Wyanski. Fishery independent samples of gag
Gag have been sampled with a variety of gear types since the inception of MARMAP.
SEDAR10-DW-05

4
SEDAR10-DW-05
Annual Estimation of Juvenile Gag Abundance and Development of a Pre-Recruit Index for the Southeast U.S. Atlantic
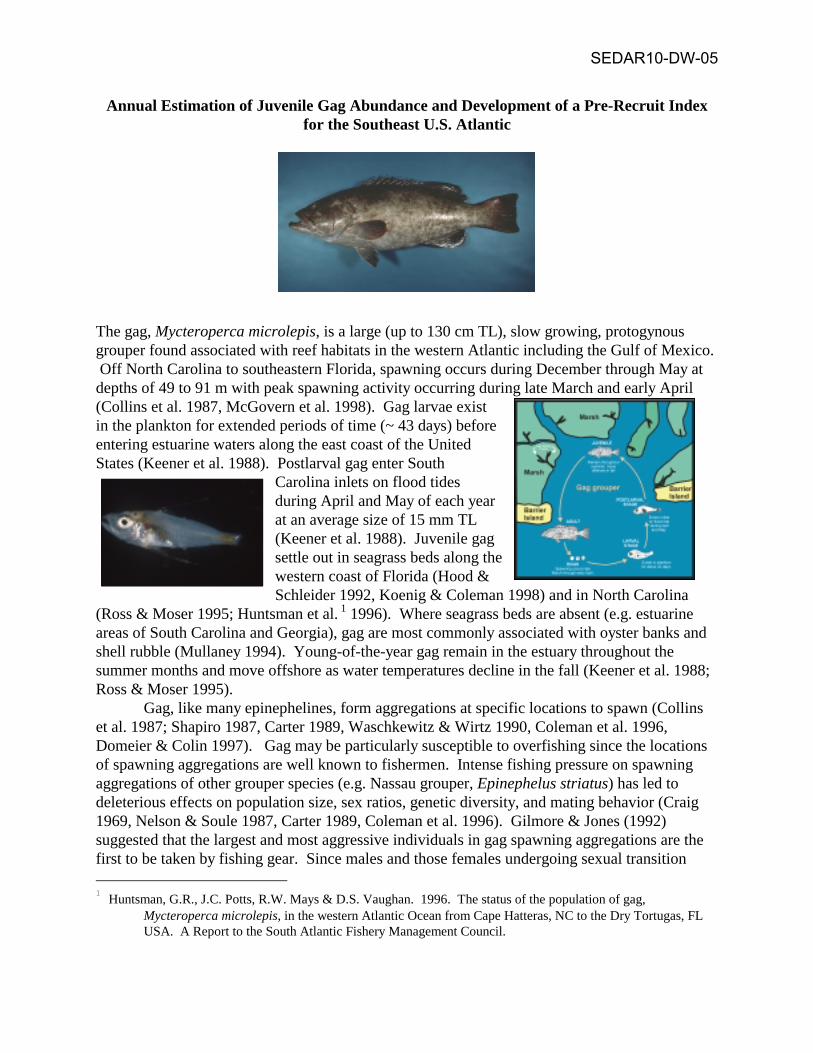
The gag, Mycteroperca microlepis, is a large (up to 130 cm TL), slow growing, protogynous grouper found associated with reef habitats in the western Atlantic including the Gulf of Mexico. Off North Carolina to southeastern Florida, spawning occurs during December through May at depths of 49 to 91 m with peak spawning activity occurring during late March and early April (Collins et al. 1987, McGovern et al. 1998). Gag larvae exist in the plankton for extended periods of time (~ 43 days) before entering estuarine waters along the east coast of the United States (Keener et al. 1988). Postlarval gag enter South
Carolina inlets on flood tides during April and May of each year at an average size of 15 mm TL (Keener et al. 1988). Juvenile gag settle out in seagrass beds along the western coast of Florida (Hood & Schleider 1992, Koenig & Coleman 1998) and in North Carolina
(Ross & Moser 1995; Huntsman et al. 1 1996). Where seagrass beds are absent (e.g. estuarine areas of South Carolina and Georgia), gag are most commonly associated with oyster banks and shell rubble (Mullaney 1994). Young-of-the-year gag remain in the estuary throughout the summer months and move offshore as water temperatures decline in the fall (Keener et al. 1988; Ross & Moser 1995). Gag, like many epinephelines, form aggregations at specific locations to spawn (Collins et al. 1987; Shapiro 1987, Carter 1989, Waschkewitz & Wirtz 1990, Coleman et al. 1996, Domeier & Colin 1997). Gag may be particularly susceptible to overfishing since the locations of spawning aggregations are well known to fishermen. Intense fishing pressure on spawning aggregations of other grouper species (e.g. Nassau grouper, Epinephelus striatus) has led to deleterious effects on population size, sex ratios, genetic diversity, and mating behavior (Craig 1969, Nelson & Soule 1987, Carter 1989, Coleman et al. 1996). Gilmore & Jones (1992) suggested that the largest and most aggressive individuals in gag spawning aggregations are the first to be taken by fishing gear. Since males and those females undergoing sexual transition 1 Huntsman, G.R., J.C. Potts, R.W. Mays & D.S. Vaughan. 1996. The status of the population of gag,
Mycteroperca microlepis, in the western Atlantic Ocean from Cape Hatteras, NC to the Dry Tortugas, FL USA. A Report to the South Atlantic Fishery Management Council.
SEDAR10-DW-05
2
constitute the larger individuals in a population, reproductive potential can be severely altered by harvest practices (Coleman et al. 1996). For example, histological examination of the gonads of 2,606 sexually mature gag collected during 1995 from the western south Atlantic revealed that there were significantly fewer males (5.5%) than during 1976-1982 (19.6%), and that females became sexually mature at smaller sizes (McGovern et al. 1998). Similar changes in the sex ratios of gag from the 1980's Hood and Schleider (1992) to the early 1990's (Coleman et al. (1996) were reported in the Gulf of Mexico. In January 1992, Snapper Grouper Amendment Number 4 included a minimum size limit of 20” total length (TL) for gag, eliminated longline gear within 50 fathoms, prohibited the use of fish traps, and established a 5-fish aggregate grouper recreational bag limit. The 20” TL size limit was expected to increase the Spawning Stock Ratio (SSR) from .35 (M = 0.2) to .39 (SSR < 0.30 = overfishing). In 1998, the minimum size of gag was increased from 20” to 24” and a Spawning Season Closure (March-April) was implemented since gag continued to be overfished. Variability in annual recruitment is the end result of a number of biotic and abiotic factors that affect the survival of early life stages of fishes. Among the more important factors are considered to be food for first feeding larvae, predation, suitable environmental conditions for development (i.e. water temperature) and transport towards favorable nursery areas (Rothschild 1986, McGovern & Olney 1996). However, severe overfishing can also impact the production of recruits. There is an need for an index that is reflective of population level changes in response to recruitment and changing management regulations aimed at restoring population size and sex ratios of gag populations. Moreover, such an index might provide management agencies with ample time to implement harvesting restrictions or increase catch rates. The primary objective of this project was to develop methods and techniques necessary to establish a monitoring program that would eventually provide an annual index of juvenile abundance to predict future year class strength. An additional objective was to determine if cohort strength was linked to sea surface temperatures. Methods Sampling Strategy In 1995, three study sites were set up in an area of high salinity oyster shell habitat with an associated benthic community consisting of sponge and soft coral (Leptogorgia spp). These sites,
Conch Creek (32o 47.’ N, 79o 50.3’ W); Inlet Creek (32o 47.4’ N, 79o 49.7’ W); and Price Creek (32o 52.6’ N, 79o 42.3’ W), are located just north of Charleston, South Carolina between Mt. Pleasant and Bull Bay. In 1996, Dewees Creek (32o 50.0’ N, 79o 45.5’ W) was added in the Charleston area, as were Station Creek A (32o 16.8’ N, 80o 37.5’ W) and Station Creek B (32o 17.6’ N, 80o 37.6’ W) in the vicinity of Beaufort, South Carolina. Baruch A (33o 21.1’ N, 79o 10.8’ W) and Baruch B
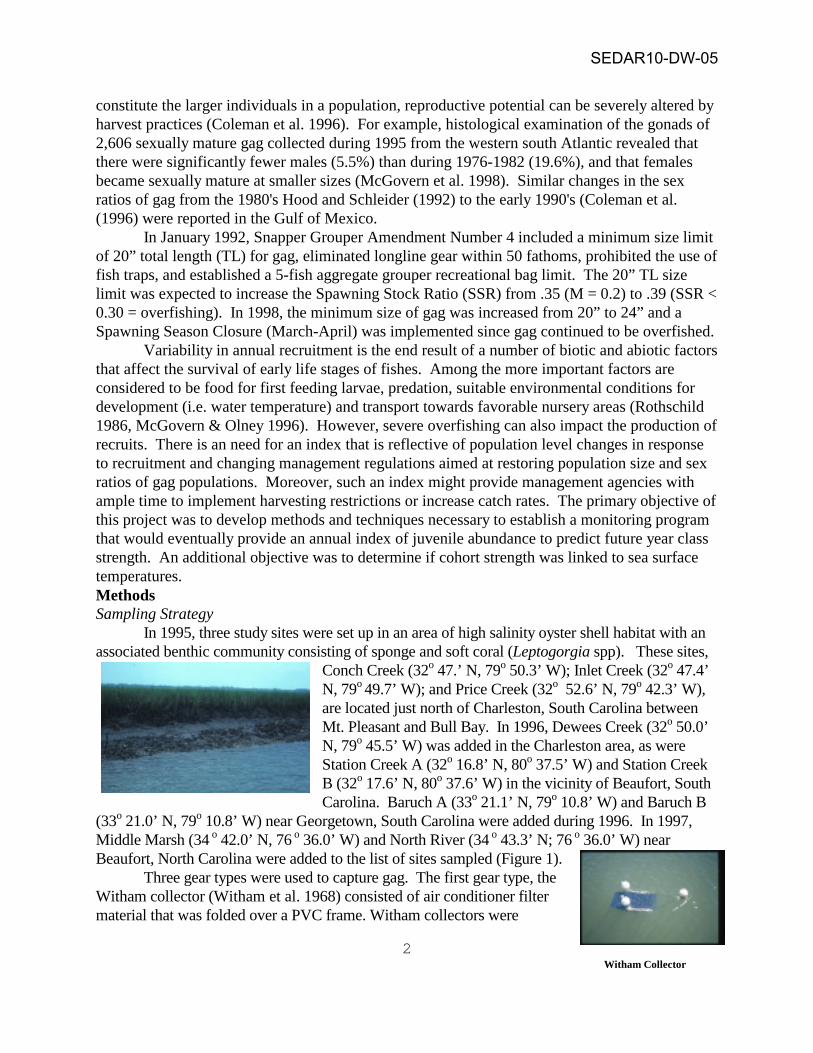
(33o 21.0’ N, 79o 10.8’ W) near Georgetown, South Carolina were added during 1996. In 1997, Middle Marsh (34 o 42.0’ N, 76 o 36.0’ W) and North River (34 o 43.3’ N; 76 o 36.0’ W) near Beaufort, North Carolina were added to the list of sites sampled (Figure 1). Three gear types were used to capture gag. The first gear type, the Witham collector (Witham et al. 1968) consisted of air conditioner filter material that was folded over a PVC frame. Witham collectors were
Witham Collector
SEDAR10-DW-05
3
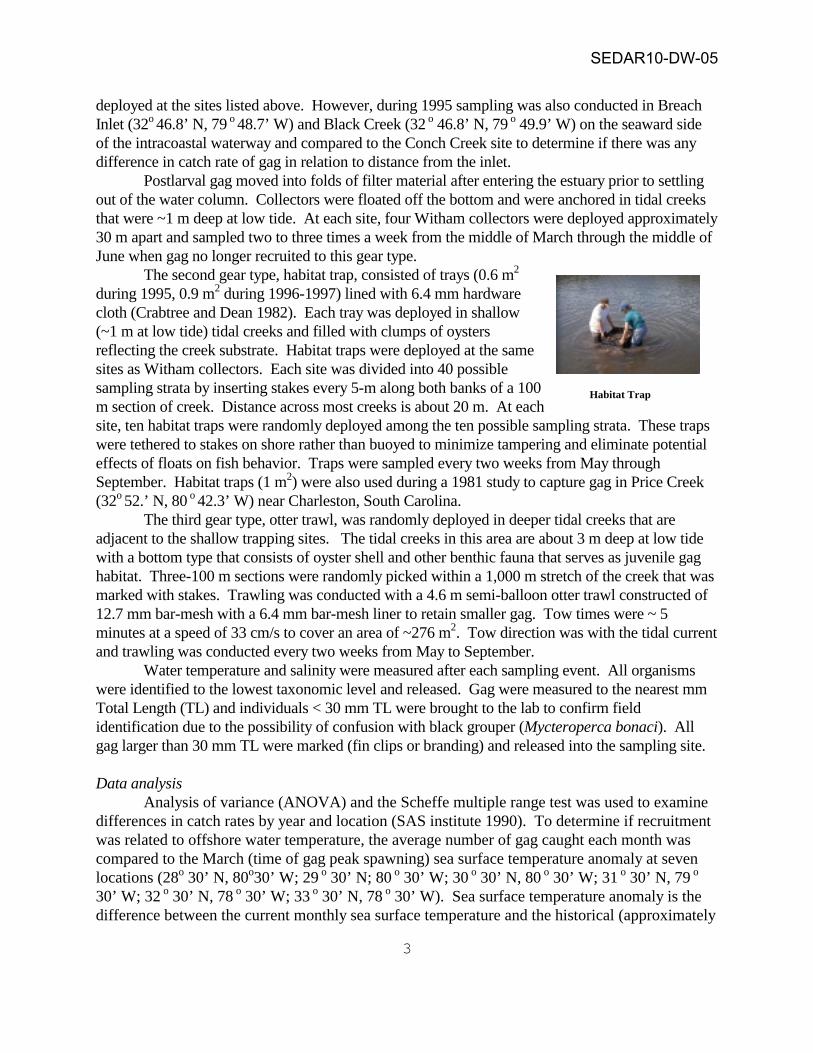
deployed at the sites listed above. However, during 1995 sampling was also conducted in Breach Inlet (32o 46.8’ N, 79 o 48.7’ W) and Black Creek (32 o 46.8’ N, 79 o 49.9’ W) on the seaward side of the intracoastal waterway and compared to the Conch Creek site to determine if there was any difference in catch rate of gag in relation to distance from the inlet. Postlarval gag moved into folds of filter material after entering the estuary prior to settling out of the water column. Collectors were floated off the bottom and were anchored in tidal creeks that were ~1 m deep at low tide. At each site, four Witham collectors were deployed approximately 30 m apart and sampled two to three times a week from the middle of March through the middle of June when gag no longer recruited to this gear type. The second gear type, habitat trap, consisted of trays (0.6 m2 during 1995, 0.9 m2 during 1996-1997) lined with 6.4 mm hardware cloth (Crabtree and Dean 1982). Each tray was deployed in shallow (~1 m at low tide) tidal creeks and filled with clumps of oysters reflecting the creek substrate. Habitat traps were deployed at the same sites as Witham collectors. Each site was divided into 40 possible sampling strata by inserting stakes every 5-m along both banks of a 100 m section of creek. Distance across most creeks is about 20 m. At each site, ten habitat traps were randomly deployed among the ten possible sampling strata. These traps were tethered to stakes on shore rather than buoyed to minimize tampering and eliminate potential effects of floats on fish behavior. Traps were sampled every two weeks from May through September. Habitat traps (1 m2) were also used during a 1981 study to capture gag in Price Creek (32o 52.’ N, 80 o 42.3’ W) near Charleston, South Carolina. The third gear type, otter trawl, was randomly deployed in deeper tidal creeks that are adjacent to the shallow trapping sites. The tidal creeks in this area are about 3 m deep at low tide with a bottom type that consists of oyster shell and other benthic fauna that serves as juvenile gag habitat. Three-100 m sections were randomly picked within a 1,000 m stretch of the creek that was marked with stakes. Trawling was conducted with a 4.6 m semi-balloon otter trawl constructed of 12.7 mm bar-mesh with a 6.4 mm bar-mesh liner to retain smaller gag. Tow times were ~ 5 minutes at a speed of 33 cm/s to cover an area of ~276 m2. Tow direction was with the tidal current and trawling was conducted every two weeks from May to September. Water temperature and salinity were measured after each sampling event. All organisms were identified to the lowest taxonomic level and released. Gag were measured to the nearest mm Total Length (TL) and individuals < 30 mm TL were brought to the lab to confirm field identification due to the possibility of confusion with black grouper (Mycteroperca bonaci). All gag larger than 30 mm TL were marked (fin clips or branding) and released into the sampling site. Data analysis Analysis of variance (ANOVA) and the Scheffe multiple range test was used to examine differences in catch rates by year and location (SAS institute 1990). To determine if recruitment was related to offshore water temperature, the average number of gag caught each month was compared to the March (time of gag peak spawning) sea surface temperature anomaly at seven locations (28o 30’ N, 80o30’ W; 29 o 30’ N; 80 o 30’ W; 30 o 30’ N, 80 o 30’ W; 31 o 30’ N, 79 o 30’ W; 32 o 30’ N, 78 o 30’ W; 33 o 30’ N, 78 o 30’ W). Sea surface temperature anomaly is the difference between the current monthly sea surface temperature and the historical (approximately
Habitat Trap
SEDAR10-DW-05
4
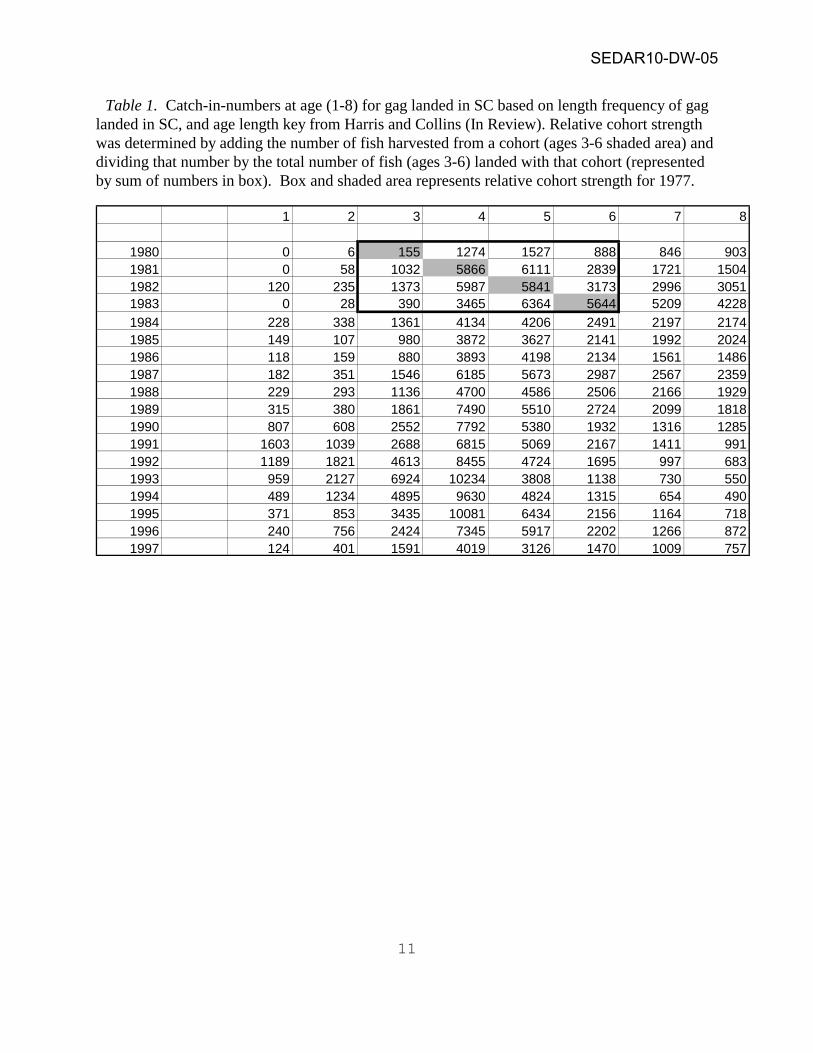
100 years) mean monthly value (U.S. Dept. Comm 1979). Temperature anomaly data for 1977-1980 were obtained from a monthly publication (GULFSTREAM ) produced by the U.S. Department of Commerce, National Oceanic and Atmospheric Administration (NOAA), National Weather Service. Sea surface temperature anomaly data from 1981 were obtained from a publication entitled OCEANOGRAPHIC MONTHLY SUMMARY. Temperature data from 1977-1981 were collected with bathythermograph. Data for 1982-1999 were provided by the International Research Institute for Climate Prediction and the NOAA Office of Global Programs. These data represented a blend of in-situ and satellite data. Correlation Analysis (Jandel Scientific 1996) was used to compare the sea surface temperature anomaly at a number of offshore locations to cohort strength. A gag age-length key generated by Harris & Collins (2002) was applied to the length frequency of gag landed in SC, annual catch estimates from SC (NMFS Fish Statistics and Economic Division, pers. Com.) and SC Headboat Landings (Manooch & Potts 19782) to produce an annual catch-in-numbers-at-age matrix. Long-term data from other southeastern states were not available. The kilograms of gag landed in a given year were divided by weights provided by Huntsman et al. (1996)1 and Manooch & Potts (1998)2 to determine the number of individuals that were landed. Relative cohort strength was determined by adding the number of fish in a cohort (ages 3-6) and dividing that number by the total number of fish (ages 3-6) taken with that cohort (Table 1).
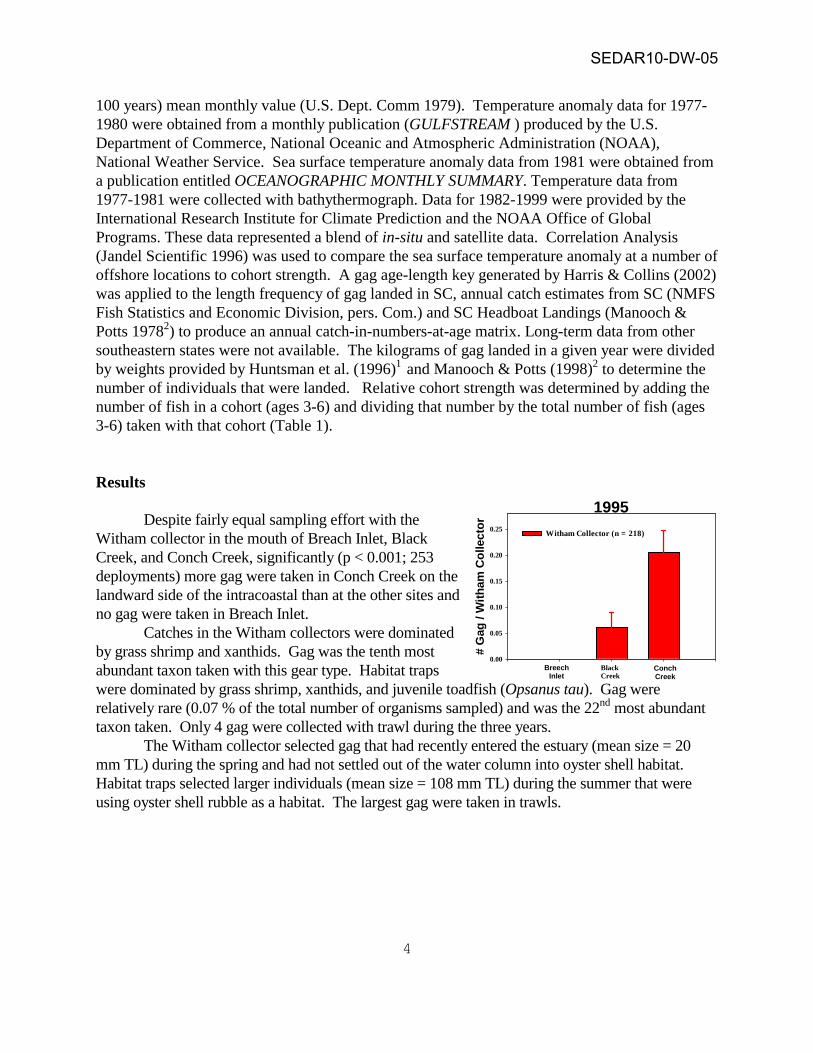
Results Despite fairly equal sampling effort with the Witham collector in the mouth of Breach Inlet, Black Creek, and Conch Creek, significantly (p < 0.001; 253 deployments) more gag were taken in Conch Creek on the landward side of the intracoastal than at the other sites and no gag were taken in Breach Inlet. Catches in the Witham collectors were dominated by grass shrimp and xanthids. Gag was the tenth most abundant taxon taken with this gear type. Habitat traps were dominated by grass shrimp, xanthids, and juvenile toadfish (Opsanus tau). Gag were relatively rare (0.07 % of the total number of organisms sampled) and was the 22nd most abundant taxon taken. Only 4 gag were collected with trawl during the three years. The Witham collector selected gag that had recently entered the estuary (mean size = 20 mm TL) during the spring and had not settled out of the water column into oyster shell habitat. Habitat traps selected larger individuals (mean size = 108 mm TL) during the summer that were using oyster shell rubble as a habitat. The largest gag were taken in trawls.
1995
# G
ag /
With
am C
olle
ctor
0.00
0.05
0.10
0.15
0.20
0.25
BreechInlet
Black Creek
ConchCreek
Witham Collector (n = 218)
SEDAR10-DW-05
5
Rel
ativ
e C
ohor
t Str
engt
h
0.05
0.10
0.15
0.20
0.25
0.30
0.35
0.40
0.45
0.50
Year1977 1980 1983 1986 1989 1992 1995 1998 2001
Sea
Surf
ace
Tem
pera
ture
Ano
mal
y
-4
-3
-2
-1
0
1
2
3
4
5
Relative Cohort Strength
March Sea Surface Temperature Anomaly33o30'; 78o30'
Predicted Cohort Strength
Charleston Sites
# G
ag /
With
am C
olle
ctor
0.00
0.05
0.10
0.15
0.20
Year
# G
ag /
Hec
tare
200
400
600
800
1000
1200
1400
1600
1800
1995 1996 1997
Habitat Traps (N = 1,253)Witham Collector (N = 1,042)
In 1997, catch rates of gag (#/collector) in the Witham collectors was significantly (p < 0.001; 1,020 deployments) greater at the Charleston sites than at the
other locations (in 1995, only the Charleston sites were sampled). The mean number of gag per m2 taken in
habitat traps showed similar trends to Witham collectors. The similarity in catch rates between gear types among sites was particularly evident when considering just the 1997 data. At the Charleston sites, the catch rate of gag taken with Witham collectors and habitat traps was significantly (Witham: p < 0.001, 1,359 deployments; habitat: p = 0.002; 1,271 deployments) greater during 1995. During 1995, gag initially were caught during the two week period of 2-15 April with greatest catch rates occurring during the beginning of May. However, during 1996, the year of poorest catches, no gag were taken during April or May. Inshore water temperatures were much lower during April and May 1996 than during the same months in 1995 and 1997. The greatest number of individuals occurred during mid-June 1996 when water temperatures were similar to that of 1995 and 1997. In contrast, the first gag were taken during mid-March in 1997 when water temperatures were higher than during either May 1995 or May 1996. No gag were caught in Witham collectors during May or June 1997. In 1981, similar habitat traps were used to collect gag at Price Creek (one of our Charleston sites). Densities of gag in Price Creek were much higher in 1981 than during 1995-1997. In 1981, sea surface temperature anomalies at 33o 30'N; 78o 30'N were positive, indicating warmer water temperatures than average. However, with the exception of February and March 1997, water temperatures during 1995-1997 were below the 30-year average. In 1995, most gag were caught in Witham collectors during April when offshore sea surface water temperatures approached the 30- year average. In 1996, the poorest year of gag catches, sea surface temperature was well below
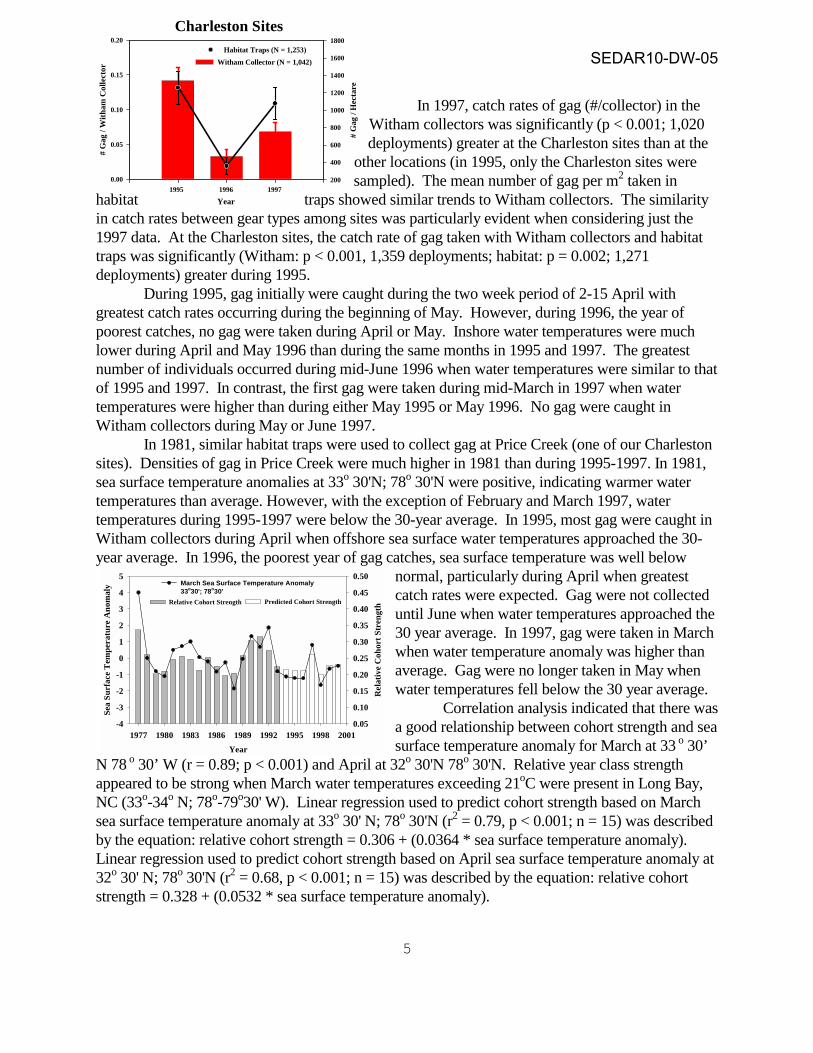
normal, particularly during April when greatest catch rates were expected. Gag were not collected until June when water temperatures approached the 30 year average. In 1997, gag were taken in March when water temperature anomaly was higher than average. Gag were no longer taken in May when water temperatures fell below the 30 year average. Correlation analysis indicated that there was a good relationship between cohort strength and sea surface temperature anomaly for March at 33 o 30’
N 78 o 30’ W (r = 0.89; p < 0.001) and April at 32o 30'N 78o 30'N. Relative year class strength appeared to be strong when March water temperatures exceeding 21oC were present in Long Bay, NC (33o-34o N; 78o-79o30' W). Linear regression used to predict cohort strength based on March sea surface temperature anomaly at 33o 30' N; 78o 30'N (r2 = 0.79, p < 0.001; n = 15) was described by the equation: relative cohort strength = 0.306 + (0.0364 * sea surface temperature anomaly). Linear regression used to predict cohort strength based on April sea surface temperature anomaly at 32o 30' N; 78o 30'N (r2 = 0.68, p < 0.001; n = 15) was described by the equation: relative cohort strength = 0.328 + (0.0532 * sea surface temperature anomaly).
SEDAR10-DW-05
6
Strong deflection of Gulf Stream causes warm water to move onshore.
Discussion Annual recruitment indices have been a powerful tool in the successful management of finfish and crustacean fisheries. For example, estimates of juvenile abundance of striped bass (Morone saxatilis) have been used since 1954 in Maryland and Virginia to predict future year-class strength. Goodyear (1985) identified a very strong statistical relationship between striped bass landings and Maryland DNR striped bass young-of-the-year indices (as measured by seine surveys), thereby supporting the continued use of this index for setting future harvest levels. Similarly, settlement by postlarvae of the western Australian rock lobster (Panulirus cygnus) has been used to predict the population size and fishing harvest of sub-adults three to four years in advance (Morgan et al. 1982). Collins et al. (1998) determined that the abundance of age –0 mackerels in a fishery-independent trawl survey could be used to predict the abundance of age-1 king mackerel and Spanish mackerel. In the present study, we were unable to determine the value of data obtained from our sampling to predict recruitment because the sampling period was short in proportion to the life span of the species. In addition, gag do not become fully recruited to commercial fishing gear until age four or five. At least a six -year time series would be required to link juvenile abundance to the number of fishes landed commercially to determine if the recruitment index has any predictive value. The estuarine-dependent nature of young-of-the-year gag may facilitate the establishment of a regional recruitment index.
Recruitment is the end result of the effect of many biotic and abiotic factors on the survival of the early developmental stages of a fish. Some of the more important factors include food for first feeding larvae, water temperature, predation on early life stages, and transport to favorable nursery areas (Rothschild 1986, Houde 1987, McGovern & Olney 1996). Recruitment appeared to be related to water temperature as relative cohort strength was strongest when water temperatures at 33o 30' N; 78o 30' W (Long Bay, NC) were above average. Water temperature has been implicated as a cause of recruitment variability in other fish species. For example, Francis (1993) reported that sea surface temperature explained 94% of the variability in year class strength of Pagrus auratus in New Zealand. Other investigators (i.e. Roff 1981, Shepherd et al. 1984, Böhling et al. 1991,
Rutherford & Houde 1994) also determined that water temperature explained much of the variabilty in year class strength of fish species. McGovern & Olney (1996) found that year class strength of striped bass in the Pamunkey River, VA during1988 was much poorer than 1989 despite similar levels of egg production. Lower water temperatures and reduced food densities during 1988 may have combined to prolong development of striped bass eggs and larvae making them more susceptible to elevated predator densities (McGovern & Olney 1996).
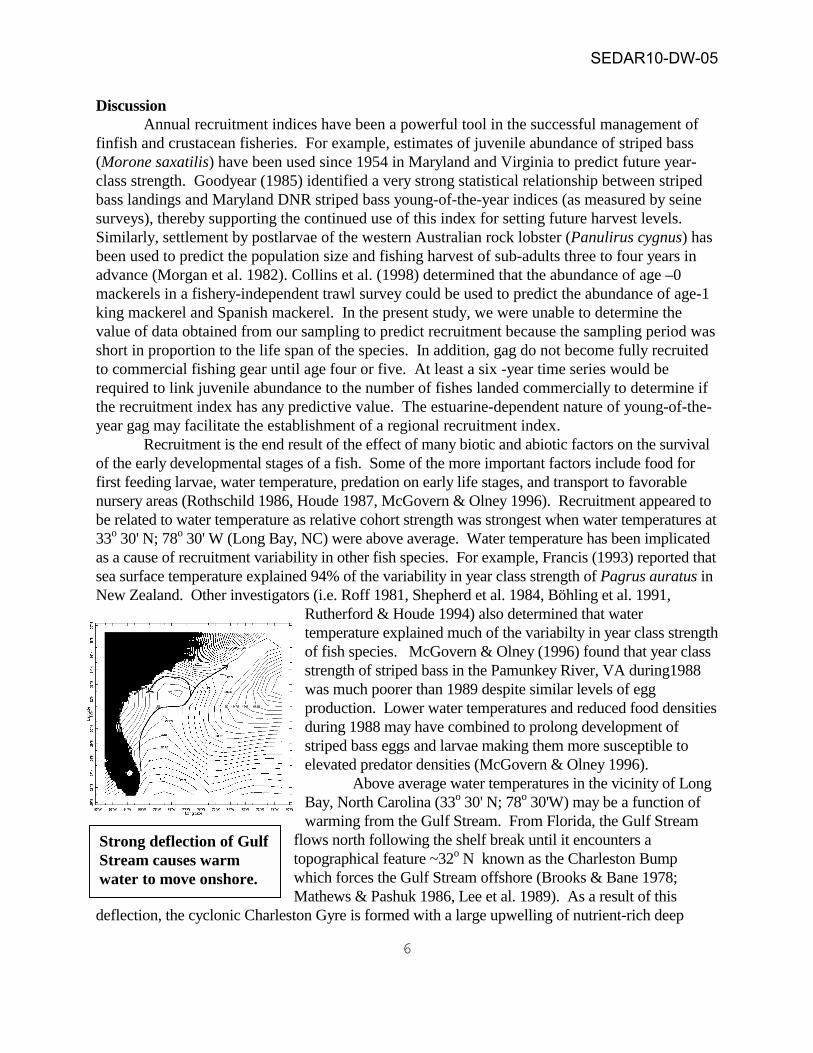
Above average water temperatures in the vicinity of Long Bay, North Carolina (33o 30' N; 78o 30'W) may be a function of warming from the Gulf Stream. From Florida, the Gulf Stream
flows north following the shelf break until it encounters a topographical feature ~32o N known as the Charleston Bump which forces the Gulf Stream offshore (Brooks & Bane 1978; Mathews & Pashuk 1986, Lee et al. 1989). As a result of this
deflection, the cyclonic Charleston Gyre is formed with a large upwelling of nutrient-rich deep
SEDAR10-DW-05
water in its cold core (Mathews & Pashuk 1986, Lee et al. 1989). This gyre is a permanent feature that causes shoreward intrusion of upper Gulf Stream water onto the continental shelf (Aktinson et al. 1985). The Charleston Gyre has a seasonal component where it is most pronounced during the summer when stratified conditions and increased speed of the Gulf Stream causes greater deflection, a stronger gyre and a greater extent of intrusion of Gulf Stream water onto the continental shelf (Blanton et al. 1981, Singer et al. 1983). However, these "summer conditions" can be sometimes be experienced at other times of the year. For example, Paffenhöfer et al. (1995) indicated that there was water of Gulf Stream origin on most of the middle shelf off SC during late January-early February 1990. Paffenhöfer et al. (1995) reported that 1990 temperatures were higher than found in this same region during 1986. We found that the March sea surface temperature anomaly (33o30' N; 78o30' W) was well above average and relative year class strength of gag was very strong during 1990. During 1986, March sea surface temperature anomaly (33o30' N; 78o30' W) was below normal and relative cohort strength of gag was poor.
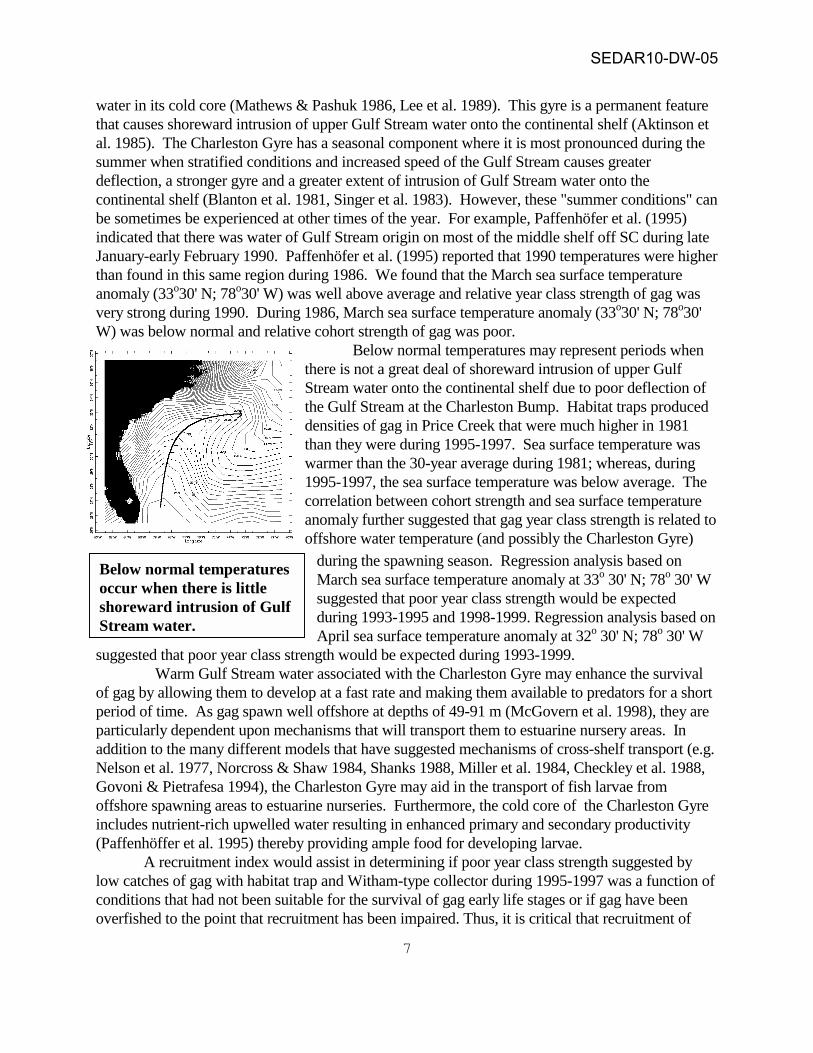
Below normal temperatures may represent periods when there is not a great deal of shoreward intrusion of upper Gulf Stream water onto the continental shelf due to poor deflection of the Gulf Stream at the Charleston Bump. Habitat traps produced densities of gag in Price Creek that were much higher in 1981 than they were during 1995-1997. Sea surface temperature was warmer than the 30-year average during 1981; whereas, during 1995-1997, the sea surface temperature was below average. The correlation between cohort strength and sea surface temperature anomaly further suggested that gag year class strength is related to offshore water temperature (and possibly the Charleston Gyre)
during the spawning season. Regression analysis based on March sea surface temperature anomaly at 33o 30' N; 78o 30' W suggested that poor year class strength would be expected during 1993-1995 and 1998-1999. Regression analysis based on
o o
Strong deflection of Gulf Stream results in warm water moving on shelf.
SEDAR10-DW-05
Below normal temperatures occur when there is little shoreward intrusion of GulfStream water.
7
April sea surface temperature anomaly at 32 30' N; 78 30' W suggested that poor year class strength would be expected during 1993-1999.
Warm Gulf Stream water associated with the Charleston Gyre may enhance the survival of gag by allowing them to develop at a fast rate and making them available to predators for a short period of time. As gag spawn well offshore at depths of 49-91 m (McGovern et al. 1998), they are particularly dependent upon mechanisms that will transport them to estuarine nursery areas. In addition to the many different models that have suggested mechanisms of cross-shelf transport (e.g. Nelson et al. 1977, Norcross & Shaw 1984, Shanks 1988, Miller et al. 1984, Checkley et al. 1988, Govoni & Pietrafesa 1994), the Charleston Gyre may aid in the transport of fish larvae from offshore spawning areas to estuarine nurseries. Furthermore, the cold core of the Charleston Gyre includes nutrient-rich upwelled water resulting in enhanced primary and secondary productivity (Paffenhöffer et al. 1995) thereby providing ample food for developing larvae. A recruitment index would assist in determining if poor year class strength suggested by low catches of gag with habitat trap and Witham-type collector during 1995-1997 was a function of conditions that had not been suitable for the survival of gag early life stages or if gag have been overfished to the point that recruitment has been impaired. Thus, it is critical that recruitment of
8
juvenile gag to estuarine nursery areas along the southeast U.S. coast (NC to FL) be estimated to provide fishery managers with an annual index for predicting gag year class strength and evaluation of pre-fishery recruitment stock condition. We have shown that Witham collectors and habitat traps may be good gear types to monitor recruitment success of postlarval gag in estuarine waters of South Carolina and North Carolina. Furthermore, Witham collectors may be a particularly valuable gear type for monitoring recruitment of gag from NC to FL since the collector can be used regardless of the habitat type (i.e. seagrass or oyster shell) used locally by gag. A regional annual recruitment index would: (1) serve as a large-scale monitor of gag reproductive success (if fishing pressure has diminished reproductive capacity to the point that recruitment is impaired); (2) act as a predictor of year class strength (3) assist with the regional management of good and poor year classes; (4) help to fine-tune annual assessments (VPA analyses); and (5) assist in the identification of factors that are responsible for good and poor recruitment. References cited Atkinson, L.P., D.W. Menzel & K.A. Bush. 1985. Oceanography of the Southeastern U.S.
Continental Shelf. American Geophysical Union. 156 pp. Blanton, J.O., L.P. Atkinson, L.J. Pietrafesa & T.N. Lee. 1981. The intrusion of Gulf Stream
water across the continental shelf due to topographically-induced upwelling. Deep-Sea Research 28:393-405.
Brooks, D.A. & J.M. Bane. 1978. Gulf Stream deflection by a bottom feature off Charleston, South Carolina. Science 201: 1225-1226.
Böhling, P., R. Hudd, H. Lehtonen, P. Karås, E. Neuman & G. Thoresson. 1991. Variations in year-class strength of different perch (Perca fluviatilis) populations in the Baltic Sea with special reference to temperature and pollution. Can. J. Fish. Aquat. Sci. 48:1181-1187.
Carter, J.J. 1989. Grouper sex in Belize. Nat. Hist. 61-68. Checkley, D.M., S. Raman, G.L. Maillet & K.M. Mason. 1988. Winter storm effects on the
spawning and larval drift of a pelagic fish. Nature 355: 346-348. Coleman, F.C., C.C. Koenig & L.A. Collins. 1996. Reproductive styles of shallow-water
groupers (Pisces:Serranidae) in the eastern Gulf of Mexico and the consequences of fishing spawning aggregations. Environ. Biol. Fish. 47:129-141.
Collins, M.R., P.J. Harris & P.P. Maier. 1998. Fishery-independent indices for king and Spanish mackerels. N. Am. J. Fish. Manag. 18:181-186.
Collins, M.R., C.W. Waltz, W.A. Roumillat & D.L. Stubbs. 1987. Contributions to the life history and reproductive biology of gag, Mycteroperca microlepis, (Serranidae), in the South Atlantic Bight. Fish. Bull. 85(3):648-653.
Crabtree, R.E. & J.M. Dean. 1982. The structure of two South Carolina estuarine tide pool fish assemblages. Estuaries 5:2-9.
Craig, A.E. 1969. The grouper fishery of Cay Glory, British Honduras. Annals Assn. Amer. Geog. 59(2):252-299.
Domeier, M.L. & P.L. Colin. 1997. Tropical reef fish spawning aggregations:defined and reviewed. Bull. Mar. Sci. 60:698-726.
Francis, M.P. 1993. Does water temperature determine year class strength in New Zealand snapper (Pagrus auratus, Sparidae)? Fish. Oceanogr. 2:65-72.
SEDAR10-DW-05
9
Gilmore, R.G. & R.D. Jones. 1992. Color variation and associated behavior in the epinepheline groupers, Mycteroperca microlepis, (Goode and Bean) and M. phenax Jordan and Swain. Bull. Mar. Sci. 51(1):83-103.
Goodyear, C.P. 1985. Relationship between reported commercial landings and abundance of young striped bass in the Chesapeake Bay, Maryland. Trans. Am. Fish. Soc. 114:92-96.
Govoni, JJ. & L.J. Pietrafesa. 1994. Eularian views of layered water currents, vertical distribution of some larval fishes, and inferred advective transport over the coninental shelf off North Carolina, USA, in winter. Fish. Ocean. 3:120-132.
Harris, P.J. and M.R. Collins. 2000. A comparison of the age, growth, and age at maturity for gag, Mycteroperca microlepis, from the southeastern United States during 1976-1982 and 1994-1995. Bulletin of Marine Science. 66:105-117.
Hood, P.B. & R.A. Schleider. 1992. Age, growth, and reproduction of gag, Mycteroperca microlepis, (Pisces:Serranidae), in the eastern Gulf of Mexico. Bull. Mar. Sci. 5(3):337-352.
Houde, E. D. 1987. Fish early life dynamics and recruitment variability. American Fisheries Society Symposium 2:17-29.
Jandel Scientific. 1996. TableCurve 2D, version 4.0 AISN Software, San Rafael, California. Keener, P., G.D. Johnson, B.W. Stender, E.B. Brothers & H.R. Beatty. 1988. Ingress of
postlarval gag, Mycteroperca microlepis, (Pisces:Serranidae), through a South Carolina barrier island inlet. Bull. Mar. Sci. 42(3):376-396.
Koenig, C.C. & F.C. Coleman. 1998. Absolute abundance and survival of juvenile gags in sea beds of the northeastern Gulf of Mexico. Trans. Am. Fish. Soc. 127:44-55.
Lee, T.N., W. Williams, J. Wang, R. Evans & L. Atkinson. 1989. Response of South Carolina continental shelf water to wind and Gulf Stream forcing during winter 1986. J. Geo. Res. 94: 10715-10754.
Mathews, T.D. & O. Pashuk. 1986. Summer and winter hydrography of the U.S. South Atlantic Bight (1973-1979). Journal of Coastal Research.
McGovern, J.C., D.M. Wyanski, O. Pashuk, C.S. Manooch, III & G.R. Sedberry. 1998. Changes in the sex ratio and size at maturity of gag, Mycteroperca microlepis, from the Atlantic coast of the southeastern United States during 1976-1995. Fishery Bulletin 96.
McGovern, J.C. & J.E. Olney. 1996. A biological and environmental characterization of striped bass spawning grounds on the Pamunkey River, VA. Can J. Fish. Aquat. Sci. 53:1713-1726.
Miller, J.M., J.P. Reed & L.J. Pietrafesa. 1984. Patterns, mechanisms and approached to the study of estuarine dependent fish larvae and juveniles. IN: Mechanisms of Migration In Fishes. J.D. McCleave, G.P. Arnold, J.J. Dodson and W.H. Neill (eds.) New York: Plenum Press, pp. 209-255.
Morgan, G.R., Phillips, B.F. & L.M. Joll. 1982. Stock and recruitment relationships in Panuluris cygnus, the commercial rock (spiny) lobster of Western Australia. Fish. Bull., U.S. 80:475-486.
Mullaney, M.D., Jr. 1994. Ontogenetic shifts in diet of gag, Mycteroperca microlepis, (Goode and Bean), (Pisces:Serranidae). Proc. Gulf Carib. Fish. Inst. 43: 432-445.
SEDAR10-DW-05
10
Nelson, K. & M. Soule. 1987. Genetic conservation of exploited fishes. Pp. 345-368 in: Ryman, N. and F. Utter (eds.), Population Genetics and Fishery Management. Univ. Washington Press.
Nelson, W.R., M.C. Ingham & W.e. Schaaf. 1977. Larval transport and year-class strength of the Atlantic menhaden, Brevoortia tyrannus. Fish. Bull. 75:23-41.
Norcross, B.L. & R.F. Shaw. 1984. Oceanic and estuarine transport of fish eggs and larvae: a review. Trans. Am. Fish. Soc. 113:153-165.
Paffenhöfer, G.A., L.P. Atkinson, T.N. Lee, P.G. Verity & L.R. Bulluck, III. 1995. The abundance and distribution of zooplankton on the Southeastern U.S. continental shelf. IN: Oceanography of the Southeast United States Continental Shelf. (Eds. L.P. Atkinson, D.W. Menzel, and K.A. Bush). American Geophysical Union, Washington, D.C. 104pp.
Roff, D.A. 1981. Reproductive uncertainty and the evolution of iteroparity: why don’t flatfish put all their eggs in one basket? Can. J. Fish. Aquat. Sci. 38:968-977.
Ross, S.W. & M.L. Moser. 1995. Life history of juvenile gag, Mycteroperca microlepis, in North Carolina estuaries. Bull. Mar. Sci. 56:222-237.
Rothschild, B.J. 1986. Dynamics of Marine Fish Populations. Cambridge, MA. Harvard University Press.
Rutherford, E.S. & E.D. Houde. 1994. The influence of temperature on cohort-specific growth, survival, and recruitment of striped bass, Morone saxatlilis, larvae in Chesapeake Bay. Fish. Bull. 93:315-332.
SAS Institute. 1990. SAS/STAT® user’s guide, version 6, 4th edition. SAS institute Institute. Cary, North Carolina.
Singer, J.J., L.P. Atkinson, J.O. Blanton & J.A. Yoder. 1983. Cape Romain and the Charleston Bump: Historical and Recent Hydrographic Observations. J. Geo. Res. 88:4685-4697.
Shanks, A.L. 1988. Further support for the hypothesis that internal waves can cause shoreward transport of larval invertebrates and fish. Fish. Bull. 86:703-714.
Shapiro, K.Y. 1987. Reproduction in groupers. Pp. 295-317 in: Popovina, J.J. and S. Ralston (eds.), Tropical Snappers and Groupers. Biology and Fisheries Management. Westview Press.
Shepherd, J.G., J.G. Pope & R.D. Cousens. 1984. Variation in fish stocks and hypotheses concerning their links with climate. Rapp. P.V. Réun. Cons. Perm. Int. Explor. Mer 183:243-254.
Waschkewitz, R. & P. Wirtz. 1990. Annual migration and return to the same site by an individual grouper, Epinephelus alexandrinus (Pisces, Serranidae). J. Fish. Biol. 36:781-782.
Witham, R.R., R.M. Ingle & E.A. Joyce, Jr. 1968. Physiological and ecological studies of Panulirus argus from the St. Lucie estuary. Fl. Bd. Cons. Tech. Ser. 53:1-31.
U.S. Department of Commerce. 1977. Gulfstream 3(6). 7 pp.
SEDAR10-DW-05
11
Table 1. Catch-in-numbers at age (1-8) for gag landed in SC based on length frequency of gag landed in SC, and age length key from Harris and Collins (In Review). Relative cohort strength was determined by adding the number of fish harvested from a cohort (ages 3-6 shaded area) and dividing that number by the total number of fish (ages 3-6) landed with that cohort (represented by sum of numbers in box). Box and shaded area represents relative cohort strength for 1977.
1 2 3 4 5 6 7 8
1980 0 6 155 1274 1527 888 846 9031981 0 58 1032 5866 6111 2839 1721 15041982 120 235 1373 5987 5841 3173 2996 30511983 0 28 390 3465 6364 5644 5209 42281984 228 338 1361 4134 4206 2491 2197 21741985 149 107 980 3872 3627 2141 1992 20241986 118 159 880 3893 4198 2134 1561 14861987 182 351 1546 6185 5673 2987 2567 23591988 229 293 1136 4700 4586 2506 2166 19291989 315 380 1861 7490 5510 2724 2099 18181990 807 608 2552 7792 5380 1932 1316 12851991 1603 1039 2688 6815 5069 2167 1411 9911992 1189 1821 4613 8455 4724 1695 997 6831993 959 2127 6924 10234 3808 1138 730 5501994 489 1234 4895 9630 4824 1315 654 4901995 371 853 3435 10081 6434 2156 1164 7181996 240 756 2424 7345 5917 2202 1266 8721997 124 401 1591 4019 3126 1470 1009 757
SEDAR10-DW-05