Embed Size (px)
Citation preview

8/6/2019 Security Valuation Of Paper Industry
http://slidepdf.com/reader/full/security-valuation-of-paper-industry 1/37
ST. XAVIER’S COLLEGE - KOLKATA Page 1
ACKNOWLEDGEMENTACKNOWLEDGEMENTACKNOWLEDGEMENTACKNOWLEDGEMENT
The success of this study was undoubtedly ensured by the support of a lot of people,
many of whom I would like to acknowledge.
First and foremost, special thanks go to my supervisor, Prof. P. P. Ghosh for all his
willingness to respond to my questions, support, and constructive criticism and guidance in
completing this report. He helped and encouraged me a lot in this research work &
safeguarded the completion of this research and supported the purpose of my study right
from the beginning.
The supporting teacher often invested additional time in the project and did
everything in his power to ensure the quality of the project which resulted in a great
impact on the success of this work.
Thanks to my friend Ghanshyam Agarwal, student of ICFAI, who acted as an
advisor of the study. He also helped me in calculating value of Beta in the project.
It was very difficult to find the right words to express what a great honour it was for
me to work with two extremely courageous and open-minded men (as mentioned above)
who inspired & appreciated me a lot and without whose help I could not have finished this
project.
The data for the project has been collected from various sources like magazines,
newspapers, websites, books etc. for a detailed study of the subject.
Thank you all for your kind support, guidance, comments on my research during
the long process of evaluating the project in the field and writing up the results.
My final acknowledgement is to my parents who always supported me in my aims
and goals.

8/6/2019 Security Valuation Of Paper Industry
http://slidepdf.com/reader/full/security-valuation-of-paper-industry 2/37
ST. XAVIER’S COLLEGE - KOLKATA Page 2
METHODOLOGY METHODOLOGY METHODOLOGY METHODOLOGY
The data used for this project preparation has 2 parts :
PRIMARY DATA Lack of proper sources to reach and to have a discussion with the people at higher
post made it difficult to collect primary data. On the other hand massive time constraint
also created problem for the purpose of gathering the views of people at higher post from
various industries across the board. So I approached my supervisor Prof. P. P. Ghosh and
one of my friends named Ghanshyam Agarwal for giving their views about the paper
industry. So I would like to thank them for taking out some time for me from their precious
time and share their views and projecting the study.
SECONDARY DATA In this research work most of the content has been obtained from secondary sources
like newspapers, magazines, books websites etc., which helped for calculation of variousterms used for the evaluation purpose in course of security analysis for paper industries.

8/6/2019 Security Valuation Of Paper Industry
http://slidepdf.com/reader/full/security-valuation-of-paper-industry 3/37
ST. XAVIER’S COLLEGE - KOLKATA Page 3
OBJECTIVE OF THE STUDY OBJECTIVE OF THE STUDY OBJECTIVE OF THE STUDY OBJECTIVE OF THE STUDY
The objective of the project work is given here under :
1. Analysing the intrinsic value of the securities of the selected 3 listed companies and
comparing it with the market price of the securities on a certain date (i.e. 1st April
2008)and taking decision whether the stock is undervalued or overvalued.
2. Applying Michael Porter’s 5 Force Model in security analysis for paper industry and
analysing the effects of all the forces on the industry and on the securities as a whole,
whether there is positive or negative effect.

8/6/2019 Security Valuation Of Paper Industry
http://slidepdf.com/reader/full/security-valuation-of-paper-industry 4/37
ST. XAVIER’S COLLEGE - KOLKATA Page 4
INTINTINTINTRODUCTION OF THE STUDY RODUCTION OF THE STUDY RODUCTION OF THE STUDY RODUCTION OF THE STUDY
Demand for paper is increasing over the years. . So we can say that this will
positively affect the profit of the paper industry. This growth in profit will definitely attract the investors and therefore there is a need of security analysis and equity valuation for the
paper industry to project its performance in the future. This will help the investors to
ascertain their returns.
With reference to this project work, the methods of valuation of firm, demand of
paper in future, calculation of intrinsic value of firm and accordingly calculation of the
prices of securities has been done to compare it with current market price of the securities.
Michael Porter’s 5 Force Model has been applied to the industry for security analysispurpose.
Calculation of cost of equity shares, risk free rate of return, return on market
portfolio, beta calculation, Weighted Average Cost of Capital (WACC), free cash flow
available, Terminal value & finally calculation of intrinsic value of the securities has been
done. After calculation of this, comparison has been made with market value of the
securities and investment suggestion is drawn.
Lastly Michael Porter’s 5 Force model has been applied to do the security analysis of
the paper industry and conclusion is drawn along with mentioning limitations.
HISTORY OF PAPER INDUSTRY The first paper mill in India was established in the year 1832. Today, among the top
15 global players, the Indian paper industry contributes Rs.25 billion to the Indian
government and provides employment to around 1.3 million people in the country. There
are about 666 industrial units involved in the manufacture of pulp, paper, out of whichnearly 568 are in operation. Growing three times the rate of global average, the Indian
paper industry is poised to grow to 14 million tonnes in 2015-16 from 7.2 million tonnes in
2005-06.

8/6/2019 Security Valuation Of Paper Industry
http://slidepdf.com/reader/full/security-valuation-of-paper-industry 5/37
ST. XAVIER’S COLLEGE - KOLKATA Page 5
KEY INDICATORS Indicator Units Dec-01 Dec-02 Dec-03 Dec-04 Dec-05
Paper: Production Tonnes 4833665 4950302 5239181 5556017 5792846
Paper: Export value Rs.crore 559.3 614.3 812.6 712.5 870.9
Paper: Import value Rs.crore 662.8 648.4 745.1 1057.8 1046.2
Paper: Sales value Rs.crore 12600 13400 14000 15500 16000
Paper: Market size Rs.crore 13262.8 14048.4 14745.1 16557.8 17046.2
Paper: Domestic consumption Rs.crore 12703.5 13434.1 13932.5 15845.4 16175.3
VALUATION OF FIRM Valuation of a firm is done in order to know the intrinsic value of a firm. Knowing
what an asset is worth and what determines that value, in deciding on the appropriate
price to pay or receive is the main task for the valuation. We should not buy assets for
aesthetic or emotional reasons rather we must buy financial assets after comparing the
cash flows that we expect to receive from them with the initial cash outflow. Consequently,
perceptions of value have to be backed up by reality, which implies that the price we pay
for any asset should reflect the cash flows it is expected to generate. The main objective of
any valuation is to know whether the underlying assets is undervalued or overvalued. If it
is undervalued then it’s purchased and on the other hand if it’s overvalued then it is sold.
Here one assumption is made by the analyst that the market is inefficient and make
mistake in assessing the value. All the information is not reflected in the market price and it
take time for the market to absorb all the fundamental information.
There are various models, by which we can calculate the intrinsic value of assets
such as :
1. Discounted cash flow method,
2. Relative method, etc.

8/6/2019 Security Valuation Of Paper Industry
http://slidepdf.com/reader/full/security-valuation-of-paper-industry 6/37
ST. XAVIER’S COLLEGE - KOLKATA Page 6
SCENARIO OF INDIAN PAPER INDUSTRY I have chosen the paper industry because in India it is more than a century old. At
present there are over 600 paper mills manufacturing a wide variety of items required by
the consumers. These paper mills are manufacturing industrial grades, cultural grades and
other specialty papers. The paper industry in India could be classified into 3 categories
according to the raw material consumed.
1. Wood based
2. Agro based and
3. Waste paper based
While the number of wood based mills is around 20 and balance 580 mills are based
on non-conventional raw materials.
Government has completely de-licensed the paper industry with effect from 17th
July, 1997. The Paper industry is a priority sector for foreign collaboration and foreign
equity participation up to 100% receives automatic approval by Reserve Bank of India.
Several fiscal incentives have also been provided to the paper industry, particularly to
those mills which are based on non-conventional raw material. It is estimated that the
paper industry would be growing at the present rate of 7-8% of compounded rate and
would require 9.5-10 million tonnes by the end of the decade from the existing production
of around 6.7 million tonnes.

8/6/2019 Security Valuation Of Paper Industry
http://slidepdf.com/reader/full/security-valuation-of-paper-industry 7/37
ST. XAVIER’S COLLEGE - KOLKATA Page 7
A LOOK AT THE OPERATION CYCLE OF THE PAPER I NSUSTRY

8/6/2019 Security Valuation Of Paper Industry
http://slidepdf.com/reader/full/security-valuation-of-paper-industry 8/37
ST. XAVIER’S COLLEGE - KOLKATA Page 8
GROWTH IN DEMAND OF PAPER IN INDIA
• The demand is growing @ 7% to 8% Compounded Annual Growth Rate (CAGR) per
Annum.
• Demand in Million tonnes is 8.100 by 2006-07, 8.500 by 2007-08 and 9.000 by 2008-09
respectively.
INDIAN PAPER DEMAND VS. WORLD PAPER DEMAND Paper is an essential commodity. Its per capita consumption is currently 7 kg, one of
the lowest in the region. World paper demand growth is subdued and is between 2-3
per cent, against India’s 8 per cent . This high growth rate has been possible by a strong
emphasis on literacy, increase in per-capita income, increasing use of photocopiers and
printers, higher export growth and demand for high quality packaging. India’s total annual
production and consumption of paper and paper board is around 8 million tonnes —
barely 2 per cent of global production. It is projected that India’s paper demand would
reach 17 million tonnes by year 2015.

8/6/2019 Security Valuation Of Paper Industry
http://slidepdf.com/reader/full/security-valuation-of-paper-industry 9/37
ST. XAVIER’S COLLEGE - KOLKATA Page 9
NEEDS OF INDIAN PAPER INDUSTRY FOR BEING
GLOBALLY MORE COMPETETIVE i. Sustained availability of good quality of raw materials (forest based) and bulk
import of waste paper to supplement the availability of raw materials.
ii. Adequate modernization of the manufacturing assets.
iii. Improvement of the infrastructure.
iv. Quality improvements and reduction in cost of production
v. Import policy conducive for import of material, equipment, instruments, raw
materials and technologies which are bearing of the quality and environment.
PAPER PRICES FIRMING UP ON INFLATIONARY
PRESSURES Paper prices are headed north with leading manufacturers such as JK Paper and
Ballarpur Industries Ltd (BILT) revising prices due to rise in input costs and buoyant
market demands. The inflationary cost is showing on the industry. JK Paper has increased
the prices of coated paper by Rs 2,000-2,500 a tonne in the beginning of the year 2008-09.
This is in the backdrop of a higher input cost. It didn’t make enough margins on coated
paper last year. The drastic price reduction last year has impacted the bottom lines as well.
The international prices of coated paper have also gone up from as low as $850 last year
(2007-08) to $950-960 in present year (2008-09)
The price rise was on account of rising input costs, mainly wood and bamboo, along
with other raw materials and chemicals. The pulp prices have risen by almost 15 per cent
in the last 12-18 months.

8/6/2019 Security Valuation Of Paper Industry
http://slidepdf.com/reader/full/security-valuation-of-paper-industry 10/37
ST. XAVIER’S COLLEGE - KOLKATA Page 10
ORGANISATIONAL OVERVIEW ORGANISATIONAL OVERVIEW ORGANISATIONAL OVERVIEW ORGANISATIONAL OVERVIEW
ANDHRA PRADESH PAPER MILLS LTD. • Incorporated on 29th June 1964 as "The Andhra Pradesh Paper Mills Ltd." at
Rajahmundry.
• The Certificate of Commencement of business was obtained on 10th July 1964.
• Formed with infusion of funds and high caliber management of the well-known
industrial house of Bangurs of Calcutta, who have interests in textile manufacturing, tea
plantation, wind energy generation and trading and investment business other than
paper.
• In 2001, Coastal Papers Ltd was taken over by the company.
• The production capacity of both the units put together is 1,53,500 TPA.
• Eight paper machines installed at the two locations which produce papers of different
M.F & M.G varieties in the range of 21 to 250 GSM as well as newsprint.
• With the commissioning of largest continuous digester in the country, the total
bleached pulp production at APPM (Unit Rajahmundry) is 1,81,500 TPA. The estimated
paper production will increase to 1,74,500 TPA after the completion of the paper
machine modernization plan.
• Provides direct employment to over 4000 families. Moreover, the company provides
livelihood to over 10,000 families through indirect job opportunities.
JK PAPER MILLS LTD. • India's largest producer of branded papers is also a leading player in the Printing and
Writing segment.
• Operates two paper plants in India, JK Paper Mills in Rayagada, Orissa, with a capacity
of 125,000 tonnes per year and Central Pulp Mills, located at Songadh, Gujarat, with a
manufacturing capacity of 55,000 tonnes per year.
• Both the manufacturing units of the Company are ISO 9001-2000 compliant.

8/6/2019 Security Valuation Of Paper Industry
http://slidepdf.com/reader/full/security-valuation-of-paper-industry 11/37
ST. XAVIER’S COLLEGE - KOLKATA Page 11
• A plant to manufacture 60,000 tonnes per year of industrial packaging board in Gujarat
is under implementation.
• The plants currently operate at more than 120% capacity utilisation with an aggregate
annual output of over 180,000 tonnes per year of Paper and Pulp, using contemporary
technology.
• Produce international quality coated art paper and boards, being marketed in the brand
name of JK Cote.
• Various brand names, JK Copier, JK Excel Bond, JK Bond, JK Savannah, JK Copier Plus
and JK Easy Copier, where JK Copier is the Company's flagship brand.
• Sells through a nationwide distribution network of approximately 100 distributors and
2500 dealers.
• Only Company in the industry with such a large share of branded products in its
portfolio.
• Environment-friendly technologies.
• Both the units of the Company are ISO 14001 certified for their eco-friendly operations.
• In-house research programme, have covered more than 45,000 hectares of land.
• Helping very large number of farmers in the states of Orissa, Chhattisgarh, West Bengal,
Andhra Pradesh, Gujarat and Maharashtra to improve their economic well being.
• Export footprint for high value branded products in the Middle East, South East Asia,
SAARC and various African countries.
WEST COAST PAPER MILLS LTD. • Established in the year 1955 at Dandeli, Karnataka.
• Flagship company of SK Bangur Group, based at Kolkata.
• Over the past five decades the Company has exemplified all the qualities of leadershipin the Industry, with a vision to make the nation self reliant in paper production.
• Today Products of the company address the writing, printing and packaging demands of
millions of customers across the globe.
• An ISO 9001:2000 accredited by the DNV, the Netherlands.

8/6/2019 Security Valuation Of Paper Industry
http://slidepdf.com/reader/full/security-valuation-of-paper-industry 12/37
ST. XAVIER’S COLLEGE - KOLKATA Page 12
• looking ahead and is sensitive to meet the emerging challenges and trends.
• Actively engaged in Research and Development to design and develop the products for
tomorrow’s needs.
• Has a progressive outlook that will take it through a second innings, with goals, plans
and a vision to take it forward through the next 50 years.
• Comprises rich goodwill, process and product knowledge, trend reading capability and
distribution depth.
• Designed to manufacture 18,000 MT per year of writing, printing and packaging paper.
• Implemented the Crash program in 1974 to increase production capacity to 60,000 TPA
against the license issued in July 1972 for 60,000 TPA.
• The paper industry has been de-licensed from July 1997.
• The production capacity has increased to 119750 TPA after successful completion of
modernization / expansion program in 1999.
• Thirteen awards conferred by the National Productivity Council (Government of India)
and other organizations including Chemical & Allied Products, Export Promotion
Council.
• Excellent track record of timely repayment of loans/ lease rentals to financial
institutions and leasing companies and has maintained such record even in the
recession period to which this industry has been subjected many a times. This has been
highly appreciated by the financial institutions & lessors.
• The performance of the company during the last 5 years period was as under:
YEAR ENDED
31st MARCH
PRODUCTION (PAPER
& BOARD) [in M.T.]
NET SALES WITH
EXCISE DUTY
GROSS PROFIT
[Rs. in Crores]
2004 1,63,714 491.84 60.57
2005 1,73,070 533.35 56.48
2006 1,76,221 606.84 69.22
2007 1,78,871 619.44 95.52
2008 1,69,891 652.66 114.38

8/6/2019 Security Valuation Of Paper Industry
http://slidepdf.com/reader/full/security-valuation-of-paper-industry 13/37
ST. XAVIER’S COLLEGE - KOLKATA Page 13
SECURITY ANALYSIS APPLYINGSECURITY ANALYSIS APPLYINGSECURITY ANALYSIS APPLYINGSECURITY ANALYSIS APPLYING
VALUATION METHODS VALUATION METHODS VALUATION METHODS VALUATION METHODS
DISCOUNTED CASH FLOW METHOD In discounted cash flow valuation the value of assets is the present value of the
expected cash flow on the assets. Almost each and every asset has an intrinsic value that
has to be computed based upon its characteristic in terms of cash flow, growth and risk.
Data that are required to calculate discounted cash flow (DCF) value are:
• Estimated life of the asset.
• Estimated cash flows during the life of the asset.
• Estimated discount rate to apply to these cash flows to get present value.
Three companies that I have chosen in this sector are as follows-
1. ANDHRA PRADESH PAPER MILLS LTD.
2. JK PAPER MILLS LTD.
3. WEST COAST PAPER MILLS LTD.
The Equity capitalization of the Paper Industry is around Rs. 778 crore. For the
purpose of valuation of companies we have chosen:
1. Andhra Pradesh Paper Mills whose equity capital is Rs. 25.73 crore which is medium
sized company as compared to the industry,
2. JK Paper Mill whose Equity capital is Rs. 78.15 crore which is a large player in the
industry and
3. West Coast Paper whose equity capital is Rs. 11.48 crore which is a smaller player.
The companies of different sizes based upon the equity capitalization are chose for
the purpose of analysis to reflect a true picture of the whole paper industry as far as
possible. This enabled me to know the insights of the policies and management style of
these companies which have a direct impact on the financials of the companies like
whether the company’s growth rate is above or below the industry’s growth rate, the trend
of the growth in sales revenue, profit after tax, etc.

8/6/2019 Security Valuation Of Paper Industry
http://slidepdf.com/reader/full/security-valuation-of-paper-industry 14/37
ST. XAVIER’S COLLEGE - KOLKATA Page 14
DISCOUNT RATE
Discount rate is the rate which is used to calculate the present value of future cash
flow. Generally weighted average cost of capital (WACC) is used as a discount rate to
calculate the value of a firm, while cost of equity is used to calculate the value of equity.
Cost of equity is the minimum rate of return required by the equity shareholders. It
can be calculated by using Capital Assets Pricing Model (CAPM). CAPM was developed by
William F Sharpe, John Lintner and Jan Mossin. The CAPM establishes a linear relationship
between the required rate of return of a security and its systematic risk or beta. The CAPM
is represented mathematically by -
Kj = Rf + Bj (Km – Rf)
Where,
Kj = required rate of return on security j
Rf = Risk-free rate of return
Bj = Beta coefficient of security j
Km = Return on market portfolio
ASSUMPTIONS OF CAPM • Investors are risk-averse and use the expected rate of return and standard deviation of
return as appropriate measures of return and risk respectively for their stocks.
• Investors make their investment decisions based on a single-period horizon.
• Transaction costs in financial markets are low enough to ignore and assets can be
bought and sold in any unit desired. The investor is limited only by his wealth and the
price of the asset.
• Taxes do not affect the choice of buying assets.
RISK FREE RATE OF RETURN In order to calculate the cost of equity at first we need to know the risk free rate of
return. Risk free rate of return is the rate of return earned by the investor by investing in
the risk less security says Treasury bill or long term government bonds. In this case Rf is
equal to 7.6%. (I have taken interest rate of 10 year government bond because for the

8/6/2019 Security Valuation Of Paper Industry
http://slidepdf.com/reader/full/security-valuation-of-paper-industry 15/37
ST. XAVIER’S COLLEGE - KOLKATA Page 15
valuation of a firm I need to discount the expected free cash flow generating from the firm
in the coming five to six years).
RETURN ON MARKET PORTFOLIO Then we need to calculate the return on market portfolio. Here I have taken the S&P
CNX Nifty as the representative of the market as the equity share of these three companies
is listed in National Stock Exchange and moreover price of these share are taken from Nifty.
In order to calculate the Km at first I have calculate the yearly return of Nifty for last 6 year
by the formula = x 100 %.
For example for the year of 2006-07, 3rd April, 2006 Nifty was 3473.3 and on 31st
March, 2007 was 3821.55 so yearly returns is x 100 % = 10.02%
Similarly I calculated the yearly return of other years from 2002 to 2007 as shown
in TABLE 1 below and found their average as 39.35%.
TABLE 1 NIFTY
YEAR OPENING POINT (A) CLOSING POINT (B) (C ) = (B)-(A) (C )*100 / (A)
03-04 984.30 1,771.90 787.60 80.02%
04-05 1,819.65 2,035.65 216.00 11.87%
05-06 2,067.65 3,402.55 1,334.90 64.56%
06-07 3,473.30 3,821.55 348.25 10.03%
07-08 3,633.60 4,734.50 1,100.90 30.30%
AVERAGE 39.35%
BETA CO-EFFICIENT OF SECURITY Now we need to calculate the beta of a stock. Beta (β) is a measure of non-
diversifiable risk. It is the basis of explaining the relationship between the return of a
particular security and the return of the stock market as the whole. It measures the
responsiveness of the security to the general market and indicates how extensively the
return of the security will vary with the changes in the market return. For example if beta
of a security is 2 then it means that if market return increases by 10% then return of a

8/6/2019 Security Valuation Of Paper Industry
http://slidepdf.com/reader/full/security-valuation-of-paper-industry 16/37
ST. XAVIER’S COLLEGE - KOLKATA Page 16
security will increase by 20%. A high beta indicates that company is a risky proposition for
the investment purpose. A low beta indicates that investment is comparatively less risky
than the entire stock market taken as a whole. Since risk and return are directly related, the
return from high beta related companies shall be higher than that of low beta companies.
Beta of a stock is calculated by using the formula
_ _ _ _ _ (where x refers to Equity Stock and z to market)
COVARIANCE Covariance is applied to the annual rates of return of different investments, to
measure the correlation of their year to year fluctuations in performance.
Covariance (x, z) = 1/n * ∑ (x i – x ave) * (z i – z ave) _ _ _ _ _ (where the terms x i and z i
are actual values of the annual rates of return of equity stock and market respectively,
taken over several years, n is the total number of values of x i and z i used, and x ave and z ave
are the average values of x i and z i)
VARIANCE Variance is applied to the annual rate of return of an investment, to measure the
investment's volatility, or "risk".
Variance (z) = 1/n * ∑ (z i – z ave)2 _ _ _ _ _ (where the terms z i are actual values of the
market’s annual rate of return, taken over several years, n is the number of values of z i
used, and z ave is the average value of the z I)
Beta of these three companies has been calculated and shown in TABLE 5 below.
COST OF EQUITY Now after knowing all the three factors that are required to calculate the cost of
equity I have calculate it using the formula Kj = Rf + Bj (Km – Rf)
TABLE 2 COMPANY NAME Rf Bj Km Rf + Bj ( Km - Rf )
AP PAPER MILLS 7.60 0.35 39.35 18.71 %
JK PAPER MILLS 7.60 0.71 39.35 30.14 %
WEST COAST 7.60 0.28 39.35 16.49 %

8/6/2019 Security Valuation Of Paper Industry
http://slidepdf.com/reader/full/security-valuation-of-paper-industry 17/37
ST. XAVIER’S COLLEGE - KOLKATA Page 17
So cost of equity of all the companies has been shown in TABLE 5 below.
PRE TAX COST OF DEBT Pre tax cost of debt has been taken from the balance sheet of the respective
companies by applying the formula :
_ _ _ _ _ (where TAX is assumed to
be 35% )
So Pre Tax Cost Of Debt of all the companies has been shown in TABLE 5 below.
WEIGHT OF EQUITY AND DEBT The weighted average is found out by giving the respective weights to both equity
and debt. There are two methods by which we can calculate the weight one by book value
and other by market value. In this case I have used the book value weight. [Weight of
equity=equity / (equity + debt) & Weight of debt = 1- Weight of equity ; Weight of
debt=debt / (debt + equity) & Weight of equity = 1- Weight of debt]
Here equity means sum of paid up equity share capital and reserve and surplus
while debt means both long term secured and unsecured loan.
TABLE 3
V ALUE OF WEIGHT OF
COMPANY NAME EQUITY DEBT EQUITY DEBT
(A) (B) (A) / (A)+(B) (1 - Wt. of Eq)
AP PAPER MILLS 416.43 518.83 0.45 0.55
JK PAPER MILLS 392.58 721.32 0.35 0.65
WEST COAST 401.97 405.07 0.50 0.50
So weight of equity and debt for all the companies has been calculated and shown in
the TABLE 5 below.
DISCOUNTING RATE
Now the formula for calculating discounting rate is:
(Cost of equity ∗ wt. of equity) + (cost of debt ∗ wt. of debt) ∗ (1 – tax rate)
Here tax is assumed to be 35 %. Therefore 1 – tax rate = 65 %

8/6/2019 Security Valuation Of Paper Industry
http://slidepdf.com/reader/full/security-valuation-of-paper-industry 18/37
ST. XAVIER’S COLLEGE - KOLKATA Page 18
TABLE 4 COST OF WEIGHT OF DISCOUNTING
EQUITY DEBT EQUITY DEBT RATE
COMPANY NAME (A) (C) (B) (D) (A)*(B) + (C)*(D)*65%
AP PAPER MILLS 18.71 13.3 0.58 0.42 13.07%JK PAPER MILLS 30.14 14 0.68 0.32 16.46%
WEST COAST 16.49 18.4 0.47 0.53 14.23%
So WACC of all the companies has been calculated and shown in TABLE 5 below.
WEIGHTED AVERAGE COST OF CAPITAL (WACC)
TABLE 5 PARTICULARS AP PAPER MILLS JK PAPER MILLS WEST COASTBETA 0.35 0.71 0.28
COST OF EQUITY 18.71% 30.14% 16.49%
PRE TAX COST OF DEBT 13.30% 14% 18.40%
BOOK VALUE OF EQUITY 416.43cr. 392.58cr. 401.97cr.
BOOK VALUE OF DEBT 518.83cr. 721.32r. 405.07cr.
WEIGHT OF EQUITY 0.44 0.35 0.50
WEIGHT OF DEBT 0.56 0.65 0.50
WACC 13.07% 16.46% 14.23%
COMPOUNDED ANNUAL GROWTH RATE (CAGR)
After calculating the WACC we need to calculate the expected future cash flow for
that we need to prepare the forecasted profit and loss account of the company. But before
doing that I calculated the compounded annual growth rate (CAGR) of sales.
Sales of ANDHRA PRADESH for the year ending March’04 are Rs. 449.44cr. and for
the year ending March’08 is Rs. 628.24cr. So CAGR is the value of g in following equation-
449.44 ∗ (1+g)4 = 628.24
Or, (1+g)4 = 628.24/449.44 = 1.3978
Or, 1+g = (1.3978)1/4 = 1.0873
Or, g = 1.0873 – 1 = 0.0873 = 8.73%

8/6/2019 Security Valuation Of Paper Industry
http://slidepdf.com/reader/full/security-valuation-of-paper-industry 19/37
ST. XAVIER’S COLLEGE - KOLKATA Page 19
Similarly for JK PAPER MILLS LTD. CAGR has been calculated as -
723.99 ∗ (1+g)4 = 999.08
Or, (1+g)4 = 999.08/723.99 = 1.3799
Or, 1+g = (1.3799)1/4 = 1.0838
Or, g = 1.0838 – 1 = 0.0838 = 8.38%
For WEST COAST PAPER MILLS LTD. CAGR has been calculated as –
575.78 ∗ (1+g)4 = 652.83
Or, (1+g)4 = 652.83/575.78 = 1.1325
Or, 1+g = (1.1325)1/4 = 1.0316
Or, g = 1.0316 – 1 = 0.0316 = 3.16%
So CAGR of all the companies has been calculated and shown in TABLE 6 below.
SALES FORECASTING
Keeping the same growth rate of the sales I have forecasted the sales for the coming
five years as sales for the year 2009 of ANDHRA PRADESH is sales of the year 2008 ∗ (1+ g)
= Rs. 628.24 ∗ (1+0.0873) cr.
= Rs. 725.57 cr.
Similarly sales of JK PAPER MILLS LTD. for the year 2009 =Rs. 999.08 ∗ (1+0.0838) cr.
= Rs. 1095.49 cr.
For WEST COAST PAPER MILLS LTD. Sales for 2009 =Rs. 652.83 ∗ (1+0.0316) cr.
= Rs. 689.47 cr.
Similarly sales for the other years i.e. from 2010 to 2013 and for all the companies
have been calculated as shown in the annexure.
EXPENSE S FORECASTING
To calculate the forecast expenses at first we have calculate the percentage of each
and every expenses in terms of sales for the previous five years i.e. from the year 2004 to
the year 2008 as shown in the annexure.
For example sales & other income of ANDHRA PRADESH for the year 2008 are Rs.
667.31 cr. and raw materials cost is Rs. 339.08 cr. so percentage of raw material in terms of
sales is calculated as : (339.08 ∗ 100) /(667.31) = 50.81 percentage.

8/6/2019 Security Valuation Of Paper Industry
http://slidepdf.com/reader/full/security-valuation-of-paper-industry 20/37
ST. XAVIER’S COLLEGE - KOLKATA Page 20
Similarly for JK PAPER MILLS LTD. percentage of raw material in terms of sales has been
calculated as :
(457.32 ∗ 100) /(1010.79) = 45.24 percentage.
For WEST COAST PAPER MILLS LTD. percentage of raw material in terms of sales has been
calculated as :
(317.90 ∗ 100) /(668.35) = 47.56 percentage.
Similarly all the expenses have been expressed in the terms of sales for the last 5
years, for the three companies as shown in the annexure.
After that I have calculated the average of the percentage for each and every
particular. For example percentage of raw material in terms of sale of ANDHRA PRADESH
for the year ending 2004 to 2008 is 46.57%, 45.69%, 44.02%, 53.23%, and 50.81%
respectively for West Coast. So average percentage is sum of these percentage/5
= (46.57+45.69+44.02+53.23+ 50.81)/5 %
= 48.07%
And using these percentages in terms of sales I have calculated the forecasted
expenses as shown in the annexure.
ASSUMPTIONS
Assumption while preparing forecasted profit and loss account-
• I have kept the depreciation figure increasing proportionately assuming that the firm is
charging the depreciation on the basis of straight line method basis and there is
proportionate further capital investment in the coming five years. As AP Paper mill has
recently invested Rs. 341.21cr in the year 2006-2007 in purchasing fixed assets so
there is a need to invest more in near future. Similarly JK Paper Mills has also invested
Rs.122.62 cr. in the year 2005-2006. But fixed assets of West Coast was more or less
same for the last five years so I have assumed that company is going to makeinvestment of Rs. 50 cr. in the year 2008-2009 from its internal sources i.e. without
raising loan.
• Interest on debt is consider to be same for the coming years as there is no further issue
of debenture nor any repayment.
• Assumed tax rate to be 35%

8/6/2019 Security Valuation Of Paper Industry
http://slidepdf.com/reader/full/security-valuation-of-paper-industry 21/37
ST. XAVIER’S COLLEGE - KOLKATA Page 21
FREE CASH FLOW AVAILABLE
From these forecasted profit and loss account I have calculated the free cash flow
available to the firm for the coming five years using the formula Earnings Before Interest
Tax (1- Tax Rate) – (Capital Expenditure – Depreciation) – (Net Change In Working Capital)
If net change in working capital is negative then we have assumed it to be zero, as it
was in the case of West Coast for the year 2009.
Free cash flow for different companies and for different years has been shown in the
annexure.
TABLE 6 Particulars A P Paper Mills J K Paper Mills West Coast
CAGR 8.73% 8.38% 3.16%
Growth Rate after 2013 8.0% 6% 3%
Free Cash Flow in 2013 110.13 cr. 182.93 cr. 82.92 cr.
Expected Cash Flow in 2014 118.94 cr. 193.91 cr. 85.41 cr.
WACC 13.07% 16.46% 14.23%
Terminal Value 2345.96 cr. 1853.78 cr. 716.87 cr.
TERMINAL VALUE OF THE COMPANIES
After calculating the expected cash flow from the coming five years I have try to
calculate the terminal value in the year 2012 as company is a going concern concept and
it’s not possible to predict the P/L A/C for the entire life of the company. Terminal value is
the present value of all the future cash flow expected from a particular asset throughout its
life. Formula for calculating the terminal value is
Here I have taken the ‘g’ slightly less than CAGR of sales as computed earlier becausein the long run many more new firm will enter into the industry as a result of huge
competition firm will be earning only the normal return. Moreover as the firm grew its
growth rate stabilizes. Growth rate after 2013 for different companies has been shown in
the table 2 above.

8/6/2019 Security Valuation Of Paper Industry
http://slidepdf.com/reader/full/security-valuation-of-paper-industry 22/37
ST. XAVIER’S COLLEGE - KOLKATA Page 22
For example terminal value of ANDHRA PRADESH in the year 2013 =Rs. cr.
= Rs. 2345.96 cr.
Similarly for JK PAPER MILLS LTD. terminal value has been calculated as Rs. cr.
= Rs. 1853.78 cr.
For WESTCOAST PAPER MILLS LTD. terminal value has been calculated as Rs. cr.
= Rs. 716.87 cr.
PRESENT VALUE OF ALL FURURE CASH FLOWS
After getting the terminal value I calculated the present value of all the future cash
flow by discounting them with the WACC to know the intrinsic value of entire firm. For
example free cash flow available to the firm in the year 2009 is discounted by one year and
of 2010 by two year respectively as shown in the annexure. Sum of these present value give
us the total value of the firm.
For example value of ANDHRA PRADESH
=Rs. + + + + + Cr. = Rs. 1591.61 cr.
Similarly value of JK PAPER MILLS LTD.
=Rs. + + + + + Cr. = Rs. 1361.11 cr.
Value of WESTCOAST PAPER MILLS LTD.
=Rs. + + + + + Cr. = Rs. 591.95 cr.
VALUE OF EQUITY
When the value of a debt is deducted from the above calculated values of a firm we
get the value of equity, because value of a firm is the sum of value of equity and value of a
debt of a firm.
INTRINSIC VALUE OF SHARE
In order to calculate the intrinsic value of a share I have divided the value of equity
with the number of subscribed equity share capital. Value of equity share has been has
been shown in the annexure.

8/6/2019 Security Valuation Of Paper Industry
http://slidepdf.com/reader/full/security-valuation-of-paper-industry 23/37
ST. XAVIER’S COLLEGE - KOLKATA Page 23
COMPARISON WITH MARKET PRICE
Then this computed intrinsic value is compared with the market price to know
whether the particular share is underpriced or overpriced. If intrinsic value is more than
the market price the equity share is underpriced and it must be purchased. On the other
hand if intrinsic value is less than the market price then it’s overpriced and prices will
probable decreased in the coming future.
CONCLUSION As per the calculations for the 3 companies shown above in the report I get the following
result:
Company Name Intrinsic
Value (Rs.)
Market Price on 2nd
April 2007 (Rs.)
Remarks
Andhra Pradesh
Paper Mills Ltd.
450.37 72.80 UNDERVALUED
JK Paper Mills Ltd. 81.87 35.95 UNDERVALUED
West Coast Paper
Mills Ltd.
212.43 67.80 UNDERVALUED
Hence we conclude that the stocks of Andhra Paper Mills, JK Paper Mills and West Coast Paper Mills are undervalued and hence they can be considered for investment. Now
let us assume that market value of stock of JK Paper Mills is Rs.100. This means that the
stock is overvalued because the market value of the stock is more than it should be. At this
assumption, there should be no further investment in this company.
LIMITATIONS OF THE VALUATIONS 1. It’s subjective & biased.
2. There is no precise valuation, as it is guided by a set of assumptions.
3. We have calculated the intrinsic value of share on 1st April, 2007 due to lack of data
such as annual report of company for the year 2008.
4. We have considered the value of g as the CAGR of sales because there were wide
variations on both sides in the growth rate of EPS as well as free cash flow.

8/6/2019 Security Valuation Of Paper Industry
http://slidepdf.com/reader/full/security-valuation-of-paper-industry 24/37
ST. XAVIER’S COLLEGE - KOLKATA Page 24
SECURITY ANALYSIS APPLYINGSECURITY ANALYSIS APPLYINGSECURITY ANALYSIS APPLYINGSECURITY ANALYSIS APPLYING
MICHAEL PORTER’SMICHAEL PORTER’SMICHAEL PORTER’SMICHAEL PORTER’S
5 FORCE MODEL5 FORCE MODEL5 FORCE MODEL5 FORCE MODEL
FUNDAMENTAL ANALYSIS
It is an approach to analyzing market behavior that stresses the study of underlying
factors of supply and demand. It is done in the belief that such analysis will enable one to
profit by being able to anticipate price trends. A Fundamentalist is a market observer-
and/or participant who relies principally on Supply/demand considerations in price
forecasting. Fundamental analysis uses economic, industry and company factors to predict
the price of an asset and also estimates the growth of demand for products and economy-
wide changes, changes in government policies etc.
The price such estimated is known as intrinsic value or real value of assets. If
market value is less than intrinsic value an investor would like to buy that asset as it is
going to rise in future.
Fundamental analysis is the cornerstone of investment and one should be through
with the fundamental analysis of asset before investing into that asset.
Whereas, industry analysis involves a comprehensive analysis of the industry and
its market segments. This section discusses the key developments that have taken place in
the industry. It also identifies and analyzes the driving factors and challenges of the
industry. A description of the regulatory structure tells us about the major regulatory
bodies, laws and government policies. It can be done through various models like Michael
Porter Analysis. SWOT analysis etc.

8/6/2019 Security Valuation Of Paper Industry
http://slidepdf.com/reader/full/security-valuation-of-paper-industry 25/37
ST. XAVIER’S COLLEGE - KOLKATA Page 25
MICHAEL PORTER FIVE FORCES ANALYSIS

8/6/2019 Security Valuation Of Paper Industry
http://slidepdf.com/reader/full/security-valuation-of-paper-industry 26/37
ST. XAVIER’S COLLEGE - KOLKATA Page 26
A. THREAT OF NEW ENTRANTS Those industries with high entry barriers will have fewer firms entering. With fewer
firms, there is less environmental complexity, and it is easier for the existing firm to
dominate the industry. Economic rents are usually higher in such an environment. This
makes the industry attractive in terms of investment. The following elements will help to
determine the level of threat from new entrants.
ECONOMIES OF SCALE If economies of scale exist, it represents a high barrier to entry. Firms within the
industry will have to achieve these economies in order to remain in the market for a long
time, and if new firm enter, they have to match their scale size. In paper industry,
contribution margin ratio (contribution/sales) is very low (industry average) and fixed
cost required is high so in order to breakeven (situation where firm is earning zero profit
i.e. revenue is equal to cost) high units of production is required, which is difficult (but not
impossible) for the new entrant to achieve it in the first year of its operation. Moreover
even if they are able to produce the large quantity of goods, will find it difficult to sell the
product in the market as the existing firms have the tie-up with the customer.
PROPRIETARY PRODUCT DIFFERENCES
Some firms have a secret process or secret formula for the manufacture of their
product which crates the barrier for the new entrant. But in the paper industry, process of
manufacturing paper does not require any secret formula. Moreover there is no patent or
copyright over any product, no legal constraint is put by the government in establishing the
industry. Government has deli sensed the paper industry i.e. 17th July, 1997. So no hurdles
are faced by the new entrant in this respect.
ACCESS TO DISTRIBUTION Distribution channel is the path through firms gets their product or service into the
market. In the paper industry existing firm have tie up with their distributor according to
which distributor are not allowed to market the product of other paper mill. For example
Say Trading Company is the distributor of West Coast Paper Mills Ltd. This put pressure in

8/6/2019 Security Valuation Of Paper Industry
http://slidepdf.com/reader/full/security-valuation-of-paper-industry 27/37
ST. XAVIER’S COLLEGE - KOLKATA Page 27
the new entrant to break this tie up so they have to set up their own distribution channel
which put huge pressure on them.
CAPITAL INVESTMENT Higher the capital investment required to establish a firm, higher will be the entry
barrier. Paper industry is one of the most capital-intensive industries in the world
characterized by a lumpy investment profile. One paper making machine, for example,
costs around half a billion dollars. Paper industry is a power water intensive industry
which also acts as a barrier to entry.
RESISTANCE FROM LOCAL PEOPLE Paper industry is highly polluting sector so the local people opposes the
establishment of the factory near their resident. So the new entrants have look up the area
far from city for setting their factory. Moreover they have to fulfill the requirement of
pollution standard.
So in the whole we can say that there is no threat from the new firm in the paper
industry as barrier is high.
B. BARGAINING POWER OF SUPPLIERS If the supplier have bargaining power over the industry in which they supply the
product, would make the industry unattractive for the investment. The first step is to
determine what paper industry purchases for example pulp, bamboo, chemicals, coal,
packaging material etc. The following elements are the key item or items in the industry.
SUPPLER CONCENTRATION Supplier is the person from whom the paper industry purchases raw materials to
manufacture the paper. If suppliers are concentrated (fewer of them) this could give them
power over buyers in industry. Same is the case in paper industry as most of the supplier
are in China and can control the supply of raw material to paper industry.
AVAILABILITY OF RAW MATERIAL Since the raw materials required in this industry are basically forest product and
forest are decreasing day by day. As a result of that raw materials are in crunch so
suppliers have high bargaining power.
8/6/2019 Security Valuation Of Paper Industry
http://slidepdf.com/reader/full/security-valuation-of-paper-industry 28/37
ST. XAVIER’S COLLEGE - KOLKATA Page 28
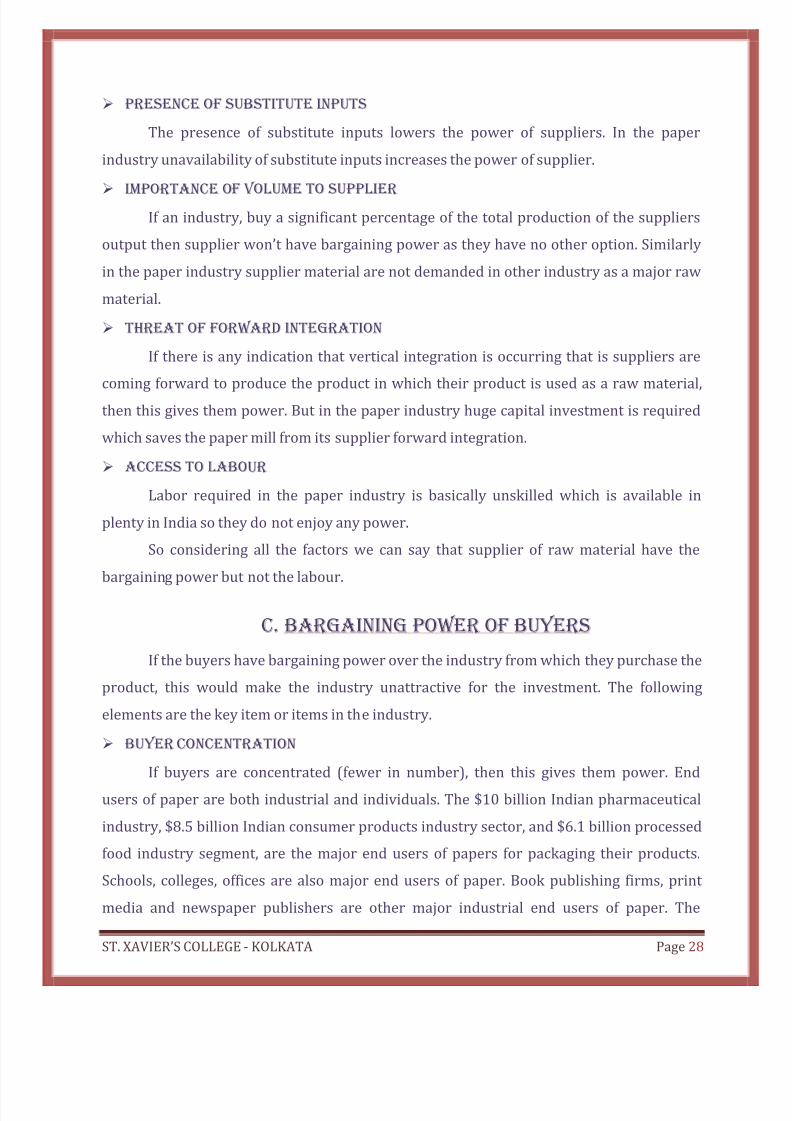
PRESENCE OF SUBSTITUTE INPUTS The presence of substitute inputs lowers the power of suppliers. In the paper
industry unavailability of substitute inputs increases the power of supplier.
IMPORTANCE OF VOLUME TO SUPPLIER If an industry, buy a significant percentage of the total production of the suppliers
output then supplier won’t have bargaining power as they have no other option. Similarly
in the paper industry supplier material are not demanded in other industry as a major raw
material.
THREAT OF FORWARD INTEGRATION If there is any indication that vertical integration is occurring that is suppliers are
coming forward to produce the product in which their product is used as a raw material,
then this gives them power. But in the paper industry huge capital investment is required
which saves the paper mill from its supplier forward integration.
ACCESS TO LABOUR Labor required in the paper industry is basically unskilled which is available in
plenty in India so they do not enjoy any power.
So considering all the factors we can say that supplier of raw material have the
bargaining power but not the labour.
C. BARGAINING POWER OF BUYERS If the buyers have bargaining power over the industry from which they purchase the
product, this would make the industry unattractive for the investment. The following
elements are the key item or items in the industry.
BUYER CONCENTRATION If buyers are concentrated (fewer in number), then this gives them power. End
users of paper are both industrial and individuals. The $10 billion Indian pharmaceutical
industry, $8.5 billion Indian consumer products industry sector, and $6.1 billion processed
food industry segment, are the major end users of papers for packaging their products.
Schools, colleges, offices are also major end users of paper. Book publishing firms, print
media and newspaper publishers are other major industrial end users of paper. The

8/6/2019 Security Valuation Of Paper Industry
http://slidepdf.com/reader/full/security-valuation-of-paper-industry 29/37
ST. XAVIER’S COLLEGE - KOLKATA Page 29
expanding printing and packaging sectors are the intermediate end users of paper. All
these factors put together make the number of buyers relatively larger and hence lowers
the buyers’ bargaining power.
BUYER SWITCHING COSTS Buyer switching cost refers to the cost incurred by the customer in replacing the
product of one manufacturer with the product of other manufacturer. If the industry has
been able to create switching costs, than that would give the industry power over the buyer
and makes the industry attractive. In the paper industry, the buyers switching costs are
very less as the product are more or less standardize so they enjoy high bargaining power.
THREAT OF BACKWARD INTEGRATION Backward integration is the process by which firms acquire their suppliers, or
beginning the process of providing for themselves the means to produce the input. This can
occur for several reasons, among them: to guarantee a dependable source of the input or to
capture the margins normally paid to the suppliers. If there is any indications that buyers
are integrating backward then this would gives them power, making the industry
unattractive. In the paper industry, there is almost no backward integration among the
buyers except in a few cases as for example Rakish Paper Company is a distributor as well
as supplier also.
PRICE SENSITIVITY Price sensitivity refers to the change in the quantity demanded of a particular
product due to change in its price. This deal with elasticity of demand and whether the
industry is able to pass cost increases on to the buyer, or have to absorb them. If buyers are
not price sensitive, this gives the industry power and makes it attractive. Although buyers
are price sensitive but in paper industry since there is a demand supply gap buyers are not
able to exercise much power and hence the demand is not really elastic. In fact, the prices
are also rising for the past few years. As a result of all this, price sensitivity is also very low.
PRICE TO TOTAL PURCHASES Main customer of paper industry spends very less amount of their total purchase in
purchasing paper for example individual customer spends around only 0.1% of their
expense in purchasing paper.

8/6/2019 Security Valuation Of Paper Industry
http://slidepdf.com/reader/full/security-valuation-of-paper-industry 30/37
ST. XAVIER’S COLLEGE - KOLKATA Page 30
Thus, looking at all these factors, we can say that buyers have very low bargaining
power in the paper industry.
D. THREAT OF SUBSTITUTE PRODUCTS An industry will be attractive if there is no threat from substitute products. A
substitute is any product or service that will fulfill the same need which the subject
industry product fulfills. Higher the availability of substitute product lower will be the
attractiveness of the industry.
AVAILABILITY OF SUBSTITUTE PRODUCT With the advancement of technology, digital uses and electronic transactions have
emerged as a substitute for paper. With the increasing use of computers and other
electronic gadgets, paper use has taken a backseat. Moreover, as days progress and as there
are advancements in technology, they might emerge as a substitute of paper for individuals
as well as for corporate.
E. RIVALRY AMONG THE EXISTING FIRM An industry characterized by high rivalry is unattractive because it limits the ability
to achieve above normal economic rents. At the other extreme, industries with no rivalry
are usually dominated by a few major firms which could limit strategic flexibility.
INDUSTRY GROWTH RATE If there is a positive trend to industry growth rate, and it is greater than the inflation
rate, then firms are able to grow without taking market share from other firms in the
industry. This reduces rivalry and makes the industry attractive. India’s per capita
consumption of paper is around 7 kg. With the expected increase in literacy rate and
growth of the economy, an increase in the per capita consumption of paper is expected. The
demand for upstream market of paper products, like, tissue paper, tea bags, filter paper,
light weight coated paper, medical grade coated paper, etc., is picking up. Several fiscal
incentives have also been provided to the paper industry, particularly to those mills, which
are based on non-conventional raw material. As a result of all this, and because of the
existing Demand-Supply gap, the Indian paper Industry has also started looking up. Apart

8/6/2019 Security Valuation Of Paper Industry
http://slidepdf.com/reader/full/security-valuation-of-paper-industry 31/37
ST. XAVIER’S COLLEGE - KOLKATA Page 31
from this, the paper industry is witnessing a favorable trend in terms of improved
realizations since April 2005. The industry has been successful in gradually increasing the
prices over the corresponding previous year period. Paper prices have shown a significant
rise in both domestic and international markets.
EXIT BARRIERS Higher will be the exit barrier higher will be the rivalry among the existing firm. The
exit barriers are preset in case of the paper industry because the machines used generally
do not have any alternative uses so the stakes are high for scrapping these machinery
totally.
PRODUCT DIFFERENTIATION Higher the product differentiation lowers the competition. Some high-grade
cigarette paper is made from flax. Cotton and linen rags are used in fine-grade papers such
as letterhead and resume paper, and for bank notes and security certificates. The rags are
usually cuttings and waste from textile and garment mills. So there is ample opportunity
for different players to enter into unique segment of products.
INTERMITTENT OVERCAPACITY If the industry is running between 80% and 85% capacity utilization, then this is
consider as a normal range. Lower utilization means that the industry is susceptible to
intermittent overcapacity. This increases rivalry as firms attempt to maintain revenues. If
the industry is over the normal range, this indicates that they may lack the capital
investments necessary to meet unexpected demand. This reduces rivalry and makes the
industry attractive. The industry is already operating overcapacity to overcome the gap in
the demand and supply in the market. Recognizing this, several top players have initiated
capacity expansion plan that is expected to be start commercial production by 2009.
CONCLUSION
So in the end we can conclude that there is no such competition among the existing
firm. Since the price of paper is on the uptrend due to demand supply mismatch we can say
that there is no price cut competition, moreover as the growth rate is high so there is no
such pressure among the existing firm to capture the market share.

8/6/2019 Security Valuation Of Paper Industry
http://slidepdf.com/reader/full/security-valuation-of-paper-industry 32/37
ST. XAVIER’S COLLEGE - KOLKATA Page 32
LIMITATIONS OF THE STUDY LIMITATIONS OF THE STUDY LIMITATIONS OF THE STUDY LIMITATIONS OF THE STUDY
The research work done in this project faced various problems on its way. Several
problems like lack of sources to collect primary data, time constraint etc.
For making a project covering the capital market, it is very necessary for the
researcher to have a good source & authority in the big industries to facilitate the meeting
with higher officials and take their views for the project.
Another limiting factor is time. It is very necessary for the researcher to think
deeply about the purpose of the project and accordingly collect data for project preparation
and presentation. We got about one and half month time which is very less for a project to
complete properly. Due to time constraint I could not go through the detailed study of the
project & also not able to collect more primary data regarding various other companies in
the same industry.
Data collected from websites for calculation purposes are full of errors and makes it
very difficult to get the correct result.
The analysis drawn in the project is limited to the selected companies only. There is
no effect of this project on the actual picture of the investment decision as share market is
very much fluctuating and gets affected because of other sectors also.
Exact return on market portfolio cannot be calculated by including the opening and
closing balances of NIFTY for year 2008-09 because of the unavailability of the closing
figures.
There is a lack of updated data relating to the company’s financial matters. Valuation
of intrinsic value is done on the basis of proposed cash flows of the companies. So it may
not be correct way of predicting the valuation of securities.

8/6/2019 Security Valuation Of Paper Industry
http://slidepdf.com/reader/full/security-valuation-of-paper-industry 33/37
ST. XAVIER’S COLLEGE - KOLKATA Page 33
FINDINGS OF THE STUDY FINDINGS OF THE STUDY FINDINGS OF THE STUDY FINDINGS OF THE STUDY
A detailed study of the securities and proper analysis of the valuation made various
findings in the field of investment sector. Some of these are:
• The Indian paper industry sector is growing almost double of the world paper industry
growth rate which is pulling the economic condition of the said country to achieve a
very-very big goal of no poverty.
• Inspite of proper calculation of the intrinsic value of the securities, it can not be said
that based on this analysis, investors can take investment decisions. Because securities
market now a days is full of risk. Any factor can influence the market price of the sharewithout having a look over the company’s goodwill.
• The demand of paper is increasing over the period with a very high speed and will
definitely facilitate the Indian economic and infrastructural growth.
• Calculations made in the study were very difficult. And is therefore not possible for a
common citizen to make a analysis of such type.
• The government is also supporting the paper industry as it totally relicensed the paper
companies.
• As far as project is concerned, it is a very big opportunity to get involved in any project
and to utilize the chance of analysing some different practical situations under the
supervision of seniors and professors.

8/6/2019 Security Valuation Of Paper Industry
http://slidepdf.com/reader/full/security-valuation-of-paper-industry 34/37
ST. XAVIER’S COLLEGE - KOLKATA Page 34
OPINION & SUGGESTIONOPINION & SUGGESTIONOPINION & SUGGESTIONOPINION & SUGGESTION
Massive cross border flow of capital has increased the significance of Security
Analysis for decision making purpose before investment. That is the reason behind the
topic selection.
According to the study it can be opined that it is very necessary for any big investor
to make a proper analysis of the company in which they are going to invest. Besides that it
can also be said that this type of analysis does not have a very great impact on the
investment proposals and market fluctuations. This analysis is limited to valuation
according to company’s past performance and various assumptions. So it may not bealways correct for valuation purpose.
After a long research and evaluation it can be suggested that the study has so many
limitations and is therefore completely not reliable. It provides an opportunity to draw
upon previous experiences and education to apply various techniques of evaluating any
firm or industry at large.
The following can be suggested :
• The study is not fully dependable for investment decisions because it is full of
limitations and assumptions which may not be there in practical case.
• Paper industry’s growth is good enough to invest in as majority of the stocks are
undervalued.
• The said industry provides employment and need trained employees for development.
• Government is also facilitating the industry in various ways like taxation,
transportation, warehousing, infrastructure, foreign affairs etc, and it should be in a
continuous form.

8/6/2019 Security Valuation Of Paper Industry
http://slidepdf.com/reader/full/security-valuation-of-paper-industry 35/37
ST. XAVIER’S COLLEGE - KOLKATA Page 35
CONCLUSIONCONCLUSIONCONCLUSIONCONCLUSION
The conclusion of the study can be drawn as the industry is growing proper enough
and due to this there is a good opportunity of investing in these companies because the
future prospectus of the industry is looking bright.
A lot of discussion has already been made regarding objective of the study,
organizational overview, various calculations, implication of Porter’s 5 Force Model,
limitations etc which are enough to draw the conclusion. Drawing upon previous
experience and education and to apply various techniques of evaluating any firm was the
main thing in the study which was completely explained.
It is very important to say that the future of India is fully dependent on this types of
industries and incremental graph of net worth is very necessary for the industries.
As far as the project work is concerned it can be said that this project work played a
very important role for practical knowledge of the corporate world. It can also be said that
because of this project I got a good knowledge of using MS-OFFICE 2007 which is really
very advanced.

8/6/2019 Security Valuation Of Paper Industry
http://slidepdf.com/reader/full/security-valuation-of-paper-industry 36/37
ST. XAVIER’S COLLEGE - KOLKATA Page 36
BIBLIOGRAPHY BIBLIOGRAPHY BIBLIOGRAPHY BIBLIOGRAPHY
WEBSITES • www.fotosearch.com
• www.moneycontrol.com
• www.answers.com
• www.businessindia.com
• www.westcoastpaper.com/company.htm
• www.andhrapaper.com/html/corporate-profile.htm
• www.jkorg.in/index.php?option=content&task=view&id=145&Itemid=191&parent=174
• www.business.gov.in
• www.encyclopedia.com
• www.wikipedia.com
• www.nseindia.com
• www.yahoo.finance.com
• www.google.com
• www.wiki.answers.com
• www.agecon.uwyo.edu/RiskMgt/marketrisk/FundamentalAnalysis.pdf
• www.paperex-india.com/paperscene.htm
• www.economywatch.com/business-and-economy/paper-industry.html
• www.blonnet.com/2008/05/18/stories/2008051850990200.htm
• www.bespokeinvest.typepad.com/bespoke/2008/02/global-10-year.html
• www.nse-india.com/marketinfo/indices/histdata/historicalindices.jsp
• www.kotaksec.cmlinks.com/Equity/companyprofile.aspx?id=27&code=607
• www.tradeholding.net/default.cgi/action/viewtradeleads/tradeleadid/44707/
subject/Inquiry_Demand_of_Paper_Board
• www.paperonline.org/history/history_frame.html
• www.investopedia.com/university/dcf/dcf4.asp
• www.pages.stern.nyu.edu/~adamodar/New_Home_Page/valquestions/termvalapproaches.htm

8/6/2019 Security Valuation Of Paper Industry
http://slidepdf.com/reader/full/security-valuation-of-paper-industry 37/37
• www.secondventure.com/business-valuation-methods.asp
• www.pmi.org/PDF/pdc_capmhandbook.pdf
• www.investopedia.com/terms/b/beta.asp
• www.quickmba.com/finance/terminal-value/
• www.en.wikipedia.org/wiki/Porter_5_forces_analysis
NEWSPAPERS • Economic Times – www.economictimes.indiatimes.com
• Business Standard - www.business-standard.com
• The Telegraph - www.telegraphindia.com
• The Statesman - www.thestatesman.net
• The Times of India – www.timesofindia.indiatimes.com
• Hindustan Times - www.hindustantimes.com
• Business Line - www.thehindubusinessline.com
MAGAZINES Business World
Business TodayCompetitive Success
BOOKS CA Institute – PCC Cost Accounting And Financial Management Study Material