Embed Size (px)
Citation preview

Security Metrics for Cyber Insurance
Sachin Shetty, Ph.D. Associate Professor
Virginia Modeling, Analysis and Simulation Center
Department of Modeling, Simulation and Visualization Engineering Old Dominion University
Norfolk, VA USA
Collaborators- Jay Kesan and Linfeng Zhang (UIUC)

Cybersecurity is a National Concern • Cybersecurityis,edtothehealthoftheU.S.economy.
Maliciouscybera9ackscouldthrowthefinancialindustryintochaos.– TheWorldEconomicForumes,matesthatineffec,vecybersecurity
maycosttheworld’seconomyasmuchas$3trillionby2020.• Cybersecurityisalsona,onalsecurity.Cri,calinfrastructure
systems,fromtransporta,ontonuclearpower,arevulnerabletocybera9acks.– Hospitalsandpolicedepartmentshavebeentargetedwith
ransomwarethatseversaccesstovitalinforma,on.

Backward-Looking Cybersecurity
• Current approaches to cybersecurity are often backward-looking. – Cyberattack happens à Analyze the hacked system to
identify what vulnerability was exploited. – The presence of a cyberattack is essentially treated as
evidence that cybersecurity procedures were inadequate. • There is a need for a holistic, forward-looking
approach – one that is premised on risk assessment (which leads to mitigation and resilience).

Solving the Cybersecurity Crisis (the “3 Ds”) • Defend
– Strengtheningsystemsecurity– Suppor,ngcybersecurityresearch– AddressingsoNwarevulnerabili,esastheyarediscovered– Adop,onofcybersecuritystandardslikeNIST’sCybersecurityFramework
• Deter– Deterrencebydenial– Criminallawsandpunishment
• De-escalate– Resilience,whichisalsoaddressedintheNISTCybersecurityFramework– Acyberinsuranceregimecanimproveresiliencethroughfinancialresourcesand
connec,ngpolicyholderstotechnicalresources

Cyber-insurance
Self-protection Self-insurance
“Substitutes” (High demand for one lowers demand for the other)
“Complements” if premiums are tied to self-protection level (Cyberinsurance increases self-protection, i.e. no moral hazard)
“Substitutes” (Availability of one would discourage the other. Self-insurance likely to create a moral hazard)
Relationships Between Different Approaches to Security and Prevention
Source: Kesan, Majuca, and Yurcik, “The Economic Case for Cyberinsurance,” 2004
Cyberinsurance as a Risk Transference Vehicle
• Theonlyexis,ngfinancialinstrumentdesignedfortransferringcyber-risk.
• Cyberinsurancepreservesmarketautonomy.• Cyberinsuranceprovidescarrotsands,cksforpolicyholdersto
maintaintheirsystems,poten,allybenefi,ngsocietyasawhole.

Current Issues with the Cyberinsurance Market
• Adverseselec,on• Moralhazard
Informa,onAsymmetry
• Natureofcyber-risk• Correla,onDataScarcity

Issues with Cyberinsurance Market (“PEC” Strategy)

Underwriting – Process of Distinguishing Risk Levels
• Underwriterlooksatseverala9ributesofanapplicantandthendecides:– Whethertotaketherisk– Howmuchcoveragetooffer– Howmuchpremiumtocharge
• Underwri,nga9ributesvaryamonginsurancecompanies• Keya9ributesarenotiden,fied• Underwri,ngprocessesincyberinsurancearemostly
ques,onnaireand/orinterview-based

Risk Assessment is the Key
• Theessen,alsolu,ontotheinforma,onalasymmetryproblemisbe#erriskassessment.– Narrow down the information gap between the insureds and the insurers. – Separate insureds with different risk levels and price policies more
accurately. – Periodical risk assessment helps insurers monitor their risk exposures. – Better estimation of cost after losses.
• Wecanaddressthisproblemfromseveralangles:– TechnologicalRisk– Por;olioRisk– LegalRisk

TECHNOLOGICAL RISK
©2016CIRI/AHomelandSecurityCenterofExcellence 11

Research Goals
©2016CIRI/AHomelandSecurityCenterofExcellence 12
Economic Modeling • Empirical analysis of
insurance sector and clients
• Understand market-based and regulatory incentives
Cyber Risk Management • Modeling technique to
quantify cyber risk • Real time analytics,
analyze historical datasets and predict future risks
Measure and Price Risk in Cyber Insurance

Limitations of IDSs • Cognitive overload to the decision maker
– Overwhelming number of alerts • False Positives
– Concept Drift Issues • Isolated Alerts
– Lack of strategies to integrate and correlate alerts • Missing Information
– Requires reach-back and updates from higher command levels • Intent of the attacker
– Stepping Stones/Pivot Points
Enterprise Security Metrics Challenges
• Need for an objective way of measuring the security risk in a network – If I choose network configuration A versus B or security
control X versus Y, can I measure the risk reduction? – How secure is the database server in a given network
configuration? – How much security does a new configuration provide? – How can I plan on security investments so it provides a
certain amount of security? • Need for automated security risk modeling and analysis tool

Enterprise Security Metrics Challenges
• Metric for individual vulnerability exists – Impact, exploitability, temporal, environmental, etc. – E.g., the Common Vulnerability Scoring System (CVSS) v2 released
on June 20, 20071
– Vulnerabilities have different importance – Scoring of a vulnerability depends on context and configuration
• How to compose vulnerabilities for the overall security of a
network system
• Need to integrate individual vulnerability metrics to compute overall enterprise security metric
1. Common Vulnerability Scoring System (CVSS-SIG) v2, http://www.first.org/cvss/

Attack Graphs
• Adversaries penetrate network through a chain of exploits – Each exploit lays foundation for subsequent exploits
• Chain is called an attack path • All possible attack paths form an attack graph • Generate attack graphs to mission critical
resources • Report only those vulnerabilities associated with
the attack graphs

CVSS CommonVulnerabilityScoringSystem
• ProvidesanopenframeworkwhichassesstheseveritylevelofITvulnerabili,es
• CommissionedbyNIAC/MaintainedbyFIRST• Quicklybecomingthe*standard*forapplica,onvulnerability
riskmodeling• Associatesaseverityscore(CVSSscore)toeachITvulnerability,
whichrangesfrom0.0to10.0• Computedbytheuseofmetrics,whichresultromthree
vectors– Base,Temporal,andEnvironmental

CVSS Metrics • CVSS is composed of three metric groups: Base,
Temporal, and Environmental, each consisting of a set of metrics
Base: Captures intrinsic characteristics of a vulnerability Temporal: Represents characteristics of a vulnerability that change over time Environmental: Represents the characteristics of a vulnerability that are unique to user's environment. Source- http://www.first.org/cvss/cvss-
guide.html

Limitations of CVSS
• Limited to comparing relative severity of different vulnerabilities – Does not factor full likelihood of attack (value of asset, combination of
vulnerabilities) – Assesses atomic attacks. – Assumes user environment is safe. – Does not take into account security controls – Potential for errors or inaccuracies in scoring
• National Vulnerability Database assigns rankings according to CVSS base scores – Low: 0.0 to 3.9 – Medium: 4.0 to 6.9 – High: 7.0 to 10.0
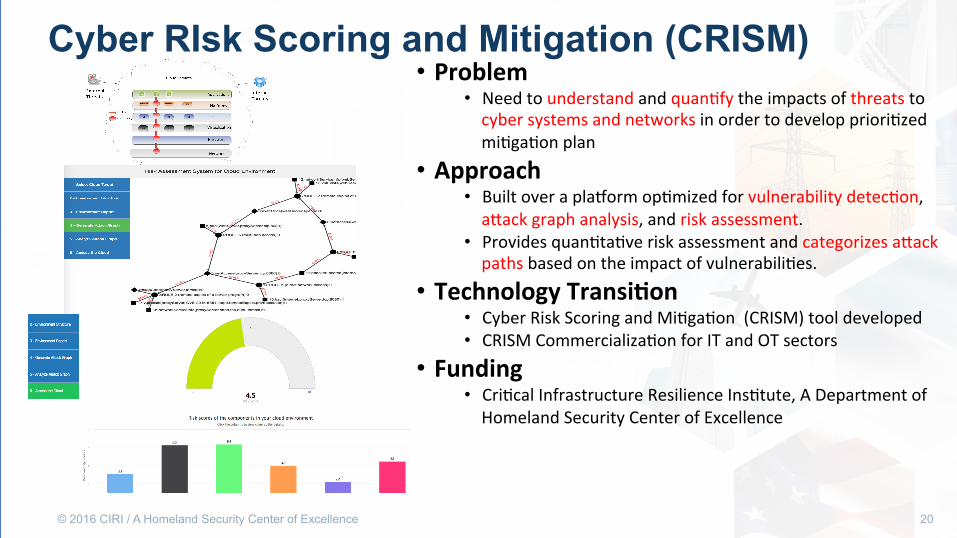
Cyber RIsk Scoring and Mitigation (CRISM)
© 2016 CIRI / A Homeland Security Center of Excellence 20
• Problem• Needtounderstandandquan,fytheimpactsofthreatstocybersystemsandnetworksinordertodeveloppriori,zedmi,ga,onplan
• Approach• Builtoverapladormop,mizedforvulnerabilitydetec,on,a9ackgraphanalysis,andriskassessment.
• Providesquan,ta,veriskassessmentandcategorizesa9ackpathsbasedontheimpactofvulnerabili,es.
• TechnologyTransi?on• CyberRiskScoringandMi,ga,on(CRISM)tooldeveloped• CRISMCommercializa,onforITandOTsectors
• Funding• Cri,calInfrastructureResilienceIns,tute,ADepartmentofHomelandSecurityCenterofExcellence

Measuring Security Risk
Cyber Risk Modeling and Analysis

Measuring Enterprise Risk Bayesian Attack Graph • Extract topology and vulnerability
information for enterprise systems and network from scanning, vulnerability tests and vulnerability databases
• Generation of attack graph to model security state of enterprise system and network
• Developed probabilistic security metric using Bayesian Networks by leveraging attack graph
• Encoding contribution of different security conditions during system compromise.

Measuring Enterprise Risk Bayesian Attack Graph Analysis • Examples of vulnerabilities-
– Unsafe security policy, corrupted file, memory access permission, unsafe firewall properties, unauthorized access
• System and network states represented as attributes and modeled using Bernoulli distribution
• Attacker success to reach goal depends on state of attributes
• Bayesian Attack Graph captures cause-consequence relationships between attributes
Future Technological Risk Work
• Model criticality of assets in the risk scoring
• Provide prioritized mitigation plan
• Simulating security remediation scenarios based on patching vulnerabilities vs enforcing security controls
©2016CIRI/AHomelandSecurityCenterofExcellence 24

PORTFOLIO RISK
©2016CIRI/AHomelandSecurityCenterofExcellence 25

Data Description
©2016CIRI/AHomelandSecurityCenterofExcellence 26
• Analysisaredoneusingthecyber-casesdatasetsprovidedby:– VerisCommunityDatabase,thethelargestnon-commercialcyber-incidentdatabase
• Over8000cyber-incidentsrecorded• Foreachincident,ithasinforma,onabout:
– Actors,Ac,ons,AffectedAssets,Outcome• Goodforprofilinga9ackersandac,onstheytook
– AdvisenLtd.,aleadingproviderofdataforthecommercialpropertyandcasualtyinsurancemarket
• Over40,000cyber-casesarerecordedinthedataset,andover35,000casestookplaceinUS• Therecordforeachcasecontains:
– Timeline(firstno,cedate,reportdata,etc.)– Casecharacteris,cs(casetype,causes,etc.)– Legalinforma,on(juristrigger,court,etc.)– Outcome(Lossamounts,injuries,etc.)– Vic,mcompanyinforma,on(name,sector,size,etc.)– Detaileddescrip,on– Possiblyapplicablelineofinsurancebusiness
• Goodforstudyingvic,mcompaniesandthelegalaspectofeachincident

©2016CIRI/AHomelandSecurityCenterofExcellence 27
Source:VerisCommunityDatabase(VCDB)–thelargestnon-commercialcyber-incidentdatabase
Risk Profile Across Different Sectors
DataSource:AdvisenLtd.

Risk Profile
©2016CIRI/AHomelandSecurityCenterofExcellence 28
DataSource:AdvisenLtd.

Risk Profile
• Around14.2%ofthecasesinUShappenedtocompanieslocatedinCalifornia
DataprovidedbyAdvisenLtd.

Risk Profile
(Chartinlogscale)• Weusenumberofemployeesasaproxyforcompanysize• Overall,lossamountgoesupforlargercompanies,butvarianceislarge• SmallcompaniescanoNenexperiencethesameorevenlargeramountof
lossthanlargecompanies
DataprovidedbyAdvisenLtd.

Risk Profile
©2016CIRI/AHomelandSecurityCenterofExcellence 31
Monthlycyber-incidentnumbersince2010Datasource:VerisCommunityDatabase(VCDB)
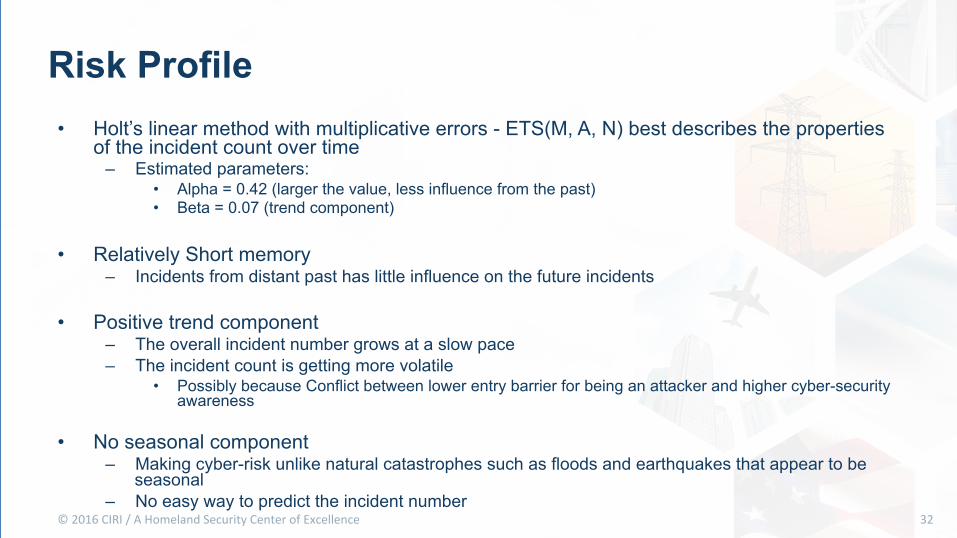
Risk Profile • Holt’s linear method with multiplicative errors - ETS(M, A, N) best describes the properties
of the incident count over time – Estimated parameters:
• Alpha = 0.42 (larger the value, less influence from the past) • Beta = 0.07 (trend component)
• Relatively Short memory
– Incidents from distant past has little influence on the future incidents
• Positive trend component – The overall incident number grows at a slow pace – The incident count is getting more volatile
• Possibly because Conflict between lower entry barrier for being an attacker and higher cyber-security awareness
• No seasonal component – Making cyber-risk unlike natural catastrophes such as floods and earthquakes that appear to be
seasonal – No easy way to predict the incident number
©2016CIRI/AHomelandSecurityCenterofExcellence 32

Risk Profile • Attack clustering
– Discussed in A Closer Look at Attack Clustering (Bohme et al., 2006)
– Clustered attacks arise after a vulnerability is exploited due to the interaction between attacker and defender strategies
©2016CIRI/AHomelandSecurityCenterofExcellence 33

Risk Profile • Attack clustering
– Similar phenomenon appears on a macro level
©2016CIRI/AHomelandSecurityCenterofExcellence 34
Outburst of attacks in a short period - Vulnerabilities discovered - New attacking technique - Etc.
Slowly dies out - Slow adoption of patches - Workaround attacks are used until completely
blocked - Etc.

Risk Profile • Clustering indicates interdependency in attacks
– Different attacks may have the same cause: • Vulnerability • Tool/method • Actor • Target
• From a cyber-insurance aspect, correlation among policies may
amplify the losses – Several policyholders can be affected in a single incident. e.g.
• XSS attack affects site visitors on a large scale • Vulnerabilities in popular backend platforms can expose the sites using these
platforms in danger
©2016CIRI/AHomelandSecurityCenterofExcellence 35

Methodology for Analyzing Portfolio Risk
• Assumptions: – Every incident results in a claim – Claims are all covered. – Portfolios are static(not changing in different years) – It’s far from being realistic, but simple and good enough for a start
• Generate a list of publicly traded companies in US – Exchanges we considered include Nasdaq, NYSE and AMEX – 5700+ companies in total after removing duplications
• different classes of stock or different divisions from the same company are seen as duplications.
• 6600+ companies before removal – Data source: NASDAQ(
http://www.nasdaq.com/screening/companies-by-name.aspx)
©2016CIRI/AHomelandSecurityCenterofExcellence 36

Methodology for Analyzing Portfolio Risk
• We randomly sample 100 companies from the list to form a portfolio of policyholders
– Assuming each company has the same likelihood of purchasing cyber-insurance – Repeat the process for 1000 time to create 1000 portfolios.
• Using name matching algorithm, we look up the companies from each portfolios in the incident database(VCDB) to see how many of them have incidents in a given year
– we use data points from 2011 to 2014, since they have the best quality
• Log the incident number of each portfolio. Since we have 1000 portfolios in each year, we get a pretty good distribution of portfolio risk in terms of claim counts.
©2016CIRI/AHomelandSecurityCenterofExcellence 37

©2016CIRI/AHomelandSecurityCenterofExcellence 38
• The claim count from a portfolio generally follows Poisson distribution (mean ≈ 3.5 out of 100 in 2011)
• Empirical distribution has a larger tail than the fitted one, indicating a higher probability of large claim numbers
Portfolio Risk

Incident Number Distribution of Portfolios of Size 100 in Different Years
39©2016CIRI/AHomelandSecurityCenterofExcellence

Portfolio Risk in Different Years
• Distribution parameter does not hold constant
• The expected value of claim counts can be very different in different years – i.e. in the first three years, the mean number keeps growing,
but in the fourth year it declines
• Tail is getting bigger over time, which means large claim count is becoming more likely to occur
©2016CIRI/AHomelandSecurityCenterofExcellence 40

Portfolio Risk – Typical methods to model the correlation in portfolios
• Common shock model • Copulas • Bayesian Belief Network (BBN)
– Common shock model gets messy when the number of dimensions increases(e.g. a large group of policies that are interdependent)
– Copulas are simple and popular in credit risk analysis • Credit risk and cyber-risk are similar in many ways
– Both bond portfolio and cyber-insurance portfolio have some diversity but correlated risk arises from changes in the big environment
– We can see a cyber-incident as the consequence of defense level going below some threshold, which is similar to a ‘default’
• For this reason, many researchers have proposed using copulas to measure the risk in cyber-insurance portfolios
• Downside: many implementations of these methods need large amount of historical data
©2016CIRI/AHomelandSecurityCenterofExcellence 41

Portfolio Risk • Bayesian belief network
– It updates our belief based on evidence, so we can easily incorporate new data in analysis
– Fairly new in portfolio management
– Few literatures discuss the application of such method in details
– A possible structure of the network
©2016CIRI/AHomelandSecurityCenterofExcellence 42
B
A
Vulnerability
Discovered/notDiscovered
Industry
Targeted/notTargeted
c
Otherfactors
x

Portfolio Risk • Probabilities in the network are
updated according to the new information, e.g.
– Assuming we know A is attacked – From this piece of information we
induct that possibly there is a vulnerability in the system that A uses being exploited
– Because B used the same system, the possibility of B being attacked goes up
• Application – Update portfolio risk profile in real-time – Insurers can change premium rates
and reserves accordingly
©2016CIRI/AHomelandSecurityCenterofExcellence 43
B
A
Vulnerability
Discovered/notDiscovered
Industry
Targeted/notTargeted
c
Otherfactors
x

Thank you