Embed Size (px)
Citation preview
DSGD DISCUSSION PAPER NO. 6
Development Strategy and Governance Division
International Food Policy Research Institute 2033 K Street, N.W.
Washington, D.C. 20006 U.S.A. http://www. ifpri.org
May 2004
Copyright © 2004 International Food Policy Research Institute
DSGD Discussion Papers contain preliminary material and research results, and are circulated prior to a full peer review in order to stimulate discussion and critical comment. It is expected that most Discussion Papers will eventually be published in some other form, and that their content may also be revised.
SECURITY IS LIKE OXYGEN: EVIDENCE FROM UGANDA
Xiaobo Zhang
i
ACKNOWLEDGEMENT
The author would like to acknowledge the helpful comments from Shenggen Fan,
Peter Hazell, Ephraim Nkonya, Danielle Resnick, Sherman Robinson, James Thurlow,
and participants in the Centre for the Study of African Economics Conference on
�Growth, Poverty Reduction, and Human Development in Africa� at the University of
Oxford, March 21-22, 2004.
iii
TABLE OF CONTENTS
ACKNOWLEDGEMENT ................................................................................................... i
TABLE OF CONTENTS................................................................................................... iii
LIST OF TABLES............................................................................................................. iv
ABSTRACT........................................................................................................................ v
I. Introduction................................................................................................................. 7 Data ........................................................................................................................... 10
II. Conceptual Framework............................................................................................. 16
III. Conclusions............................................................................................................... 22
References......................................................................................................................... 23
List of Discussion Papers.................................................................................................. 25
iv
LIST OF TABLES
1. Public Investment by Region in Uganda in 1997/1998, million of shillings. ��������������������....... 9
2. Civil strifw, Per Capita Consumption, and Household Asset by Region in 1992 and 1999. ��������������������... 11
3. The Impact of Infrastructure and Civil Strife on Per Capita Consumption Growth. ��������������������.�... 18
4.. The Impact of Infrastructure and Civil Strife on Poverty Dynamics ���.. 20
v
ABSTRACT
Since the early 1990s, Uganda has been one of Africa�s fastest growing countries.
However, at the sub-national level, growth has been uneven due to civil conflict in the
northern region. Using a panel of household and community level data, this paper
examines the links between security and economic growth. It is found that security is a
pre-condition for successful economic development and that there is in fact a threshold
level of security below which public investments in infrastructure and education have
little impact on growth. Only when security exceeds this threshold do public investments
stimulate economic growth. Economists and policy advisors living in peaceful countries
often prescribe economic policies that hinge on the assumption of good security. In this
manner, security, like oxygen, is taken for granted.
JEL Keywords: Security, civil strife, growth, poverty, Uganda, Africa.
7
SECURITY IS LIKE OXYGEN: EVIDENCE FROM UGANDA
Xiaobo Zhang ∗
I. INTRODUCTION
A large body of growth literature and cross-country empirics has highlighted
some key correlates of economic growth, such as institutions, geography, finance, and
trade (Temple, 1999). Global cross-country regressions impose a structural linear
relationship on the available data and often use a dummy variable to control for outliers
such as Sub-Sahara African countries (Collier and Gunning, 1999).1 All countries,
including the outlier countries, are assumed to share the same growth patterns except for
differences in their intercept coefficients. As a result, the key explanatory variables have
the same ubiquitous impact on growth across different development stages and across
space, and policy sequencing does not matter. However, because of the diverse nature of
countries, the relationships uncovered in the cross-country empirics may not always have
the same importance. For example, in a country engaged in civil war, the public may
more urgently demand the restoration of public order (and basic infrastructure, as in Iraq
and Afghanistan) than market liberalization. Simply relying on the results generated from
cross-country empirics and ignoring the order of importance of different policies at the
individual country level may lead to improper policy advice, as was often the case with
the macro adjustment programs in the 1980s.
Recognizing that general growth theories and development principles are not
adequate for guiding developing countries, especially in those sub-Sahara African
countries plagued by conflict, Collier and his coauthors (Collier, 1994; Collier, 1999;
∗ Xiaobo Zhang is a research fellow in the Development Strategy and Governance Division (DSGD) of the International Food Policy Research Institute (IFPRI). 1 Among the exceptions are the work by Durlauf and Johnson (1995) who identify multiple regimes and the parameters vary significantly across the regimes.
8
Collier and Hoeffler, 1998; Collier, Hoeffler, and Pattillo, 2001) have made seminal
contributions in examining the nature and consequence of civil conflict, bringing research
on civil strife into the agenda of development economists. Collier (1999) characterizes
the four major effects of civil conflict on an economy --- destruction of physical capital,
disruption of economic exchange, diversion of public expenditure from output-enhancing
activities, and dissaving (capital flight). One implication of the study is that conflict-
vulnerable countries have different features than peaceful countries and therefore more
in-depth case studies of these countries are needed. However, due to lack of detailed
within-country data, these studies still rely heavily on cross-country regressions and use a
dummy variable to control for war or conflict. This implicitly assumes a linear
relationship between key explanatory variables and growth regardless of the degree of
insecurity.
Yet, a country�s needs, like a human being�s, do have an order of importance. As
survival and security are of the utmost need for a human being, so too are they for a
country. In this paper, we use Uganda as a case to demonstrate that security is a pre-
condition for development. Only when security reaches a certain threshold, does
improvement in infrastructure start to have an impact on growth. On the other hand,
poverty and lack of economic development could be a root cause of disorder and
conflicts. Without a panel data set, it is difficult to disentangle the two-way causal
effects.
Uganda is particularly well suited for our analysis for several reasons. First,
Uganda has experienced a prolonged civil conflict with the rebels of the Lord�s
Resistance Army (LRA), which has attacked civilians and abducted children for nearly
two decades in the northern part of the country. Second, disagreement between donors
and the government over spending priorities is pronounced. Although the government
gives high priority to eliminating the LRA, the government is constrained by lack of
funds. President Yoweri Museveni has openly blamed the donors� restrictions on defense
spending (Economist, 2004) for the continued violence. Third, high quality survey data
has been collected at the household and community level over a rather long period,
9
making it possible to control for institutional and cultural differences inherent in cross-
country growth studies. Moreover, the household panel data set enables us to control for
the possible endogeneity problem of civil strife.
Deininger (2003) has analyzed the causes and consequences of civil strife in
Uganda. Similar to the cross-country empirics, he uses standard regressions to examine
the correlates of civil strife based on official 1992 and 1999 survey data at the household
and community levels. He finds that government provision of infrastructure has a clear
conflict-reducing impact (page 580):
�� lack of economic development is a key factor that increases the incidence of
civil strife�. Government policies to raise the opportunity cost of labor, e.g. by
improving education and infrastructure, would have a clear negative impact on the
propensity toward civil strife��
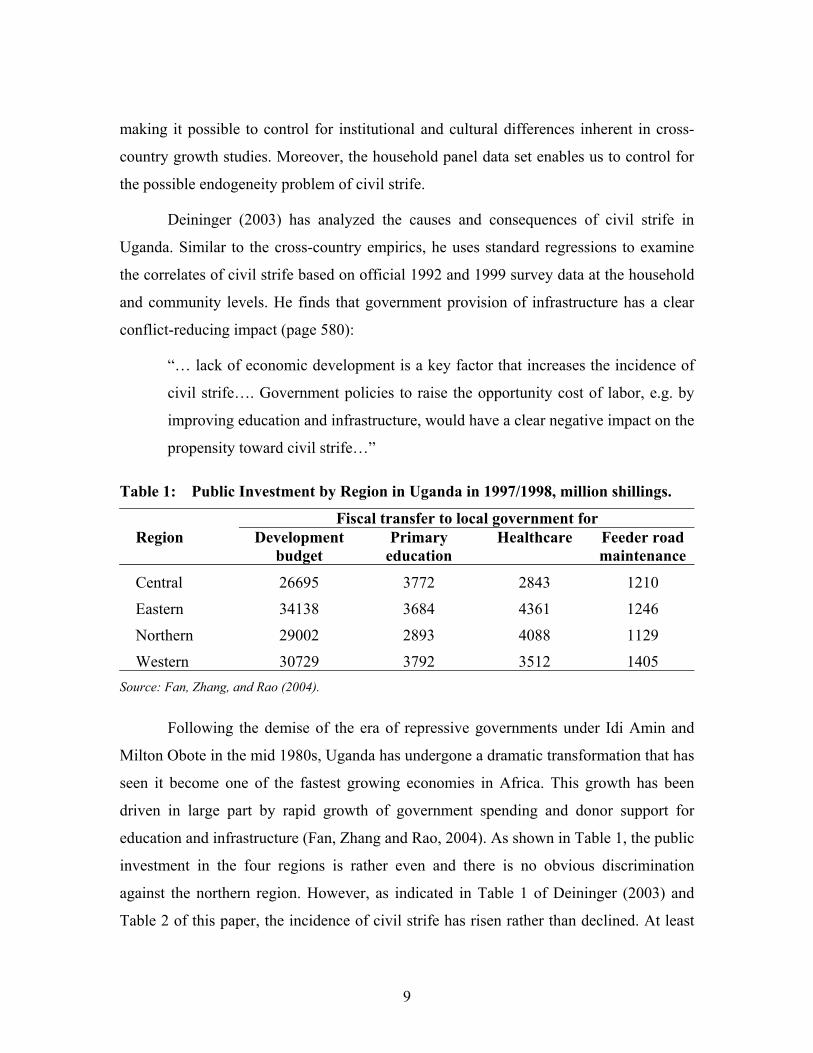
Table 1: Public Investment by Region in Uganda in 1997/1998, million shillings.
Fiscal transfer to local government for Region Development
budget Primary
education Healthcare Feeder road
maintenance
Central 26695 3772 2843 1210
Eastern 34138 3684 4361 1246
Northern 29002 2893 4088 1129
Western 30729 3792 3512 1405 Source: Fan, Zhang, and Rao (2004).
Following the demise of the era of repressive governments under Idi Amin and
Milton Obote in the mid 1980s, Uganda has undergone a dramatic transformation that has
seen it become one of the fastest growing economies in Africa. This growth has been
driven in large part by rapid growth of government spending and donor support for
education and infrastructure (Fan, Zhang and Rao, 2004). As shown in Table 1, the public
investment in the four regions is rather even and there is no obvious discrimination
against the northern region. However, as indicated in Table 1 of Deininger (2003) and
Table 2 of this paper, the incidence of civil strife has risen rather than declined. At least
10
from these tables, the correlation between infrastructure development and civil strife is
not strong.
In order to disentangle the puzzle, we look for the threshold effects of civil strife
on economic growth by running two separate regressions for two types of regions, those
without security problems and those subject to civil strife. The results show that the on-
going local insurgency has disrupted long-term social and economic activities,
diminishing the impact of infrastructure improvement and thwarting economic growth.
Only when security exceeds a certain threshold, does infrastructure development become
a key engine for economic growth.
The paper is arranged as follows. The next section describes the data used in
analysis. The third section presents the model specification and estimation. The final
section presents some concluding remarks.
Data
The data used in this analysis are taken from the 1992 Uganda Integrated
Household Survey (UIHS) and the 1999 Uganda National Household Survey (UNHS).
Both surveys included a household survey, a crop survey (agricultural enterprise survey
in 1992-93) and a community survey. The household surveys include about 10,000
households. There are over 1,000 panel households, which have been surveyed in both
years. The household surveys contain detailed information on expenditures and
individual characteristics. The 1999/2000 household socio-economic surveys asked
households to report on the incidence of civil strife, theft, and interpersonal violence in
1992 and during the year prior to interview.2 Because the rich are more likely to be
2 The three questions in section 11 of the 1999 UNHS are as follows: (1) �Has your production of crops/ cattle or livestock rearing/ trading activities been harmed by civil strife over the past 12 months? (2) �How many incidents of theft of property has the household suffered in the last 12 months and in 1992?� (3) �How many incidents of physical attack on members of the household have there been over the last 12 months and in 1992?� Deininger defines a community as affected by civil strife, theft, or attacks, if it is reported by at least one household. However, in so doing, the number of communities affected by civil strife exceeds 50%. As indicated in Table 1 of his paper, the incidence of civil strife in the western region in 1999 was higher at 69.7% than in the northern region (54.1%). This contradicts the fact that the northern region is widely perceived to be far more insecure than other regions. In this paper, we calculate the average incidence of civil strife at the community level based on the household surveys in 1992 and 1999
11
targeted for theft and other violence, using reported crime incidents at the household level
might confound the measure of a broader security environment. We therefore use an
aggregate measure calculated at the community level as described in footnote 2. The
community surveys report infrastructure data in 1992 and 1999 including distance to
roads, markets, clinics, and phone call boxes and the proportion of farmers visited by
extension agents.
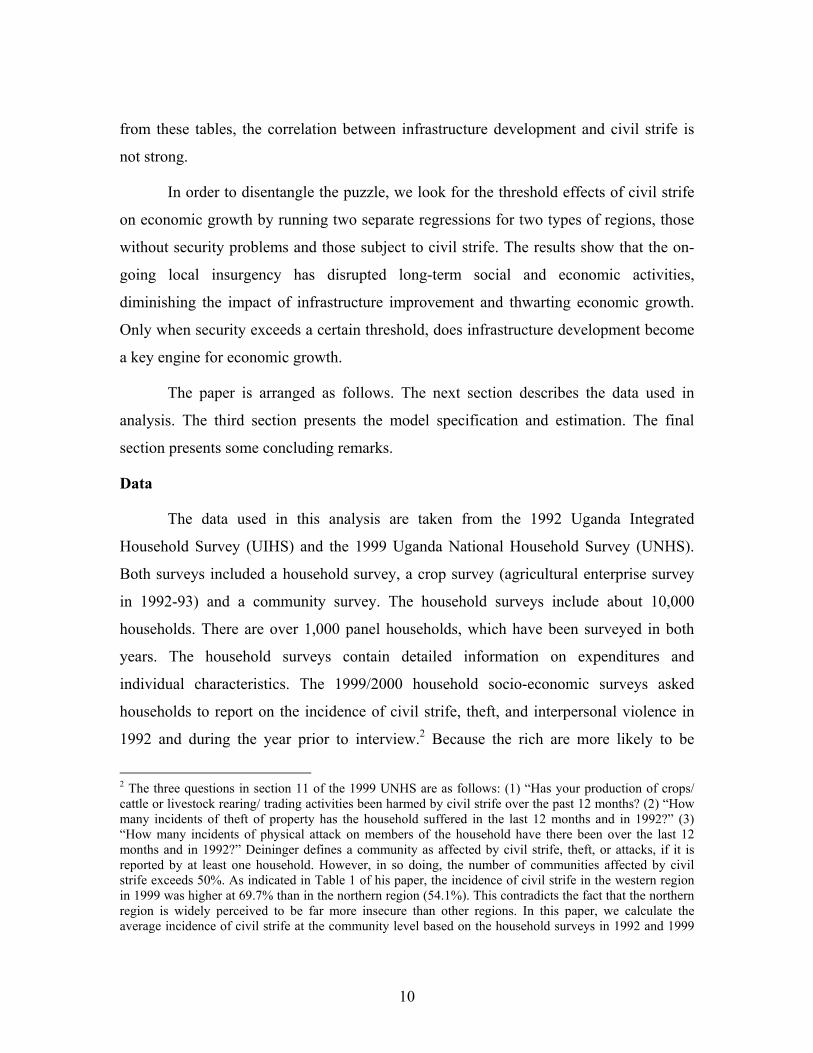
Table 2: Civil strife, Per Capita Consumption, and Household Asset by Region in 1992 and 1999.
Region Civil strife (%)
Theft (%)
Attack (%)
Per capita consumption
Asset
1992 1992 shillings 1999 thousand shillings Central 2.2 14.1 3.0 25,256 5,764 East 8.5 13.4 5.8 15,205 2,161 North 12.9 19.6 5.5 12,566 1,230 West 5.1 14.1 4.4 15,778 3,386
Total 6.4 14.9 4.5 17,963 3,465 1999 1999 shillings
(nominal growth rate) 1999 thousand shillings (nominal growth rate)
Central 4.9 24.3 4.7 39,441 (56.2%) 6,932 (20.3%) East 11.5 26.6 8.5 22,770 (49.8%) 2,431 (12.5%) North 12.9 25.1 9.5 16,764 (33.4%) 1,254 (2.0%) West 12.6 19.4 5.4 28,477 (80.5%) 3,930 (16.1%)
Total 9.9 23.9 6.7 28,504 (58.7%) 4,050 (16.9%)
Note: The information on civil strife, theft, and attack are aggregated from the 1999 Uganda National Household Surveys (UNHS). Per capita consumption data for 1992 and 1999 are generated from the 1992 Uganda Integrated Household Survey and the 1999 UNHS. The asset data in 1992 is based on recall in the 1999 survey. The asset data at both 1992 and 1999 are from the 1999 UNHS. Respondents are asked to compare the 1992 asset level with that of 1999 in six categories --- about equal, somewhat more, somewhat less, none, much more, and much less. Following Deininger (2003), we assign the percentage increases corresponding to the above six categories as 0, 25%, -25%, -100%, 50%, and �50%, respectively, to calculate the 1992 asset.
Table 2 reports civil strife, per capita consumption and household assets by region
in 1992 and 1999. Several features are apparent from the table. First, the incidence of
civil strife, theft, and physical attacks increased between 1992 and 1999 for most regions
and for Uganda as a whole. Rapid economic development has not necessarily translated and weighted by sample multipliers (not just the panel component) and use the resulting measure as a proxy for civil strife.
12
into less civil strife. Second, the regional growth patterns of per capita consumption and
household assets are related to the level of civil strife. The northern region has the lowest
growth rate in per capita consumption and household assets and the highest incidence of
civil strife, theft and attack. In contrast, the central region has experienced the fastest
growth in expenditure and asset while enjoying the lowest incidence of civil strife and
crimes. The security environment does appear to be relevant for economic growth and
asset accumulation.
0.2
.4.6
.8G
row
th fr
om 1
992
to 1
999
0 .1 .2 .3Civil strife at district level in 1992
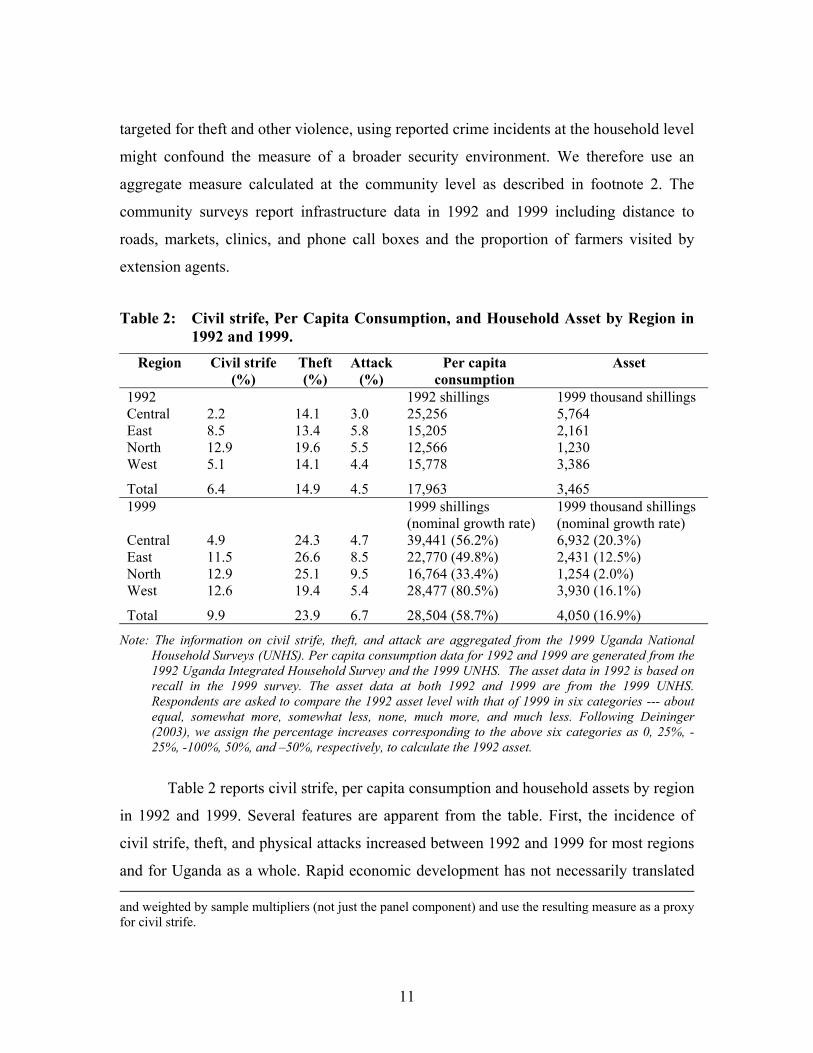
Figure 1. Civil Strife and Per Capita Consumption Growth at District Level
Figure 1 plots the degree of civil strife and the growth of per capita consumption
from 1992 to 1999 at the district level aggregated from the household surveys. The
horizontal axis represents the incidence of civil strife, while the vertical axis measures
growth rate of per capita consumption. The figure includes all the districts, clearly
indicating a negative relationship between the two variables. However, if we look only at
13
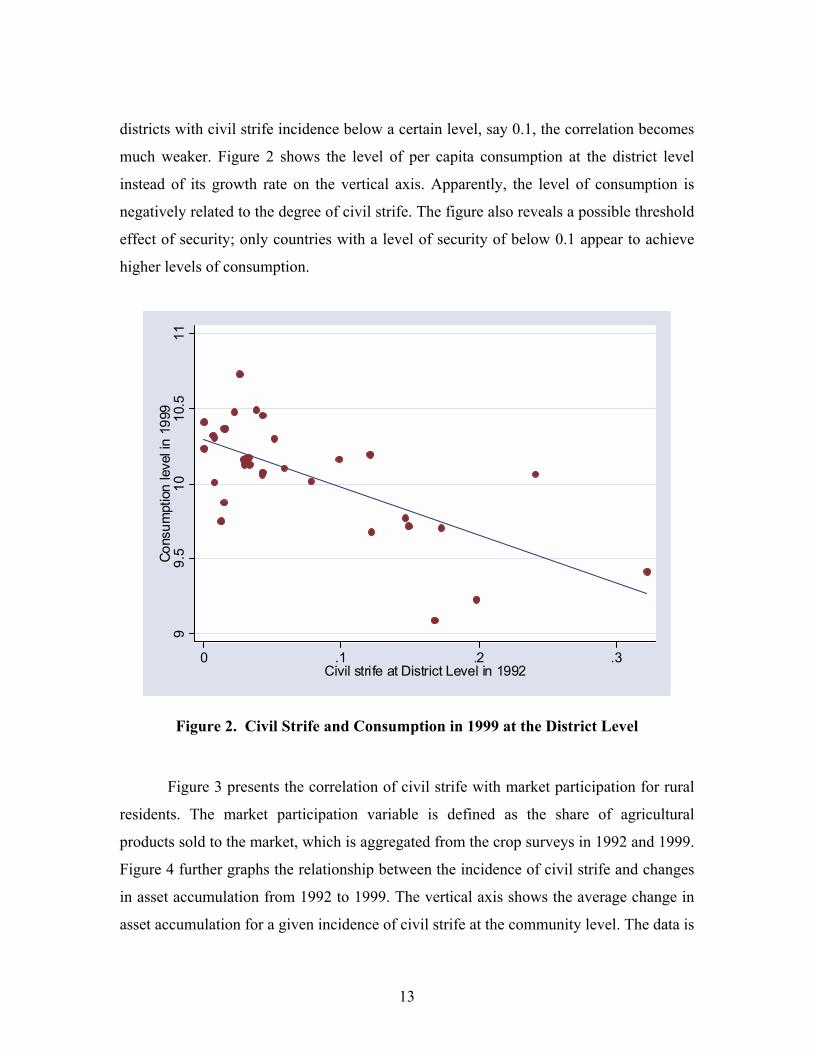
districts with civil strife incidence below a certain level, say 0.1, the correlation becomes
much weaker. Figure 2 shows the level of per capita consumption at the district level
instead of its growth rate on the vertical axis. Apparently, the level of consumption is
negatively related to the degree of civil strife. The figure also reveals a possible threshold
effect of security; only countries with a level of security of below 0.1 appear to achieve
higher levels of consumption.
99.
510
10.5
11Co
nsum
ptio
n le
vel i
n 19
99
0 .1 .2 .3Civil strife at District Level in 1992
Figure 2. Civil Strife and Consumption in 1999 at the District Level
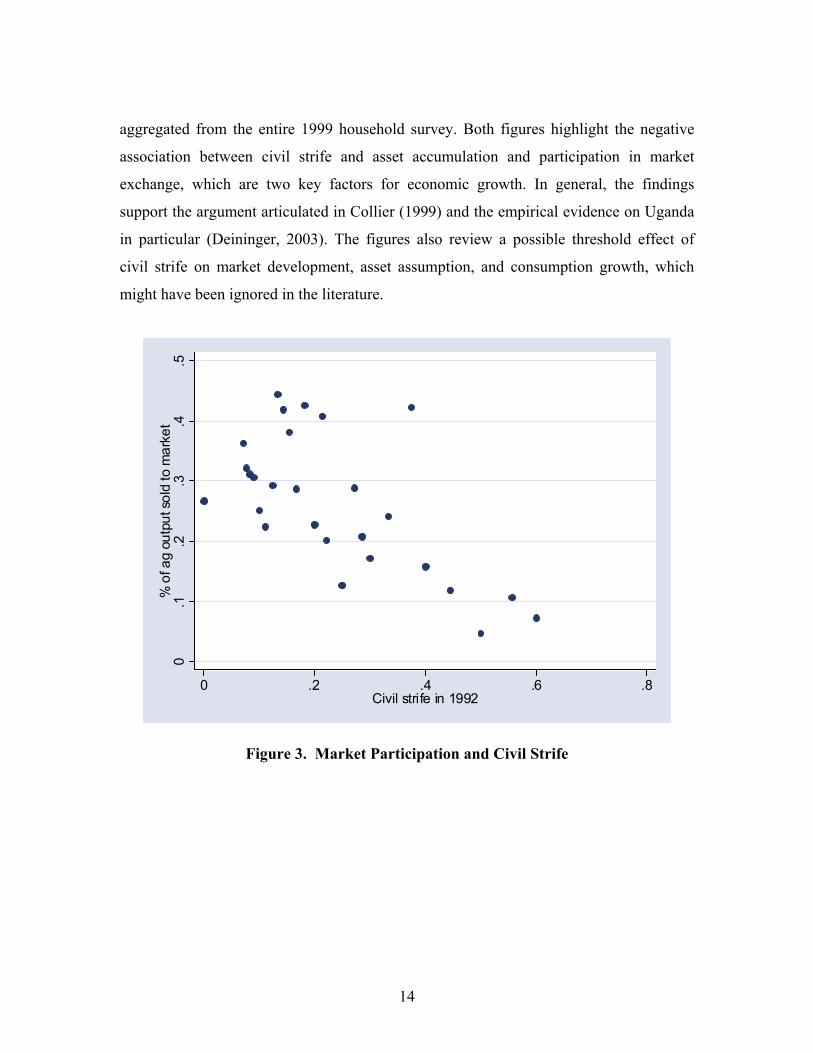
Figure 3 presents the correlation of civil strife with market participation for rural
residents. The market participation variable is defined as the share of agricultural
products sold to the market, which is aggregated from the crop surveys in 1992 and 1999.
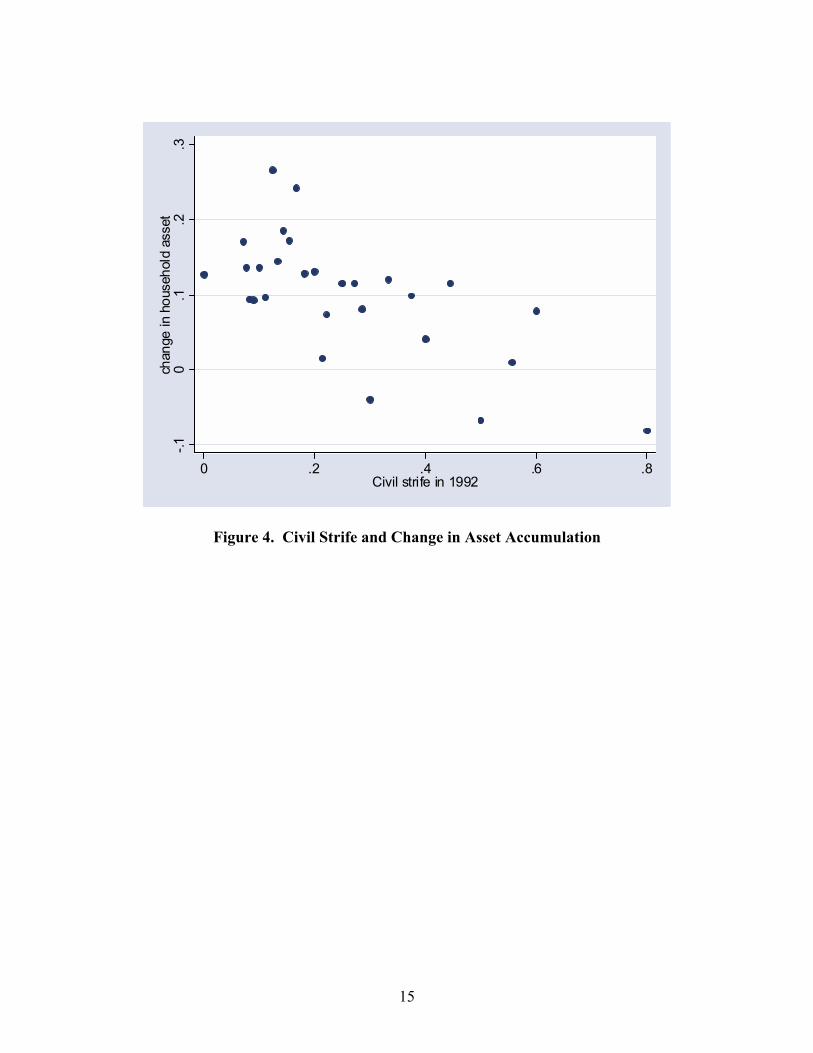
Figure 4 further graphs the relationship between the incidence of civil strife and changes
in asset accumulation from 1992 to 1999. The vertical axis shows the average change in
asset accumulation for a given incidence of civil strife at the community level. The data is
14
aggregated from the entire 1999 household survey. Both figures highlight the negative
association between civil strife and asset accumulation and participation in market
exchange, which are two key factors for economic growth. In general, the findings
support the argument articulated in Collier (1999) and the empirical evidence on Uganda
in particular (Deininger, 2003). The figures also review a possible threshold effect of
civil strife on market development, asset assumption, and consumption growth, which
might have been ignored in the literature.
0.1
.2.3
.4.5
% o
f ag
outp
ut s
old
to m
arke
t
0 .2 .4 .6 .8Civil strife in 1992
Figure 3. Market Participation and Civil Strife
15
-.10
.1.2
.3ch
ange
in h
ouse
hold
ass
et
0 .2 .4 .6 .8Civil strife in 1992
Figure 4. Civil Strife and Change in Asset Accumulation
16
II. CONCEPTUAL FRAMEWORK
Following Barro and Sala-I-Martin (1995) on growth convergence and Dercon
(2003) on shocks, we model the growth rate of per capita consumption as a function of its
initial value and a set of other variables:
itit
it DZyayy εβ ++++= −
−δγ)log()log( 1
1 (1)
where yit is per capita consumption in 1999 and yit-1 is per capita consumption in 1992.
The subscripts t and t-1 refer to 1999 and 1992, respectively. The left-hand side variable
represents the growth rate of per capita consumption in the period. The coefficient β
stands for the speed of income convergence. A positive value for this coefficient indicates
convergence while a negative value implies divergence. It provides useful information to
understand how initial conditions contribute to long-term income growth and whether
there is a convergence or not. Z is a vector of idiosyncratic and covariate shocks and γ is a
vector of corresponding coefficients. D is a set of regional dummies and δ is a vector of
coefficients for these fixed effects. The four regions are central, east, north, and west. We
also add a dummy variable for rural resident status in the equation to control for the large
rural-urban difference.
The Z vector includes idiosyncratic shocks at the household level and covariate
shocks at the community level. Household shocks comprise: whether the household head
was sick during the one-month period before the 1999 survey, and having an orphan in
the household. Because of the AIDS epidemic and the prevalence of tropical diseases,
such as malaria, the mortality rate is rather high in our sample. About 40% of households
include an orphan child. Therefore, these two variables to a large extent capture the
degree of shocks related to health.
The aggregate shocks include civil strife, change in distance to the most common
output market, change in distance to the nearest clinic, change in distance to the nearest
feeder road, change in distance to the nearest phone call box, and change in the
17
proportion of farmers visited by extension agents. We use these variables to capture the
impact of civil strife and infrastructure development.
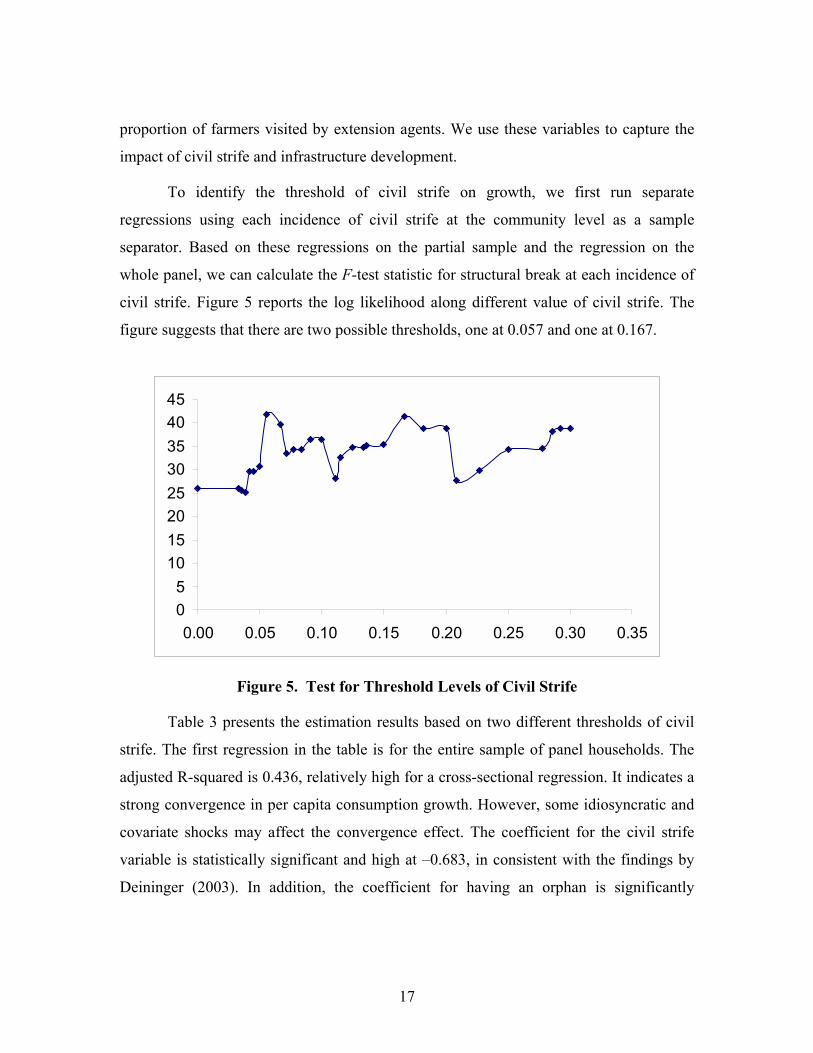
To identify the threshold of civil strife on growth, we first run separate
regressions using each incidence of civil strife at the community level as a sample
separator. Based on these regressions on the partial sample and the regression on the
whole panel, we can calculate the F-test statistic for structural break at each incidence of
civil strife. Figure 5 reports the log likelihood along different value of civil strife. The
figure suggests that there are two possible thresholds, one at 0.057 and one at 0.167.
05
1015202530354045
0.00 0.05 0.10 0.15 0.20 0.25 0.30 0.35
Figure 5. Test for Threshold Levels of Civil Strife
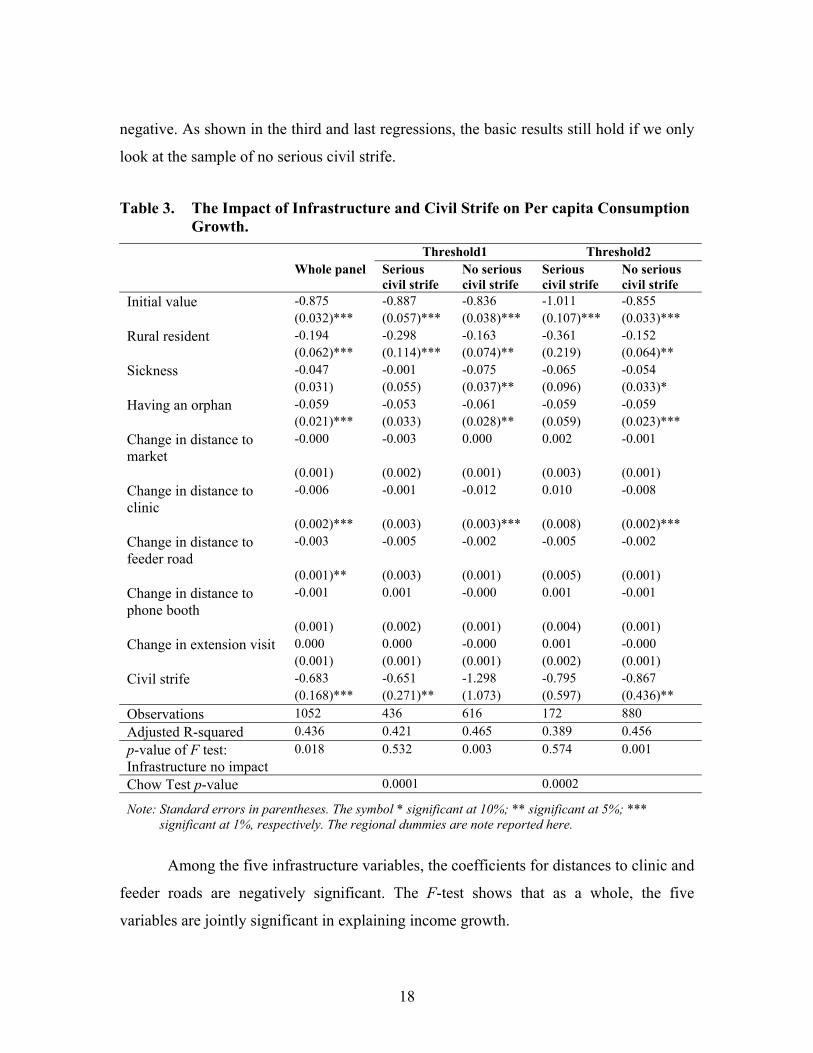
Table 3 presents the estimation results based on two different thresholds of civil
strife. The first regression in the table is for the entire sample of panel households. The
adjusted R-squared is 0.436, relatively high for a cross-sectional regression. It indicates a
strong convergence in per capita consumption growth. However, some idiosyncratic and
covariate shocks may affect the convergence effect. The coefficient for the civil strife
variable is statistically significant and high at �0.683, in consistent with the findings by
Deininger (2003). In addition, the coefficient for having an orphan is significantly
18
negative. As shown in the third and last regressions, the basic results still hold if we only
look at the sample of no serious civil strife.
Table 3. The Impact of Infrastructure and Civil Strife on Per capita Consumption Growth.
Threshold1 Threshold2 Whole panel Serious
civil strife No serious civil strife
Serious civil strife
No serious civil strife
Initial value -0.875 -0.887 -0.836 -1.011 -0.855 (0.032)*** (0.057)*** (0.038)*** (0.107)*** (0.033)*** Rural resident -0.194 -0.298 -0.163 -0.361 -0.152 (0.062)*** (0.114)*** (0.074)** (0.219) (0.064)** Sickness -0.047 -0.001 -0.075 -0.065 -0.054 (0.031) (0.055) (0.037)** (0.096) (0.033)* Having an orphan -0.059 -0.053 -0.061 -0.059 -0.059 (0.021)*** (0.033) (0.028)** (0.059) (0.023)*** Change in distance to market
-0.000 -0.003 0.000 0.002 -0.001
(0.001) (0.002) (0.001) (0.003) (0.001) Change in distance to clinic
-0.006 -0.001 -0.012 0.010 -0.008
(0.002)*** (0.003) (0.003)*** (0.008) (0.002)*** Change in distance to feeder road
-0.003 -0.005 -0.002 -0.005 -0.002
(0.001)** (0.003) (0.001) (0.005) (0.001) Change in distance to phone booth
-0.001 0.001 -0.000 0.001 -0.001
(0.001) (0.002) (0.001) (0.004) (0.001) Change in extension visit 0.000 0.000 -0.000 0.001 -0.000 (0.001) (0.001) (0.001) (0.002) (0.001) Civil strife -0.683 -0.651 -1.298 -0.795 -0.867 (0.168)*** (0.271)** (1.073) (0.597) (0.436)** Observations 1052 436 616 172 880 Adjusted R-squared 0.436 0.421 0.465 0.389 0.456 p-value of F test: Infrastructure no impact
0.018 0.532 0.003 0.574 0.001
Chow Test p-value 0.0001 0.0002
Note: Standard errors in parentheses. The symbol * significant at 10%; ** significant at 5%; *** significant at 1%, respectively. The regional dummies are note reported here.
Among the five infrastructure variables, the coefficients for distances to clinic and
feeder roads are negatively significant. The F-test shows that as a whole, the five
variables are jointly significant in explaining income growth.
19
However, when repeating the regression using only the communities with serious
civil strife problem, none of the infrastructure and personal shock variables remains
statistically significant. The Chow-test further validates that there exists a significant
structural difference between the two samples and therefore pooling them together may
overstate the impact of infrastructure development in civil strife-vulnerable regions.
When a region suffers from civil strife, simply investing precious public resources on
education and infrastructure may be a waste. Restoring social order and creating a secure
environment are prerequisites for making further public investments productive.
In addition to per capita consumption, we also examine the impact of civil strife
and infrastructure development on poverty dynamics by replacing the left-hand variable
with a discrete 0,1 poverty dynamics variable. With respect to poverty estimation, we
closely followed Appleton�s method (2001) of estimating values of consumption per
adult equivalent. Based on regionally specific poverty lines described in Appleton (2001),
we define the poverty status for each household as follows.3 If a household was poor in
1992 but not in 1999, we classify it into the category of �escaping from poverty� and
assign a value of 1. The remaining households are assigned 0. Similarly, we can define
those households that were non-poor in 1992 but poor in 1999 as �falling into poverty�
and create another pair of binary variables.
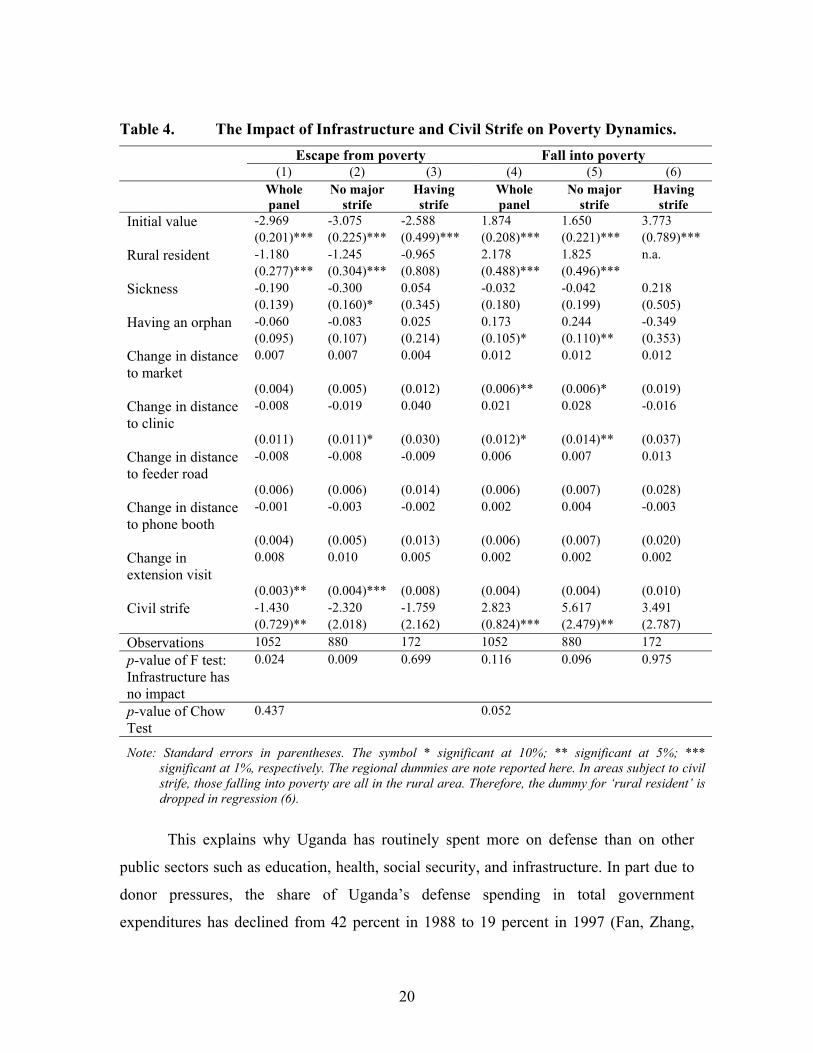
Table 4 shows the logit estimate on the impact of infrastructure development and
civil strife on poverty dynamics from 1992 to 1999. The outcome variable in regressions
(1)�(3) is �escaping from poverty� while the outcome variable in remaining regressions is
�falling into poverty�. Similar to the findings in Table 3, for the whole sample and the
partial sample without serious civil strife, the infrastructure variables are jointly
significant in explaining poverty dynamics. However, in regions plagued with civil strife,
infrastructure development does not matter much to the outcome. Once again, the Chow-
test shows a structural break when civil strife reaches a threshold.
3Appleton (2001) has reported poverty rates at the regional level only.
20
Table 4. The Impact of Infrastructure and Civil Strife on Poverty Dynamics. Escape from poverty Fall into poverty (1) (2) (3) (4) (5) (6)
Whole panel
No major strife
Having strife
Whole panel
No major strife
Having strife
Initial value -2.969 -3.075 -2.588 1.874 1.650 3.773 (0.201)*** (0.225)*** (0.499)*** (0.208)*** (0.221)*** (0.789)*** Rural resident -1.180 -1.245 -0.965 2.178 1.825 n.a. (0.277)*** (0.304)*** (0.808) (0.488)*** (0.496)*** Sickness -0.190 -0.300 0.054 -0.032 -0.042 0.218 (0.139) (0.160)* (0.345) (0.180) (0.199) (0.505) Having an orphan -0.060 -0.083 0.025 0.173 0.244 -0.349 (0.095) (0.107) (0.214) (0.105)* (0.110)** (0.353) Change in distance to market
0.007 0.007 0.004 0.012 0.012 0.012
(0.004) (0.005) (0.012) (0.006)** (0.006)* (0.019) Change in distance to clinic
-0.008 -0.019 0.040 0.021 0.028 -0.016
(0.011) (0.011)* (0.030) (0.012)* (0.014)** (0.037) Change in distance to feeder road
-0.008 -0.008 -0.009 0.006 0.007 0.013
(0.006) (0.006) (0.014) (0.006) (0.007) (0.028) Change in distance to phone booth
-0.001 -0.003 -0.002 0.002 0.004 -0.003
(0.004) (0.005) (0.013) (0.006) (0.007) (0.020) Change in extension visit
0.008 0.010 0.005 0.002 0.002 0.002
(0.003)** (0.004)*** (0.008) (0.004) (0.004) (0.010) Civil strife -1.430 -2.320 -1.759 2.823 5.617 3.491 (0.729)** (2.018) (2.162) (0.824)*** (2.479)** (2.787) Observations 1052 880 172 1052 880 172 p-value of F test: Infrastructure has no impact
0.024 0.009 0.699 0.116 0.096 0.975
p-value of Chow Test
0.437 0.052
Note: Standard errors in parentheses. The symbol * significant at 10%; ** significant at 5%; *** significant at 1%, respectively. The regional dummies are note reported here. In areas subject to civil strife, those falling into poverty are all in the rural area. Therefore, the dummy for �rural resident� is dropped in regression (6).
This explains why Uganda has routinely spent more on defense than on other
public sectors such as education, health, social security, and infrastructure. In part due to
donor pressures, the share of Uganda�s defense spending in total government
expenditures has declined from 42 percent in 1988 to 19 percent in 1997 (Fan, Zhang,
21
and Rao, 2004). However, this level of defense spending is still relatively high when
compared with other countries in Africa (11 percent), Asia (11 percent), or Latin America
(6 percent). This share is almost twice the sum of Uganda�s spending on agriculture,
health, and infrastructure. But one should be aware that not many countries have such
serious civil strife problems as Uganda. A continued cut in defense spending may further
undermine security and make other types of public investment nonproductive. Certainly,
the government should also actively seek other avenues such as dialogue and democracy
in the war-torn region to solve the security problem.
22
III. CONCLUSIONS
Using household and community survey data in Uganda, the paper shows that
there does exist a threshold effect of security on growth. Without minimal security, it is
hard for economic exchange to take place and for agents to utilize existing or newly
provided public infrastructure for productive activities. Only when security reaches to a
certain level does infrastructure development start to prompt growth. In other words, the
sequencing of certain public policies does matter. Since lack of public services is one of
the key constraints facing Africa (Collier and Gunning, 1999), it is crucial to study the
pre-conditions for making public investment successful.
The results also highlight that development trajectories may not be linear and
�one-size-fits-all� strategies do not work (Adelman and Morris, 1971; Easterly, 2002;
Rodrik 2003). In the past, African countries have too often been treated as homogenous
entities and the development process itself as a process that occurs along a linear
continuum. Fafchamps, Teal, and Toye (2001) have advocated more research on
identifying the pre-conditions for initiating growth in Africa. This paper has
demonstrated security is one of these pre-conditions.
An implication of these findings is that countries ought to be granted some
freedom for setting their own spending priorities. Economists sitting in the safe
developed world may fail to appreciate the minimal requirement of security for economic
development. They may tend to prescribe policies which often hinge on the assumption
of good security. In this manner, security, like oxygen, is taken for granted. The
economic means of investing in education and infrastructure may not be sufficient for
reducing civil strife. As maintaining the rule of law is a pre-requisite for public
investment and economic development, without enough attention and good solutions to
civil strife, it would be difficult for many African countries to achieve the millennium
development goals (Stuart, 2003).
23
REFERENCES
Adelman, Irma and Cynthia Taft Morris, 1971. Society, Politics, and Economic Development: A Quantitative Approach, Baltimore, MD: Johns Hopkins Press.
Appleton, S. 2001. �Poverty in Uganda, 1999/2000: Preliminary Estimates from the UNHS.� Nottingham, U.K.: University of Nottingham.
Barro and Sala-I-Martin (1995). Economic Growth. McGraw-Hill Inc.
Bourguignon, Francois, 1999. �Crime, Violence, and Inequitable Development,� paper presented at the Annual World Bank Conference on Development Economics, Washington, D.C. April 28-30.
Collier, P., 1994. �Demobilisation and Insecurity: a Study in the Economics of the Transition form War to Peace,� Journal of International Development, 3: 343-351.
Collier, P., 1999. �On the Economic Consequences of Civil War,� Oxford Economic Papers, 51: 168-183.
Collier, P., and J. W. Gunning, 1999. �Explaining African Economic Performance,� Journal of Economic Literature, 37 (1): 64-111.
Collier, P., and A. Hoeffler, 1998. �On the Economic Causes of Civil Wars,� Oxford Economic Papers, 50: 563-573.
Collier, P., and A. Hoeffler, C. Pattillo, 2001. �Flight Capital as a Portfolio Choice,� World Bank Economic Review, 15: 55-80.
Deninger, K, 2003. �Causes and Consequences of Civil Strife: Micro-level Evidence from Uganda.� Oxford Economic Papers, 55: 579-606.
Dercon, Stefan, 2003. Growth and Shocks: Evidence from Rural Ethiopia. Memo, Oxford University.
Durlauf, Steven N. and Paul A. Johnson, 1995. �Multiple Regimes and Cross-Country Growth Behavior,� Journal of Applied Econometrics, 10(4): 365-384.
Easterly, William, 2002. The Elusive Quest for Growth: Economists� Adventures and Misadventures in the Tropics, Cambridge: The MIT Press.
Economist, 2004. �A Massacre in Uganda: No Respite,� February 29th, 2004.
Fafchamps, Marcel, Francis Teal, and John Toye, �Towards a Growth Strategy in Africa,� REP/2001-006. Center for the African Economies, University of Oxford.
Fan, Shenggen, Xiaobo Zhang, and Neetha Rao, 2004. �Public Expenditure, Growth, and Poverty Reduction In Rural Uganda,� Development Strategy and Governance Division Discussion Paper No. 4, International Food Policy Research Institute.
Rodrik Dani, 2003. �Growth Strategies,� memo. Harvard University.
24
Stewart, Frances. 2003. �Conflict and the Millennium Development Goals,� Journal of Human Development. Vol. 4, No.3: 325-351.
Temple, Jonathan, 1999. �The New Growth Evidence,� Journal of Economic Literature, 37 (1): 112-156.
Uganda Bureau of Statistics (2002). Provisional Summary Results of the 2002 National Census. UBOS. Entebbe.
World Bank (2002). World Development Indicators. 2002.
25
LIST OF DISCUSSION PAPERS
No. 01 �Market Opportunities for African Agriculture: An Examination of Demand-Side Constraints on Agricultural Growth� by Xinshen Diao, Paul Dorosh, and Shaikh Mahfuzur Rahman with Siet Meijer, Mark Rosegrant, Yukitsugu Yanoma, and Weibo Li.
No. 02 �Exploring Regional Dynamics in Sub-Saharan African Agriculture� by Xinshen Diao and Yukitsugu Yanoma.
No. 03 �The Effect of WTO and FTAA on Agriculture and the Rural Sector in Latin America� by Samuel Morley and Valeria Piñeiro.
No. 04 �Public Expenditure, Growth, and Poverty Reduction in Rural Uganda� by Shenggen Fan, Xiaobo Zhang, and Neetha Rao.
No. 05 �Food Aid for Market Development in Sub-Saharan Africa� by Awudu Abdulai, Christopher B. Barrett, and Peter Hazell.


![LIKE PILGRIMS TO THIS MOMENT: MYTH, HISTORY, …ecommons.usask.ca/bitstream/handle/10388/etd-12192008-183920/... · I would like to acknowledge the guidance of ... No poet [ … ]](https://img.pdfslide.us/doc/110x75/5aee5b387f8b9ac57a8bd7aa/like-pilgrims-to-this-moment-myth-history-would-like-to-acknowledge-the-guidance.jpg)