Embed Size (px)
Citation preview
UNITEDSTATESSECURITIESANDEXCHANGECOMMISSION
Washington,D.C.20549
FORM8-K
CURRENTREPORTPursuanttoSection13or15(d)oftheSecuritiesExchangeActof1934
Date of Report (Date of earliest event reported): December12,2017
HILLENBRAND,INC.(Exact Name of Registrant as Specified in Charter)
Indiana
1-33794
26-1342272(State of Incorporation)
(Commission File Number)
(IRS Employer Identification No.)
OneBatesvilleBoulevardBatesville,Indiana
47006(Address of Principal Executive Office)
(Zip Code)
Registrant’s telephone number, including area code: (812)934-7500
NotApplicable(Former Name or Former Address, if Changed Since Last Report)
Check the appropriate box below if the Form 8-K filing is intended to simultaneously satisfy the filing obligation of the registrant under any of the followingprovisions: o Written communications pursuant to Rule 425 under the Securities Act (17 CFR 230.425) o Soliciting material pursuant to Rule 14a-12 under the Exchange Act (17 CFR 240.14a-12) o Pre-commencement communications pursuant to Rule 14d-2(b) under the Exchange Act (17 CFR 240.14d-2(b)) o Pre-commencement communications pursuant to Rule 13e-4(c) under the Exchange Act (17 CFR 240.13e-4(c)) Indicate by the check mark whether the registrant is an emerging growth company as defined in Rule 405 of the Securities Act of 1933 or Rule 12b-2 of theSecurities Exchange Act of 1934. Emerging growth company o If an emerging growth company, indicate by check mark if the registrant has elected not to use the extended transition period for complying with any new orrevised financial accounting standards pursuant to Section 13(a) of the Exchange Act. o
Item7.01 RegulationFDDisclosure A copy of the presentation slides to be used by Hillenbrand, Inc. (the “Company”) for its investor day (“Investor Day”) event on December 12, 2017 are attached asExhibit 99.1 to this Current Report on Form 8-K. The presentation slides are also available on the Company’s website under “Investor Relations” atwww.hillenbrand.com. The Company’s press release regarding its Investor Day is also attached as Exhibit 99.2 hereto. The information furnished pursuant to this Item 7.01, including Exhibit 99.1 and 99.2 shall not be deemed “filed” for purposes of Section 18 of the SecuritiesExchange Act of 1934 (“Exchange Act”) or otherwise subject to the liabilities under that Section and shall not be deemed to be incorporated by reference into anyfiling of the Company under the Securities Act of 1933 or the Exchange Act, except as shall be expressly set forth by specific reference in such filing. Item9.01 FinancialStatementsandExhibits. (d) Exhibits. ExhibitNumber
Description 99.1
Investor Day Presentation Slides99.2
Press Release, dated December 12, 2017, of Hillenbrand, Inc.
1

SIGNATURES
Pursuant to the requirements of the Securities Exchange Act of 1934, the registrant has duly caused this report to be signed on its behalf by the undersignedhereunto duly authorized.
HILLENBRAND,INC. DATE: December 12, 2017
BY: /S/ Nicholas R. Farrell
Nicholas R. Farrell
Vice President, General Counsel,
Secretary and Chief Compliance Officer
2

Exhibit99.1Investor Day December 12, 2017
Safe Harbor Forward-Looking Statements and Factors That May Affect Future Results: Throughout this presentation, we make a number of “forward-looking statements” within the meaning of the Private Securities Litigation Reform Act of 1995. As the words imply, these statements about future plans, objectives, beliefs, and expectations that might or might not happen in the future, as contrasted with historical information. Forward-looking statements are based on assumptions that we believe are reasonable but by their very nature are subject to a wide range of risks. Accordingly, in this presentation, we may say something like, “We expect that future revenue associated with the Process Equipment Group will be influenced by order backlog.” That is a forward-looking statement, as indicated by the word “expect” and by the clear meaning of the sentence. Other words that could indicate we are making forward-looking statements include: This is not an exhaustive list, but is intended to give you an idea of how we try to identify forward-looking statements. The absence of any of these words, however, does not mean that the statement is not forward-looking. Here is the key point: Forward-looking statements are not guarantees of future performance, and our actual results could differ materially from what is described in any forward-looking statements. Any number of factors, many of which are beyond our control, could cause our performance to differ significantly from what is described in the forward-looking statements. For a discussion of factors that could cause actual results to differ from those contained in forward-looking statements, see the discussions under the heading “Risk Factors” in Item 1A of Part I of our Form 10-K for the year ended September 30, 2017, located on our website and filed with the SEC. We assume no obligation to update or revise any forward-looking statements. 2 intend believe plan expect may goal would become pursue estimate will forecast continue could targets encourage promise improve progress potential should
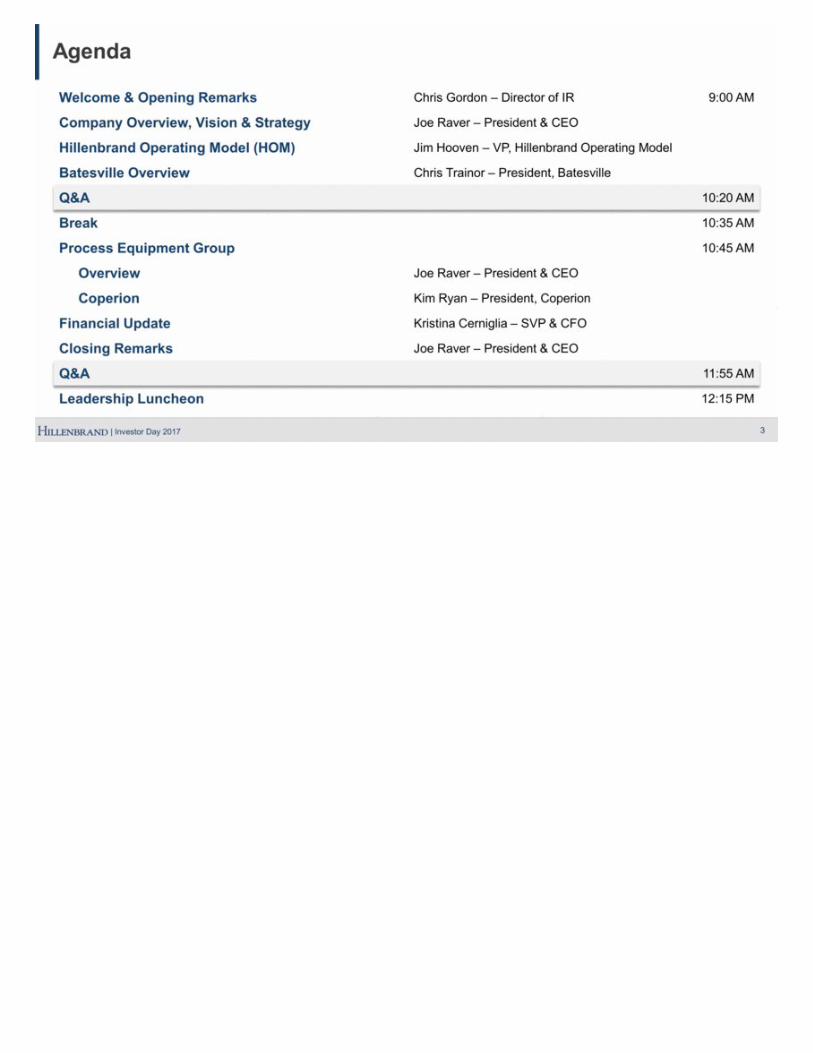
Agenda 3 Welcome & Opening Remarks Chris Gordon – Director of IR 9:00 AM Company Overview, Vision & Strategy Joe Raver – President & CEO Hillenbrand Operating Model (HOM) Jim Hooven – VP, Hillenbrand Operating Model Batesville Overview Chris Trainor – President, Batesville Q&A 10:20 AM Break 10:35 AM Process Equipment Group 10:45 AM Overview Joe Raver – President & CEO Coperion Kim Ryan – President, Coperion Financial Update Kristina Cerniglia – SVP & CFO Closing Remarks Joe Raver – President & CEO Q&A 11:55 AM Leadership Luncheon 12:15 PM

Company Overview, Vision & Strategy Joe Raver President & CEO

Key Messages 5 Significant strides made transforming Hillenbrand into a global diversified industrial company 1 Now focused on building platforms to develop scale and enhance leadership positions to drive profitable growth 2 Market leadership driven by highly-engineered products with core technologies differentiated by applications expertise 3 The Hillenbrand Operating Model (HOM) is a competitive differentiator; historically focused on margin expansion and now adding tools to drive profitable growth 4 Flexible balance sheet supported by strong cash flow and appropriate debt level; expect to make additional strategic acquisitions to accelerate profitable growth 5 Passionate leadership team driving transformation with runway for significant shareholder value creation 6
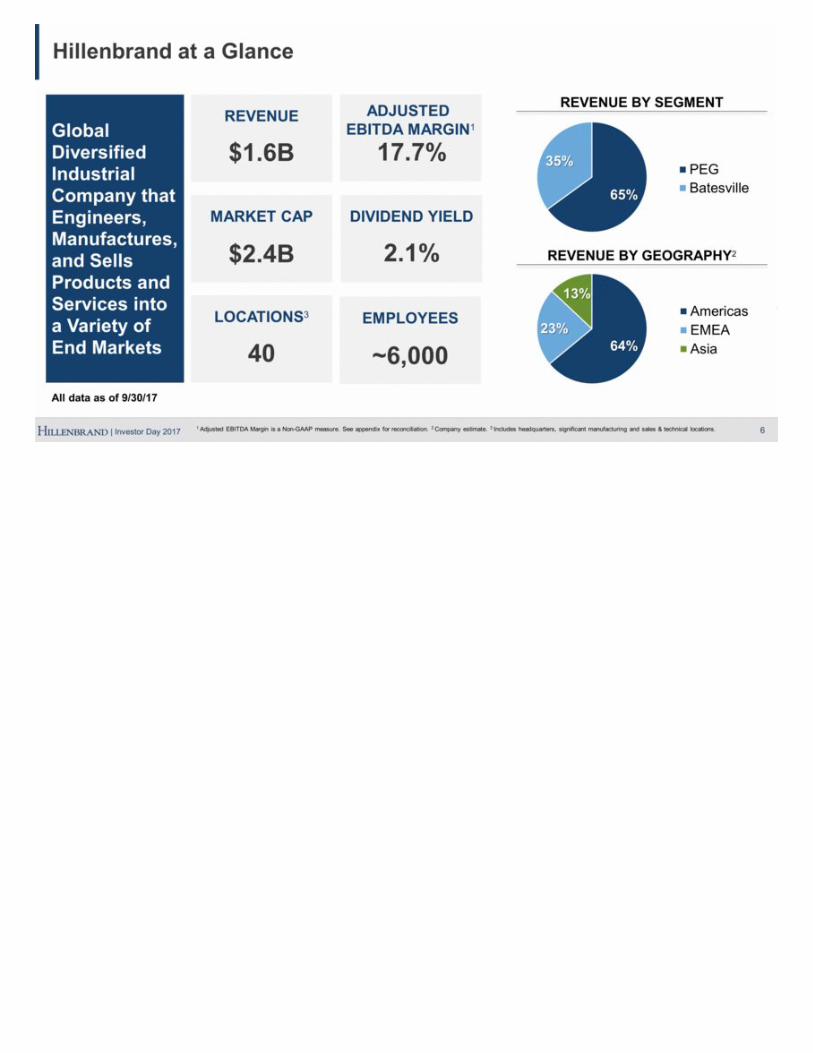
Hillenbrand at a Glance 6 REVENUE BY GEOGRAPHY2 REVENUE BY SEGMENT REVENUE $1.6B ADJUSTED EBITDA MARGIN1 17.7% DIVIDEND YIELD 2.1% Global Diversified Industrial Company that Engineers, Manufactures, and Sells Products and Services into a Variety of End Markets LOCATIONS3 40 EMPLOYEES ~6,000 MARKET CAP $2.4B All data as of 9/30/17 1 Adjusted EBITDA Margin is a Non-GAAP measure. See appendix for reconciliation. 2 Company estimate. 3 Includes headquarters, significant manufacturing and sales & technical locations.
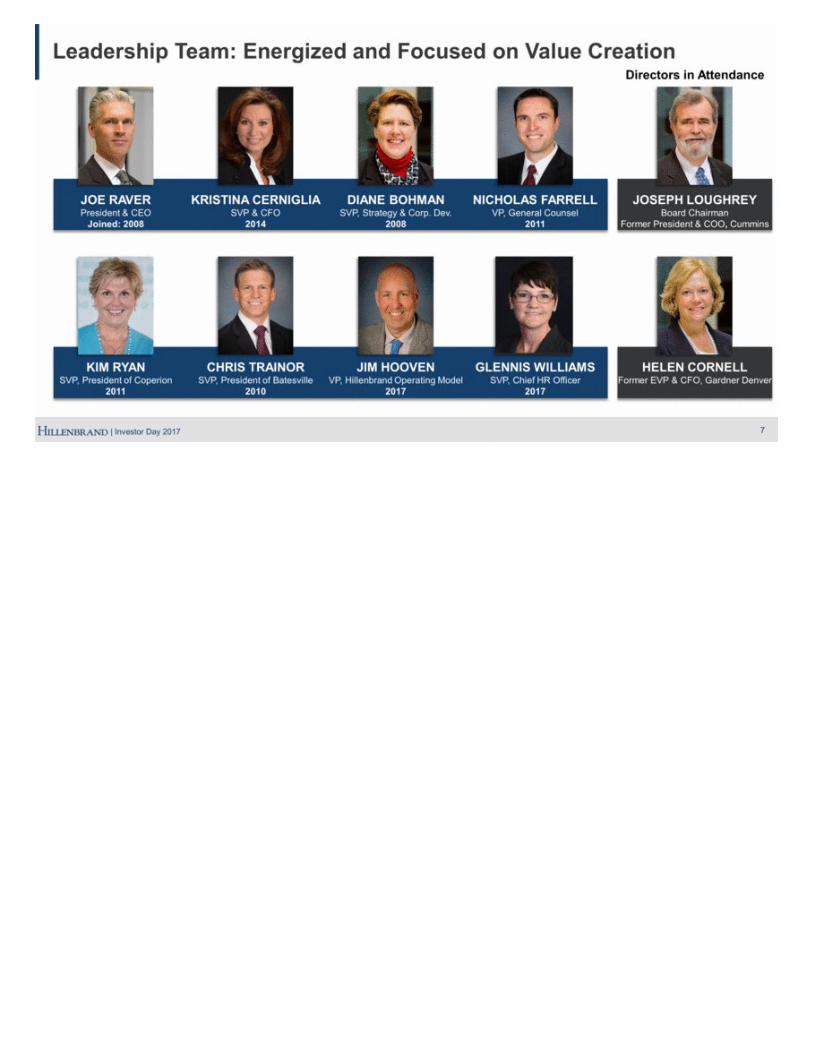
7 KRISTINA CERNIGLIA SVP & CFO 2014 CHRIS TRAINOR SVP, President of Batesville 2010 DIANE BOHMAN SVP, Strategy & Corp. Dev. 2008 JIM HOOVEN VP, Hillenbrand Operating Model 2017 NICHOLAS FARRELL VP, General Counsel 2011 GLENNIS WILLIAMS SVP, Chief HR Officer 2017 Leadership Team: Energized and Focused on Value Creation JOE RAVER President & CEO Joined: 2008 KIM RYAN SVP, President of Coperion 2011 Directors in Attendance JOSEPH LOUGHREY Board Chairman Former President & COO, Cummins HELEN CORNELL Former EVP & CFO, Gardner Denver
Hillenbrand Mission and Vision 8 Exceptional Value to Customers Great Professional Opportunities for Employees Superior Return for Shareholders A World-Class, Global Diversified Industrial Company with a Proven Record of Success Driven by the Hillenbrand Operating Model
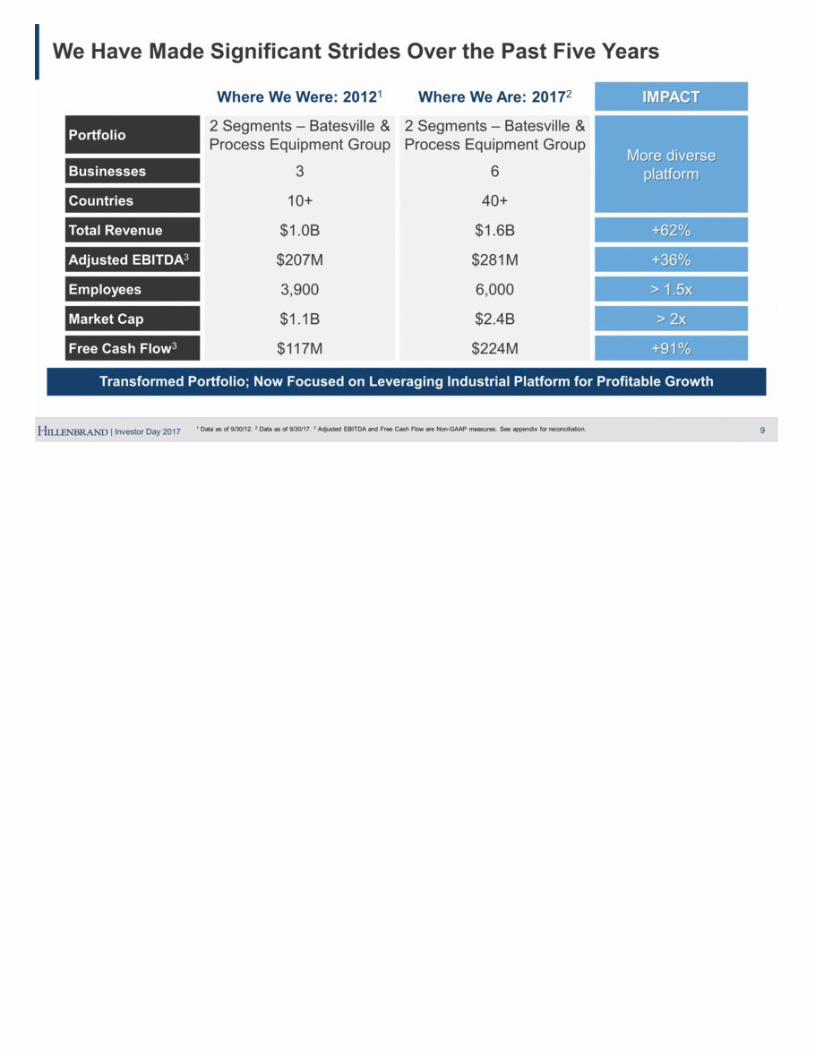
9 Transformed Portfolio; Now Focused on Leveraging Industrial Platform for Profitable Growth We Have Made Significant Strides Over the Past Five Years Where We Were: 20121 Where We Are: 20172 IMPACT Portfolio 2 Segments – Batesville & Process Equipment Group 2 Segments – Batesville & Process Equipment Group More diverse platform Businesses 3 6 Countries 10+ 40+ Total Revenue $1.0B $1.6B +62% Adjusted EBITDA3 $207M $281M +36% Employees 3,900 6,000 > 1.5x Market Cap $1.1B $2.4B > 2x Free Cash Flow3 $117M $224M +91% 1 Data as of 9/30/12. 2 Data as of 9/30/17. 3 Adjusted EBITDA and Free Cash Flow are Non-GAAP measures. See appendix for reconciliation.
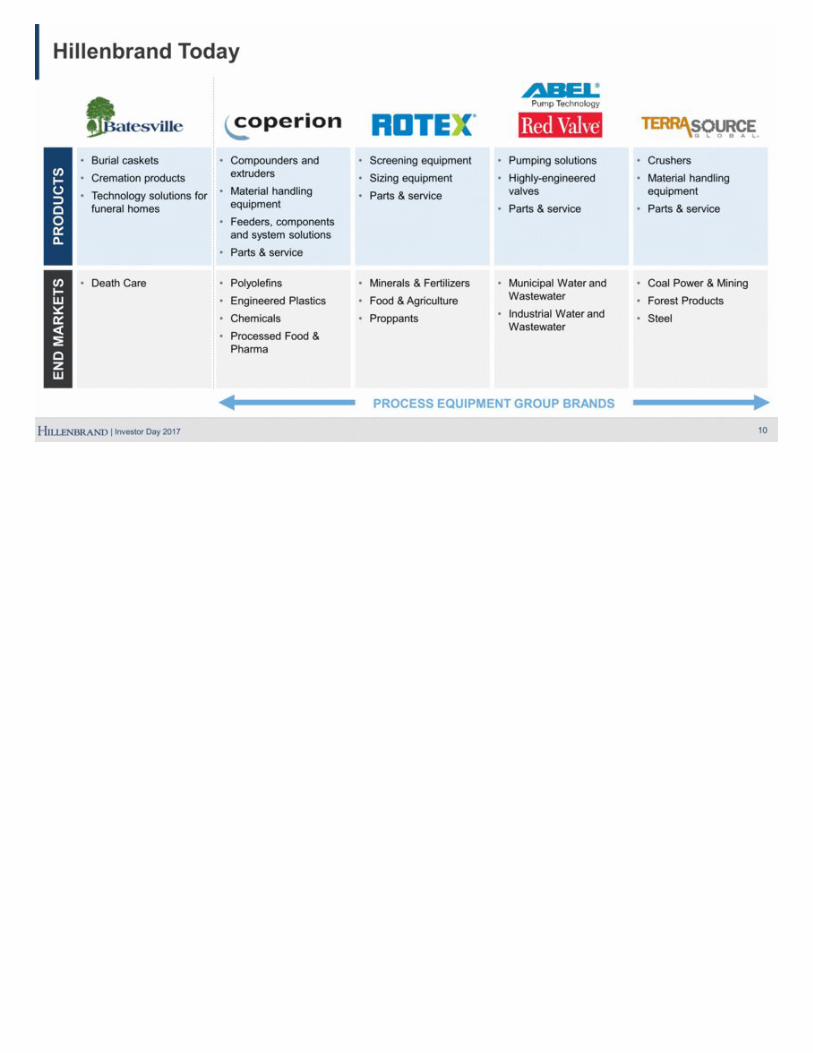
10 Hillenbrand Today PROCESS EQUIPMENT GROUP BRANDS PRODUCTS Burial caskets Cremation products Technology solutions for funeral homes Compounders and extruders Material handling equipment Feeders, components and system solutions Parts & service Screening equipment Sizing equipment Parts & service Pumping solutions Highly-engineered valves Parts & service Crushers Material handling equipment Parts & service END MARKETS Death Care Polyolefins Engineered Plastics Chemicals Processed Food & Pharma Minerals & Fertilizers Food & Agriculture Proppants Municipal Water and Wastewater Industrial Water and Wastewater Coal Power & Mining Forest Products Steel
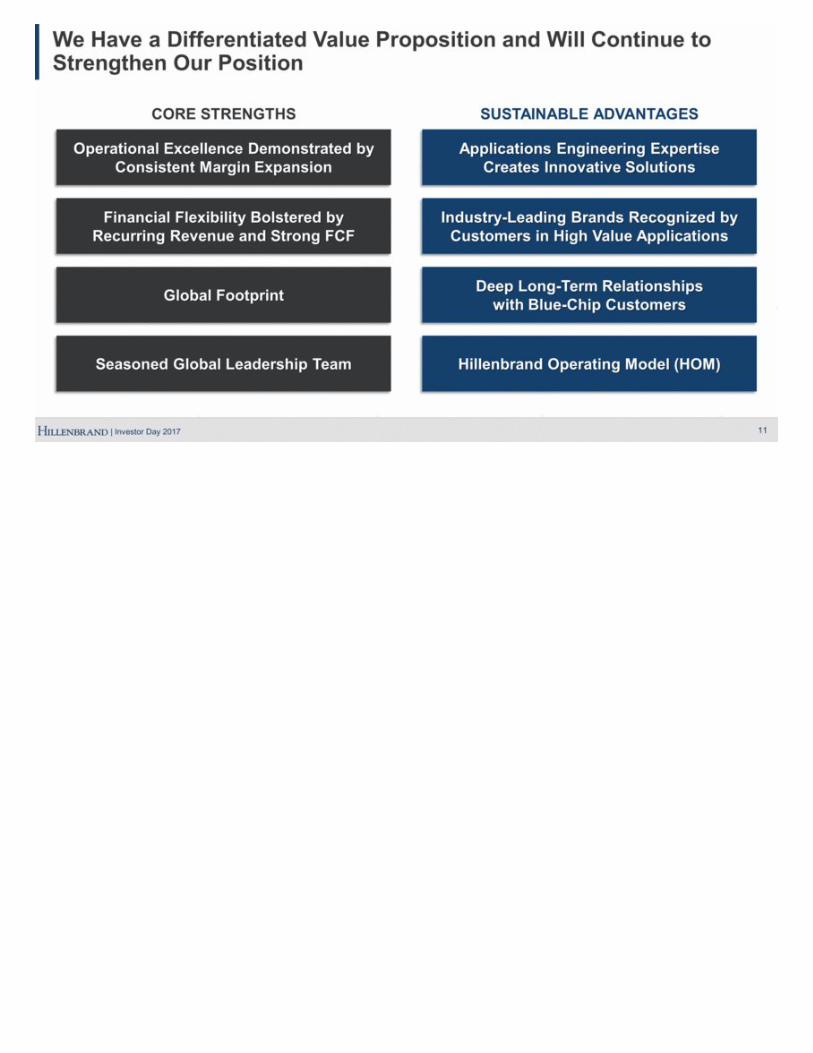
11 We Have a Differentiated Value Proposition and Will Continue to Strengthen Our Position CORE STRENGTHS Operational Excellence Demonstrated by Consistent Margin Expansion Applications Engineering Expertise Creates Innovative Solutions Financial Flexibility Bolstered by Recurring Revenue and Strong FCF Industry-Leading Brands Recognized by Customers in High Value Applications Global Footprint Deep Long-Term Relationships with Blue-Chip Customers Seasoned Global Leadership Team Hillenbrand Operating Model (HOM) SUSTAINABLE ADVANTAGES
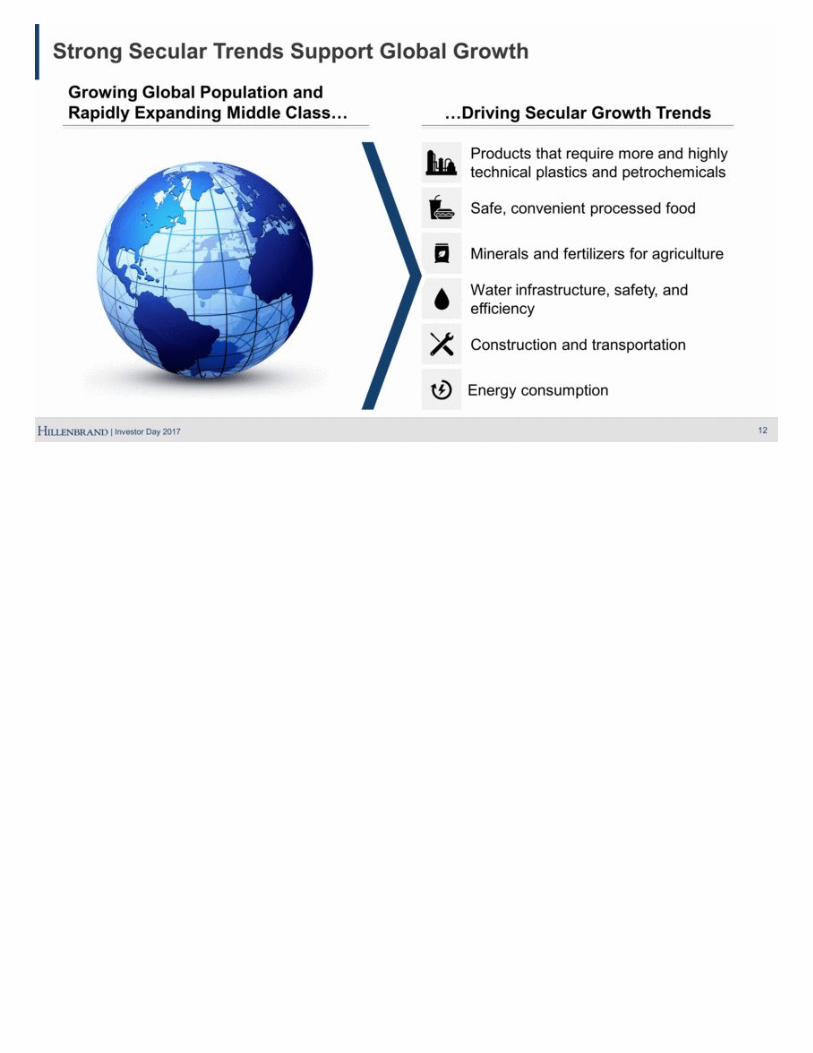
12 Strong Secular Trends Support Global Growth Growing Global Population and Rapidly Expanding Middle Class Driving Secular Growth Trends Energy consumption Products that require more and highly technical plastics and petrochemicals Safe, convenient processed food Minerals and fertilizers for agriculture Water infrastructure, safety, and efficiency Construction and transportation
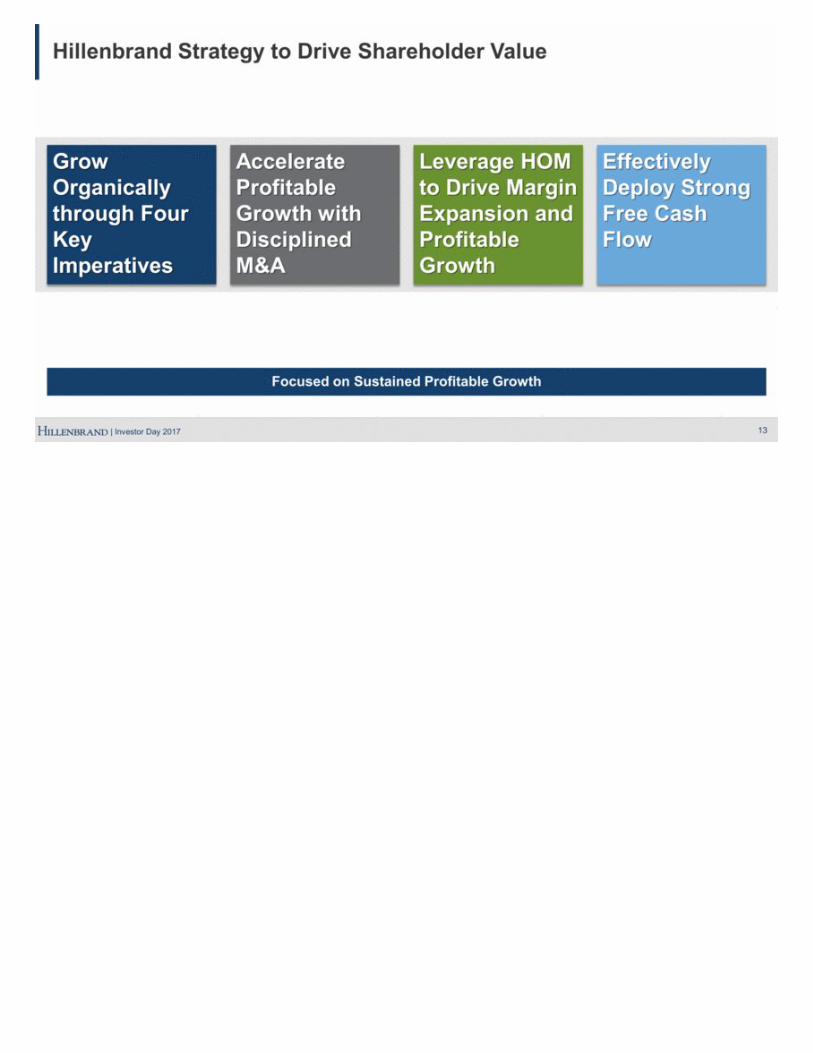
13 Focused on Sustained Profitable Growth Hillenbrand Strategy to Drive Shareholder Value Accelerate Profitable Growth with Disciplined M&A Leverage HOM to Drive Margin Expansion and Profitable Growth Effectively Deploy Strong Free Cash Flow Grow Organically through Four Key Imperatives
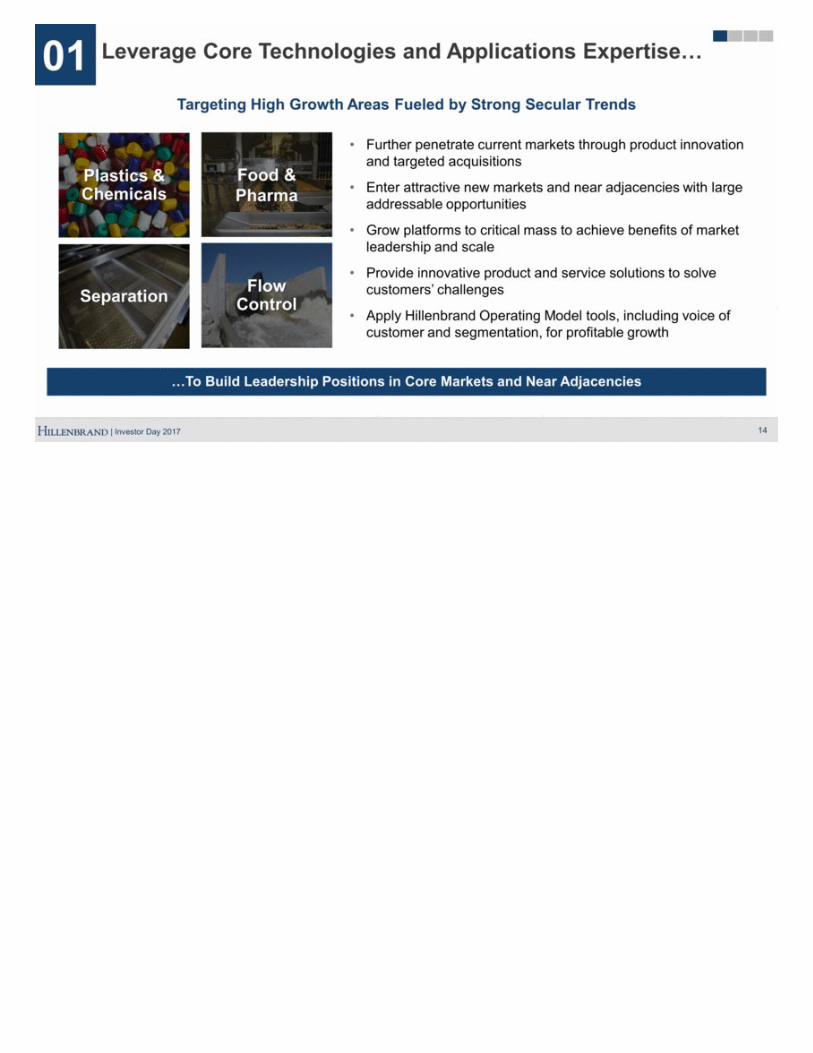
14 Leverage Core Technologies and Applications Expertise Further penetrate current markets through product innovation and targeted acquisitions Enter attractive new markets and near adjacencies with large addressable opportunities Grow platforms to critical mass to achieve benefits of market leadership and scale Provide innovative product and service solutions to solve customers’ challenges Apply Hillenbrand Operating Model tools, including voice of customer and segmentation, for profitable growth 01 Targeting High Growth Areas Fueled by Strong Secular Trends Separation Flow Control Food & Pharma Plastics & Chemicals To Build Leadership Positions in Core Markets and Near Adjacencies
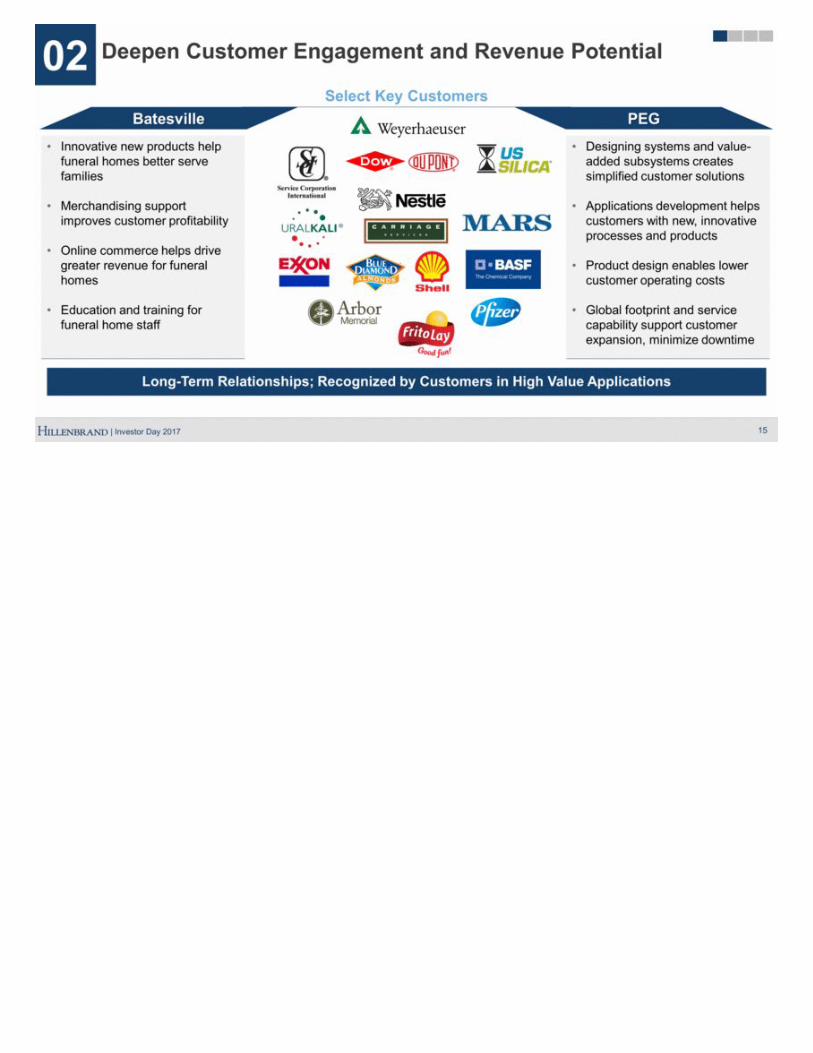
15 Long-Term Relationships; Recognized by Customers in High Value Applications Deepen Customer Engagement and Revenue Potential Innovative new products help funeral homes better serve families Merchandising support improves customer profitability Online commerce helps drive greater revenue for funeral homes Education and training for funeral home staff Select Key Customers Designing systems and value-added subsystems creates simplified customer solutions Applications development helps customers with new, innovative processes and products Product design enables lower customer operating costs Global footprint and service capability support customer expansion, minimize downtime 02 Batesville PEG
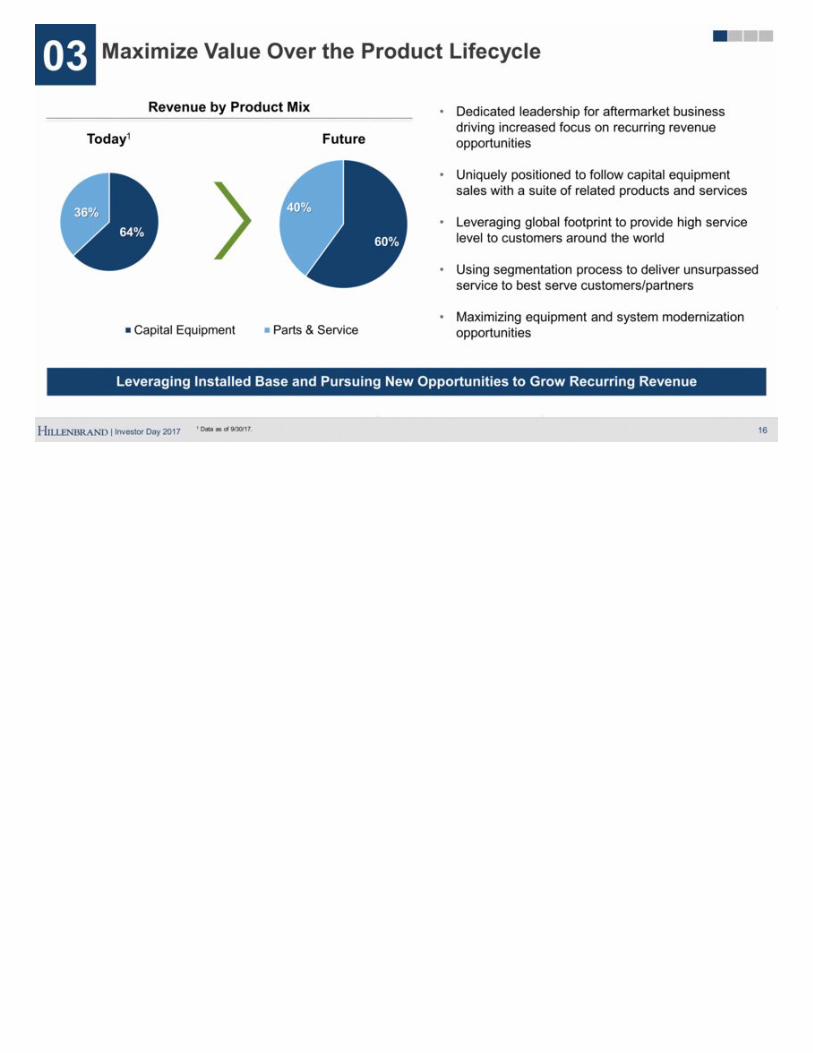
16 Leveraging Installed Base and Pursuing New Opportunities to Grow Recurring Revenue Maximize Value Over the Product Lifecycle Dedicated leadership for aftermarket business driving increased focus on recurring revenue opportunities Uniquely positioned to follow capital equipment sales with a suite of related products and services Leveraging global footprint to provide high service level to customers around the world Using segmentation process to deliver unsurpassed service to best serve customers/partners Maximizing equipment and system modernization opportunities 03 Revenue by Product Mix Today1 Future 1 Data as of 9/30/17. 64% 36% 60% 40% Capital Equipment Parts & Service
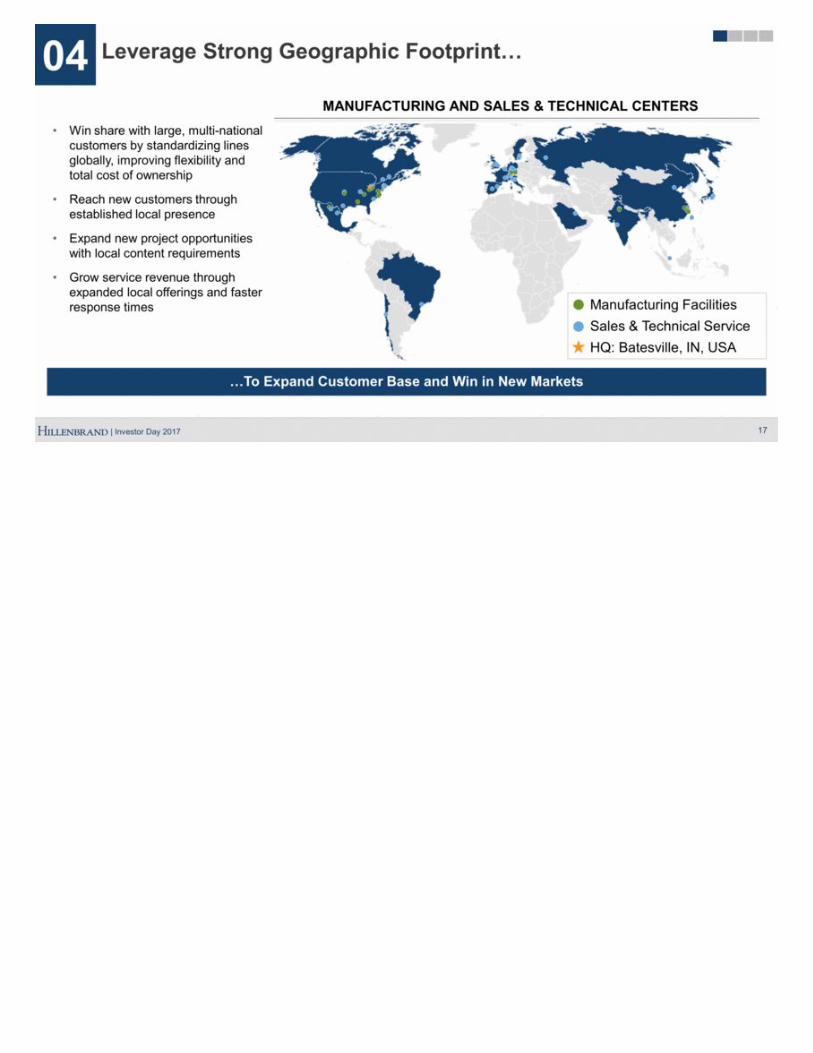
17 Leverage Strong Geographic Footprint 04 Win share with large, multi-national customers by standardizing lines globally, improving flexibility and total cost of ownership Reach new customers through established local presence Expand new project opportunities with local content requirements Grow service revenue through expanded local offerings and faster response times MANUFACTURING AND SALES & TECHNICAL CENTERS Manufacturing Facilities Sales & Technical Service HQ: Batesville, IN, USA To Expand Customer Base and Win in New Markets
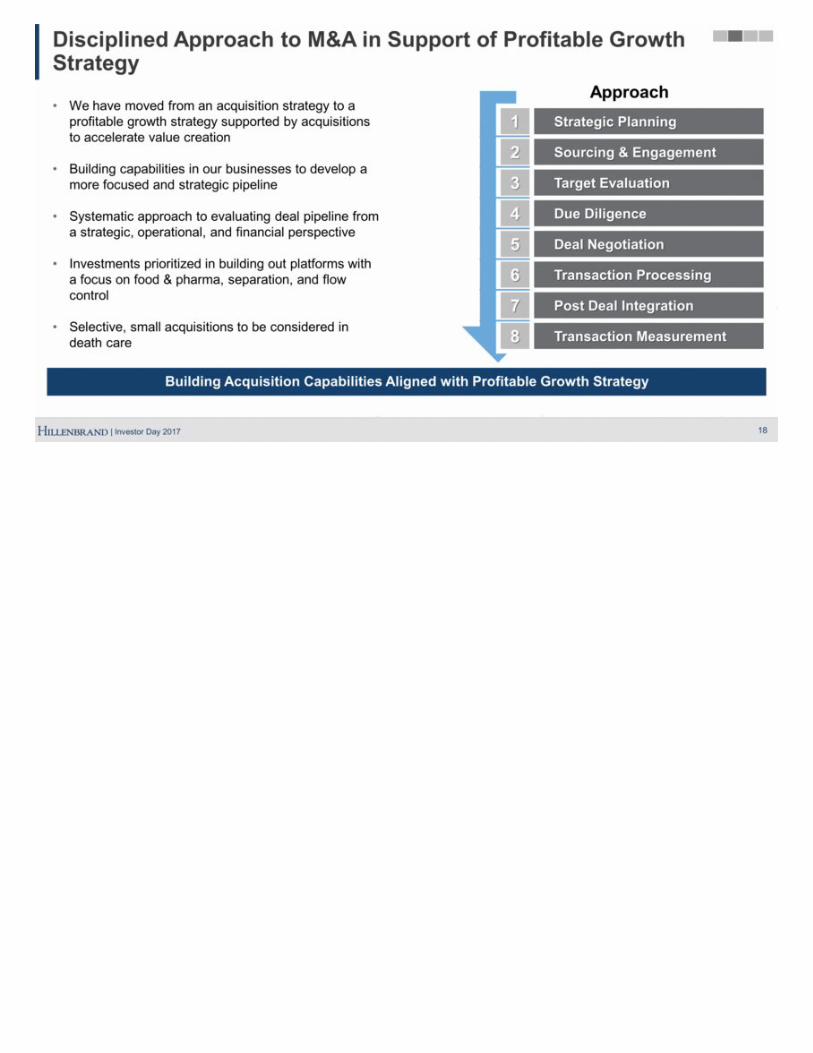
18 Building Acquisition Capabilities Aligned with Profitable Growth Strategy Disciplined Approach to M&A in Support of Profitable Growth Strategy We have moved from an acquisition strategy to a profitable growth strategy supported by acquisitions to accelerate value creation Building capabilities in our businesses to develop a more focused and strategic pipeline Systematic approach to evaluating deal pipeline from a strategic, operational, and financial perspective Investments prioritized in building out platforms with a focus on food & pharma, separation, and flow control Selective, small acquisitions to be considered in death care Approach 1 Strategic Planning 2 Sourcing & Engagement 3 Target Evaluation 4 Due Diligence 5 Deal Negotiation 6 Transaction Processing 7 Post Deal Integration 8 Transaction Measurement
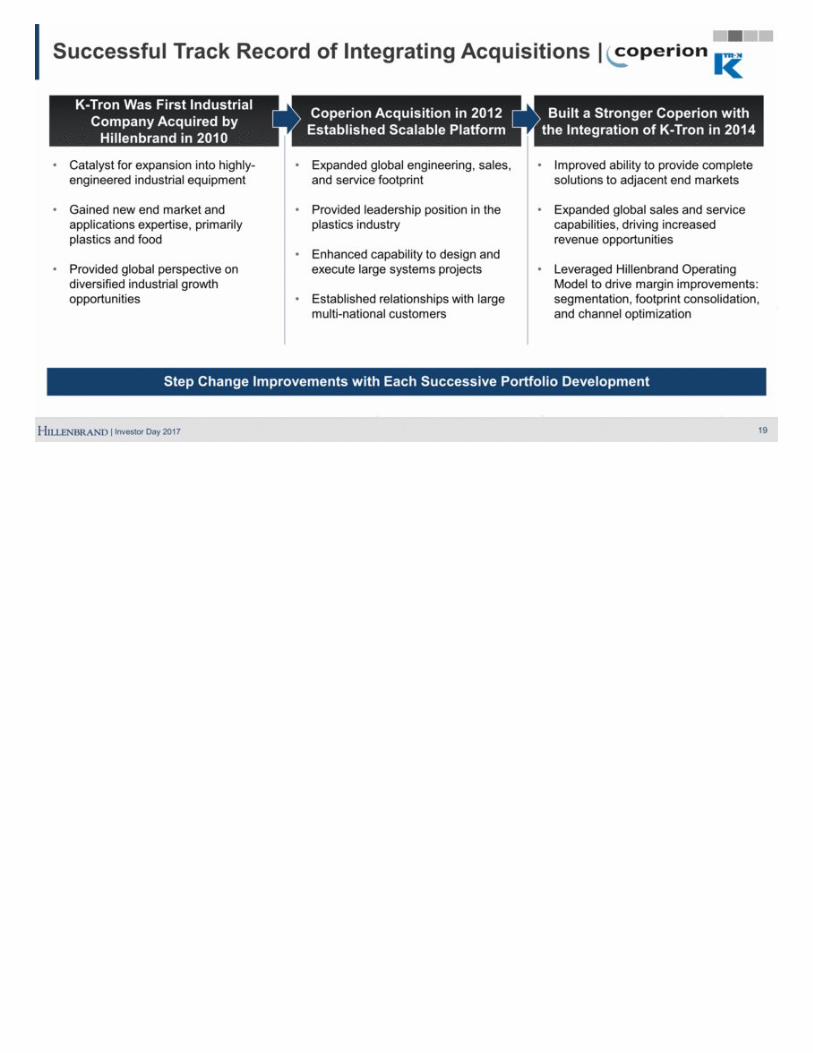
19 Step Change Improvements with Each Successive Portfolio Development Successful Track Record of Integrating Acquisitions K-Tron Was First Industrial Company Acquired by Hillenbrand in 2010 Catalyst for expansion into highly-engineered industrial equipment Gained new end market and applications expertise, primarily plastics and food Provided global perspective on diversified industrial growth opportunities Coperion Acquisition in 2012 Established Scalable Platform Expanded global engineering, sales, and service footprint Provided leadership position in the plastics industry Enhanced capability to design and execute large systems projects Established relationships with large multi-national customers Built a Stronger Coperion with the Integration of K-Tron in 2014 Improved ability to provide complete solutions to adjacent end markets Expanded global sales and service capabilities, driving increased revenue opportunities Leveraged Hillenbrand Operating Model to drive margin improvements: segmentation, footprint consolidation, and channel optimization
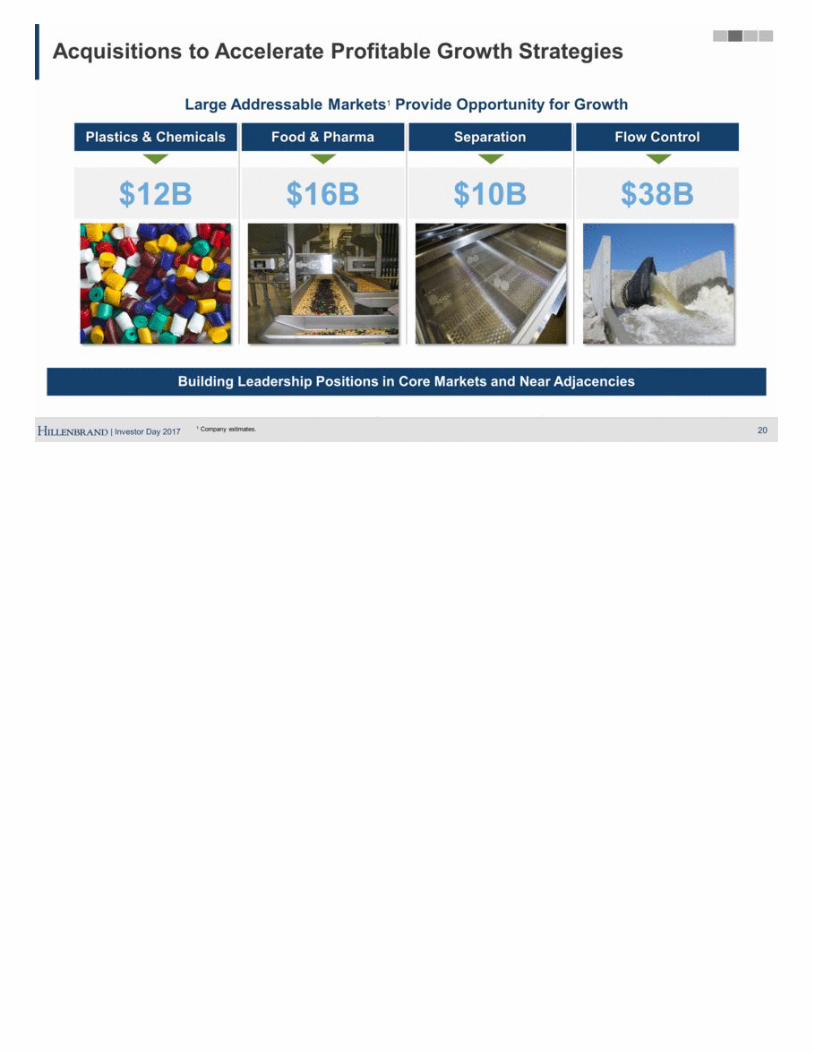
20 Building Leadership Positions in Core Markets and Near Adjacencies Acquisitions to Accelerate Profitable Growth Strategies Large Addressable Markets1 Provide Opportunity for Growth Plastics & Chemicals Food & Pharma Separation Flow Control $12B $16B $10B $38B 1 Company estimates.
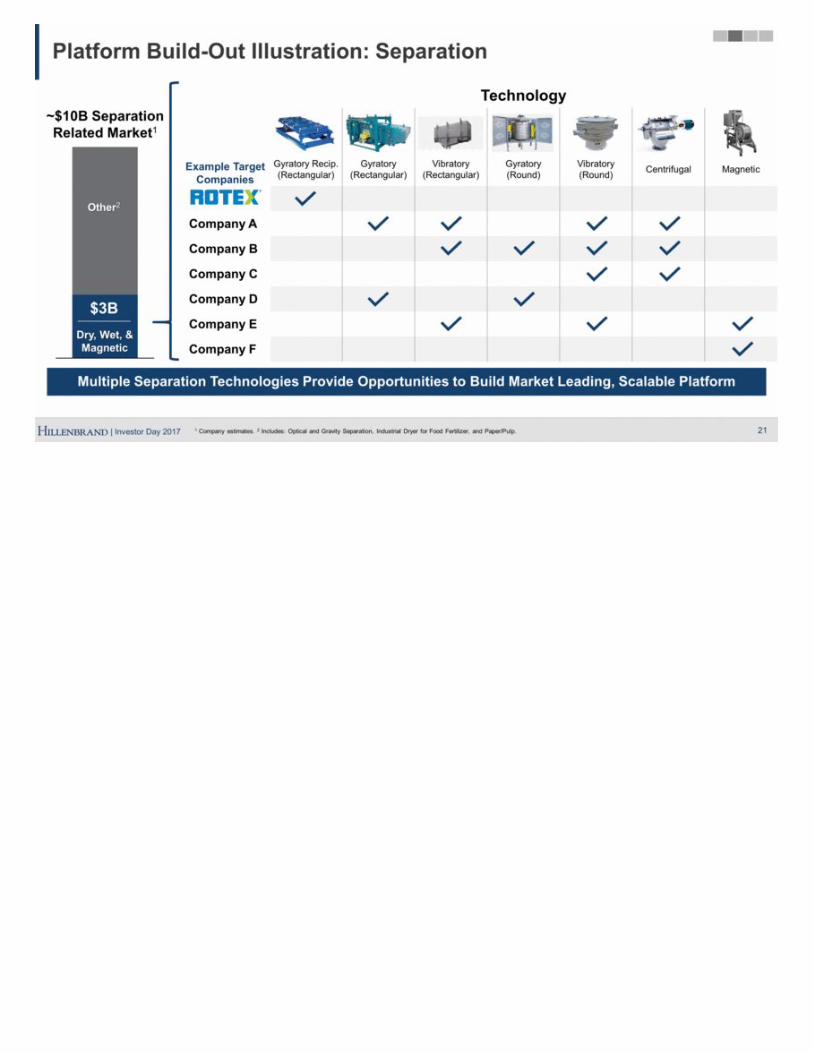
21 Multiple Separation Technologies Provide Opportunities to Build Market Leading, Scalable Platform Platform Build-Out Illustration: Separation Example Target Companies Gyratory Recip. (Rectangular) Gyratory (Rectangular) Vibratory (Rectangular) Gyratory (Round) Vibratory (Round) Centrifugal Magnetic Company A Company B Company C Company D Company E Company F Technology ~$10B Separation Related Market1 Other2 Dry, Wet, & Magnetic $3B 1 Company estimates. 2 Includes: Optical and Gravity Separation, Industrial Dryer for Food Fertilizer, and Paper/Pulp. Category 1
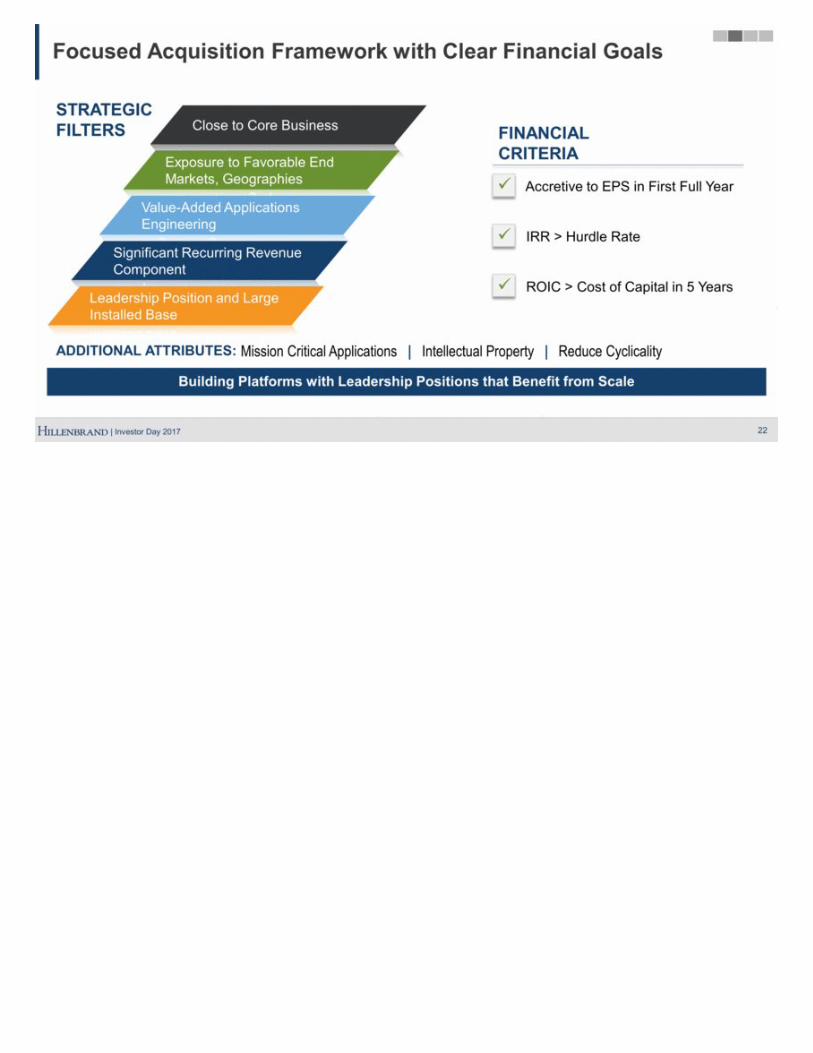
22 Building Platforms with Leadership Positions that Benefit from Scale Focused Acquisition Framework with Clear Financial Goals ADDITIONAL ATTRIBUTES: Mission Critical Applications Intellectual Property Reduce Cyclicality FINANCIAL CRITERIA STRATEGIC FILTERS Accretive to EPS in First Full Year IRR > Hurdle Rate ROIC > Cost of Capital in 5 Years Close to Core Business Exposure to Favorable End Markets, Geographies Value-Added Applications Engineering Significant Recurring Revenue Component Leadership Position and Large Installed Base
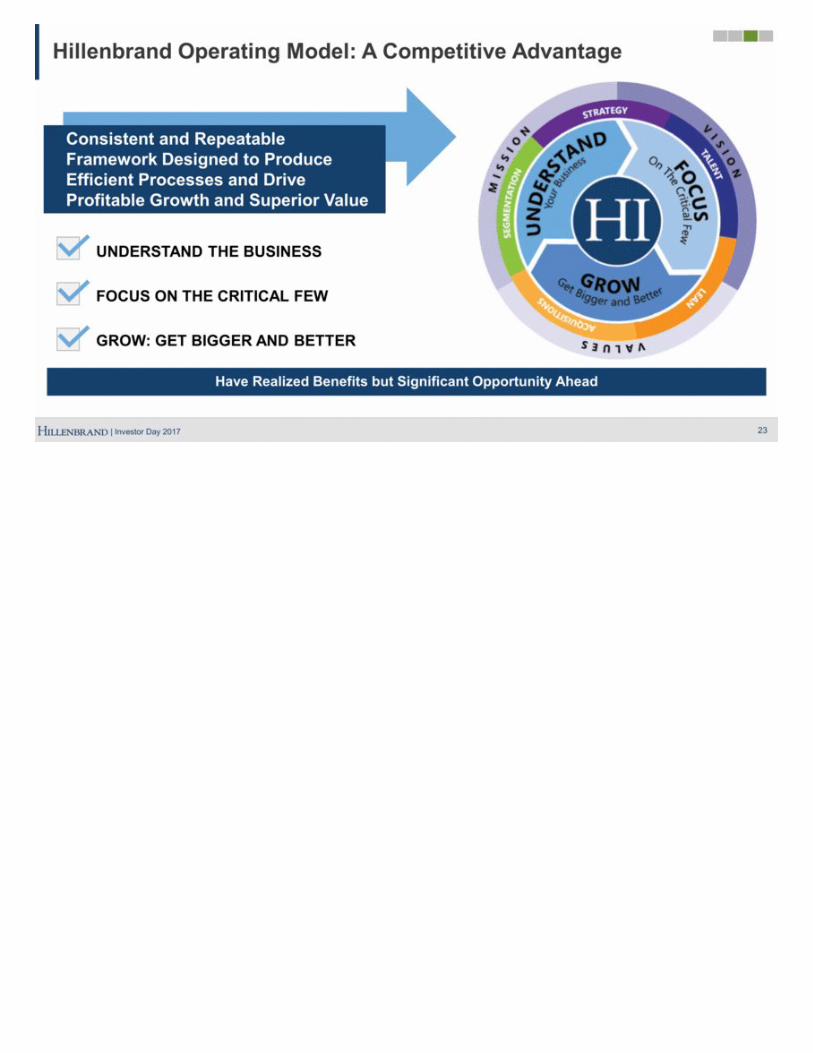
23 Have Realized Benefits but Significant Opportunity Ahead Hillenbrand Operating Model: A Competitive Advantage UNDERSTAND THE BUSINESS FOCUS ON THE CRITICAL FEW GROW: GET BIGGER AND BETTER Consistent and Repeatable Framework Designed to Produce Efficient Processes and Drive Profitable Growth and Superior Value
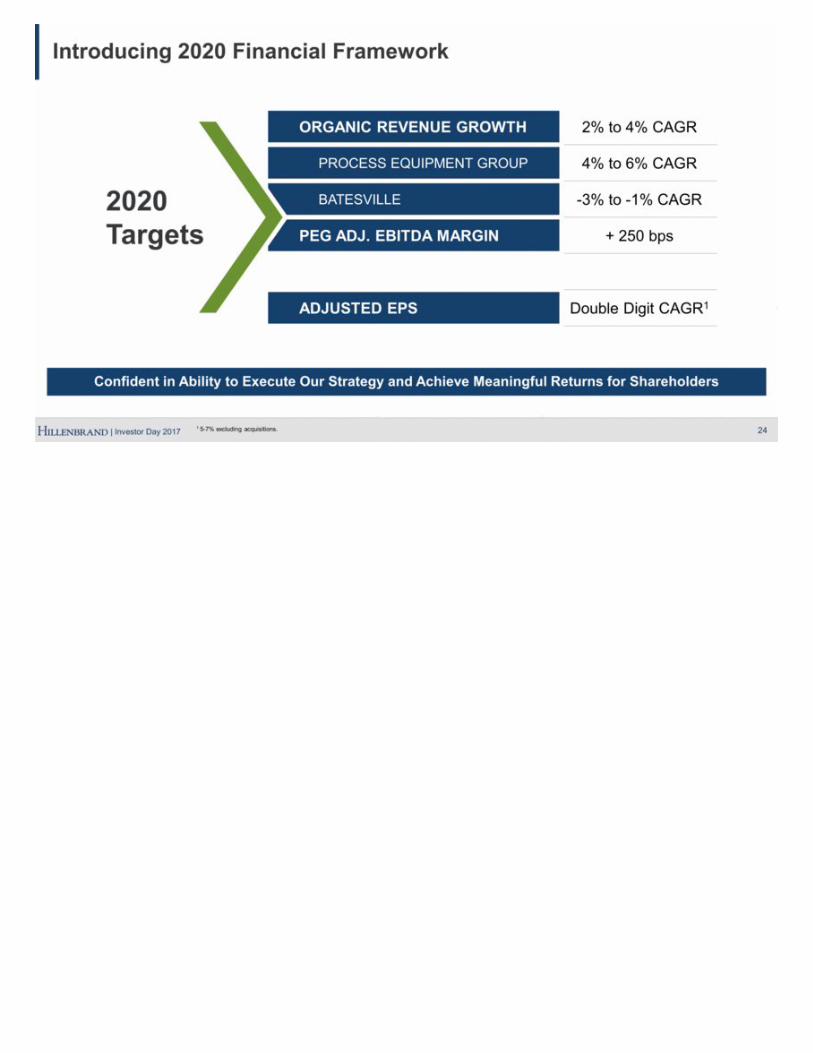
24 Confident in Ability to Execute Our Strategy and Achieve Meaningful Returns for Shareholders Introducing 2020 Financial Framework ORGANIC REVENUE GROWTH 2% to 4% CAGR PROCESS EQUIPMENT GROUP 4% to 6% CAGR BATESVILLE -3% to -1% CAGR PEG ADJ. EBITDA MARGIN + 250 bps ADJUSTED EPS Double Digit CAGR1 2020 Targets 1 5-7% excluding acquisitions.
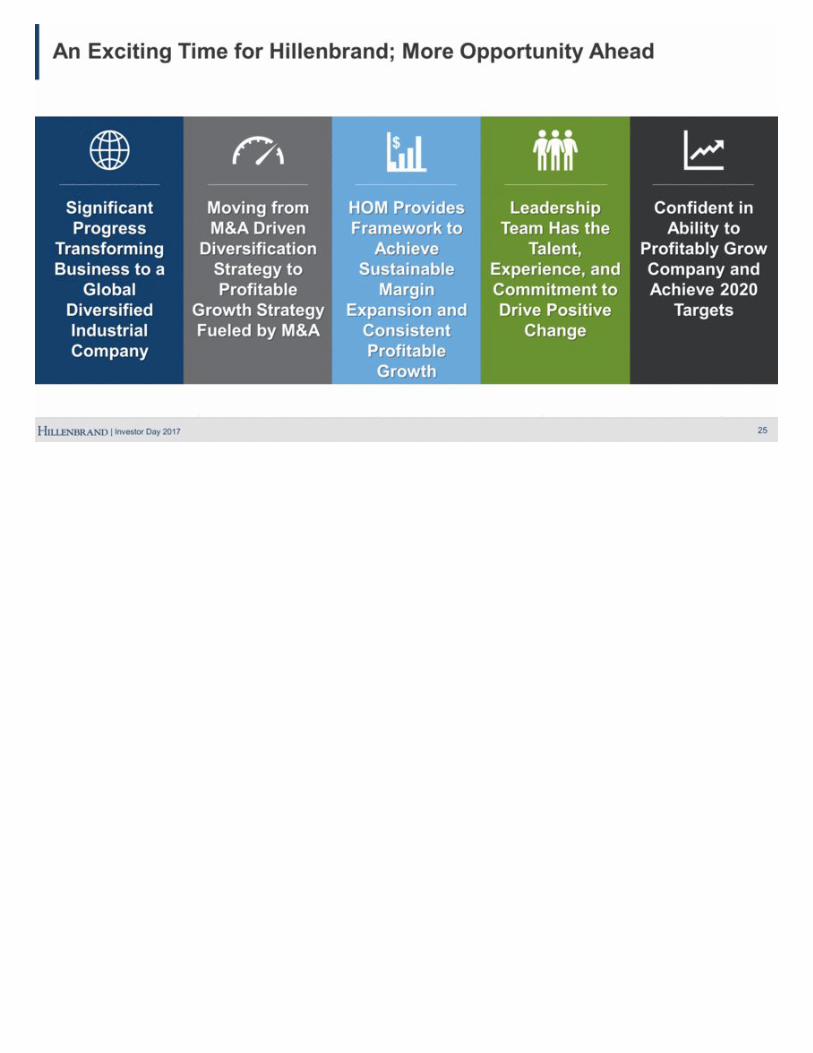
An Exciting Time for Hillenbrand; More Opportunity Ahead 25 Moving from M&A Driven Diversification Strategy to Profitable Growth Strategy Fueled by M&A HOM Provides Framework to Achieve Sustainable Margin Expansion and Consistent Profitable Growth Confident in Ability to Profitably Grow Company and Achieve 2020 Targets Leadership Team Has the Talent, Experience, and Commitment to Drive Positive Change Significant Progress Transforming Business to a Global Diversified Industrial Company $
Hillenbrand Operating Model Jim Hooven VP, Hillenbrand Operating Model
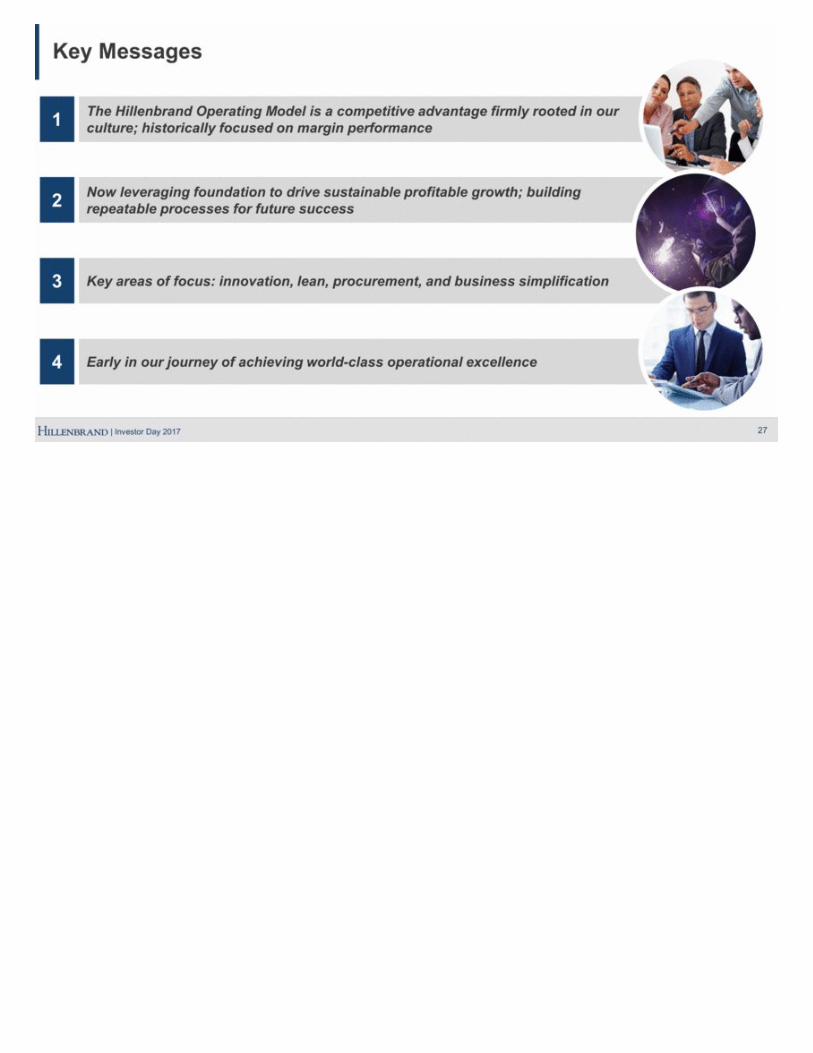
The Hillenbrand Operating Model is a competitive advantage firmly rooted in our culture; historically focused on margin performance 1 Key Messages 27 Now leveraging foundation to drive sustainable profitable growth; building repeatable processes for future success 2 Key areas of focus: innovation, lean, procurement, and business simplification 3 Early in our journey of achieving world-class operational excellence 4
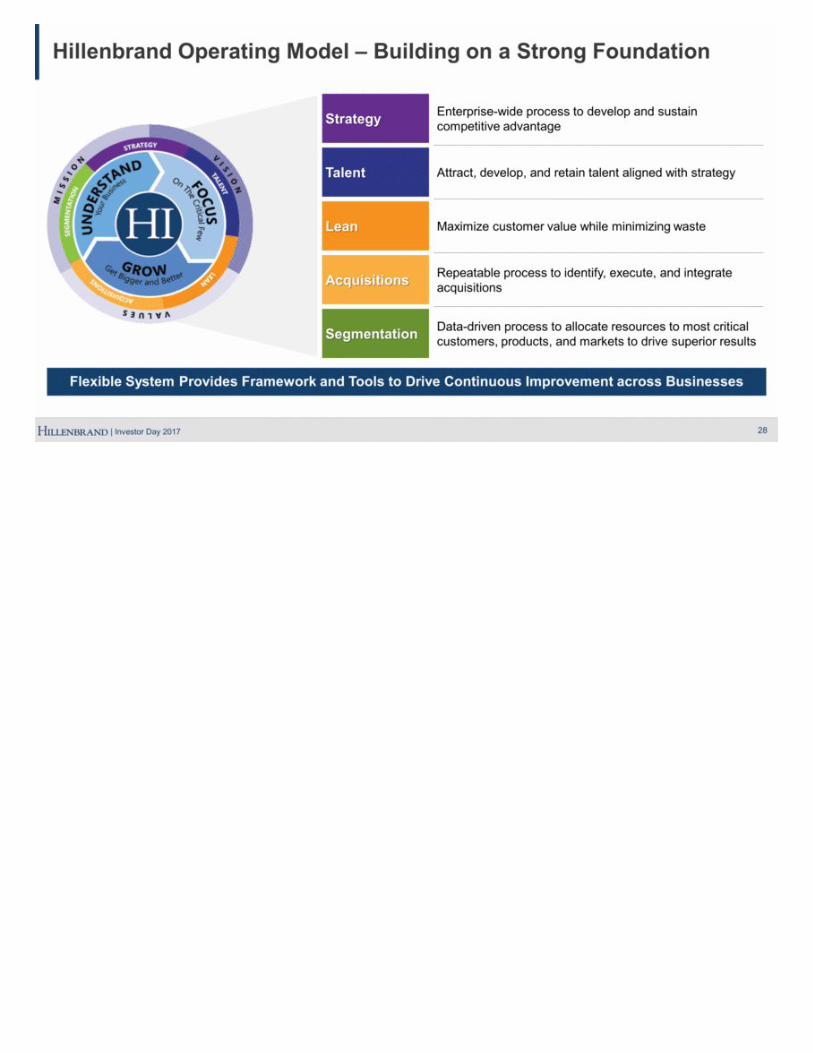
28 Flexible System Provides Framework and Tools to Drive Continuous Improvement across Businesses Hillenbrand Operating Model – Building on a Strong Foundation Strategy Enterprise-wide process to develop and sustain competitive advantage Talent Attract, develop, and retain talent aligned with strategy Lean Maximize customer value while minimizing waste Acquisitions Repeatable process to identify, execute, and integrate acquisitions Segmentation Data-driven process to allocate resources to most critical customers, products, and markets to drive superior results
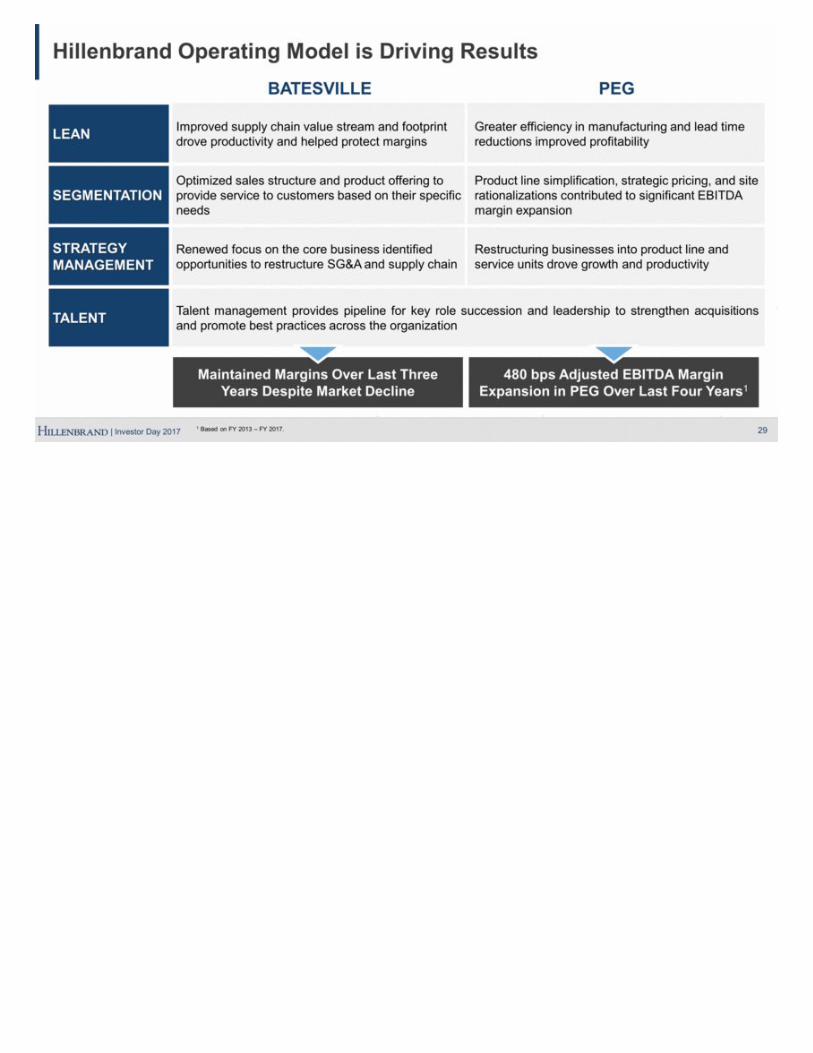
29 Hillenbrand Operating Model is Driving Results BATESVILLE PEG LEAN Improved supply chain value stream and footprint drove productivity and helped protect margins Greater efficiency in manufacturing and lead time reductions improved profitability SEGMENTATION Optimized sales structure and product offering to provide service to customers based on their specific needs Product line simplification, strategic pricing, and site rationalizations contributed to significant EBITDA margin expansion STRATEGY MANAGEMENT Renewed focus on the core business identified opportunities to restructure SG&A and supply chain Restructuring businesses into product line and service units drove growth and productivity TALENT Talent management provides pipeline for key role succession and leadership to strengthen acquisitions and promote best practices across the organization Maintained Margins Over Last Three Years Despite Market Decline 480 bps Adjusted EBITDA Margin Expansion in PEG Over Last Four Years1 1 Based on FY 2013 – FY 2017.
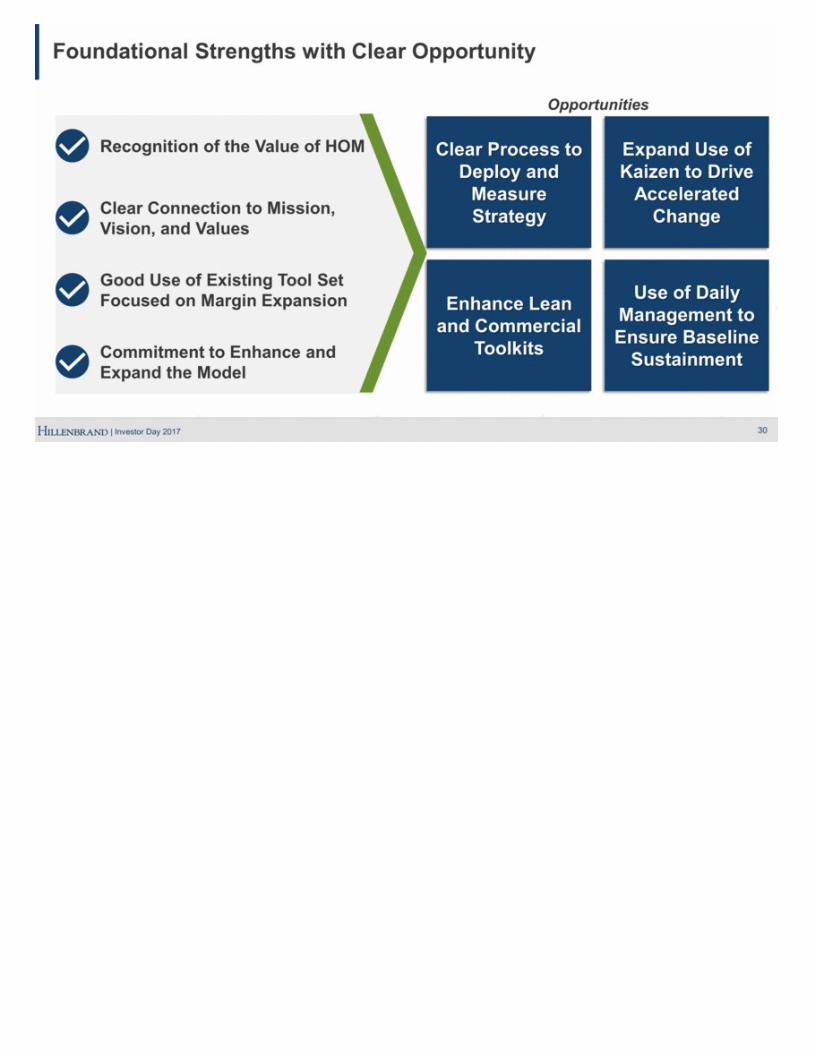
30 Foundational Strengths with Clear Opportunity Clear Process to Deploy and Measure Strategy Expand Use of Kaizen to Drive Accelerated Change Enhance Lean and Commercial Toolkits Use of Daily Management to Ensure Baseline Sustainment Commitment to Enhance and Expand the Model Good Use of Existing Tool Set Focused on Margin Expansion Clear Connection to Mission, Vision, and Values Recognition of the Value of HOM Opportunities
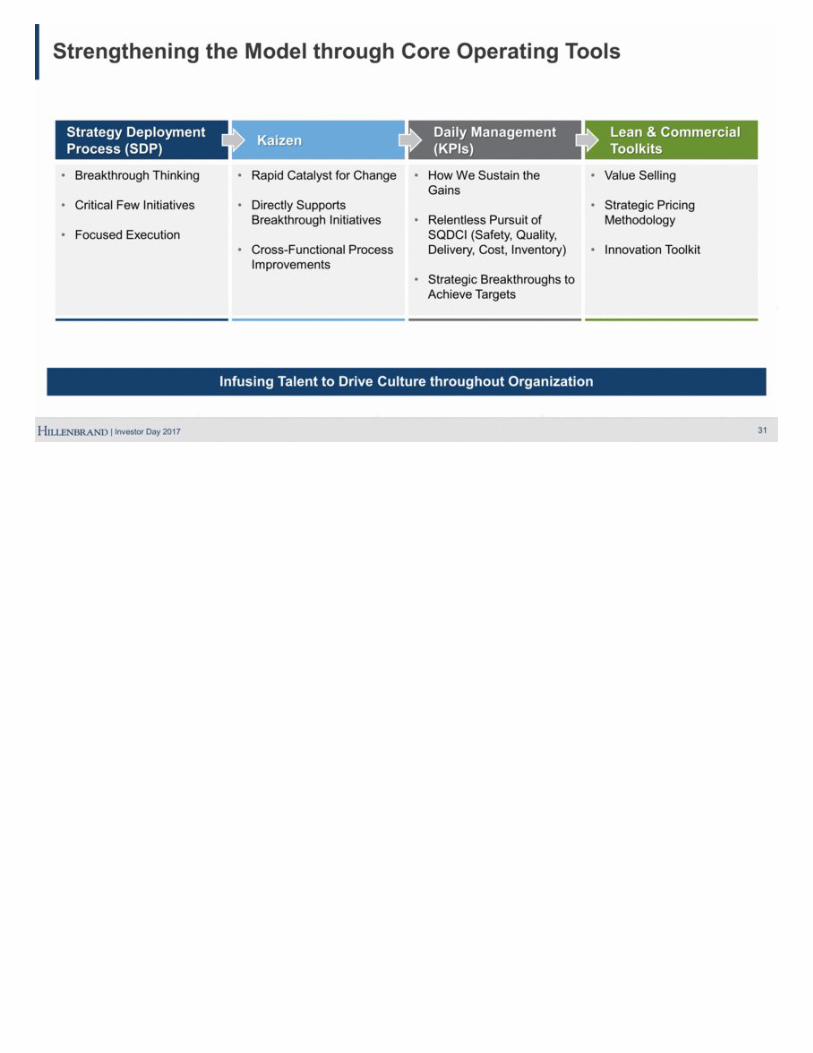
31 Infusing Talent to Drive Culture throughout Organization Strengthening the Model through Core Operating Tools Strategy Deployment Process (SDP) Kaizen Daily Management (KPIs) Lean & Commercial Toolkits Breakthrough Thinking Critical Few Initiatives Focused Execution Rapid Catalyst for Change Directly Supports Breakthrough Initiatives Cross-Functional Process Improvements How We Sustain the Gains Relentless Pursuit of SQDCI (Safety, Quality, Delivery, Cost, Inventory) Strategic Breakthroughs to Achieve Targets Value Selling Strategic Pricing Methodology Innovation Toolkit
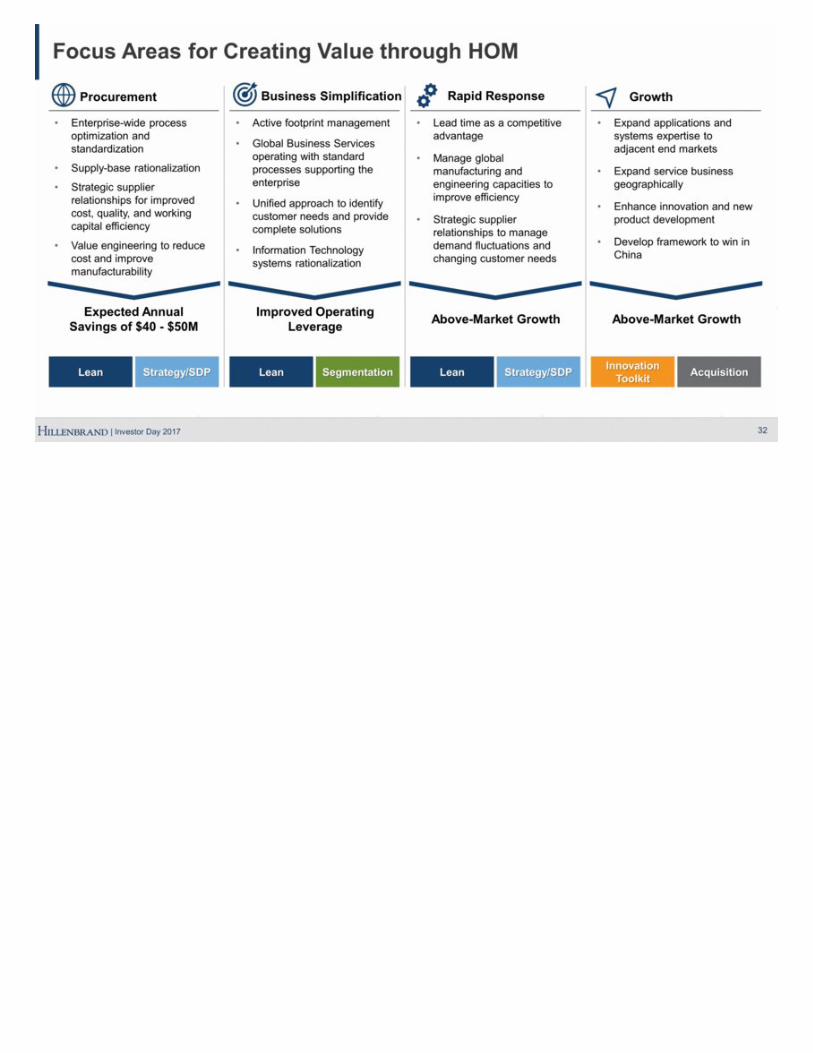
Enterprise-wide process optimization and standardization Supply-base rationalization Strategic supplier relationships for improved cost, quality, and working capital efficiency Value engineering to reduce cost and improve manufacturability Active footprint management Global Business Services operating with standard processes supporting the enterprise Unified approach to identify customer needs and provide complete solutions Information Technology systems rationalization Expand applications and systems expertise to adjacent end markets Expand service business geographically Enhance innovation and new product development Develop framework to win in China Lead time as a competitive advantage Manage global manufacturing and engineering capacities to improve efficiency Strategic supplier relationships to manage demand fluctuations and changing customer needs 32 Focus Areas for Creating Value through HOM Procurement Business Simplification Growth Rapid Response Expected Annual Savings of $40 - $50M Improved Operating Leverage Above-Market Growth Above-Market Growth Lean Strategy/SDP Lean Segmentation Lean Strategy/SDP Innovation Toolkit Acquisition
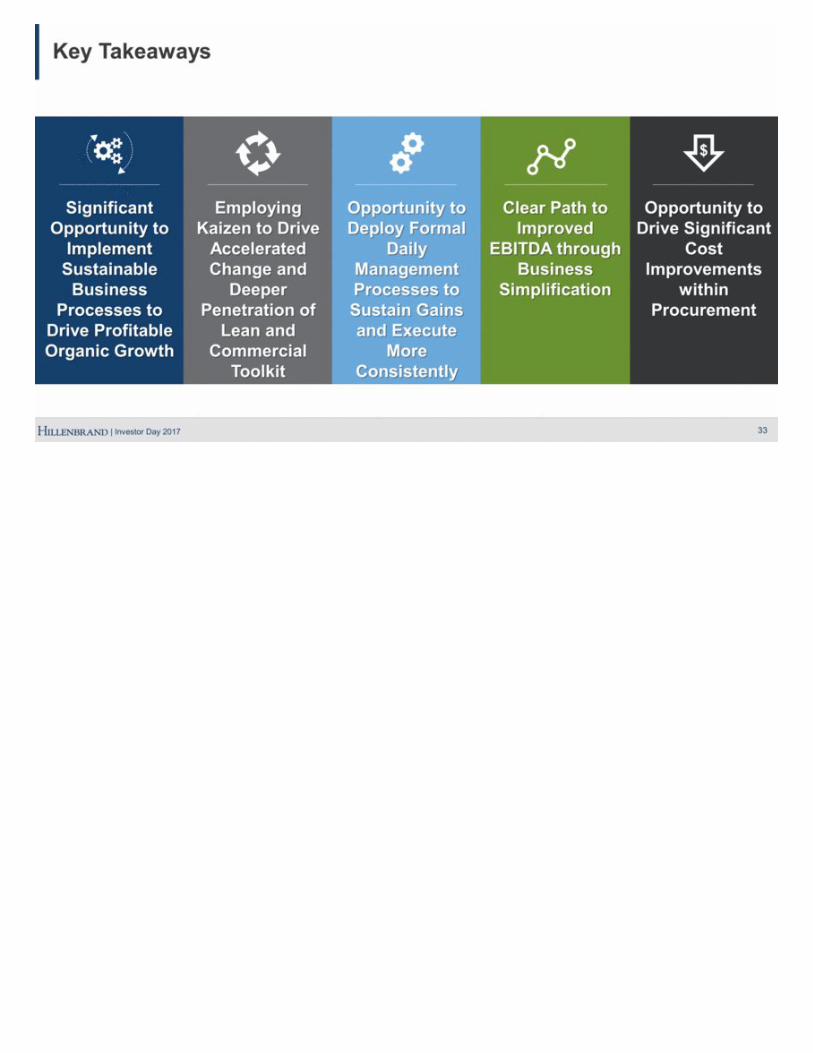
Key Takeaways 33 Employing Kaizen to Drive Accelerated Change and Deeper Penetration of Lean and Commercial Toolkit Opportunity to Deploy Formal Daily Management Processes to Sustain Gains and Execute More Consistently Opportunity to Drive Significant Cost Improvements within Procurement Clear Path to Improved EBITDA through Business Simplification Significant Opportunity to Implement Sustainable Business Processes to Drive Profitable Organic Growth $
Batesville Chris Trainor President
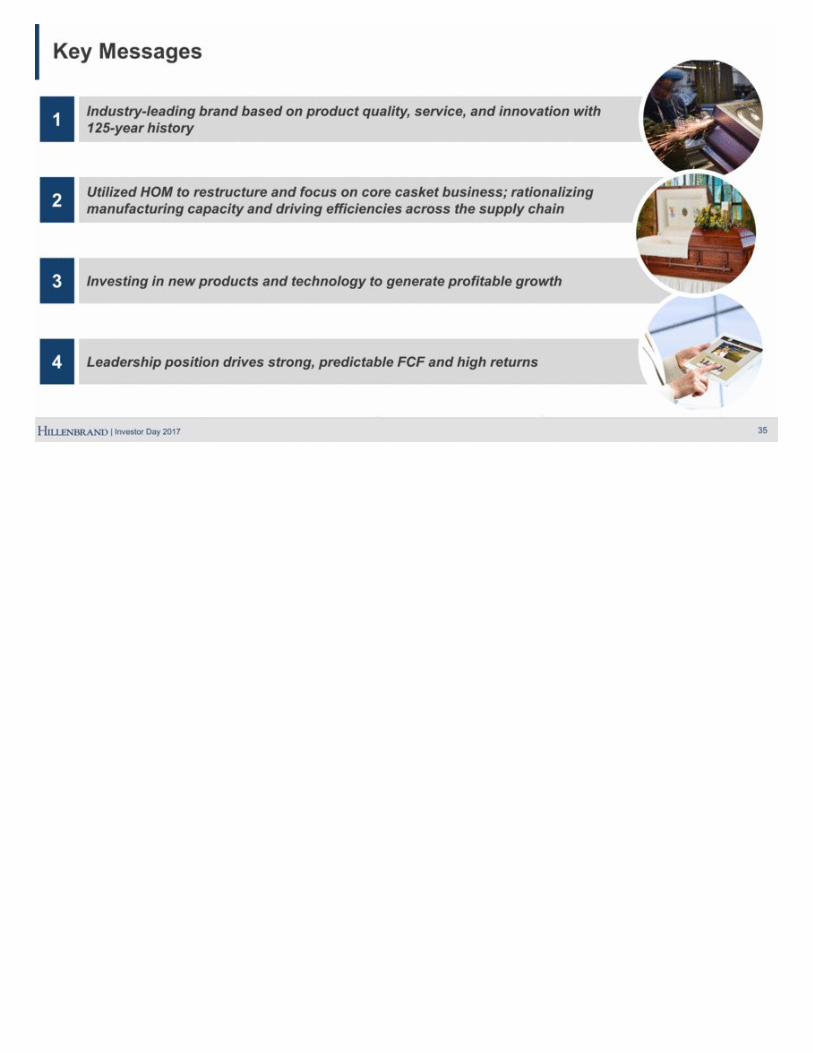
Key Messages 35 Industry-leading brand based on product quality, service, and innovation with 125-year history 1 Utilized HOM to restructure and focus on core casket business; rationalizing manufacturing capacity and driving efficiencies across the supply chain 2 Investing in new products and technology to generate profitable growth 3 Leadership position drives strong, predictable FCF and high returns 4
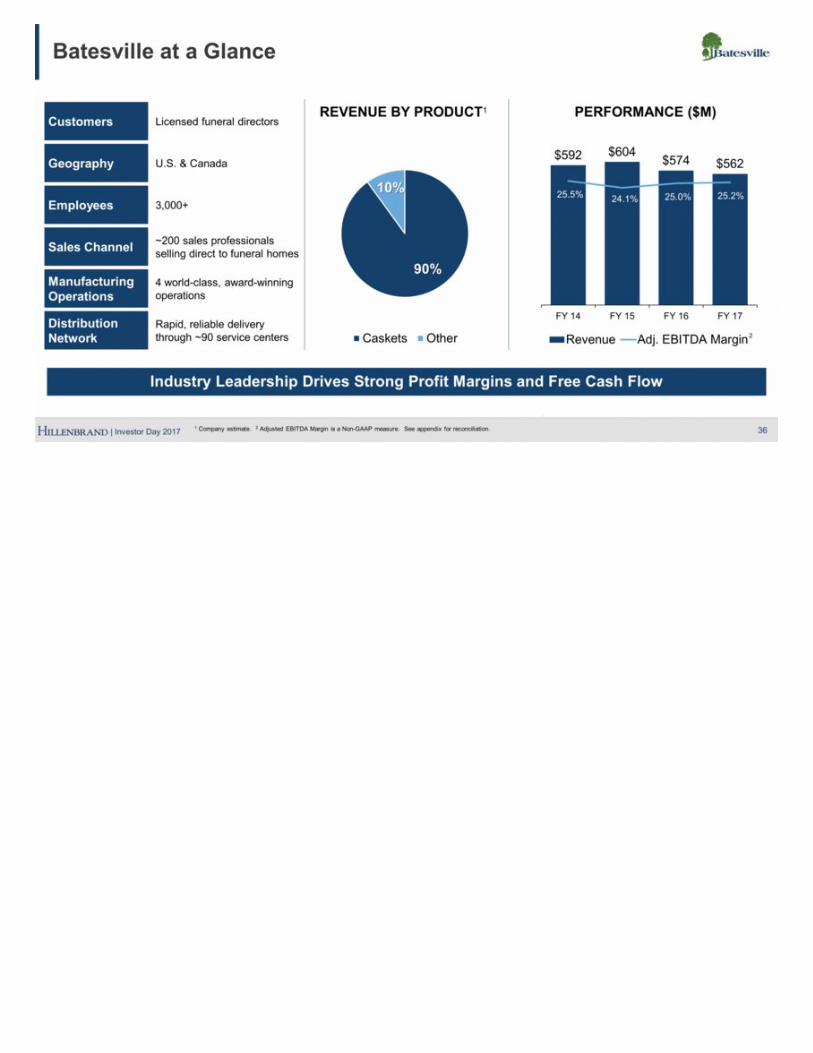
36 Industry Leadership Drives Strong Profit Margins and Free Cash Flow Batesville at a Glance PERFORMANCE ($M) REVENUE BY PRODUCT1 Customers Licensed funeral directors Geography U.S. & Canada Employees 3,000+ Sales Channel ~200 sales professionals selling direct to funeral homes Manufacturing Operations 4 world-class, award-winning operations Distribution Network Rapid, reliable delivery through ~90 service centers 2 1 Company estimate. 2 Adjusted EBITDA Margin is a Non-GAAP measure. See appendix for reconciliation.
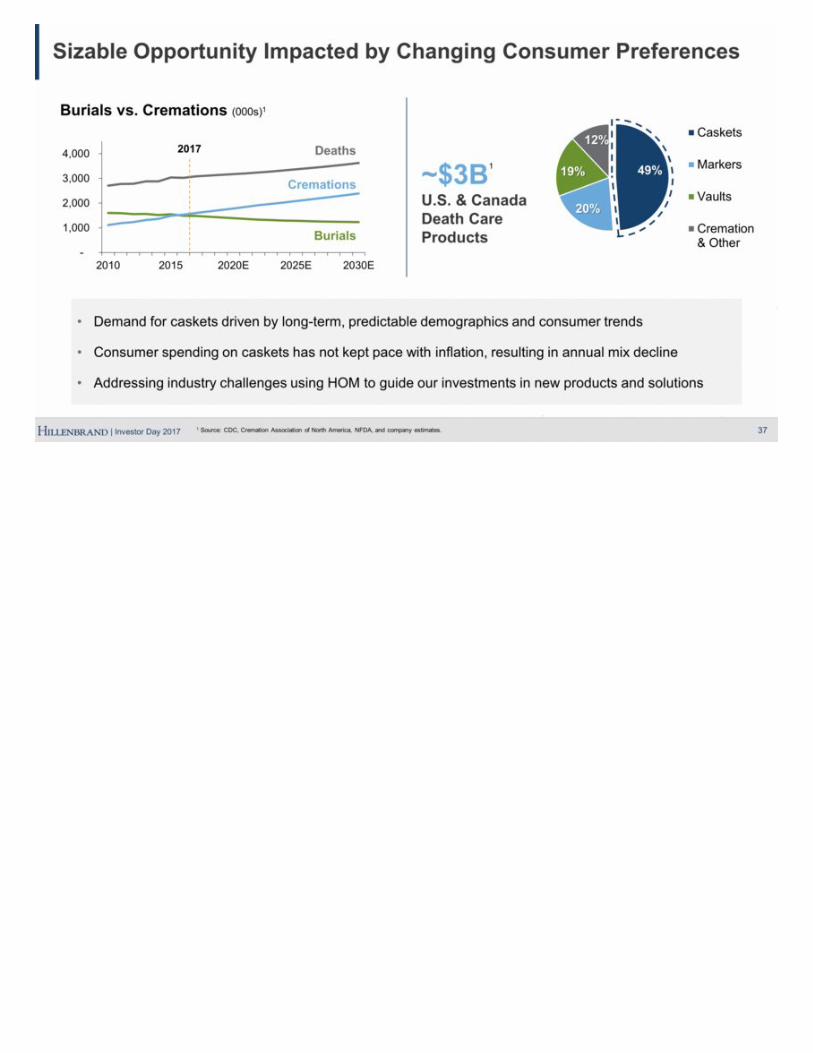
Sizable Opportunity Impacted by Changing Consumer Preferences 37 ~$3B U.S. & Canada Death Care Products Burials vs. Cremations (000s)1 Deaths Cremations Burials Demand for caskets driven by long-term, predictable demographics and consumer trends Consumer spending on caskets has not kept pace with inflation, resulting in annual mix decline Addressing industry challenges using HOM to guide our investments in new products and solutions 1 2017 1 Source: CDC, Cremation Association of North America, NFDA, and company estimates. 49% 20% 19% 12% Caskets Markers Vaults Cremation & Other
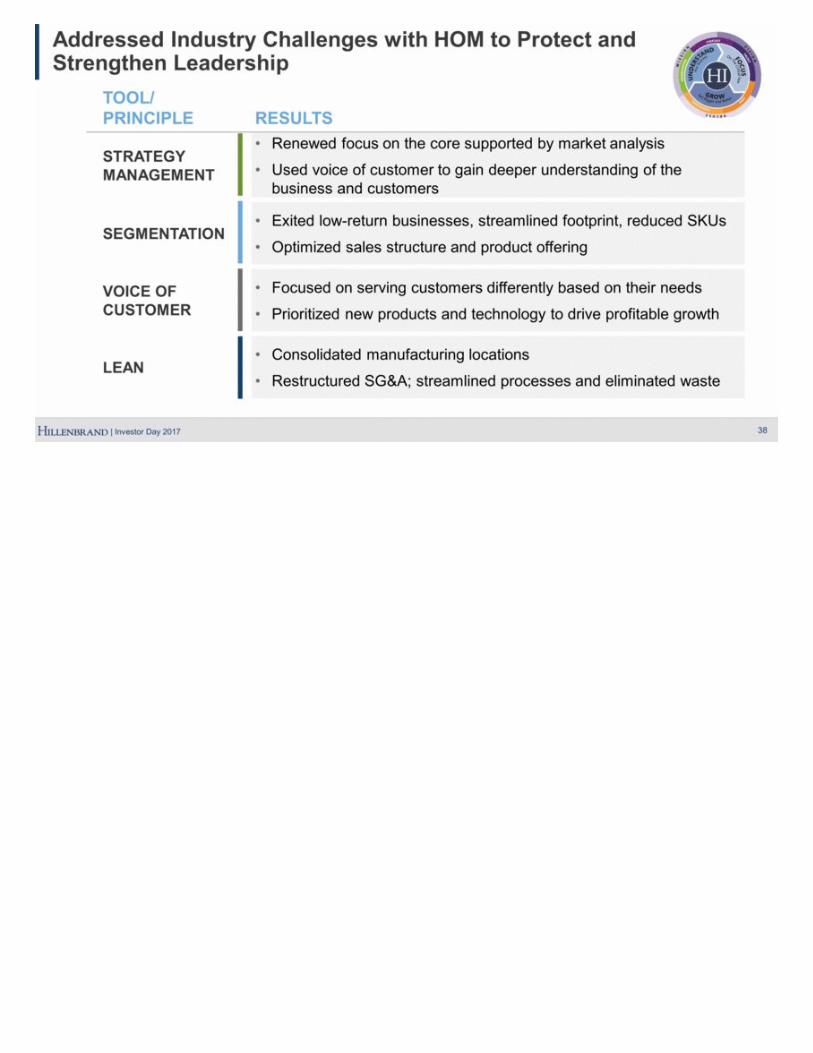
TOOL/ PRINCIPLE RESULTS STRATEGY MANAGEMENT Renewed focus on the core supported by market analysis Used voice of customer to gain deeper understanding of the business and customers SEGMENTATION Exited low-return businesses, streamlined footprint, reduced SKUs Optimized sales structure and product offering VOICE OF CUSTOMER Focused on serving customers differently based on their needs Prioritized new products and technology to drive profitable growth LEAN Consolidated manufacturing locations Restructured SG&A; streamlined processes and eliminated waste Addressed Industry Challenges with HOM to Protect and Strengthen Leadership 38
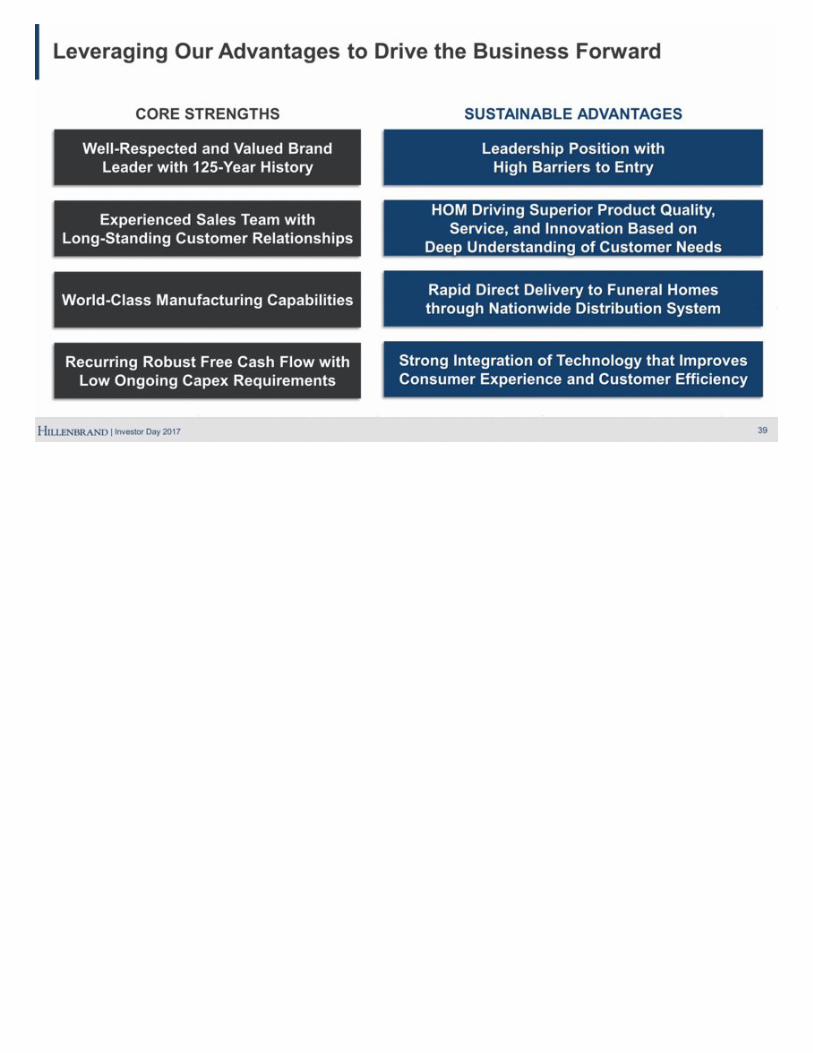
Leveraging Our Advantages to Drive the Business Forward 39 Leadership Position with High Barriers to Entry HOM Driving Superior Product Quality, Service, and Innovation Based on Deep Understanding of Customer Needs Rapid Direct Delivery to Funeral Homes through Nationwide Distribution System Strong Integration of Technology that Improves Consumer Experience and Customer Efficiency CORE STRENGTHS SUSTAINABLE ADVANTAGES Well-Respected and Valued Brand Leader with 125-Year History Experienced Sales Team with Long-Standing Customer Relationships World-Class Manufacturing Capabilities Recurring Robust Free Cash Flow with Low Ongoing Capex Requirements
40 Building on Our Strengths to Expand Industry Leadership Batesville Strategy Maintain Optimal Cost and Asset Structure to Support Profitability and Cash Flow Continue to Develop and Strengthen Talent at Batesville Profitably Strengthen Leadership Position in Death Care Industry
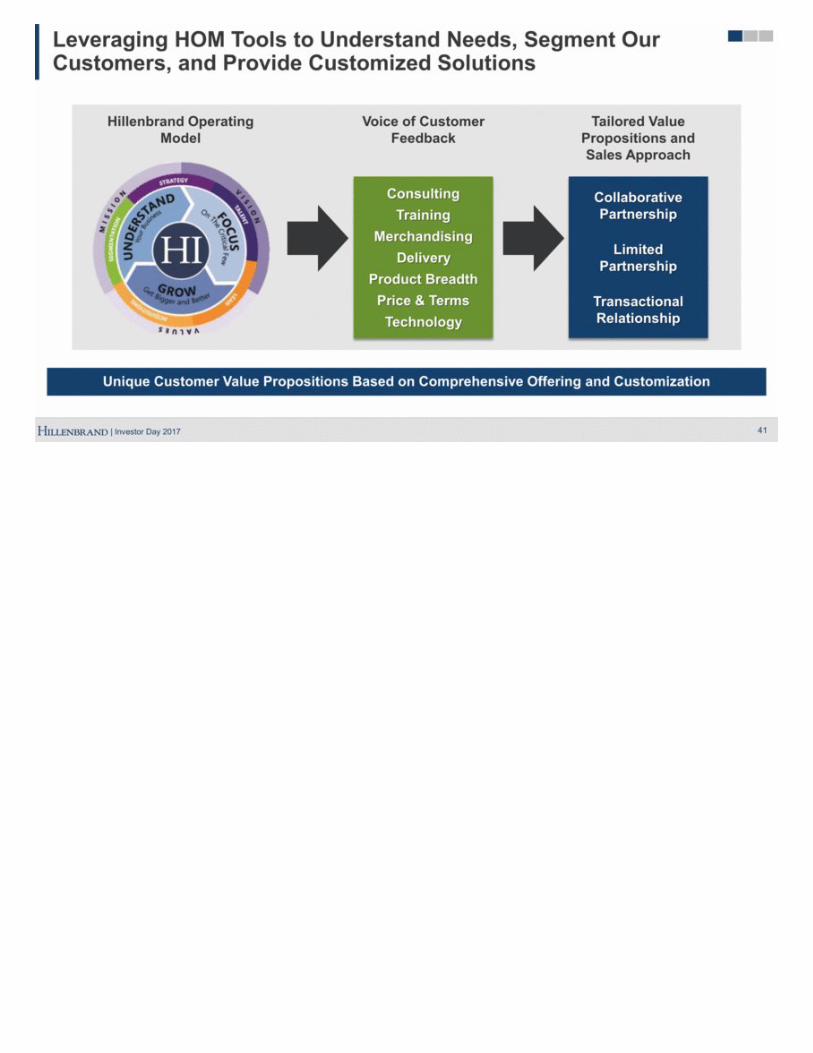
41 Unique Customer Value Propositions Based on Comprehensive Offering and Customization Leveraging HOM Tools to Understand Needs, Segment Our Customers, and Provide Customized Solutions Consulting Training Merchandising Delivery Product Breadth Price & Terms Technology Collaborative Partnership Limited Partnership Transactional Relationship Voice of Customer Feedback Tailored Value Propositions and Sales Approach Hillenbrand Operating Model
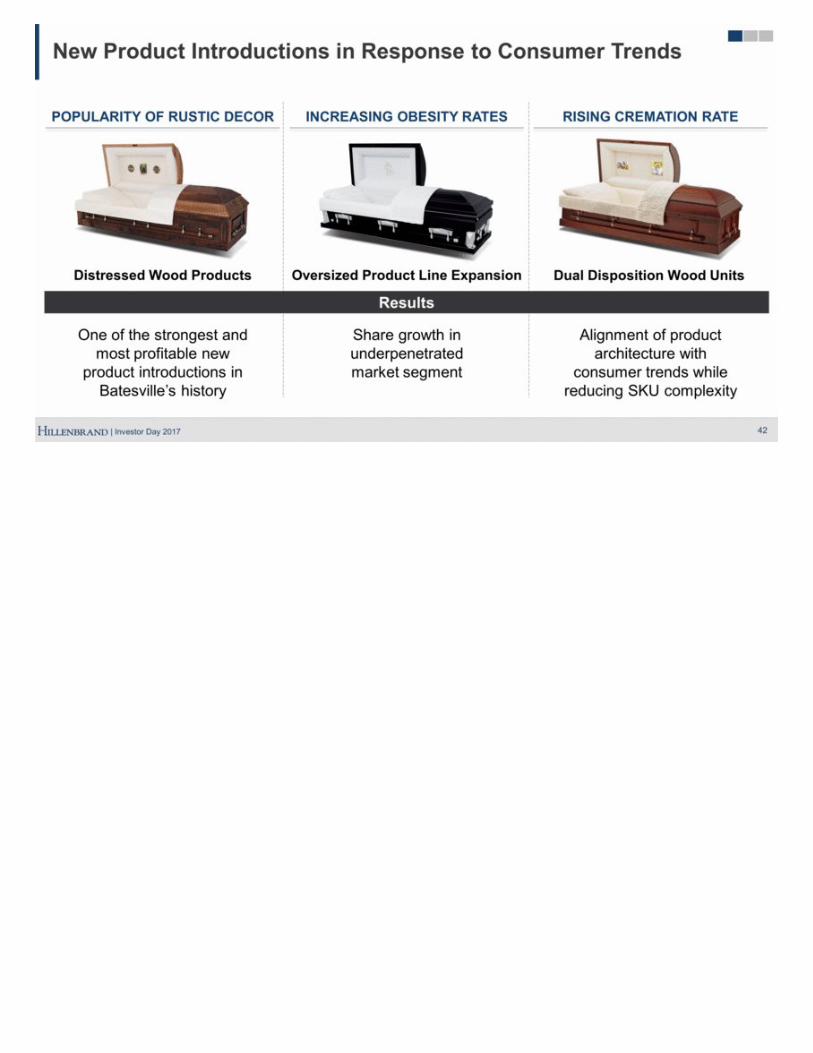
42 New Product Introductions in Response to Consumer Trends Distressed Wood Products Oversized Product Line Expansion Dual Disposition Wood Units RISING CREMATION RATE INCREASING OBESITY RATES POPULARITY OF RUSTIC DECOR One of the strongest and most profitable new product introductions in Batesville’s history Share growth in underpenetrated market segment Alignment of product architecture with consumer trends while reducing SKU complexity Results
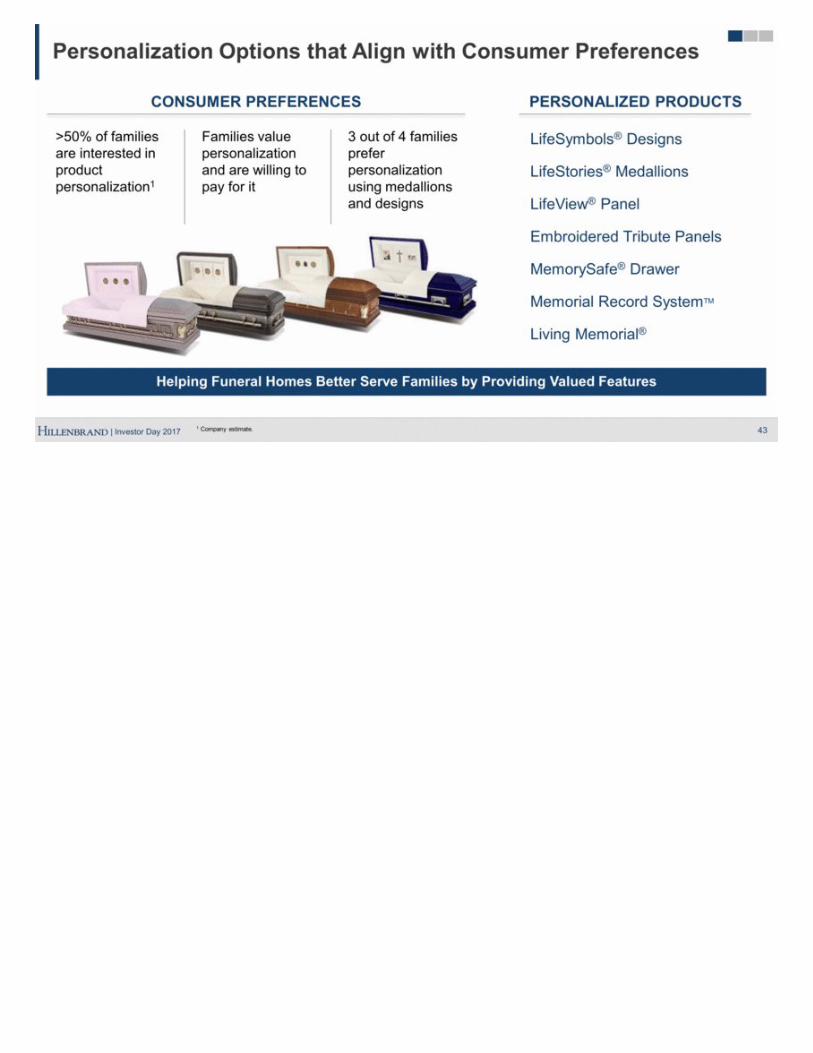
43 Personalization Options that Align with Consumer Preferences PERSONALIZED PRODUCTS LifeSymbols® Designs LifeStories® Medallions LifeView® Panel Embroidered Tribute Panels MemorySafe® Drawer Memorial Record SystemTM Living Memorial® CONSUMER PREFERENCES >50% of families are interested in product personalization1 3 out of 4 families prefer personalization using medallions and designs Families value personalization and are willing to pay for it Helping Funeral Homes Better Serve Families by Providing Valued Features 1 Company estimate.
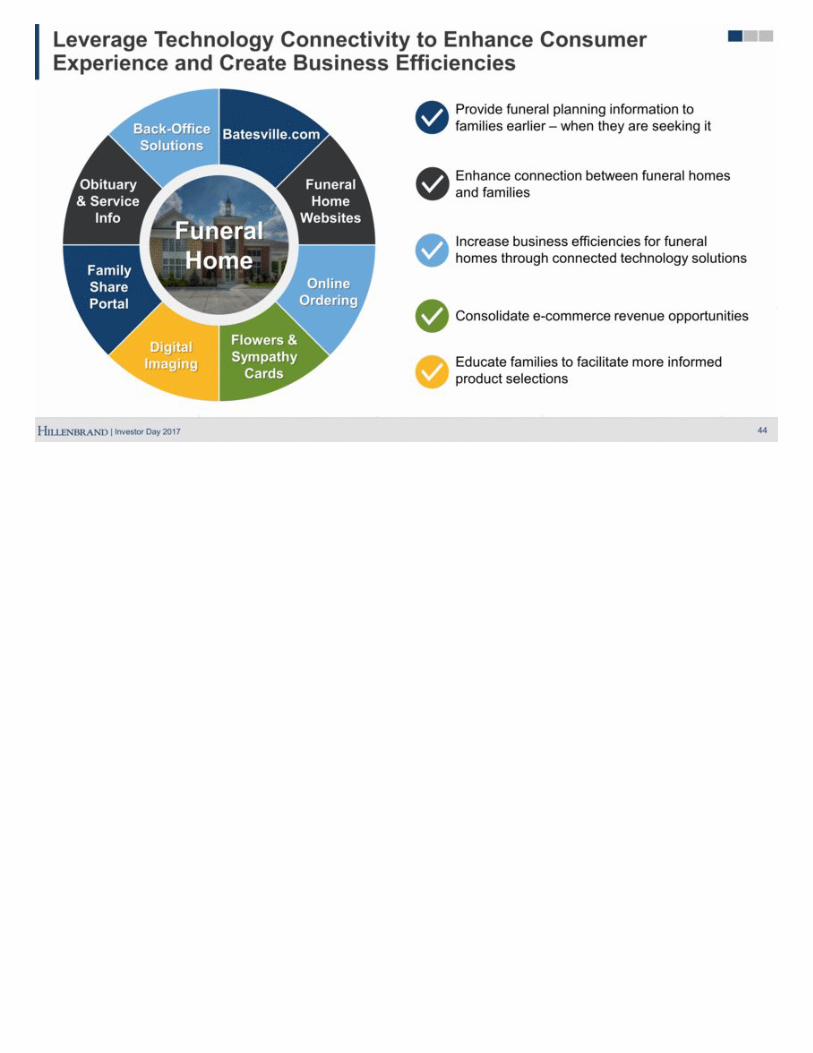
44 Leverage Technology Connectivity to Enhance Consumer Experience and Create Business Efficiencies Provide funeral planning information to families earlier – when they are seeking it Enhance connection between funeral homes and families Increase business efficiencies for funeral homes through connected technology solutions Consolidate e-commerce revenue opportunities Educate families to facilitate more informed product selections Funeral Home Batesville.com Family Share Portal Obituary & Service Info Funeral Home Websites Back-Office Solutions Online Ordering Flowers & Sympathy Cards Digital Imaging
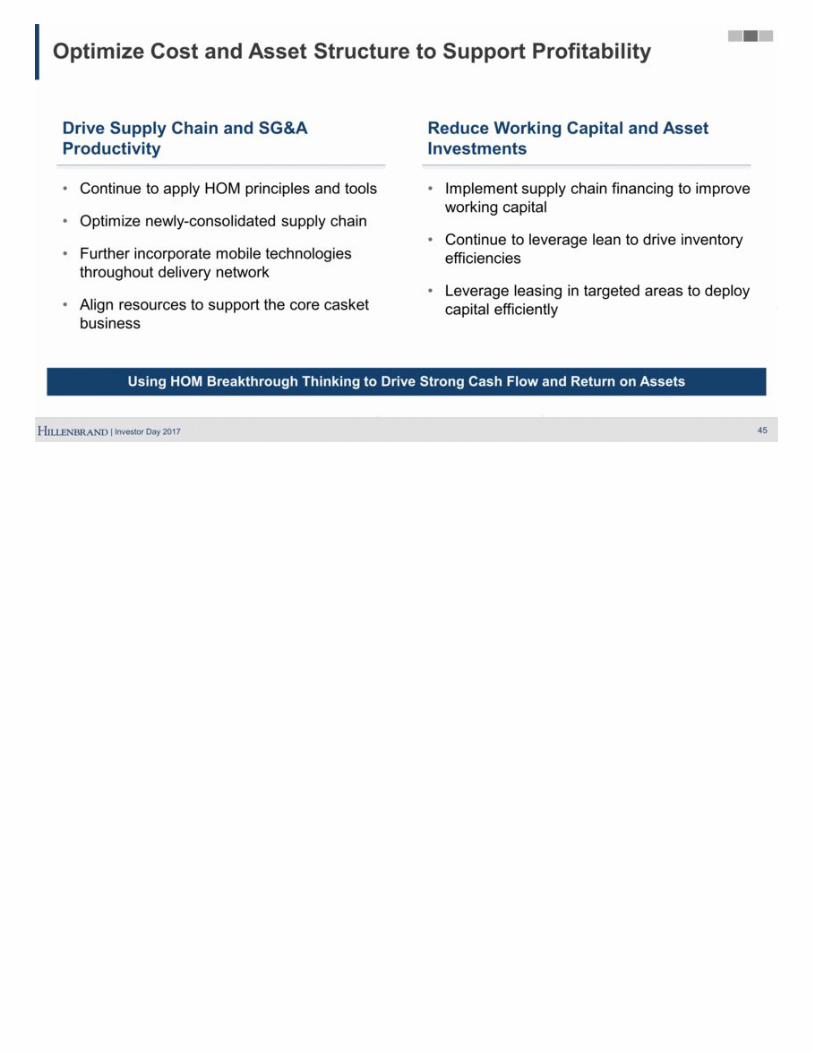
45 Using HOM Breakthrough Thinking to Drive Strong Cash Flow and Return on Assets Optimize Cost and Asset Structure to Support Profitability Continue to apply HOM principles and tools Optimize newly-consolidated supply chain Further incorporate mobile technologies throughout delivery network Align resources to support the core casket business Implement supply chain financing to improve working capital Continue to leverage lean to drive inventory efficiencies Leverage leasing in targeted areas to deploy capital efficiently Drive Supply Chain and SG&A Productivity Reduce Working Capital and Asset Investments

Continue to Strengthen and Develop Talent 46 Recruit and Develop Leaders Skilled in HOM Tools to Drive Breakthrough Thinking Develop Next Generation Sales Leaders to Drive Performance and Strengthen Relationships Expand Digital Marketing Expertise and Further Develop External Strategic Partnerships
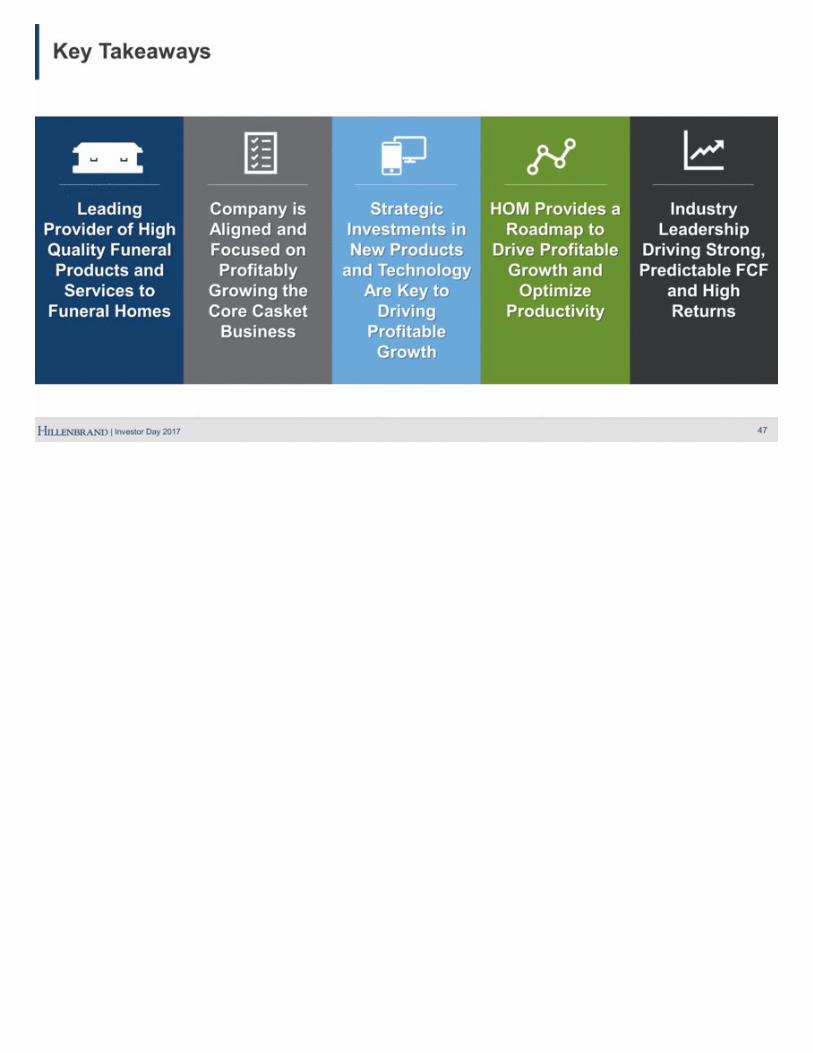
Key Takeaways 47 Company is Aligned and Focused on Profitably Growing the Core Casket Business Strategic Investments in New Products and Technology Are Key to Driving Profitable Growth Industry Leadership Driving Strong, Predictable FCF and High Returns HOM Provides a Roadmap to Drive Profitable Growth and Optimize Productivity Leading Provider of High Quality Funeral Products and Services to Funeral Homes

Q&A
Process Equipment Group: Overview Joe Raver President & CEO
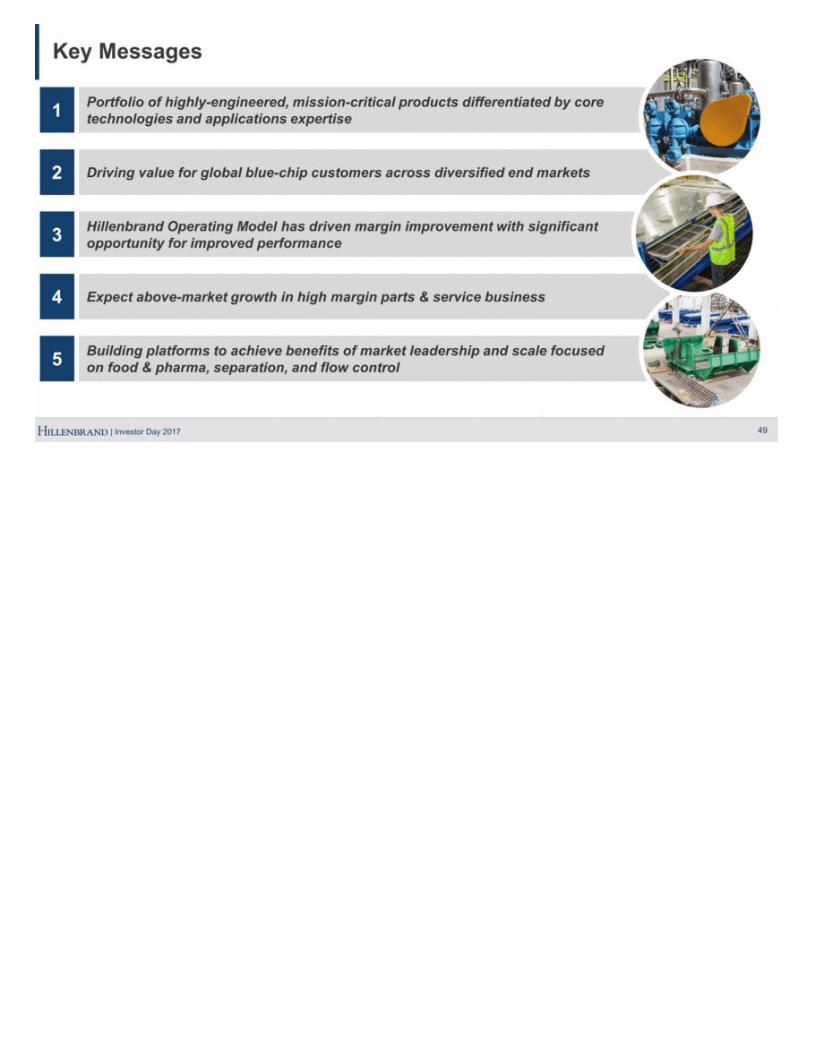
Building platforms to achieve benefits of market leadership and scale focused on food & pharma, separation, and flow control 5 Key Messages 49 Portfolio of highly-engineered, mission-critical products differentiated by core technologies and applications expertise 1 Hillenbrand Operating Model has driven margin improvement with significant opportunity for improved performance 3 Expect above-market growth in high margin parts & service business 4 Driving value for global blue-chip customers across diversified end markets 2
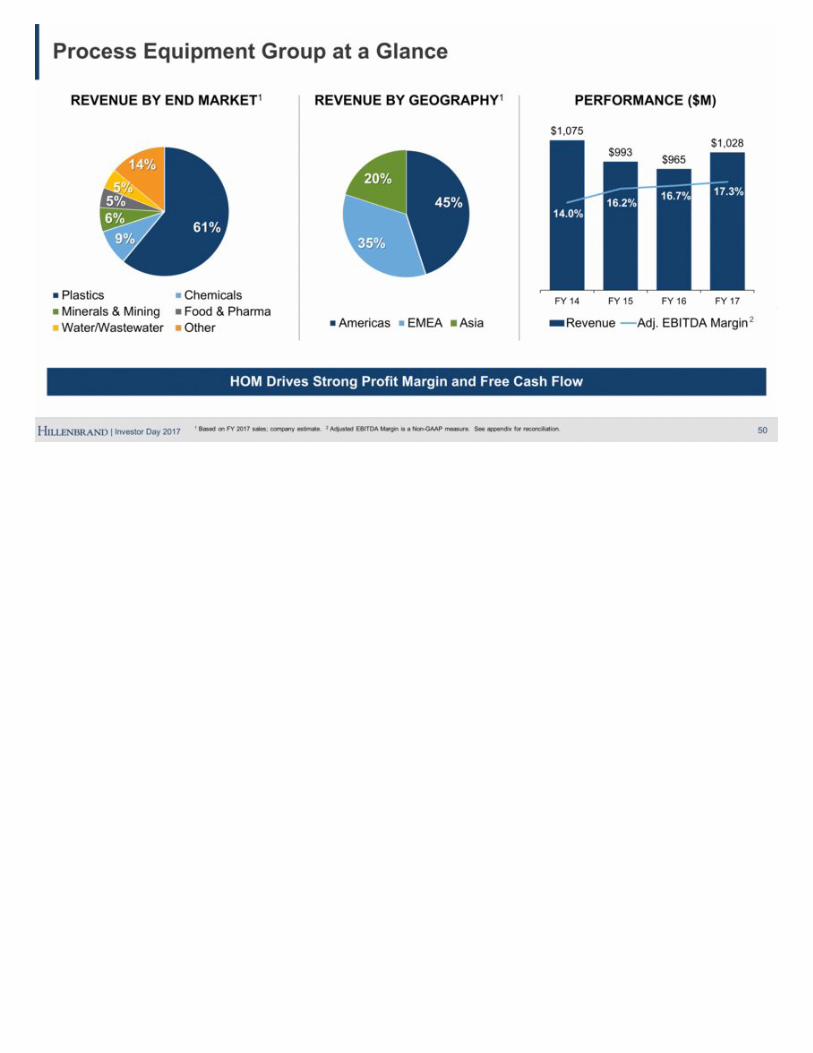
50 HOM Drives Strong Profit Margin and Free Cash Flow Process Equipment Group at a Glance PERFORMANCE ($M) 2 REVENUE BY END MARKET1 REVENUE BY GEOGRAPHY1 1 Based on FY 2017 sales; company estimate. 2 Adjusted EBITDA Margin is a Non-GAAP measure. See appendix for reconciliation. 61% 9% 6% 5% 5% 14% Plastics Chemicals Minerals & Mining Food & Pharma Water/Wastewater Other $1,075 $993 $965 $1,028 14.0% 16.2% 16.7% 17.3% 0% 5% 10% 15% 20% 25% $500 $700 $900 $1,100 FY 14 FY 15 FY 16 FY 17 Revenue Adj. EBITDA Margin 45% 35% 20% Americas EMEA Asia
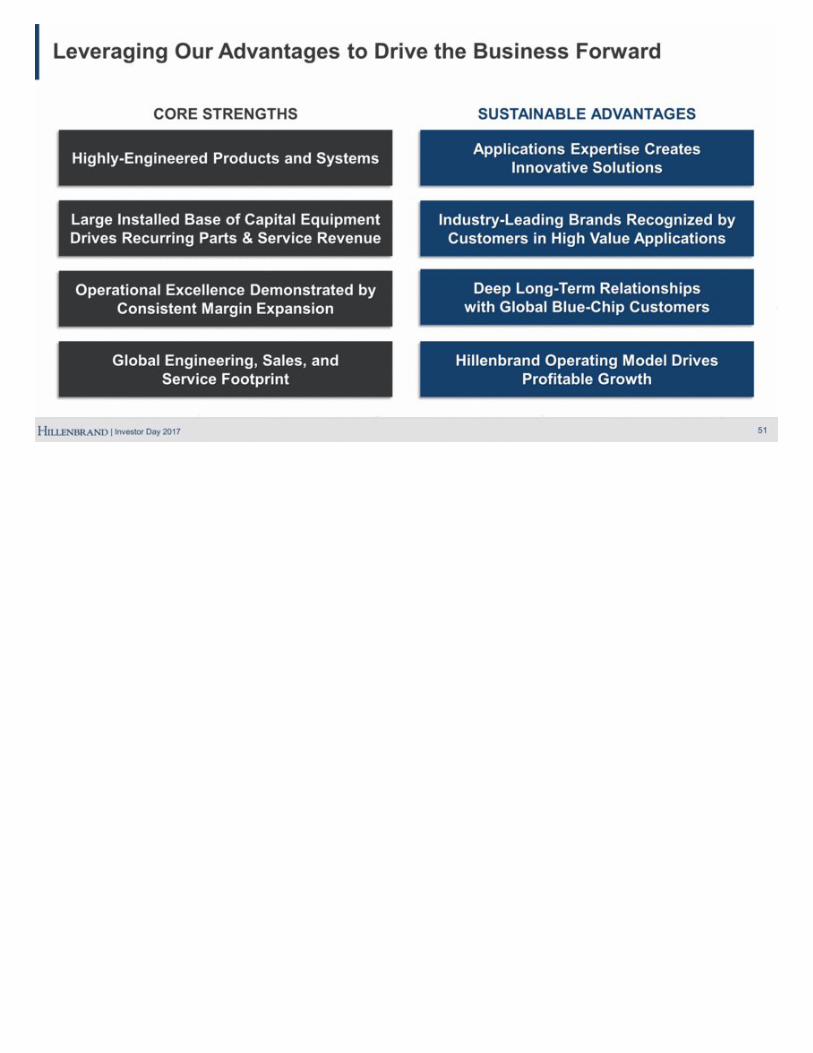
Leveraging Our Advantages to Drive the Business Forward 51 Hillenbrand Operating Model Drives Profitable Growth Applications Expertise Creates Innovative Solutions Industry-Leading Brands Recognized by Customers in High Value Applications Deep Long-Term Relationships with Global Blue-Chip Customers Global Engineering, Sales, and Service Footprint Operational Excellence Demonstrated by Consistent Margin Expansion Large Installed Base of Capital Equipment Drives Recurring Parts & Service Revenue Highly-Engineered Products and Systems CORE STRENGTHS SUSTAINABLE ADVANTAGES

52 PRODUCT PORTFOLIO Products: Compounders and extruders Material handling equipment Feeders, components, and system solutions Parts & service Separation Products: Screening equipment Sizing equipment Parts & service Flow Control Products: Pumping solutions Highly-engineered valves Parts & service Size Reduction Products: Crushers Material handling equipment Parts & service END MARKETS Polyolefins Engineered Plastics Chemicals Processed Food & Pharma Minerals & Fertilizers Food & Agriculture Proppants Municipal Water and Wastewater Industrial Water and Wastewater Coal Power & Mining Forest Products Steel PORTION OF PEG REVENUE1 Diverse Brands with Significant Scale in Plastics 1 Based on FY 2017 sales.
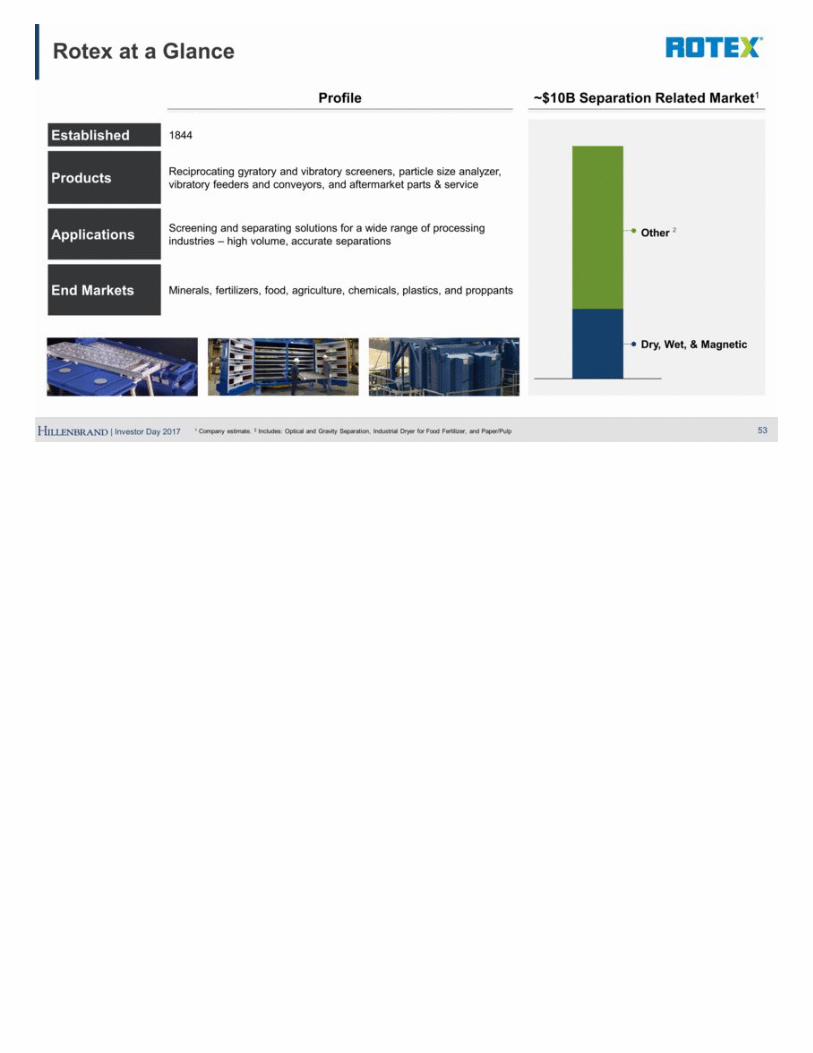
53 Rotex at a Glance Established 1844 Products Reciprocating gyratory and vibratory screeners, particle size analyzer, vibratory feeders and conveyors, and aftermarket parts & service Applications Screening and separating solutions for a wide range of processing industries – high volume, accurate separations End Markets Minerals, fertilizers, food, agriculture, chemicals, plastics, and proppants Profile Dry, Wet, & Magnetic Other ~$10B Separation Related Market1 2 1 Company estimate. 2 Includes: Optical and Gravity Separation, Industrial Dryer for Food Fertilizer, and Paper/Pulp Category 1
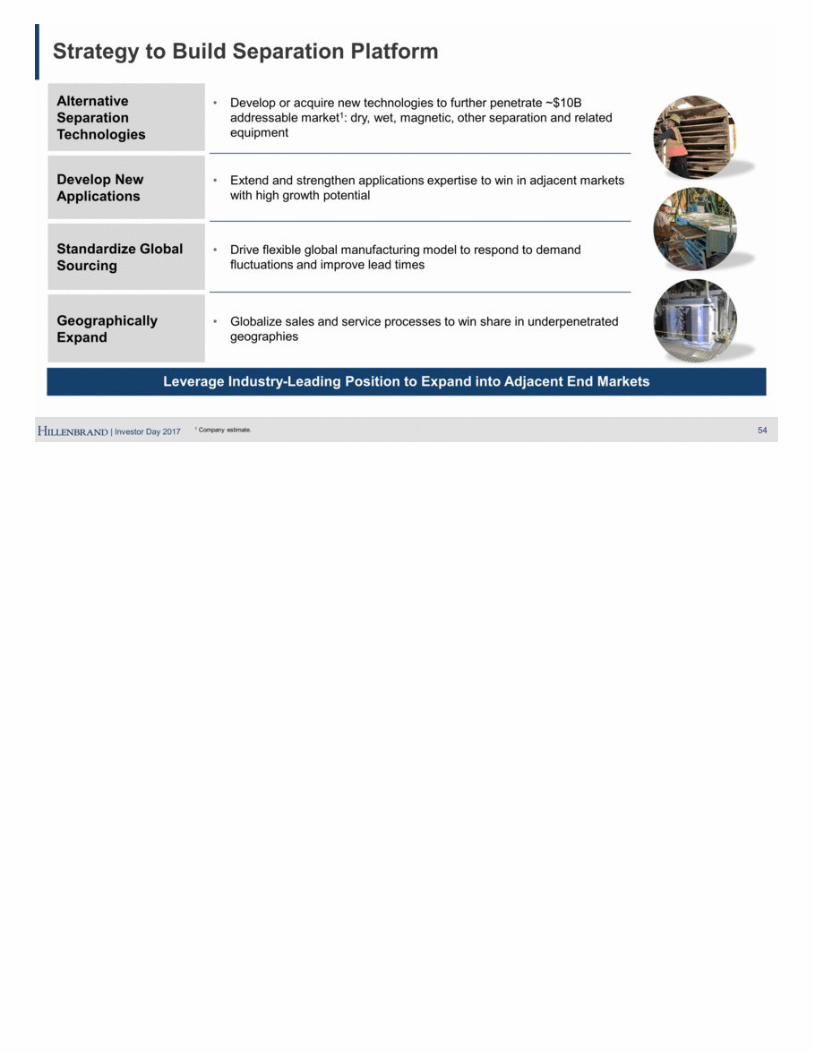
54 Leverage Industry-Leading Position to Expand into Adjacent End Markets Strategy to Build Separation Platform Alternative Separation Technologies Develop or acquire new technologies to further penetrate ~$10B addressable market1: dry, wet, magnetic, other separation and related equipment Develop New Applications Extend and strengthen applications expertise to win in adjacent markets with high growth potential Standardize Global Sourcing Drive flexible global manufacturing model to respond to demand fluctuations and improve lead times Geographically Expand Globalize sales and service processes to win share in underpenetrated geographies 1 Company estimate.
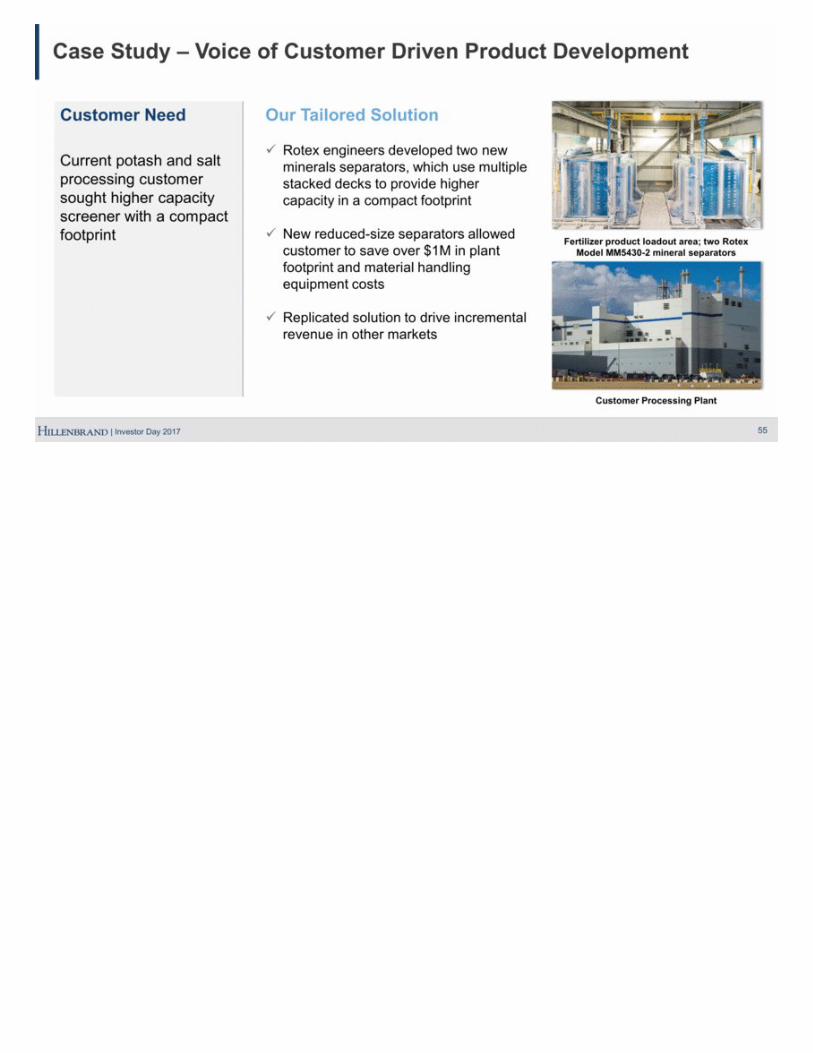
Case Study – Voice of Customer Driven Product Development 55 Customer Need Current potash and salt processing customer sought higher capacity screener with a compact footprint Fertilizer product loadout area; two Rotex Model MM5430-2 mineral separators Customer Processing Plant Our Tailored Solution Rotex engineers developed two new minerals separators, which use multiple stacked decks to provide higher capacity in a compact footprint New reduced-size separators allowed customer to save over $1M in plant footprint and material handling equipment costs Replicated solution to drive incremental revenue in other markets
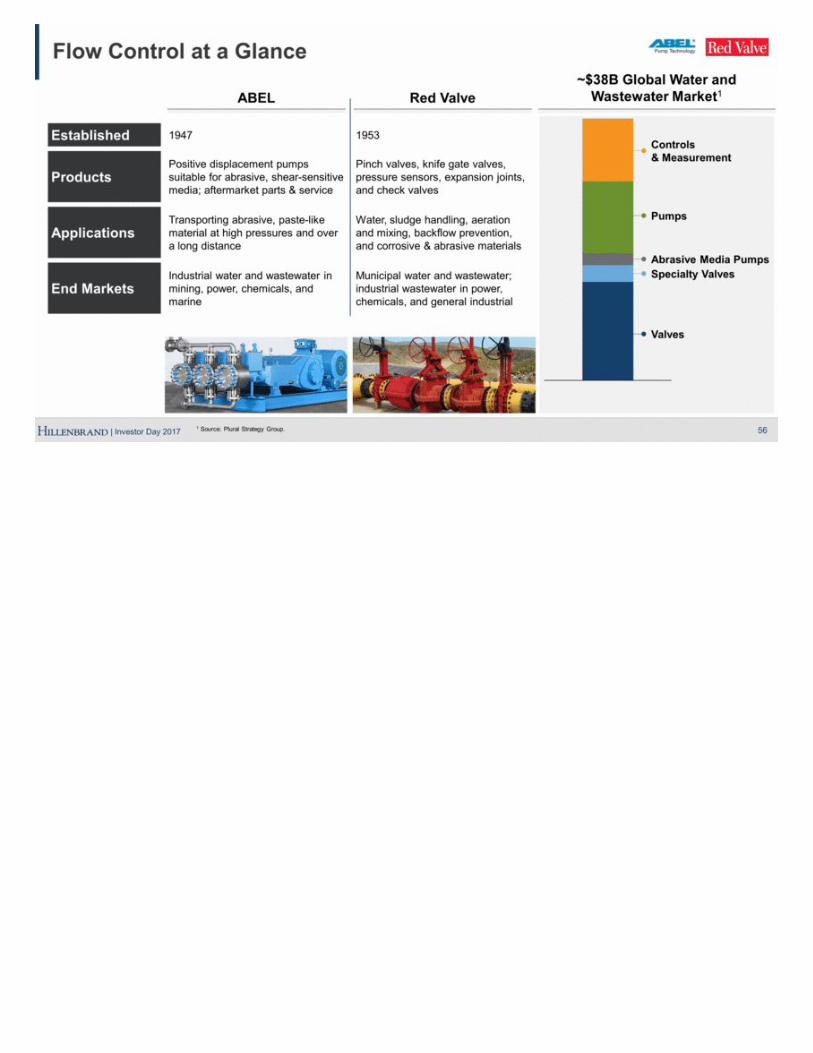
Established 1947 1953 Products Positive displacement pumps suitable for abrasive, shear-sensitive media; aftermarket parts & service Pinch valves, knife gate valves, pressure sensors, expansion joints, and check valves Applications Transporting abrasive, paste-like material at high pressures and over a long distance Water, sludge handling, aeration and mixing, backflow prevention, and corrosive & abrasive materials End Markets Industrial water and wastewater in mining, power, chemicals, and marine Municipal water and wastewater; industrial wastewater in power, chemicals, and general industrial 56 ~$38B Global Water and Wastewater Market1 Flow Control at a Glance ABEL Red Valve Specialty Valves Valves Abrasive Media Pumps Pumps Controls & Measurement 1 Source: Plural Strategy Group. Category 1
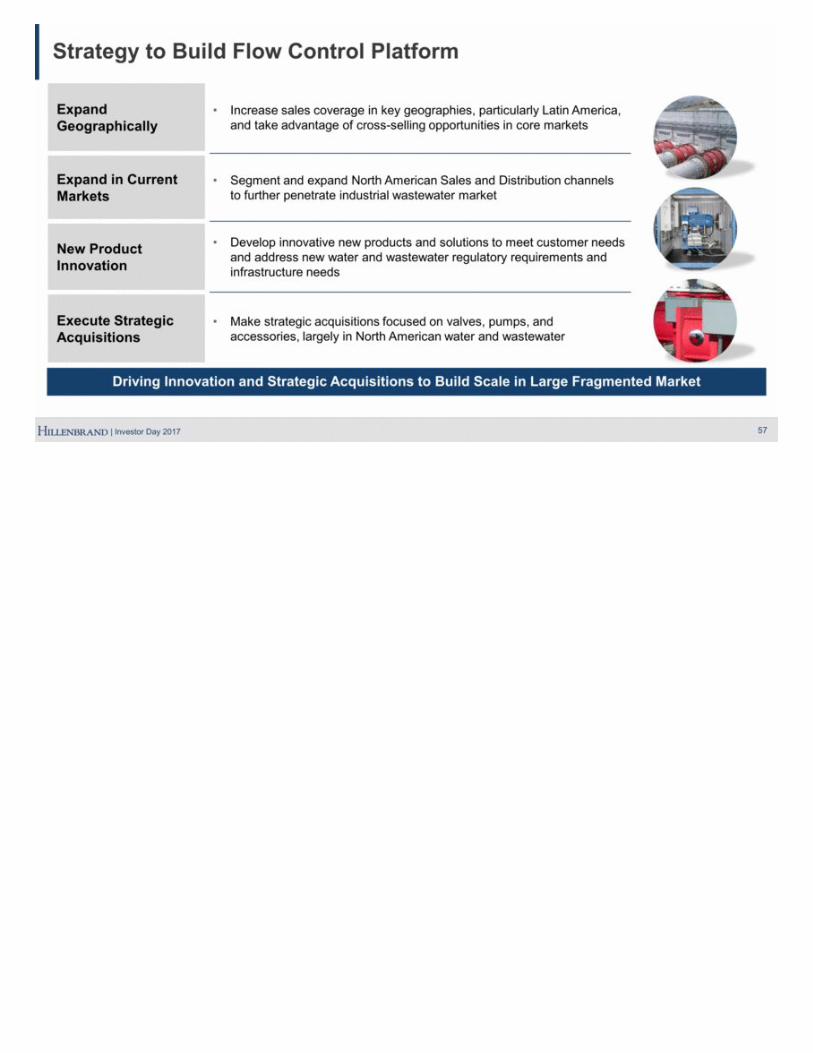
57 Driving Innovation and Strategic Acquisitions to Build Scale in Large Fragmented Market Strategy to Build Flow Control Platform Expand Geographically Increase sales coverage in key geographies, particularly Latin America, and take advantage of cross-selling opportunities in core markets Expand in Current Markets Segment and expand North American Sales and Distribution channels to further penetrate industrial wastewater market New Product Innovation Develop innovative new products and solutions to meet customer needs and address new water and wastewater regulatory requirements and infrastructure needs Execute Strategic Acquisitions Make strategic acquisitions focused on valves, pumps, and accessories, largely in North American water and wastewater
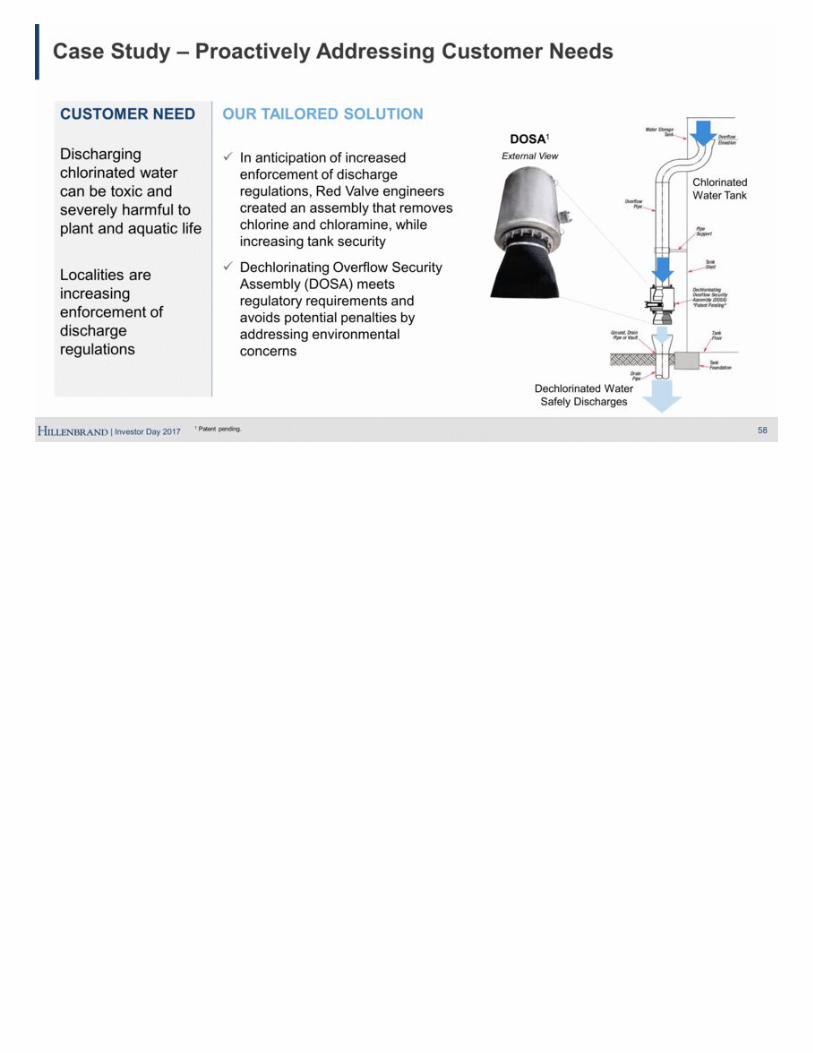
Case Study – Proactively Addressing Customer Needs 58 CUSTOMER NEED Discharging chlorinated water can be toxic and severely harmful to plant and aquatic life Localities are increasing enforcement of discharge regulations DOSA1 External View OUR TAILORED SOLUTION In anticipation of increased enforcement of discharge regulations, Red Valve engineers created an assembly that removes chlorine and chloramine, while increasing tank security Dechlorinating Overflow Security Assembly (DOSA) meets regulatory requirements and avoids potential penalties by addressing environmental concerns 1 Patent pending. Chlorinated Water Tank Dechlorinated Water Safely Discharges
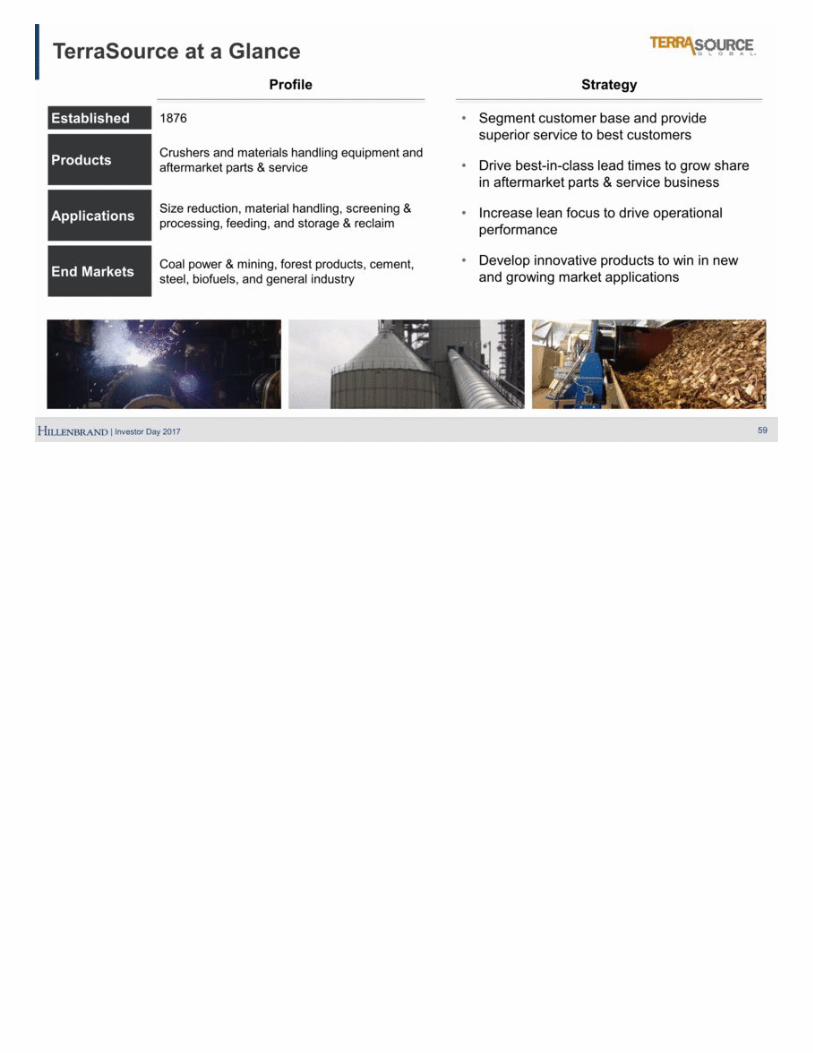
59 TerraSource at a Glance Established 1876 Products Crushers and materials handling equipment and aftermarket parts & service Applications Size reduction, material handling, screening & processing, feeding, and storage & reclaim End Markets Coal power & mining, forest products, cement, steel, biofuels, and general industry Strategy Segment customer base and provide superior service to best customers Drive best-in-class lead times to grow share in aftermarket parts & service business Increase lean focus to drive operational performance Develop innovative products to win in new and growing market applications Profile
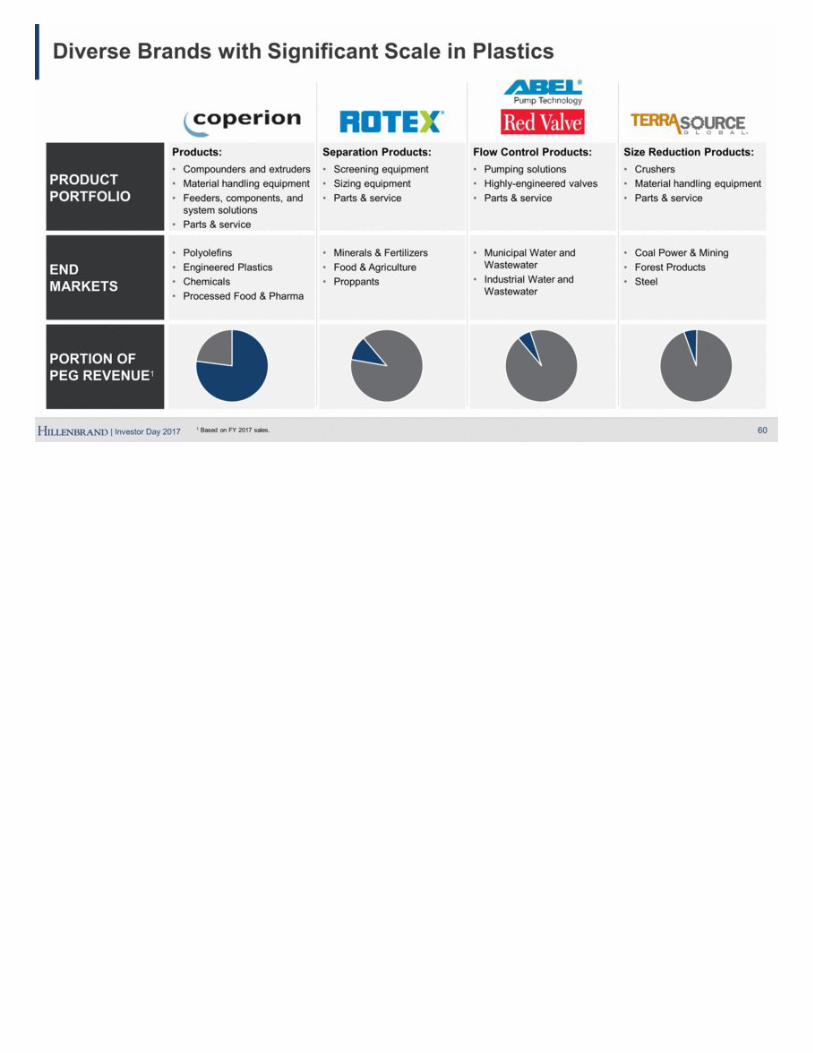
60 PRODUCT PORTFOLIO Products: Compounders and extruders Material handling equipment Feeders, components, and system solutions Parts & service Separation Products: Screening equipment Sizing equipment Parts & service Flow Control Products: Pumping solutions Highly-engineered valves Parts & service Size Reduction Products: Crushers Material handling equipment Parts & service END MARKETS Polyolefins Engineered Plastics Chemicals Processed Food & Pharma Minerals & Fertilizers Food & Agriculture Proppants Municipal Water and Wastewater Industrial Water and Wastewater Coal Power & Mining Forest Products Steel PORTION OF PEG REVENUE1 Diverse Brands with Significant Scale in Plastics 1 Based on FY 2017 sales.

Coperion Kim Ryan President
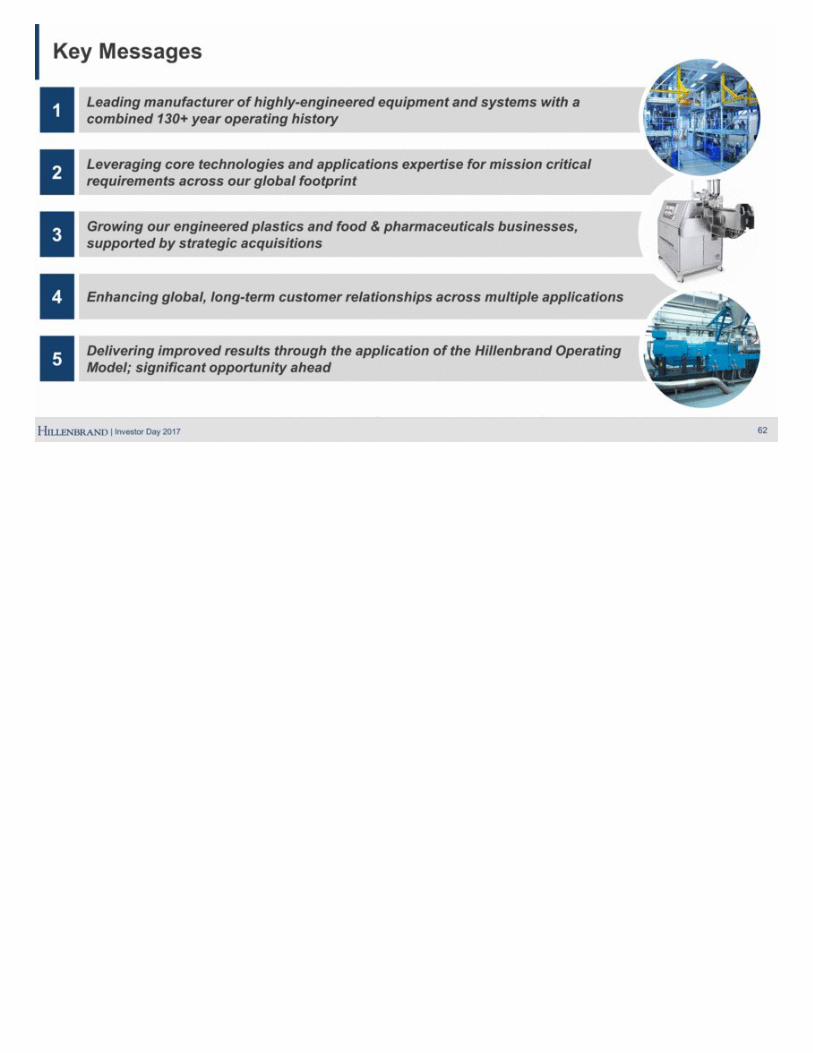
Leveraging core technologies and applications expertise for mission critical requirements across our global footprint 2 Growing our engineered plastics and food & pharmaceuticals businesses, supported by strategic acquisitions 3 Enhancing global, long-term customer relationships across multiple applications 4 Key Messages 62 Leading manufacturer of highly-engineered equipment and systems with a combined 130+ year operating history 1 Delivering improved results through the application of the Hillenbrand Operating Model; significant opportunity ahead 5
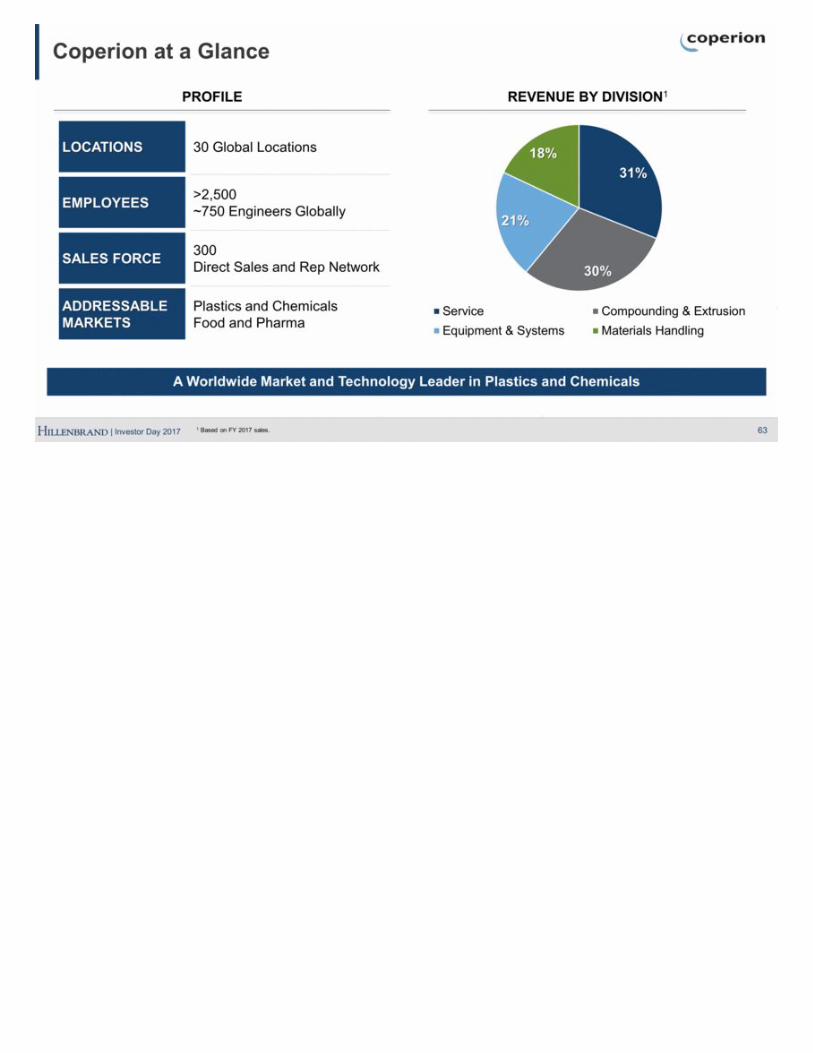
63 A Worldwide Market and Technology Leader in Plastics and Chemicals Coperion at a Glance REVENUE BY DIVISION1 PROFILE LOCATIONS 30 Global Locations EMPLOYEES >2,500 ~750 Engineers Globally SALES FORCE 300 Direct Sales and Rep Network ADDRESSABLE MARKETS Plastics and Chemicals Food and Pharma 1 Based on FY 2017 sales. 31% 30% 21% 18% Service Compounding & Extrusion Equipment & Systems Materials Handling
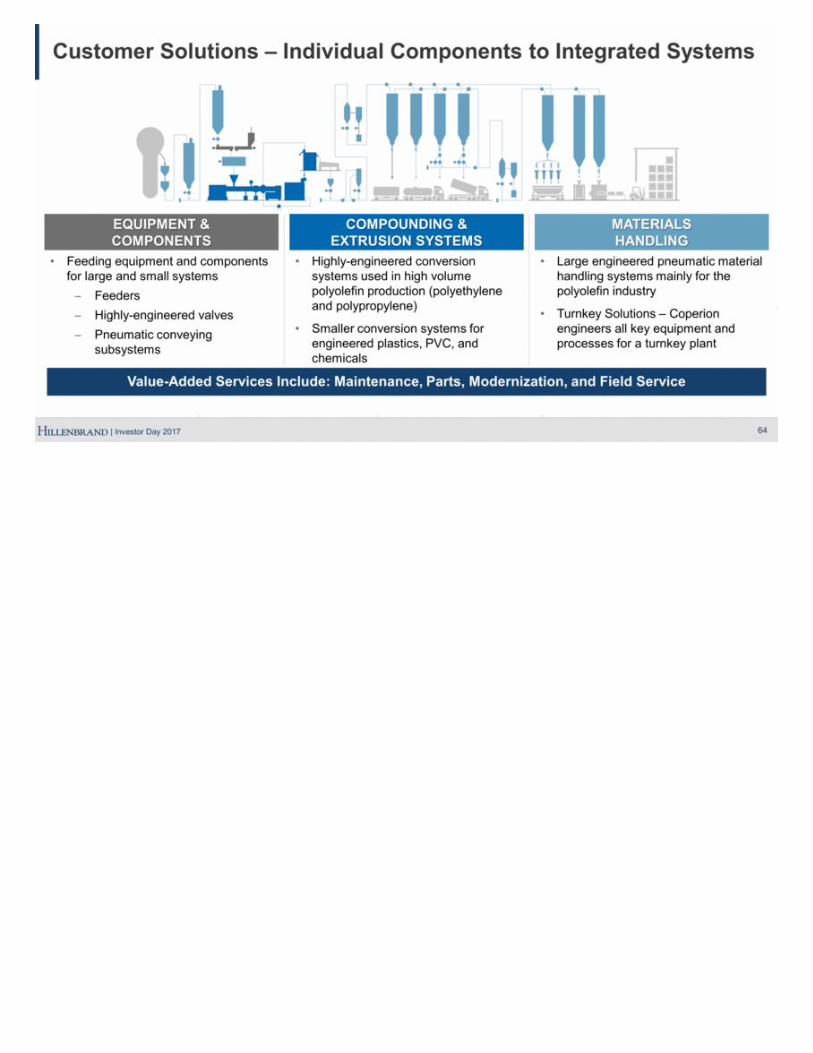
64 Value-Added Services Include: Maintenance, Parts, Modernization, and Field Service Customer Solutions – Individual Components to Integrated Systems COMPOUNDING & EXTRUSION SYSTEMS Highly-engineered conversion systems used in high volume polyolefin production (polyethylene and polypropylene) Smaller conversion systems for engineered plastics, PVC, and chemicals EQUIPMENT & COMPONENTS Feeding equipment and components for large and small systems Feeders Highly-engineered valves Pneumatic conveying subsystems MATERIALS HANDLING Large engineered pneumatic material handling systems mainly for the polyolefin industry Turnkey Solutions – Coperion engineers all key equipment and processes for a turnkey plant
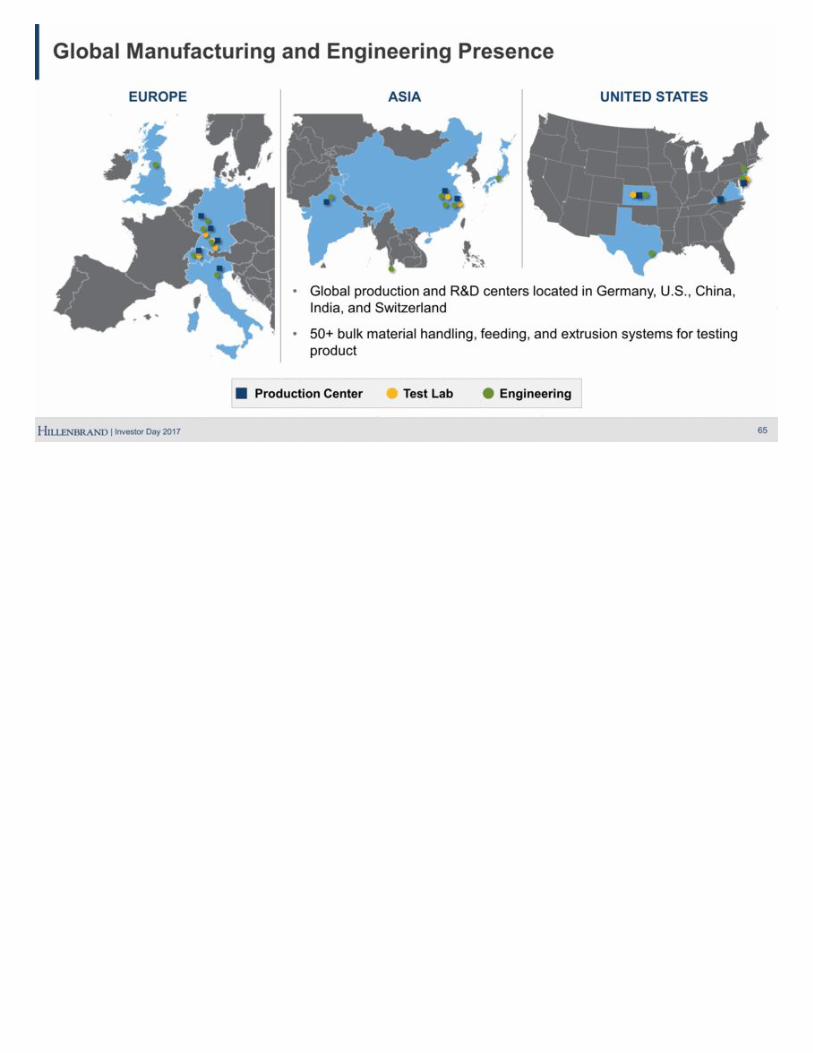
65 Global Manufacturing and Engineering Presence EUROPE ASIA Global production and R&D centers located in Germany, U.S., China, India, and Switzerland 50+ bulk material handling, feeding, and extrusion systems for testing product UNITED STATES Production Center Test Lab Engineering
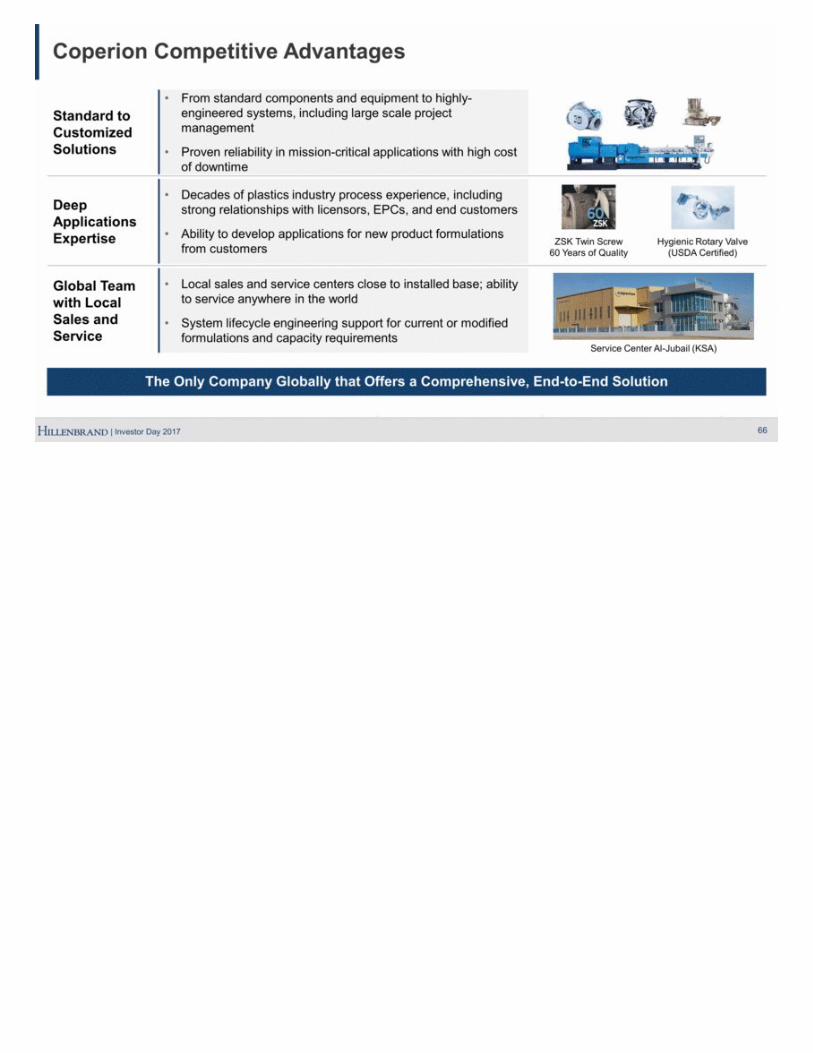
66 Coperion Competitive Advantages The Only Company Globally that Offers a Comprehensive, End-to-End Solution Standard to Customized Solutions From standard components and equipment to highly-engineered systems, including large scale project management Proven reliability in mission-critical applications with high cost of downtime Deep Applications Expertise Decades of plastics industry process experience, including strong relationships with licensors, EPCs, and end customers Ability to develop applications for new product formulations from customers Global Team with Local Sales and Service Local sales and service centers close to installed base; ability to service anywhere in the world System lifecycle engineering support for current or modified formulations and capacity requirements Hygienic Rotary Valve (USDA Certified) ZSK Twin Screw 60 Years of Quality Service Center Al-Jubail (KSA)
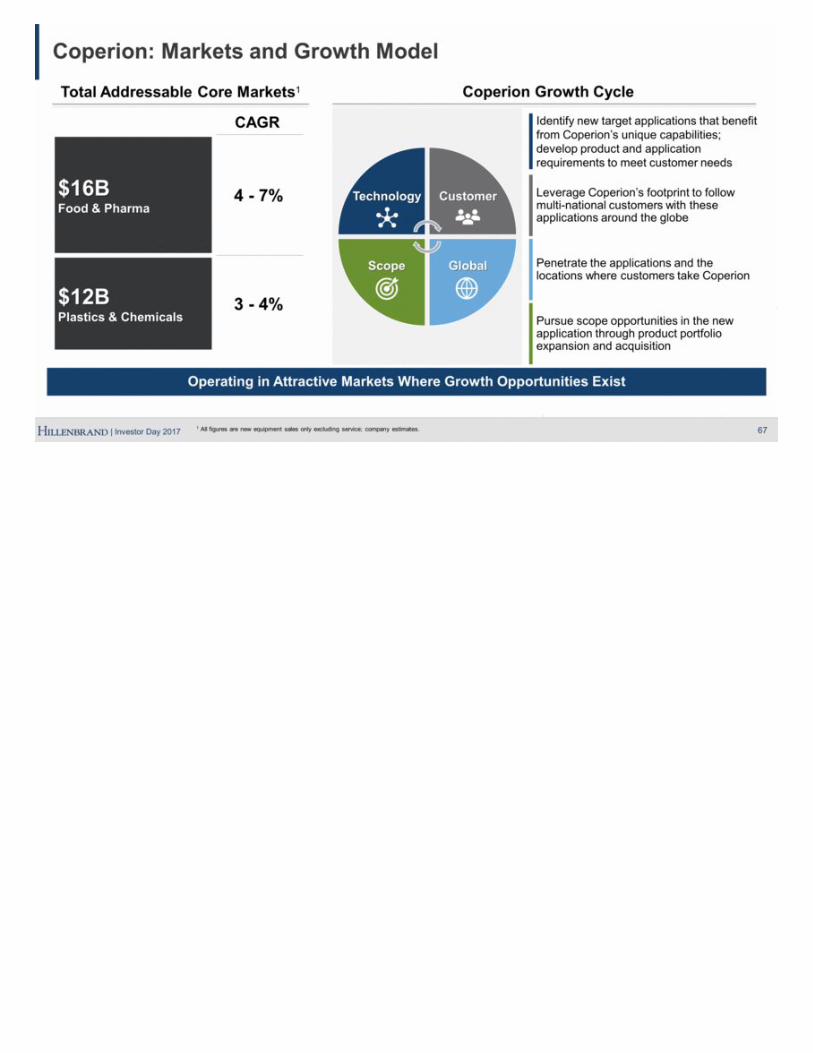
67 Operating in Attractive Markets Where Growth Opportunities Exist Coperion: Markets and Growth Model Coperion Growth Cycle Technology Customer Scope Global Identify new target applications that benefit from Coperion’s unique capabilities; develop product and application requirements to meet customer needs Leverage Coperion’s footprint to follow multi-national customers with these applications around the globe Penetrate the applications and the locations where customers take Coperion Pursue scope opportunities in the new application through product portfolio expansion and acquisition Total Addressable Core Markets1 $16B Food & Pharma 4 - 7% $12B Plastics & Chemicals 3 - 4% CAGR 1 All figures are new equipment sales only excluding service; company estimates.
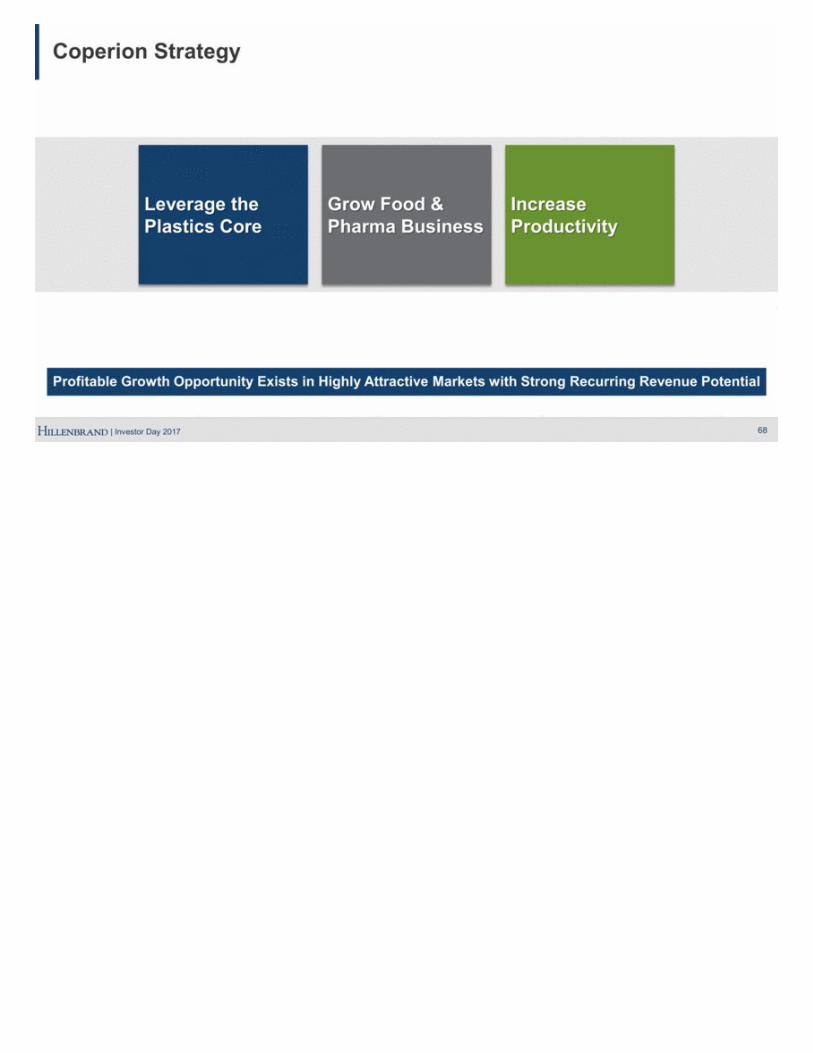
68 Profitable Growth Opportunity Exists in Highly Attractive Markets with Strong Recurring Revenue Potential Coperion Strategy Grow Food & Pharma Business Increase Productivity Leverage the Plastics Core
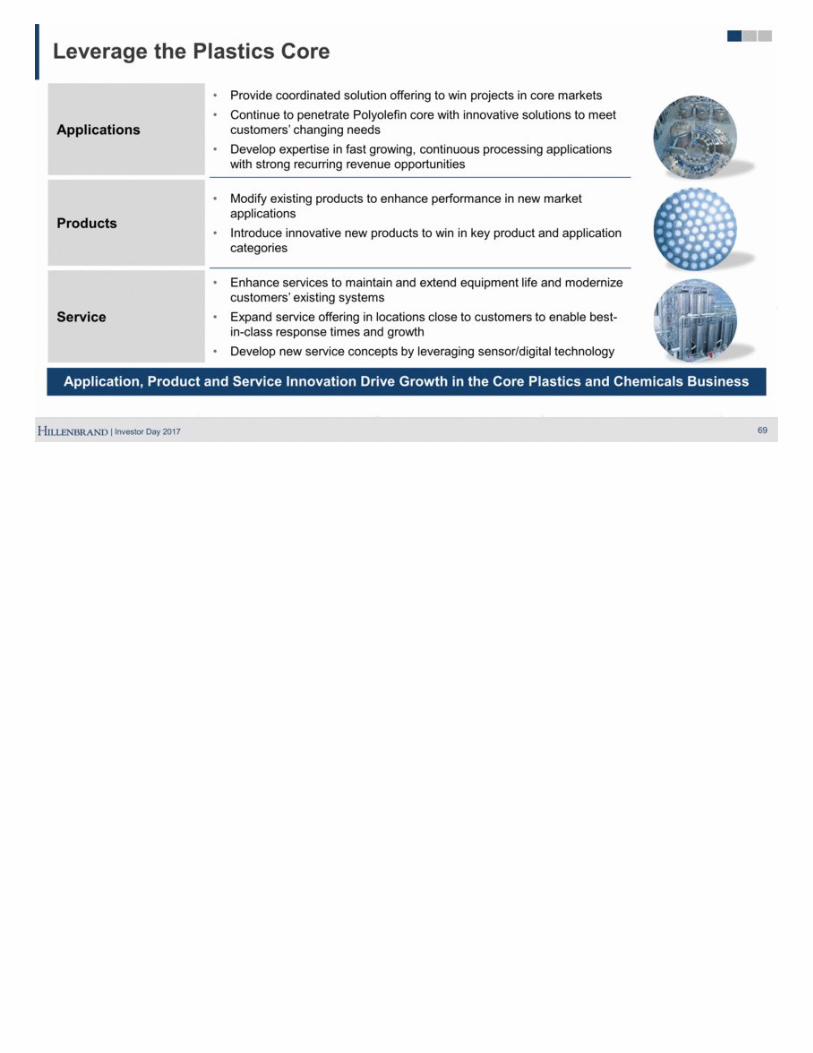
69 Application, Product and Service Innovation Drive Growth in the Core Plastics and Chemicals Business Leverage the Plastics Core Applications Provide coordinated solution offering to win projects in core markets Continue to penetrate Polyolefin core with innovative solutions to meet customers’ changing needs Develop expertise in fast growing, continuous processing applications with strong recurring revenue opportunities Products Modify existing products to enhance performance in new market applications Introduce innovative new products to win in key product and application categories Service Enhance services to maintain and extend equipment life and modernize customers’ existing systems Expand service offering in locations close to customers to enable best-in-class response times and growth Develop new service concepts by leveraging sensor/digital technology
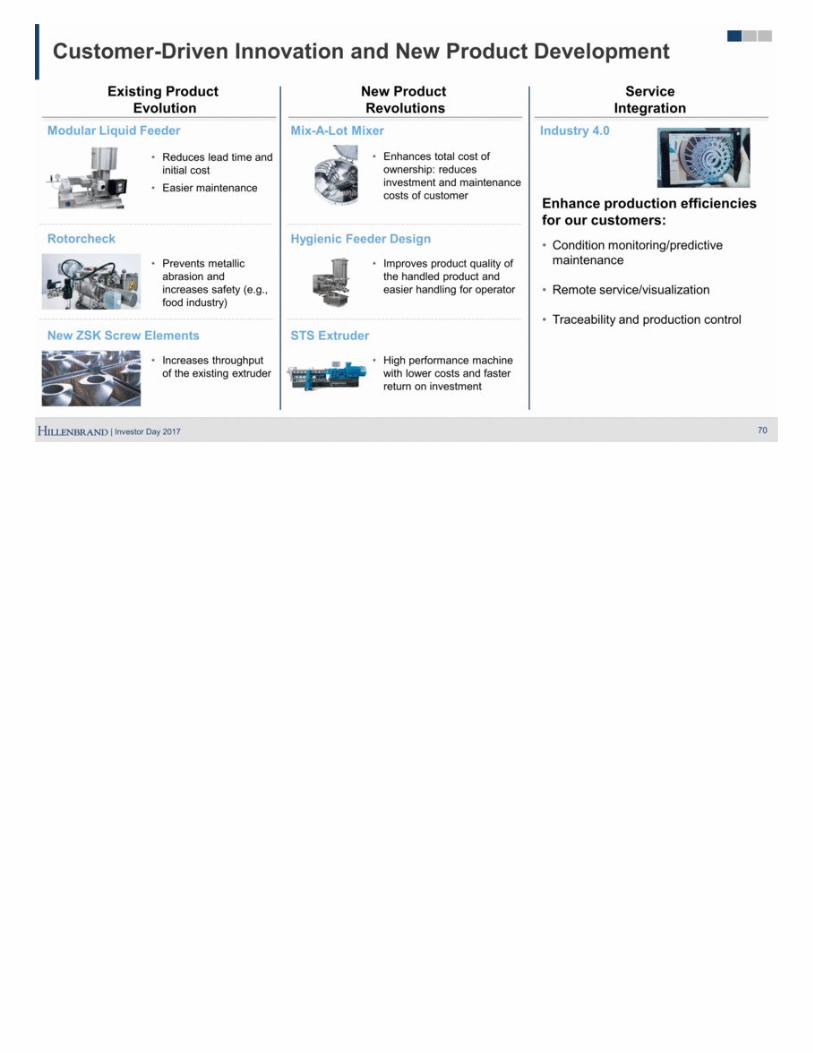
Customer-Driven Innovation and New Product Development 70 Reduces lead time and initial cost Easier maintenance Modular Liquid Feeder Prevents metallic abrasion and increases safety (e.g., food industry) Rotorcheck Increases throughput of the existing extruder New ZSK Screw Elements Enhances total cost of ownership: reduces investment and maintenance costs of customer Mix-A-Lot Mixer Improves product quality of the handled product and easier handling for operator Hygienic Feeder Design High performance machine with lower costs and faster return on investment STS Extruder Industry 4.0 Enhance production efficiencies for our customers: Condition monitoring/predictive maintenance Remote service/visualization Traceability and production control Existing Product Evolution New Product Revolutions Service Integration
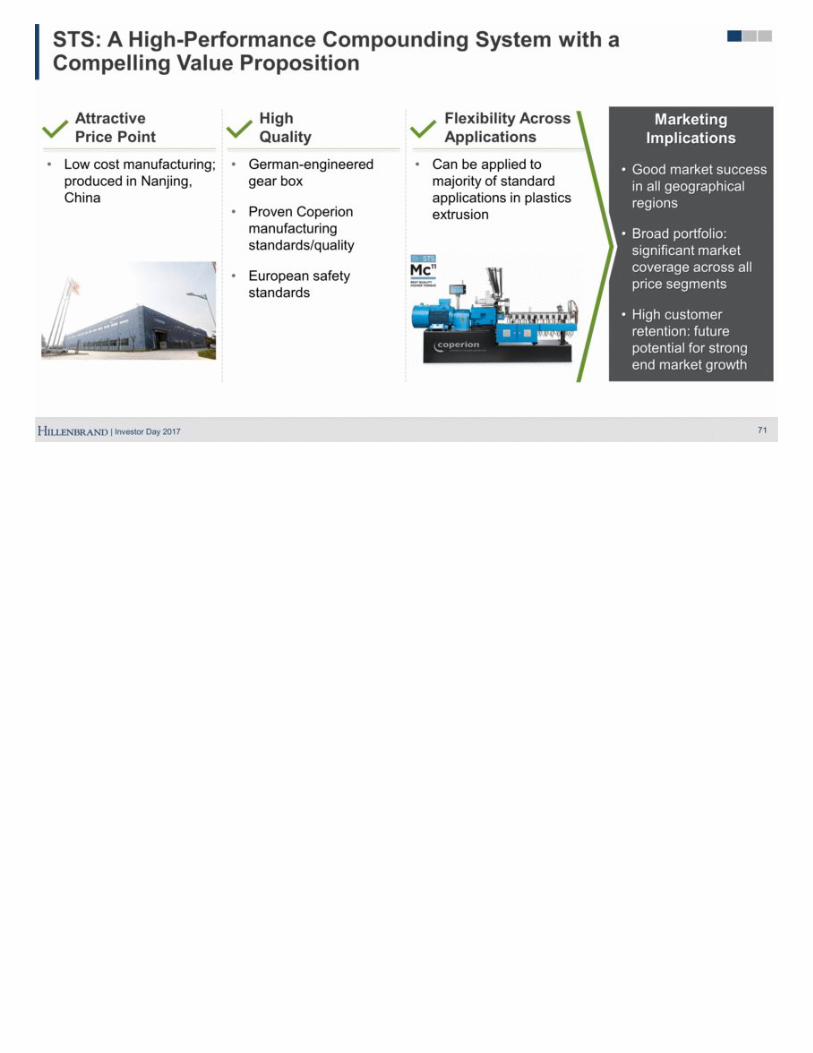
71 STS: A High-Performance Compounding System with a Compelling Value Proposition Low cost manufacturing; produced in Nanjing, China Attractive Price Point German-engineered gear box Proven Coperion manufacturing standards/quality European safety standards High Quality Can be applied to majority of standard applications in plastics extrusion Flexibility Across Applications Marketing Implications Good market success in all geographical regions Broad portfolio: significant market coverage across all price segments High customer retention: future potential for strong end market growth
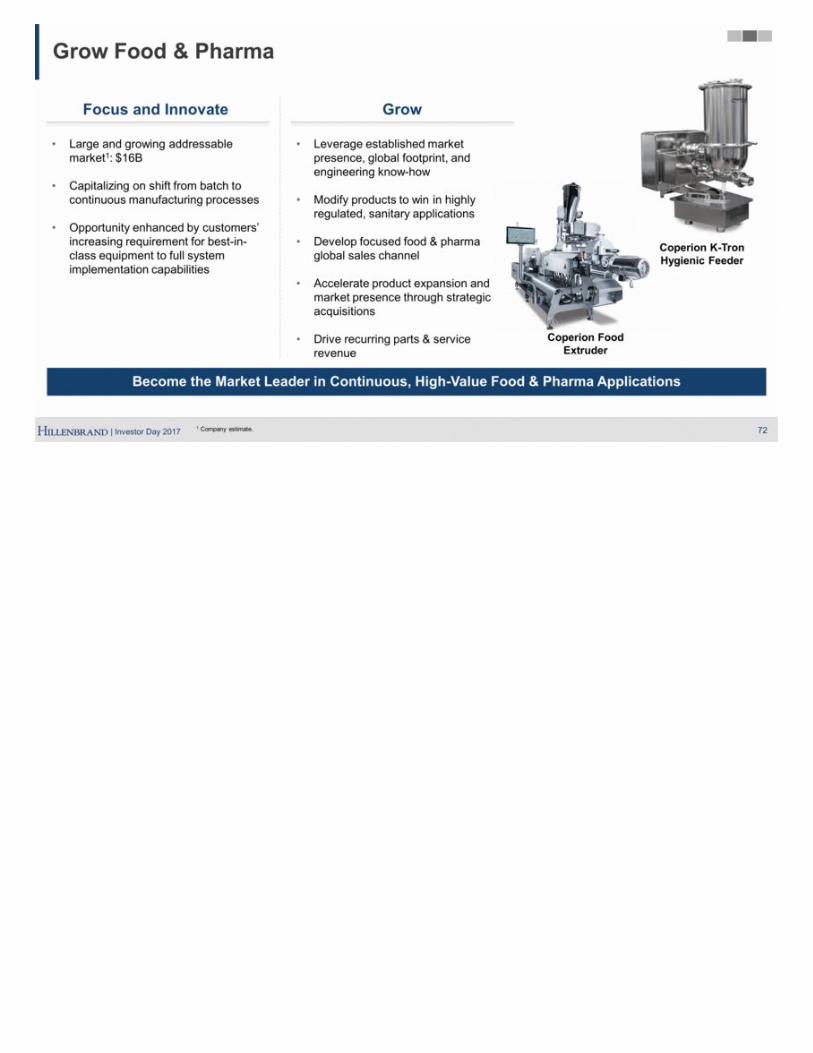
72 Become the Market Leader in Continuous, High-Value Food & Pharma Applications Grow Food & Pharma Coperion K-Tron Hygienic Feeder Coperion Food Extruder Large and growing addressable market1: $16B Capitalizing on shift from batch to continuous manufacturing processes Opportunity enhanced by customers’ increasing requirement for best-in-class equipment to full system implementation capabilities Leverage established market presence, global footprint, and engineering know-how Modify products to win in highly regulated, sanitary applications Develop focused food & pharma global sales channel Accelerate product expansion and market presence through strategic acquisitions Drive recurring parts & service revenue Focus and Innovate Grow 1 Company estimate.
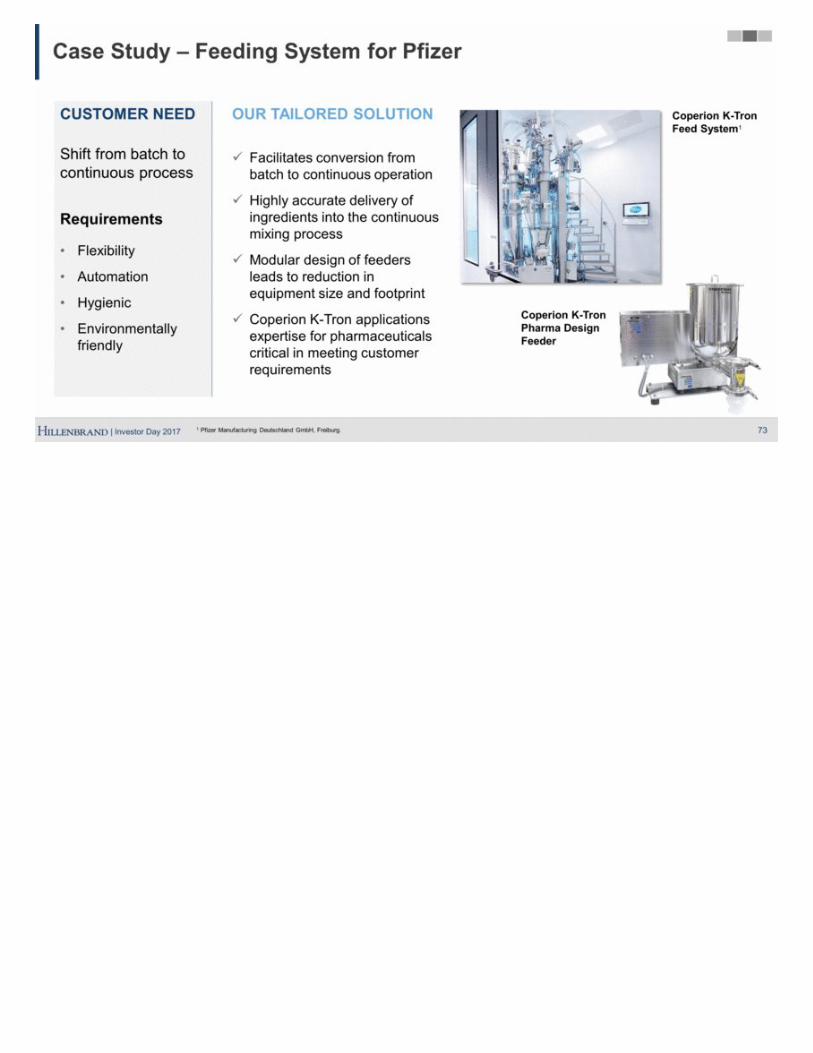
Case Study – Feeding System for Pfizer 73 CUSTOMER NEED Shift from batch to continuous process Requirements Flexibility Automation Hygienic Environmentally friendly Coperion K-Tron Feed System1 Coperion K-Tron Pharma Design Feeder OUR TAILORED SOLUTION Facilitates conversion from batch to continuous operation Highly accurate delivery of ingredients into the continuous mixing process Modular design of feeders leads to reduction in equipment size and footprint Coperion K-Tron applications expertise for pharmaceuticals critical in meeting customer requirements 1 Pfizer Manufacturing Deutschland GmbH, Freiburg.
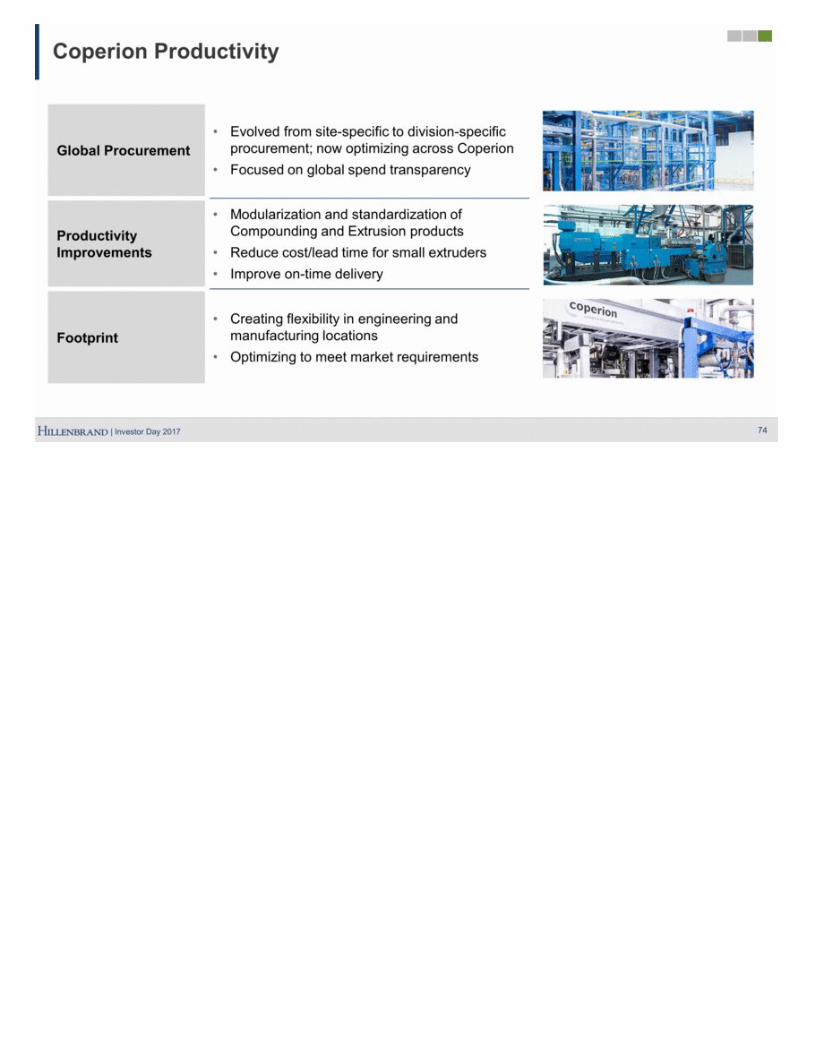
74 Coperion Productivity Global Procurement Evolved from site-specific to division-specific procurement; now optimizing across Coperion Focused on global spend transparency Productivity Improvements Modularization and standardization of Compounding and Extrusion products Reduce cost/lead time for small extruders Improve on-time delivery Footprint Creating flexibility in engineering and manufacturing locations Optimizing to meet market requirements
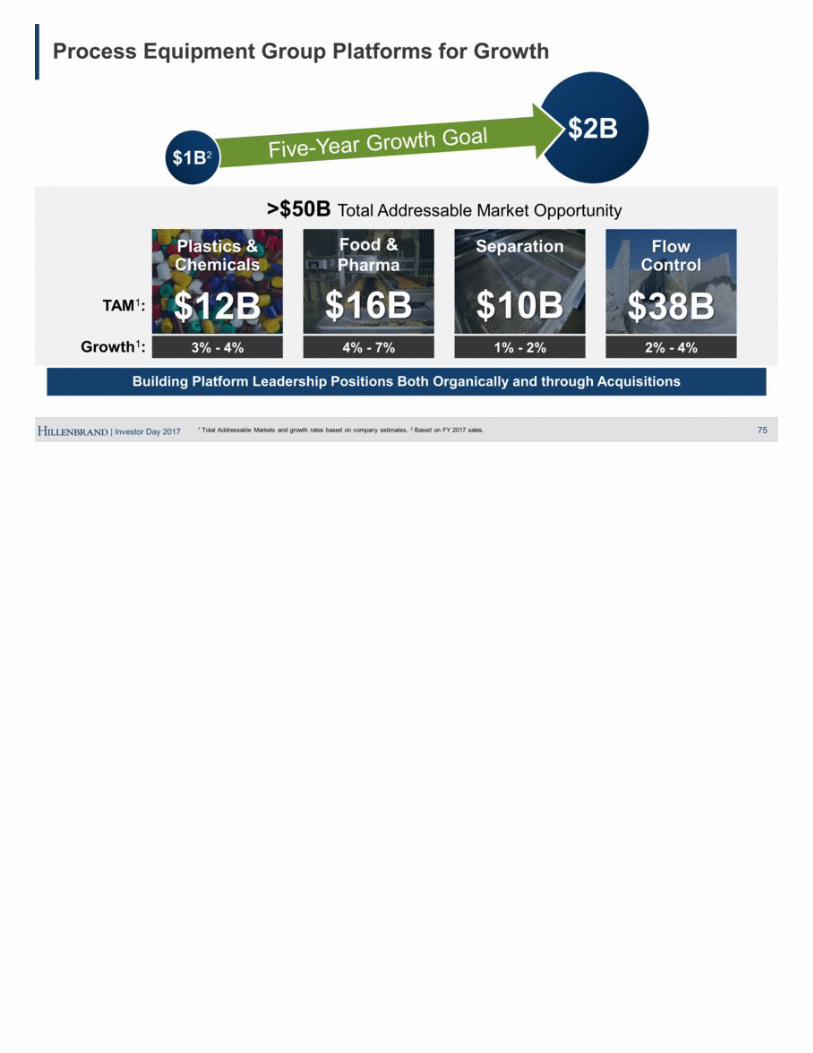
75 Building Platform Leadership Positions Both Organically and through Acquisitions Process Equipment Group Platforms for Growth $2B Five-Year Growth Goal $1B2 Flow Control $38B 2% - 4% Plastics & Chemicals $12B 3% - 4% Separation $10B 1% - 2% Food & Pharma $16B 4% - 7% Growth1: TAM1: >$50B Total Addressable Market Opportunity 1 Total Addressable Markets and growth rates based on company estimates. 2 Based on FY 2017 sales.
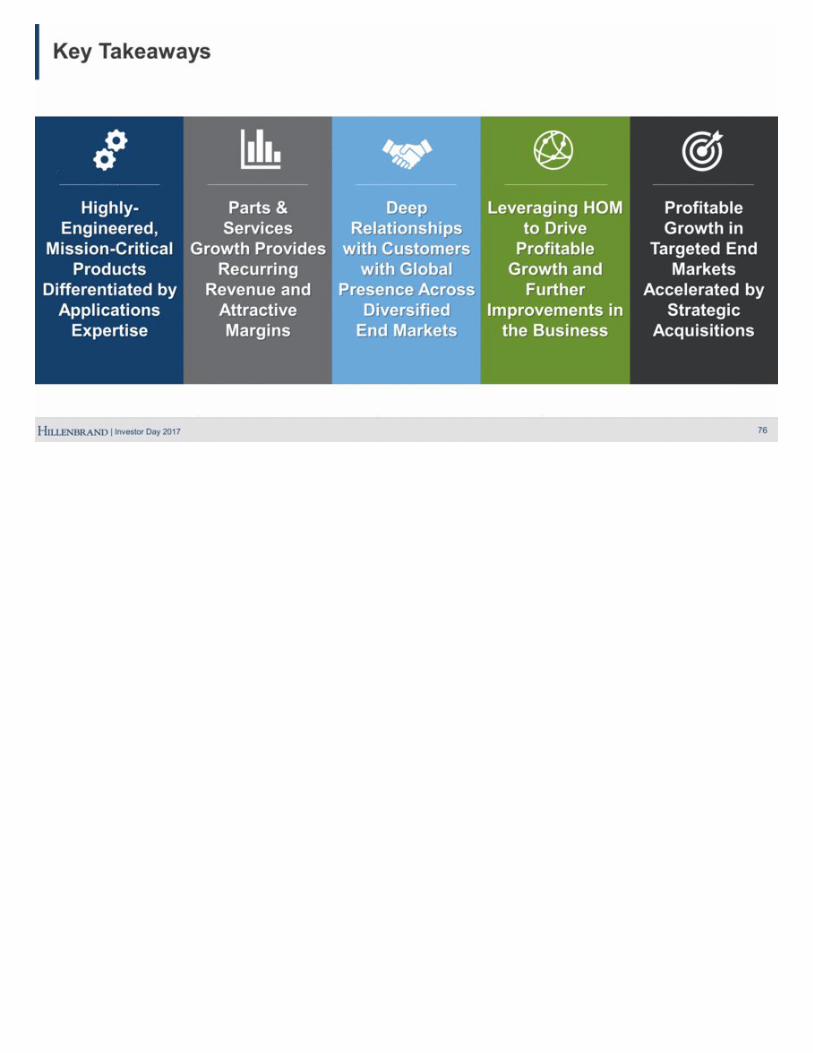
Key Takeaways 76 Parts & Services Growth Provides Recurring Revenue and Attractive Margins Deep Relationships with Customers with Global Presence Across Diversified End Markets Profitable Growth in Targeted End Markets Accelerated by Strategic Acquisitions Leveraging HOM to Drive Profitable Growth and Further Improvements in the Business Highly-Engineered, Mission-Critical Products Differentiated by Applications Expertise
Financial Overview Kristina Cerniglia CFO
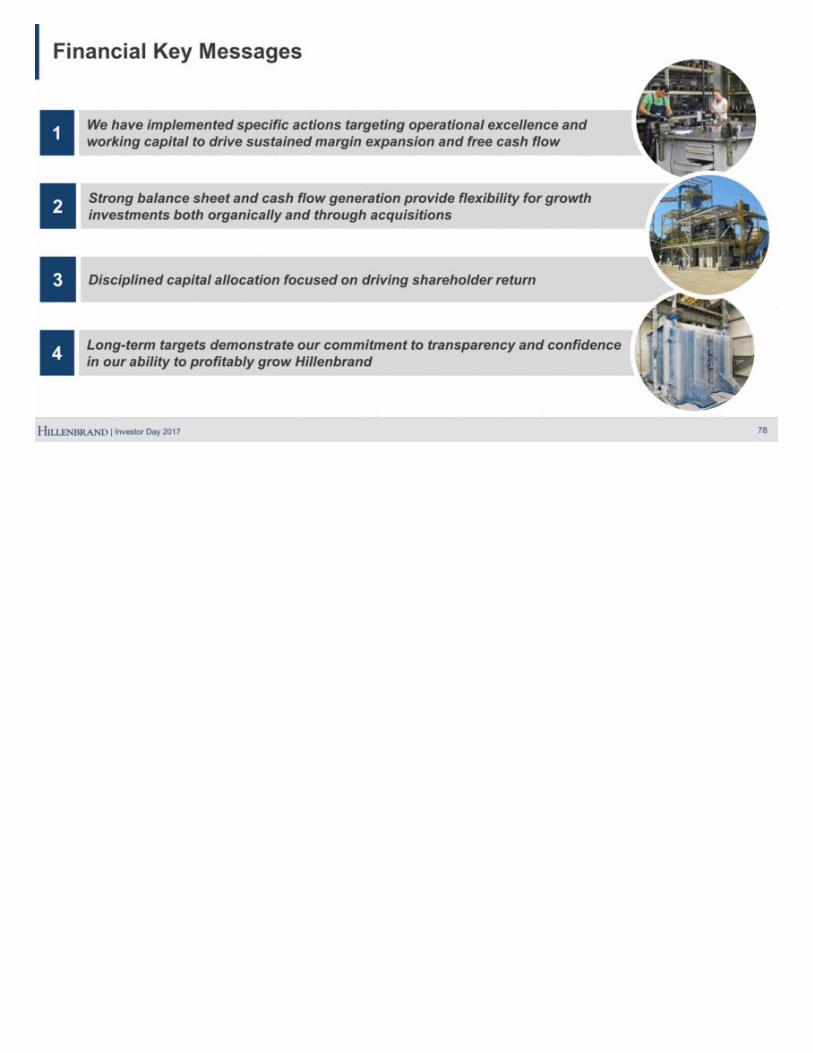
Disciplined capital allocation focused on driving shareholder return 3 Financial Key Messages 78 We have implemented specific actions targeting operational excellence and working capital to drive sustained margin expansion and free cash flow 1 Strong balance sheet and cash flow generation provide flexibility for growth investments both organically and through acquisitions 2 Long-term targets demonstrate our commitment to transparency and confidence in our ability to profitably grow Hillenbrand 4
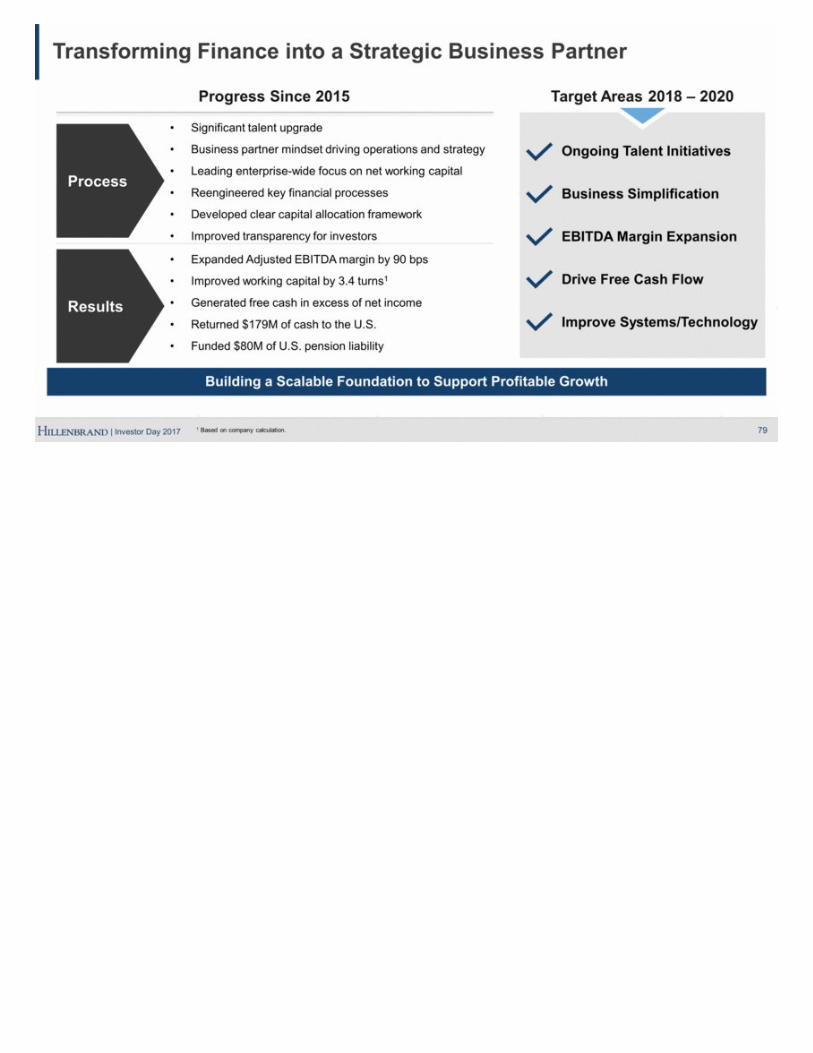
79 Building a Scalable Foundation to Support Profitable Growth Transforming Finance into a Strategic Business Partner Progress Since 2015 Process Results Significant talent upgrade Business partner mindset driving operations and strategy Leading enterprise-wide focus on net working capital Reengineered key financial processes Developed clear capital allocation framework Improved transparency for investors Expanded Adjusted EBITDA margin by 90 bps Improved working capital by 3.4 turns1 Generated free cash in excess of net income Returned $179M of cash to the U.S. Funded $80M of U.S. pension liability Ongoing Talent Initiatives Business Simplification EBITDA Margin Expansion Drive Free Cash Flow Improve Systems/Technology Target Areas 2018 – 2020 1 Based on company calculation.
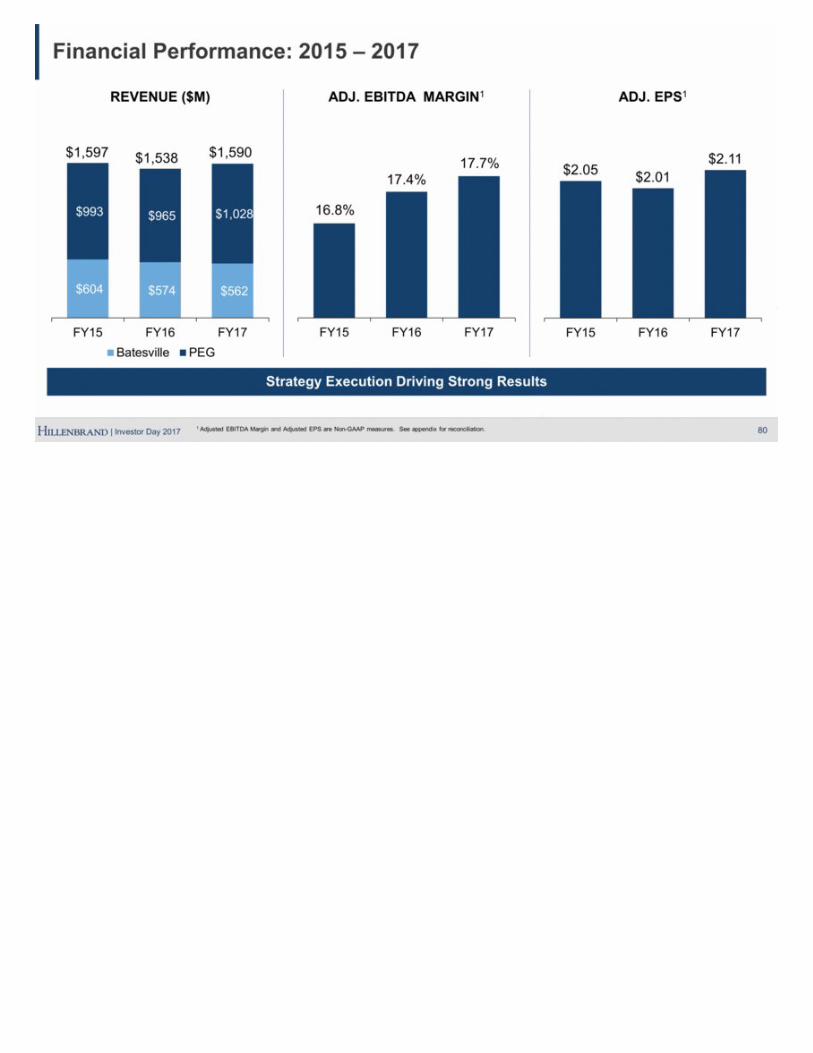
Financial Performance: 2015 – 2017 80 Strategy Execution Driving Strong Results REVENUE ($M) ADJ. EPS1 ADJ. EBITDA MARGIN1 $1,597 $1,538 $1,590 1 Adjusted EBITDA Margin and Adjusted EPS are Non-GAAP measures. See appendix for reconciliation. $604 $574 $562 $993 $965 $1,028 FY15 FY16 FY17 Batesville PEG $2.05 $2.01 $2.11 FY15 FY16 FY17 16.8% 17.4% 17.7% FY15 FY16 FY17
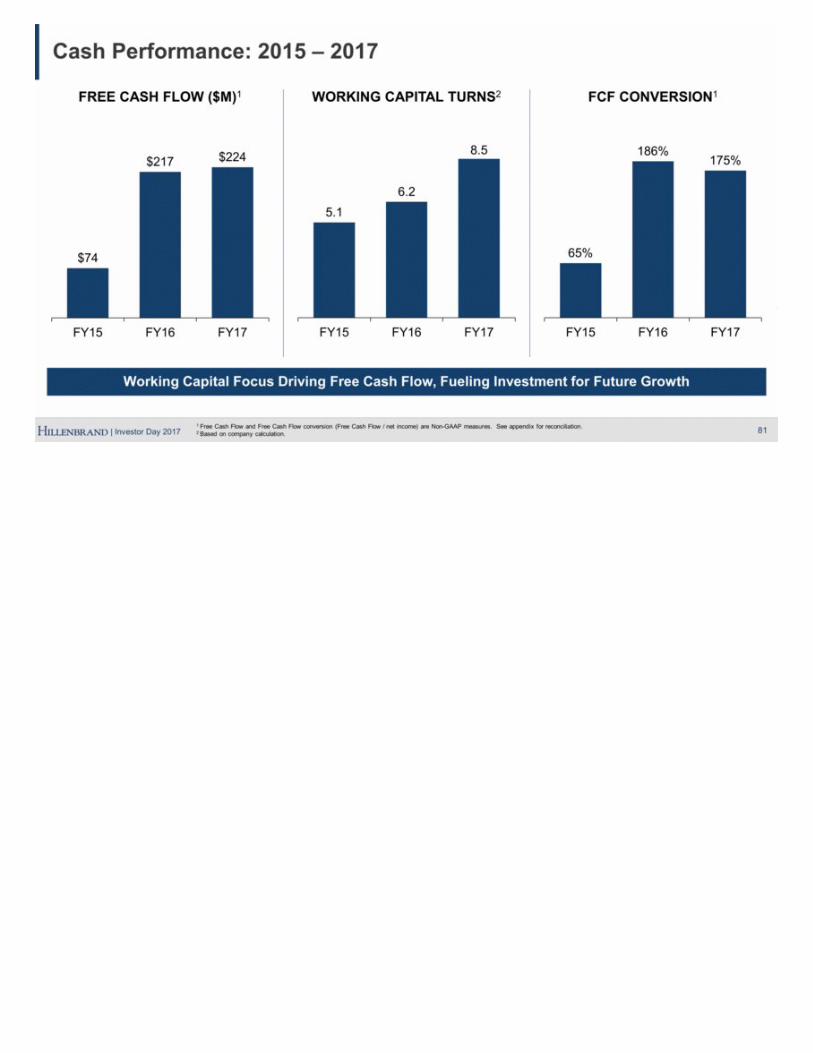
81 Working Capital Focus Driving Free Cash Flow, Fueling Investment for Future Growth Cash Performance: 2015 – 2017 FREE CASH FLOW ($M)1 WORKING CAPITAL TURNS2 FCF CONVERSION1 1 Free Cash Flow and Free Cash Flow conversion (Free Cash Flow / net income) are Non-GAAP measures. See appendix for reconciliation. 2 Based on company calculation. 65% 186% 175% FY15 FY16 FY17 $74 $217 $224 FY15 FY16 FY17 5.1 6.2 8.5 FY15 FY16 FY17
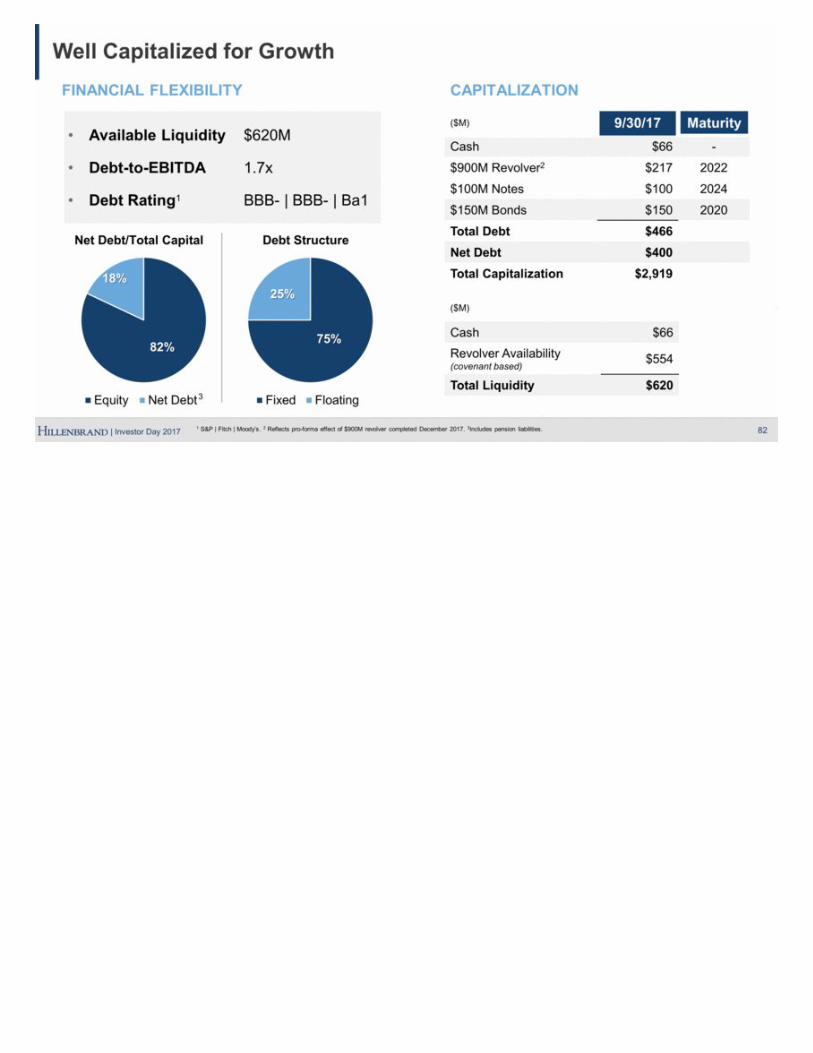
Well Capitalized for Growth 82 CAPITALIZATION ($M) 9/30/17 Maturity Cash $66 - $900M Revolver2 $217 2022 $100M Notes $100 2024 $150M Bonds $150 2020 Total Debt $466 Net Debt $400 Total Capitalization $2,919 ($M) Cash $66 Revolver Availability (covenant based) $554 Total Liquidity $620 Available Liquidity $620M Debt-to-EBITDA 1.7x Debt Rating1 BBB- BBB- Ba1 FINANCIAL FLEXIBILITY Net Debt/Total Capital Debt Structure 3 1 S&P Fitch Moody’s. 2 Reflects pro-forma effect of $900M revolver completed December 2017. 3Includes pension liabilities.
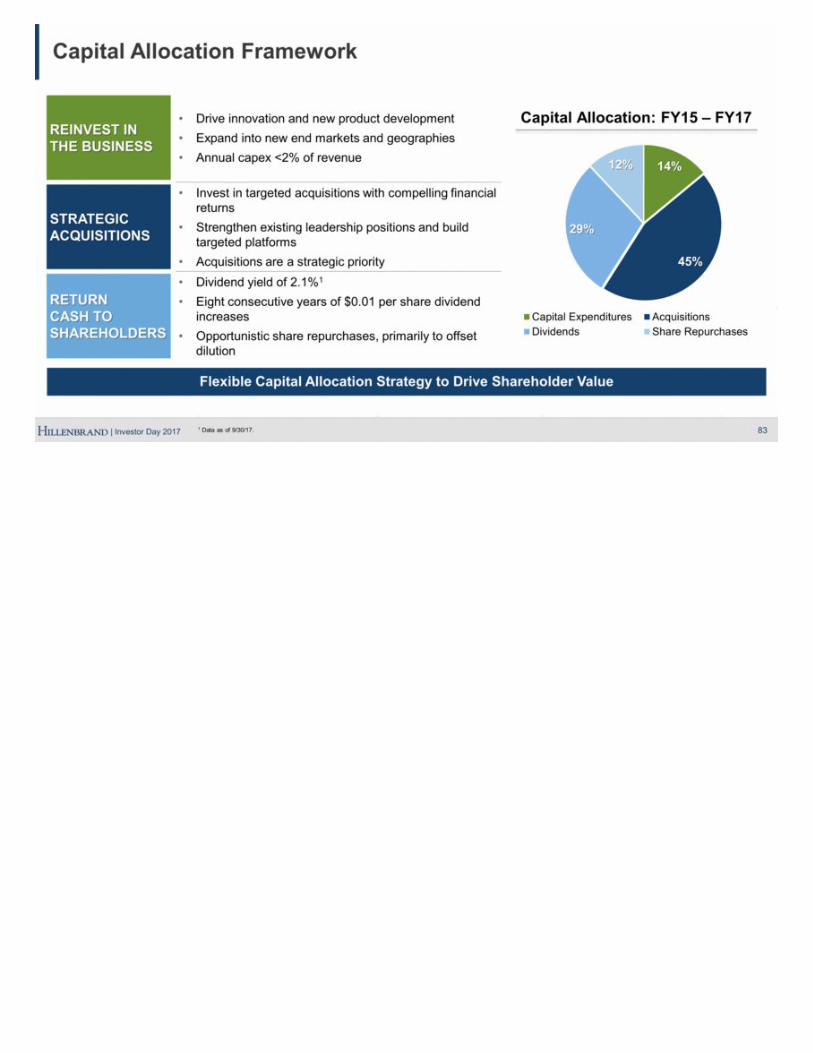
Capital Allocation: FY15 – FY17 Capital Allocation Framework 83 Flexible Capital Allocation Strategy to Drive Shareholder Value REINVEST IN THE BUSINESS Drive innovation and new product development Expand into new end markets and geographies Annual capex <2% of revenue STRATEGIC ACQUISITIONS Invest in targeted acquisitions with compelling financial returns Strengthen existing leadership positions and build targeted platforms Acquisitions are a strategic priority RETURN CASH TO SHAREHOLDERS Dividend yield of 2.1%1 Eight consecutive years of $0.01 per share dividend increases Opportunistic share repurchases, primarily to offset dilution 1 Data as of 9/30/17.
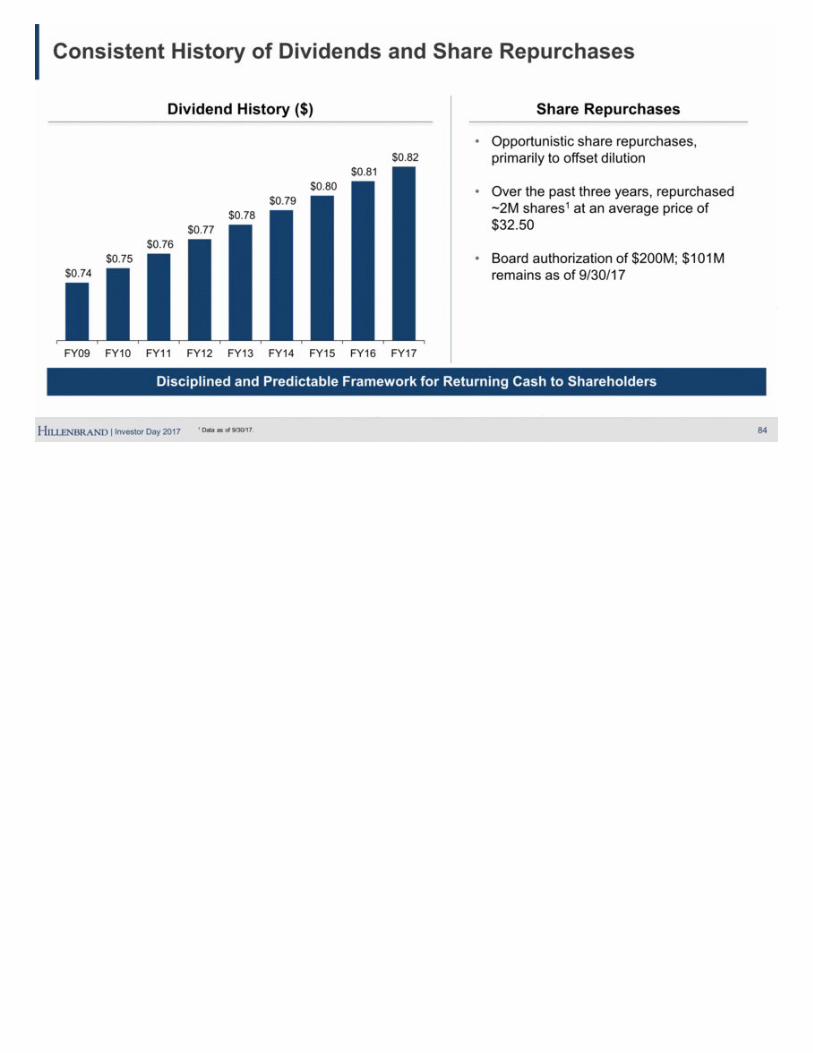
84 Consistent History of Dividends and Share Repurchases Opportunistic share repurchases, primarily to offset dilution Over the past three years, repurchased ~2M shares1 at an average price of $32.50 Board authorization of $200M; $101M remains as of 9/30/17 Dividend History ($) Share Repurchases Disciplined and Predictable Framework for Returning Cash to Shareholders 1 Data as of 9/30/17. $0.74 $0.75 $0.76 $0.77 $0.78 $0.79 $0.80 $0.81 $0.82 FY09 FY10 FY11 FY12 FY13 FY14 FY15 FY16 FY17
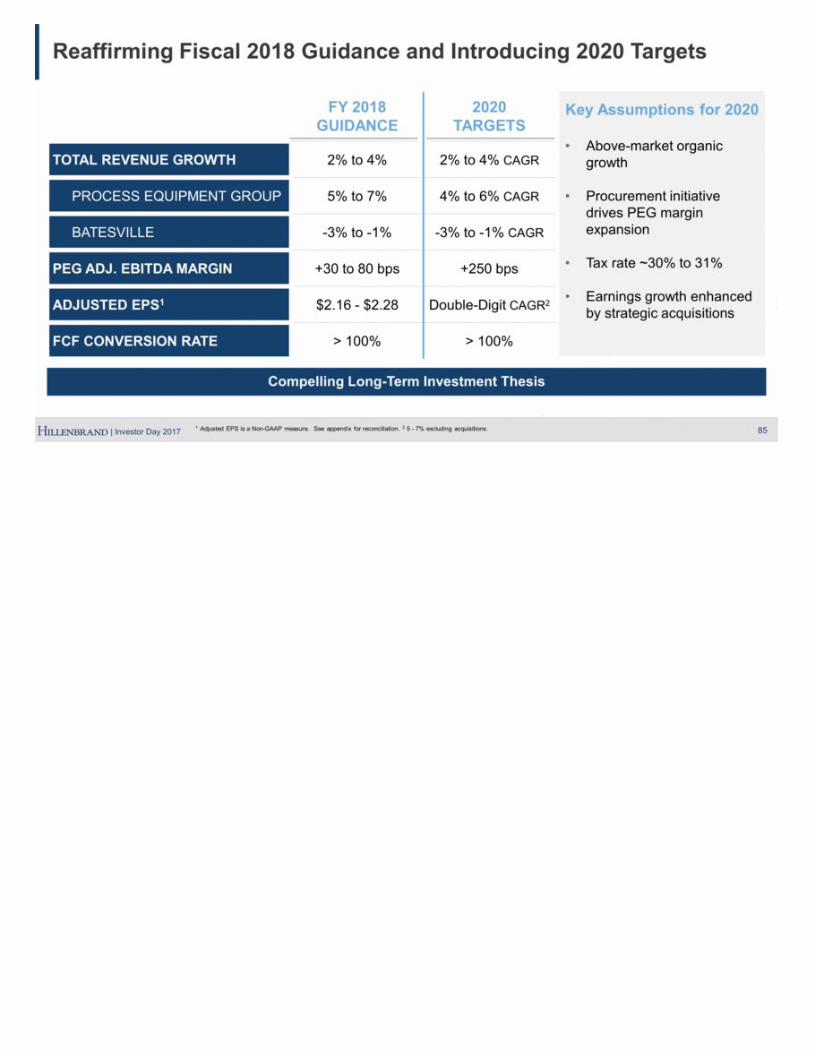
Reaffirming Fiscal 2018 Guidance and Introducing 2020 Targets 85 Compelling Long-Term Investment Thesis FY 2018 GUIDANCE 2020 TARGETS TOTAL REVENUE GROWTH 2% to 4% 2% to 4% CAGR PROCESS EQUIPMENT GROUP 5% to 7% 4% to 6% CAGR BATESVILLE -3% to -1% -3% to -1% CAGR PEG ADJ. EBITDA MARGIN +30 to 80 bps +250 bps ADJUSTED EPS1 $2.16 - $2.28 Double-Digit CAGR2 FCF CONVERSION RATE > 100% > 100% Key Assumptions for 2020 Above-market organic growth Procurement initiative drives PEG margin expansion Tax rate ~30% to 31% Earnings growth enhanced by strategic acquisitions 1 Adjusted EPS is a Non-GAAP measure. See appendix for reconciliation. 2 5 - 7% excluding acquisitions.
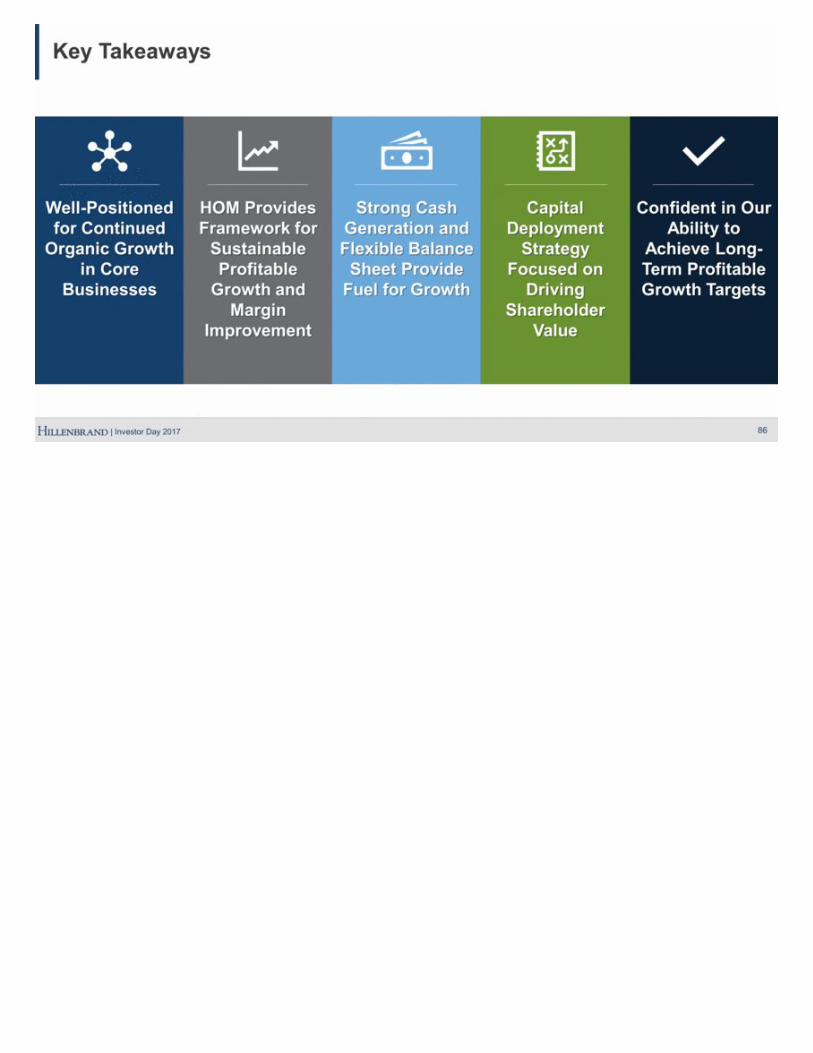
Key Takeaways 86 HOM Provides Framework for Sustainable Profitable Growth and Margin Improvement Strong Cash Generation and Flexible Balance Sheet Provide Fuel for Growth Confident in Our Ability to Achieve Long-Term Profitable Growth Targets Capital Deployment Strategy Focused on Driving Shareholder Value Well-Positioned for Continued Organic Growth in Core Businesses

Closing Remarks Joe Raver President & CEO
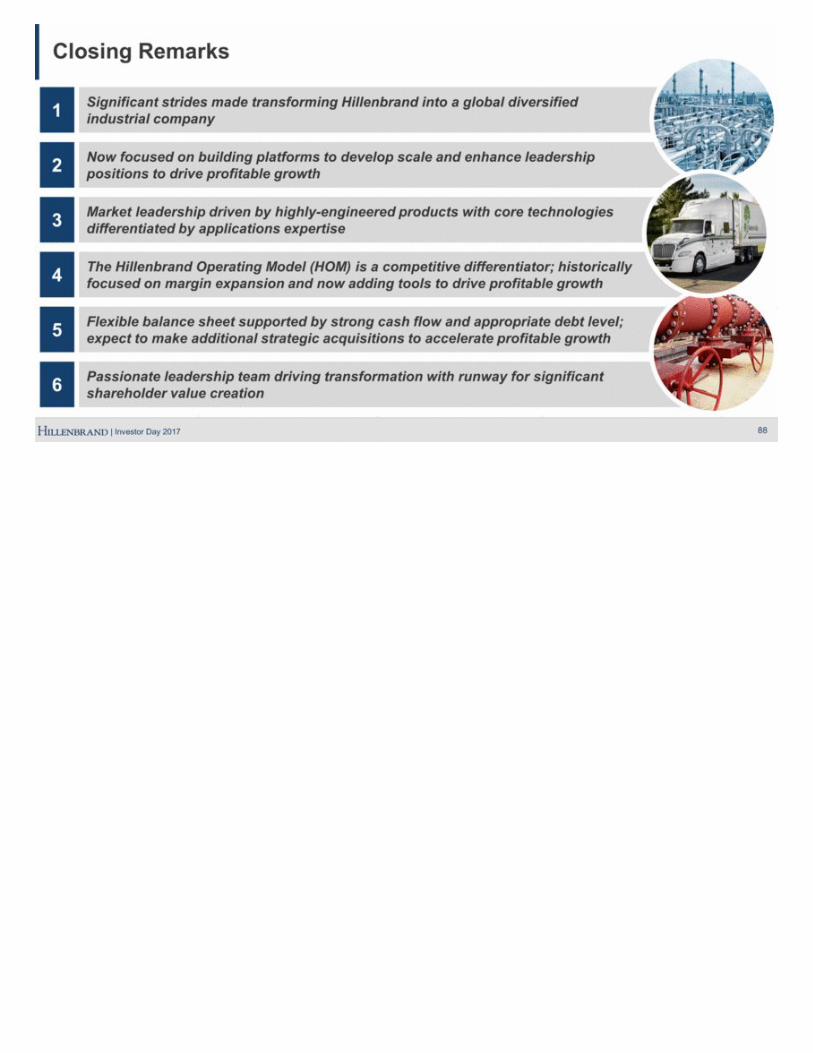
Closing Remarks 88 Significant strides made transforming Hillenbrand into a global diversified industrial company 1 Now focused on building platforms to develop scale and enhance leadership positions to drive profitable growth 2 Market leadership driven by highly-engineered products with core technologies differentiated by applications expertise 3 The Hillenbrand Operating Model (HOM) is a competitive differentiator; historically focused on margin expansion and now adding tools to drive profitable growth 4 Flexible balance sheet supported by strong cash flow and appropriate debt level; expect to make additional strategic acquisitions to accelerate profitable growth 5 Passionate leadership team driving transformation with runway for significant shareholder value creation 6

Q&A

Appendix
Disclosure Regarding Non-GAAP Measures While we report financial results in accordance with accounting principles generally accepted in the United States (GAAP), we also provide certain non-GAAP operating performance measures. These non-GAAP measures are referred to as “adjusted” and exclude expenses associated with backlog amortization, inventory step-up, business acquisition and integration, restructuring and restructuring related charges, and trade name impairment. The related income tax for all of these items is also excluded. This non-GAAP information is provided as a supplement, not as a substitute for, or as superior to, measures of financial performance prepared in accordance with GAAP. One important non-GAAP measure that we use is adjusted earnings before interest, income tax, depreciation, and amortization (“adjusted EBITDA”). A part of our strategy is to selectively acquire companies that we believe can benefit from our core competencies to spur faster and more profitable growth. Given that strategy, it is a natural consequence to incur related expenses, such as amortization from acquired intangible assets and additional interest expense from debt-funded acquisitions. Accordingly, we use adjusted EBITDA, among other measures, to monitor our business performance. Free cash flow (FCF) is defined as cash flow from operations less capital expenditures. Management considers FCF an important indicator of its liquidity, as well as its ability to fund future growth and to provide a return to shareholders. FCF does not include deductions for debt service (repayments of principal), other borrowing activity, dividends on the company’s common stock, repurchases of the company’s common stock, business acquisitions, and other items. Another important non-GAAP operational measure used is backlog. Backlog is not a term recognized under GAAP; however, it is a common measurement used in industries with extended lead times for order fulfillment (long-term contracts), like those in which our Process Equipment Group competes. Order backlog represents the amount of consolidated revenue that we expect to realize oncontracts awarded related to the Process Equipment Group. Backlog includes expected revenue from large systems and equipment, as well as replacement parts, components, and service. Given that there is no GAAP financial measure comparable to backlog, a quantitative reconciliation is not provided. We use this non-GAAP information internally to make operating decisions and believe it is helpful to investors because it allows more meaningful period-to-period comparisons of our ongoing operating results. The information can also be used to perform trend analysis and to better identify operating trends that may otherwise be masked or distorted by these types of items. The Company believes this information provides a higher degree of transparency. 91
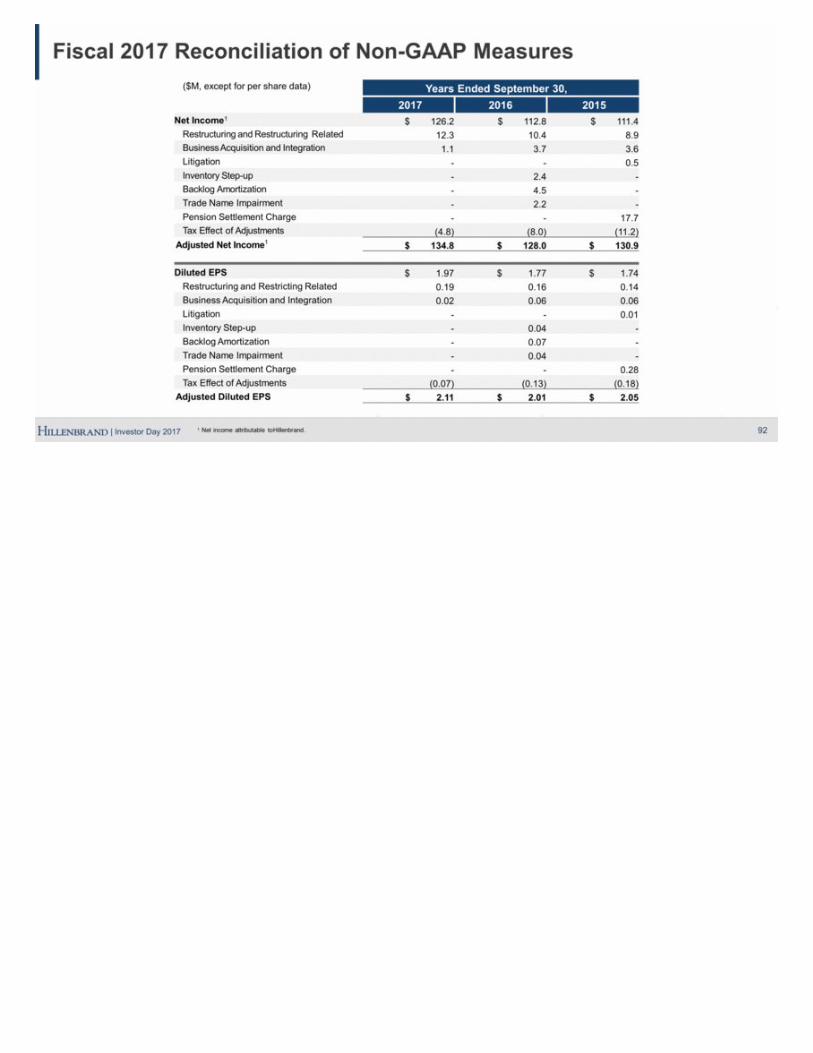
Fiscal 2017 Reconciliation of Non-GAAP Measures 92 ($M, except for per share data) Years Ended September 30, 2017 2016 2015 Net Income1 $ 126.2 $ 112.8 $ 111.4 Restructuring and Restructuring Related 12.3 10.4 8.9 Business Acquisition and Integration 1.1 3.7 3.6 Litigation - - 0.5 Inventory Step-up - 2.4 - Backlog Amortization - 4.5 - Trade Name Impairment - 2.2 - Pension Settlement Charge - - 17.7 Tax Effect of Adjustments (4.8) (8.0) (11.2) Adjusted Net Income1 $ 134.8 $ 128.0 $ 130.9 Diluted EPS $ 1.97 $ 1.77 $ 1.74 Restructuring and Restricting Related 0.19 0.16 0.14 Business Acquisition and Integration 0.02 0.06 0.06 Litigation - - 0.01 Inventory Step-up - 0.04 - Backlog Amortization - 0.07 - Trade Name Impairment - 0.04 - Pension Settlement Charge - - 0.28 Tax Effect of Adjustments (0.07) (0.13) (0.18) Adjusted Diluted EPS $ 2.11 $ 2.01 $ 2.05 1 Net income attributable to Hillenbrand.
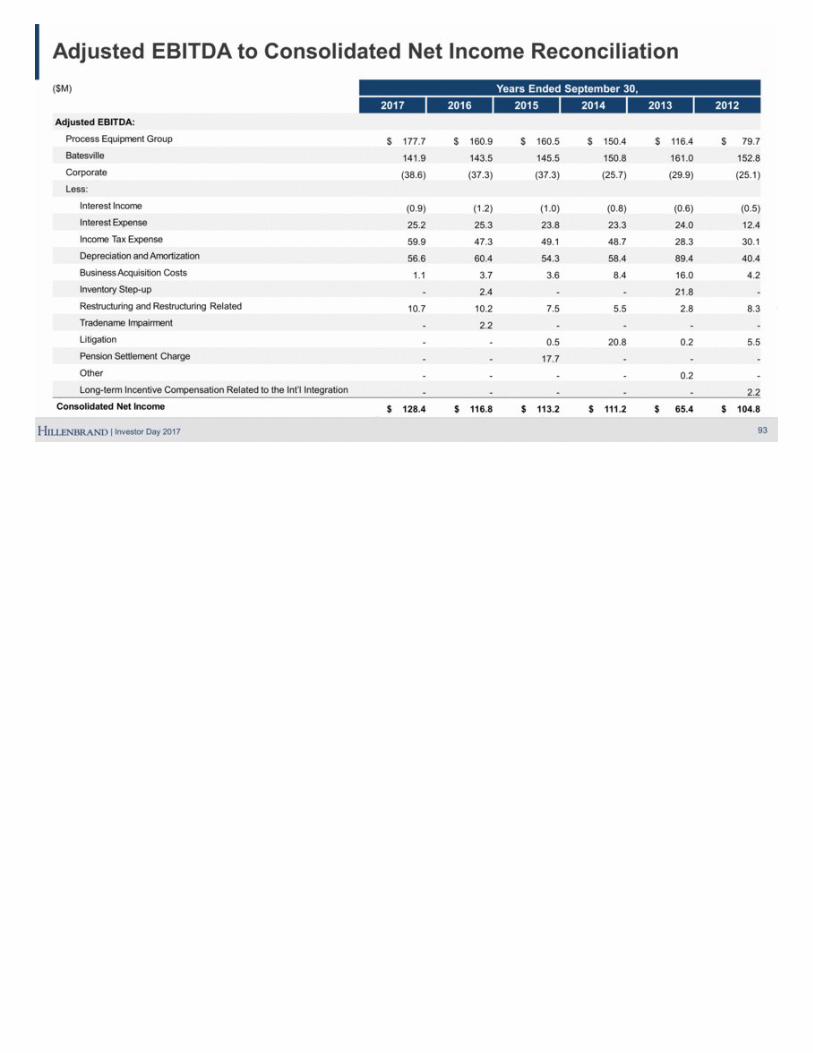
Adjusted EBITDA to Consolidated Net Income Reconciliation 93 ($M) Years Ended September 30, 2017 2016 2015 2014 2013 2012 Adjusted EBITDA: Process Equipment Group $ 177.7 $ 160.9 $ 160.5 $ 150.4 $ 116.4 $ 79.7 Batesville 141.9 143.5 145.5 150.8 161.0 152.8 Corporate (38.6) (37.3) (37.3) (25.7) (29.9) (25.1) Less: Interest Income (0.9) (1.2) (1.0) (0.8) (0.6) (0.5) Interest Expense 25.2 25.3 23.8 23.3 24.0 12.4 Income Tax Expense 59.9 47.3 49.1 48.7 28.3 30.1 Depreciation and Amortization 56.6 60.4 54.3 58.4 89.4 40.4 Business Acquisition Costs 1.1 3.7 3.6 8.4 16.0 4.2 Inventory Step-up - 2.4 - - 21.8 - Restructuring and Restructuring Related 10.7 10.2 7.5 5.5 2.8 8.3 Tradename Impairment - 2.2 - - - - Litigation - - 0.5 20.8 0.2 5.5 Pension Settlement Charge - - 17.7 - - - Other - - - - 0.2 - Long-term Incentive Compensation Related to the Int’l Integration - - - - - 2.2 Consolidated Net Income $ 128.4 $ 116.8 $ 113.2 $ 111.2 $ 65.4 $ 104.8
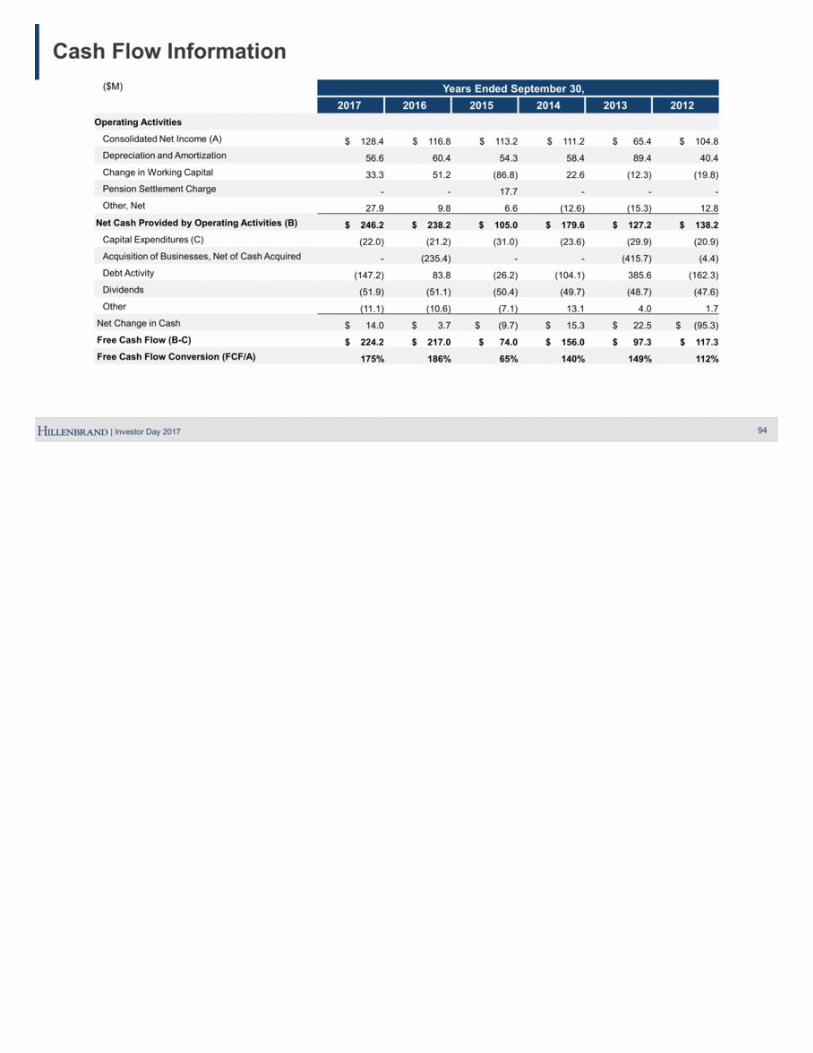
94 Cash Flow Information ($ in millions) ($M) Years Ended September 30, 2017 2016 2015 2014 2013 2012 Operating Activities Consolidated Net Income (A) $ 128.4 $ 116.8 $ 113.2 $ 111.2 $ 65.4 $ 104.8 Depreciation and Amortization 56.6 60.4 54.3 58.4 89.4 40.4 Change in Working Capital 33.3 51.2 (86.8) 22.6 (12.3) (19.8) Pension Settlement Charge - - 17.7 - - - Other, Net 27.9 9.8 6.6 (12.6) (15.3) 12.8 Net Cash Provided by Operating Activities (B) $ 246.2 $ 238.2 $ 105.0 $ 179.6 $ 127.2 $ 138.2 Capital Expenditures (C) (22.0) (21.2) (31.0) (23.6) (29.9) (20.9) Acquisition of Businesses, Net of Cash Acquired - (235.4) - - (415.7) (4.4) Debt Activity (147.2) 83.8 (26.2) (104.1) 385.6 (162.3) Dividends (51.9) (51.1) (50.4) (49.7) (48.7) (47.6) Other (11.1) (10.6) (7.1) 13.1 4.0 1.7 Net Change in Cash $ 14.0 $ 3.7 $ (9.7) $ 15.3 $ 22.5 $ (95.3) Free Cash Flow (B-C) $ 224.2 $ 217.0 $ 74.0 $ 156.0 $ 97.3 $ 117.3 Free Cash Flow Conversion (FCF/A) 175% 186% 65% 140% 149% 112%

95 FY18 EPS Guidance ($ in millions) EPS Guidance Range FY18 GAAP EPS $2.11 – $2.23 Restructuring & Related Charges $0.05 – $0.05 FY18 Adjusted EPS $2.16 – $2.28
Biographies 96 JOE RAVER President and Chief Executive Officer Joe Raver is President and CEO, Hillenbrand, Inc. He has served as President of the Process Equipment Group since 2011, and is a member of Hillenbrand’s Board of Directors. Joe has spent 18 years in various key positions with Hillenbrand including President of Batesville. Before that he held the position of VP and General Manager of the Respiratory Care Division at the former parent company, Hill-Rom. From 1994 until 2004, he held various leadership roles with Batesville. Joe sits on several national boards, including the Manufacturers Alliance for Productivity and Innovation’s (MAPI) board of trustees and the National Association of Manufacturers (NAM) board of directors. He is currently a member of Applied Industrial Technologies, Inc.’s (NYSE: AIT) board of directors. Joe holds an MBA in marketing and strategy from the Kellogg School of Management at Northwestern University, and a bachelor’s degree in economics from Dartmouth College.
Biographies 97 KRISTINA CERNIGLIA Senior Vice President and Chief Financial Officer Kristina Cerniglia is SVP and CFO, leading the Company’s finance organization, overseeing financial planning and analysis, reporting, tax, treasury, investor relations, and internal audit. She also oversees Hillenbrand's enterprise information systems department, ensuring increased accessibility to data while supporting business needs and objectives. Kristina plays a critical role in shaping Hillenbrand’s strategy, as well as leading the company’s engagement with investors and analysts. She has more than 25 years of financial experience. Before assuming the role as Hillenbrand’s CFO, she served as VP and corporate controller at Stanley Black & Decker. She also spent nine years at United Technologies in various financial roles. Kristina has a bachelor’s degree in finance from Bentley University in Waltham, MA.
Biographies 98 JIM HOOVEN Vice President, Hillenbrand Operating Model Jim Hooven is VP of the Hillenbrand Operating Model. Jim has over 20 years of experience with diversified industrial manufacturing companies. He most recently served as general manager of the MTI Torque Systems division of Handy & Hartman. Prior to that, he served as VP of operational excellence at SL Industries (purchased by Handy & Harman in 2016) and served in various roles within Danaher and Trane from 1997 to 2010. Mr. Hooven received his MBA from Rider University, as well as a bachelor’s degree in international business from Johnson & Wales University.
Biographies 99 CHRIS TRAINOR President, Batesville Chris Trainor was named President of Batesville in September 2015, after serving as SVP, CFO and Chief Administrative Officer. Chris joined Batesville in 2010 as VP and CFO and was later assigned additional responsibilities for oversight of HR and IT. Prior to joining Batesville, he spent 17 years with Kraft Foods where he held a variety of finance roles in both the U.S. and U.K. Chris serves on several boards including the Funeral Service Foundation, ICCFA Education Foundation, and Mary Margaret Health Foundation. Chris obtained his MBA from the University of Liverpool, England.
Biographies 100 KIM RYAN President, Coperion Kim Ryan is President Coperion and SVP, Hillenbrand, Inc. She has served as President since 2015. Kim has spent 28 years in various key positions with Hillenbrand and its former parent company Hill-Rom, including the President of Batesville from 2011-2015. Prior to that, she held the position of SVP, Post Acute Care Division at Hill-Rom from 2003-2011. From 1989 until 2003, she held leadership roles with Batesville in accounting, strategy, logistics and information technology. Kim is currently a member of the board of Kimball (NASDAQ: KBAL) and is a member of the Audit Committee of the board. She holds a BBA in accounting from Iowa State University.
Biographies 101 DIANE BOHMAN Senior Vice President, Strategy & Corporate Development Diane Bohman is SVP, Strategy & Corporate Development. Prior to this role, Diane served as SVP and Chief Administrative Officer and SVP, Integration for Hillenbrand. Other prior roles include VP, Logistics; VP and CFO; and VP, Strategy, for Batesville from 2005 to 2011. Prior to this, Diane worked for seven years at Hill-Rom holding a broad array of positions in the finance organization. She began her career in the business assurance practice of Coopers & Lybrand. Diane is the former treasurer and former board member for the Hoosier Trails Council of the Boy Scouts of America. She currently sits on the Margaret Mary Health Foundation Board. Diane is a CPA and holds a bachelor’s degree in business with a concentration in accounting from the Indiana University Kelley School of Business.
Biographies 102 NICHOLAS FARRELL Vice President, General Counsel and Secretary & Chief Compliance Officer Nicholas Farrell is VP, General Counsel and Secretary & Chief Compliance Officer, Hillenbrand. Prior to this, he served as the Company’s VP, associate general counsel and assistant secretary. Nicholas joined Hillenbrand in 2011, after six years in private practice with Troutman Sanders in Atlanta, GA. He serves on the boards for nonprofit organization Cincinnati Therapeutic Riding and Horsemanship. Nicholas attained a Bachelor of Arts degree from Wake Forest University and a JD from Vanderbilt University Law School.
Biographies 103 GLENNIS WILLIAMS Senior Vice President and Chief HR Officer Glennis Williams is SVP and Chief HR Officer. Glennis most recently served as VP, Global HR for Welbilt in New Port Richey, FL. Prior to that, she worked for Joy Global as VP of HR and for Westinghouse Electric as an HR leader. Glennis received her Business Administration degree from Idaho State University and her MBA from the University of Phoenix.
Exhibit99.2
HillenbrandHosts2017InvestorDay
BATESVILLE,Ind.,Dec.12,2017—/PRNewswire/ —Hillenbrand, Inc. (NYSE: HI) will hold its investor day today in New York City, with presentations givenby Joe Raver, President and Chief Executive Officer, Kristina Cerniglia, Senior Vice President and Chief Financial Officer, and other senior executives.Management will present its growth strategy and provide an in-depth review of its Batesville and Process Equipment Group segments and the HillenbrandOperating Model. In addition, the company is introducing fiscal 2020 financial targets and will reaffirm its 2018 guidance. “We look forward to sharing more with the investor community about the progress we have made in transforming Hillenbrand to a global diversified industrialcompany,” said Joe Raver. “We have expanded our portfolio and leveraged the Hillenbrand Operating Model to achieve sustainable margin expansion. Our journeycontinues as we focus on building platforms to develop scale and enhance leadership positions to drive profitable growth through the execution of our strategy.” Introduces2020FinancialTargets Hillenbrand is introducing fiscal 2020 financial targets, specifically:
· Organic Revenue Growth: 2% to 4% CAGR
· Process Equipment Group: Up 4% to 6% CAGR
· Batesville: Down 1% to 3% CAGR
· Process Equipment Group Adjusted EBITDA Margin: + 250 bps
· Adjusted EPS: Double digit CAGR(1) ReaffirmsFiscal2018Guidance The Company is also reaffirming its 2018 guidance:
· Organic Revenue Growth: 2% to 4%
· Process Equipment Group: Up 5% to 7%
· Batesville: Down 1% to 3%
· GAAP EPS: $2.11 to $2.23
· Adjusted EPS: $2.16 to $2.28
(1) 5-7% excluding acquisitions
“We believe we will achieve our vision of being a world-class global industrial company by investing in targeted areas close to our core businesses both organicallyand through strategic acquisitions,” said Kristina Cerniglia. “As we continue to execute our strategy, we are confident in our ability to achieve our long-termprofitable growth targets.” EventWebcastDetails The presentation will begin at 9:00 a.m. (ET) and is expected to conclude at approximately 12:15 p.m. The public may access the event through a live webcastavailable on the Investor Relations section of Hillenbrand’s website. The conference is also available by dialing the following numbers: Webcastlink: https://www.webcaster4.com/Webcast/Page/359/23760 (archived through Tuesday, February 27, 2018) ConferenceCallInformation(Audioonly) Date/Time: 9:00 a.m. ET, Tuesday, December 12, 2017Dial-In for U.S. and Canada: 1-669-900-6833Dial-In for International: +1-646-558-8656Conference call ID number: 214 991 793 Throughout this release, we make a number of forward-looking statements within the meaning of the Private Securities Litigation Reform Act of 1995. As thewords imply, forward-looking statements are statements about the future, as contrasted with historical information. Our forward-looking statements are based onassumptions and current expectations of future events that we believe are reasonable, but by their very nature they are subject to a wide range of risks. If ourassumptions prove inaccurate or unknown risks and uncertainties materialize, actual results could vary materially from Hillenbrand’s expectations and projections. Words that could indicate that we are making forward-looking statements include the following:
intend believe plan expect may goal wouldbecome pursue estimate will forecast continue couldtargets encourage promise improve progress potential should
This is not an exhaustive list. Our intent is to provide examples of how readers might identify forward-looking statements. The absence of any of these words,however, does not mean that the statement is not forward-looking. Hereisthekeypoint: Forward-lookingstatementsarenotguaranteesoffutureperformance,andouractualresultscoulddiffermateriallyfromthosesetforthinanyforward-lookingstatements. Any number of factors, many of which are beyond our control, could cause our performance to differ significantly from what isdescribed in the forward-looking statements. These factors include, but are not limited to: the outcome of any legal proceedings that may be instituted againstHillenbrand, or any companies we may acquire; risks that an acquisition disrupts current operations or poses potential difficulties in employee retention orotherwise affects financial or operating results; the ability to recognize the benefits of an acquisition, including potential synergies and cost savings or the failure ofan acquired company to achieve its plans and objectives generally; global market and economic conditions, including those related to the credit markets; volatilityof our investment portfolio; adverse foreign currency fluctuations; involvement in claims, lawsuits and governmental proceedings related to operations; labordisruptions; the dependence of our business units on relationships with several large providers; increased costs or unavailability of raw materials; continuedfluctuations in mortality rates and increased cremations; competition from nontraditional sources in the death care industry; cyclical demand for industrial capitalgoods; certain tax-related matters; and
changes to legislation, regulation, treaties or government policy resulting from the current political environment. For a more in-depth discussion of these and otherfactors that could cause actual results to differ from those contained in forward-looking statements, see the discussions under the heading “Risk Factors” inPart I, Item 1A of Hillenbrand’s Form 10-K for the year ended September 30, 2017. The company assumes no obligation to update or revise any forward-lookinginformation.
-30- AboutHillenbrandHillenbrand (www.hillenbrand.com) is a global diversified industrial company with multiple market-leading brands that serve a wide variety of industries acrossthe globe. We pursue profitable growth and robust cash generation in order to drive increased value for our shareholders. Hillenbrand’s portfolio is composed oftwo business segments: the Process Equipment Group and Batesville. The Process Equipment Group businesses design, develop, manufacture and service highlyengineered industrial equipment around the world. Batesville is a recognized leader in the North American death care industry. Hillenbrand is publicly traded onthe NYSE under “HI”. CONTACT Chris Gordon, Director, Investor RelationsPhone: 812-931-5001Email: [email protected] Tory Flynn, Director, CommunicationsPhone: 812-931-5024Email: [email protected]