Embed Size (px)
Citation preview
ISMR
www.nseindia.com
1 Securities Market in India - An overview
Securities Market in India – An Overview
IntroductionThis publication reviews the reforms and other market developments in the securities market
in India during April 2003 to June 2004. As a result of the reforms/initiatives taken by the
Government and the Regulators, the market microstructure has been refined and modernized.
The investment choices for the investors have also broadened. The securities market moved
from T+3 settlement period to T+2 rolling settlement with effect from April 1, 2003. Further,
straight through processing has been made mandatory for all institutional trades executed on
the stock exchange. Real time gross settlement has also been introduced by RBI to settle
inter-bank transactions online at real time mode. These reforms along with other market
developments have been discussed in detail in the following chapters. This chapter, however,
takes a general review of the stock market developments. These developments in the securities
market provide the necessary impetus for growth and development, and thereby strengthen
the emerging market economy in India.
Products and ParticipantsMobilization of savings from surplus savers to deficit savers is most efficiently carried out
by the securities market through a range of complex products called “securities”. The
definition of securities as per the SCRA, 1956 includes shares, bonds, scrips, stocks or other
marketable securities of like nature in or of any incorporate company or body corporate,
government securities, derivatives of securities, units of collective investment scheme, interest
and rights in securities, security receipt or any other instruments so declared by the central
government.
The securities market has essentially three categories of participants, viz., the issuer of
securities, investors in securities and the intermediaries. The issuers are the borrowers or deficit
savers, who issue securities to raise funds. The investors , who are surplus savers, deploy their
savings by subscribing to these securities. The intermediaries are the agents who match the
needs of users and suppliers of funds for a commission. These intermediaries pack and unpack
securities to help both the issuers and investors to achieve their respective goals. There are a
large variety and number of intermediaries providing various services in the Indian securities
market (Table 1-1).
This process of mobilization of resources is carried out under the supervision
and overview of the regulators. The regulators develop fair market practices and regulate the
conduct of issuers of securities and the intermediaries. They are also in charge of protecting
the interests of the investors. The regulator ensures a high service standard from
the intermediaries and supply of quality securities and non-manipulated demand for them in
the market.

www.nseindia.com
Securities Market in India - An overview 2ISMR
Table 1-1: Market Participants in Securities Market
Market Participants Number as on March 31
2003 2004
Securities Appellate Tribunal 1 1
Regulators* 4 4
Depositories 2 2
Stock Exchanges
With Equities Trading 23 23
With Debt Market Segment 1 1
With Derivative Trading 2 2
Brokers 9,519 9,368
Corporate Brokers 3,835 3,746
Sub-brokers 13,291 12,815
FIIs 502 540
Portfolio Managers 54 60
Custodians 11 11
Share Transfer Agents 143 78
Primary Dealers 19 18
Merchant Bankers 124 123
Bankers to an Issue 67 55
Debenture Trustees 35 34
Underwriters 43 47
Venture Capital Funds 43 45
Foreign Venture Capital Investors 6 9
Mutual Funds 38 37
Collective Investment Schemes 5 —
* DCA, DEA, RBI & SEBI.
Source: SEBI Bulletin.
Market SegmentsThe securities market has two interdependent segments: the primary and the secondary
market. The primary market is the channel for creation of new securities. These securities
are issued by public limited companies or by government agencies. In the primary market
the resources are mobilized either through the public issue or through private placement
route. It is a public issue if anybody and everybody can subscribe for it, whereas if the
issue is made available to a selected group of persons it is termed as private placement.
There are two major types of issuers of securities, the corporate entities who issue mainly
debt and equity instruments and the government (central as well as state) who issue debt
securities.
These new securities issued in the primary market are traded in the secondary market.
The secondary market enables participants who hold securities to adjust their holdings in
response to changes in their assessment of risks and returns. The secondary market operates
through two mediums, namely, the over-the-counter (OTC) market and the exchange-traded

ISMR
www.nseindia.com
3 Securities Market in India - An overview
market. OTC markets are informal markets where trades are negotiated. Most of the trades in
the government securities are in the OTC market. All the spot trades where securities are
traded for immediate delivery and payment take place in the OTC market. The other option is
to trade using the infrastructure provided by the stock exchanges. There are 23 exchanges in
India and all of them follow a systematic settlement period. All the trades taking place over a
trading cycle (day=T) are settled together after a certain time (T+2 day).
The trades executed on the National Stock Exchange (NSE) are cleared and settled by a
clearing corporation. The clearing corporation acts as a counterparty and guarantees settlement.
Nearly 100% of the trades in capital market segment are settled through demat delivery. NSE
also provides a formal trading platform for trading of a wide range of debt securities , including
government securities. A variant of the secondary market is the forward market, where securities
are traded for future delivery and payment. A variant of the forward market is Futures and
Options market. Presently only two exchanges viz., NSE and Stock Exchange, Mumbai (BSE)
provides trading in the derivatives of securities.
International ScenarioFollowing the implementation of reforms in the securities industry during the last decade,
Indian stock markets have graduated to a better position vis-à-vis the securities market in
developed and emerging markets. As may be seen from Table 1-2, India has a turnover ratio,
which is comparable to the other developed market, and also one of the highest in the
emerging markets. At the end of 2003, Standard and Poor’s (S&P) ranked India 17th in terms of
market capitalization (19th in 2002), 16th in terms of total value traded in stock exchanges
(17th in 2002) and 6th in terms of turnover ratio (7th in 2002). India has the number one
ranking in terms of listed securities on the Exchanges followed by the USA. These data,
though quite impressive, do not reflect the full Indian market, as S&P (even other international
publications) does not cover the whole market. For example, India has more than 9000
listed companies at the end of March 2004, while S&P considers only 5,644 companies.
If whole market were taken into consideration, India’s position vis-à-vis other countries would
be much better.
Table 1-2: International Comparison: end December 2003
Particulars USA UK Japan Germany Singapore Hongkong China India
No. of listed Companies 5,295 2,311 3,116 684 475 1,029 1,296 5,644
Market Capitalisation ($ Bn.) 14,266 2,412 3,041 1,079 145 715 681 279
Market Capitalisation Ratio (%) 139.8 159.7 70.3 57.5 168.4 426.4 55.2 56.4
Turnover ($ Mn.) 15,547 2,151 2,273 1,147 88 332 477 285
Turnover Ratio (%) 122.8 100.6 88.0 130.0 71.1 56.3 83.3 138.5
Source: S&P Emerging Stock Market Factbook, 2004
A comparative study of concentration of market indices and indices stocks in different
world markets is presented in the table below. It is seen that the index stocks’ share of
total market capitalisation in India is 75.0% whereas US index accounted for 93.8%.
The ten largest index stocks share of total market capitalisation is 36.5% in India and 16.4%
in case of US.

www.nseindia.com
Securities Market in India - An overview 4ISMR
Market Concentration in the World Index as on End 2003(In Percent)
Market Index Stocks Share of 10 largest Index Stocks’Total Market Capitalization Share of Total Market Capitalization
Japan 99.2 20.4
Singapore 91.2 57.9
France 89.5 42.2
Germany 83.6 44.6
Italy 95.5 55.9
United Kingdom 94.3 43.6
United States 93.8 16.4
India 75.0 36.5
The stock markets worldwide have grown in size as well as depth over last one decade.
As can be observed from Table 1-3, the turnover on all markets taken together have grown
from US $ 5.5 trillion in 1990 to $ 38 trillion in 2002 when it reached a peak. Thereafter, it has
witnessed a decline and stood at US $ 29.6 trillion in 2003. It is significant to note that US
alone accounted for about 52.4% of worldwide turnover in 2003. Despite having a large number
of companies listed on its stock exchanges, India accounted for a meagre 0.96% in total world
turnover in 2003. The market capitalization of all listed companies taken together on all markets
stood at US $ 31 trillion in 2003 ($ 23 trillion in 2002). The share of US in worldwide market
capitalisation decreased from 47.24% as at end-2002 to 44.66% in end-2003, while Indian listed
companies accounted for 0.87% of total market capitalisation in 2003.
Table 1-3: Market Capitalisation and Turnover for Major Markets(US $ million)
Country/Region Market Capitalisation Turnover(end of period)
2001 2002 2003 2001 2002 2003
Developed Markets 25,242,989 20,957,836 28,290,981 39,676,018 36,098,731 26,743,153
Australia 374,269 380,969 585,475 240,667 294,658 369,845
Japan 2,251,814 2,126,075 3,040,665 1,826,230 1,573,279 2,272,989
UK 2,217,324 1,864,134 2,412,434 1,871,894 2,721,342 2,150,753
USA 13,810,429 11,052,403 14,266,266 29,040,739 25,371,270 15,547,431
All Emerging Markets 2,556,979 2,439,080 3,656,722 2,404,321 2,499,768 2,896,144
China 523,952 463,080 681,204 448,928 333,369 476,813
India 110,396 131,011 279,093 249,298 197,118 284,802
Indonesia 23,006 29,991 54,659 9,667 13,042 14,774
Korea 220,046 249,639 329,616 711,192 826,620 682,706
Malaysia 120,007 123,872 168,376 20,772 27,623 50,135
Philippines 41,523 39,021 23,565 3,148 3,103 2,635
Taiwan 292,621 261,474 379,023 544,808 631,931 592,012
World Total 27,799,968 23,396,916 31,947,703 42,080,339 38,598,498 29,639,297
US as % of World 49.68 47.24 44.66 69.01 65.73 52.46
India as % of World 0.40 0.56 0.87 0.59 0.51 0.96
Source: S&P Emerging Stock Market Factbook, 2004
ISMR
www.nseindia.com
5 Securities Market in India - An overview
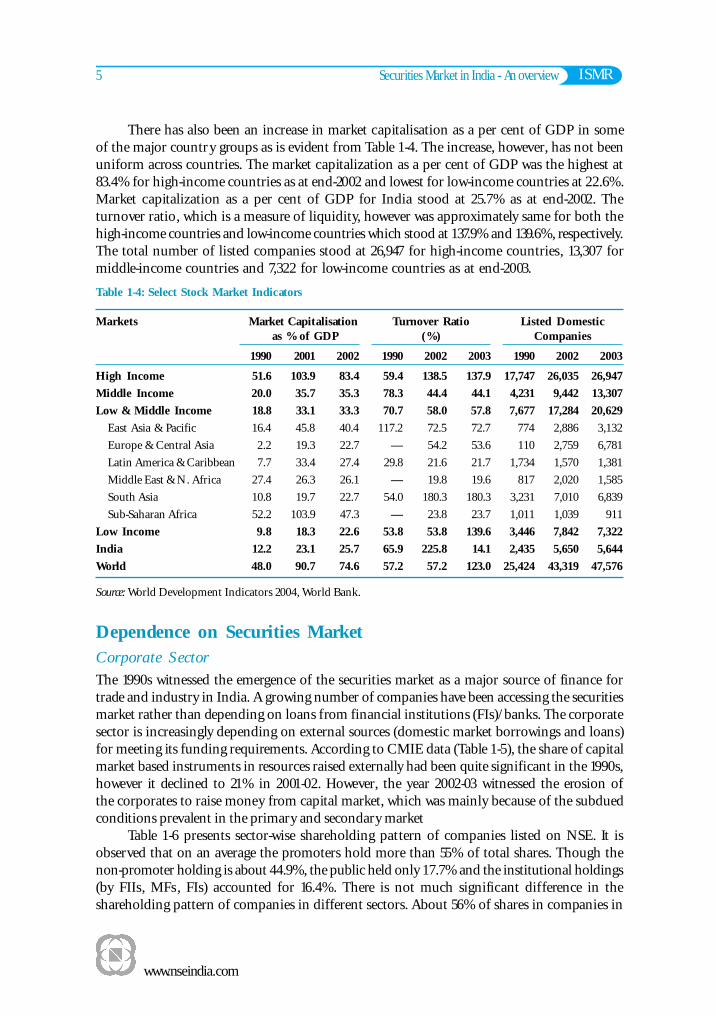
There has also been an increase in market capitalisation as a per cent of GDP in some
of the major country groups as is evident from Table 1-4. The increase, however, has not been
uniform across countries. The market capitalization as a per cent of GDP was the highest at
83.4% for high-income countries as at end-2002 and lowest for low-income countries at 22.6%.
Market capitalization as a per cent of GDP for India stood at 25.7% as at end-2002. The
turnover ratio, which is a measure of liquidity, however was approximately same for both the
high-income countries and low-income countries which stood at 137.9% and 139.6%, respectively.
The total number of listed companies stood at 26,947 for high-income countries, 13,307 for
middle-income countries and 7,322 for low-income countries as at end-2003.
Table 1-4: Select Stock Market Indicators
Markets Market Capitalisation Turnover Ratio Listed Domestic as % of GDP (%) Companies
1990 2001 2002 1990 2002 2003 1990 2002 2003
High Income 51.6 103.9 83.4 59.4 138.5 137.9 17,747 26,035 26,947
Middle Income 20.0 35.7 35.3 78.3 44.4 44.1 4,231 9,442 13,307
Low & Middle Income 18.8 33.1 33.3 70.7 58.0 57.8 7,677 17,284 20,629
East Asia & Pacific 16.4 45.8 40.4 117.2 72.5 72.7 774 2,886 3,132
Europe & Central Asia 2.2 19.3 22.7 — 54.2 53.6 110 2,759 6,781
Latin America & Caribbean 7.7 33.4 27.4 29.8 21.6 21.7 1,734 1,570 1,381
Middle East & N. Africa 27.4 26.3 26.1 — 19.8 19.6 817 2,020 1,585
South Asia 10.8 19.7 22.7 54.0 180.3 180.3 3,231 7,010 6,839
Sub-Saharan Africa 52.2 103.9 47.3 — 23.8 23.7 1,011 1,039 911
Low Income 9.8 18.3 22.6 53.8 53.8 139.6 3,446 7,842 7,322
India 12.2 23.1 25.7 65.9 225.8 14.1 2,435 5,650 5,644
World 48.0 90.7 74.6 57.2 57.2 123.0 25,424 43,319 47,576
Source: World Development Indicators 2004, World Bank.
Dependence on Securities MarketCorporate Sector
The 1990s witnessed the emergence of the securities market as a major source of finance for
trade and industry in India. A growing number of companies have been accessing the securities
market rather than depending on loans from financial institutions (FIs)/banks. The corporate
sector is increasingly depending on external sources (domestic market borrowings and loans)
for meeting its funding requirements. According to CMIE data (Table 1-5), the share of capital
market based instruments in resources raised externally had been quite significant in the 1990s,
however it declined to 21% in 2001-02. However, the year 2002-03 witnessed the erosion of
the corporates to raise money from capital market, which was mainly because of the subdued
conditions prevalent in the primary and secondary market
Table 1-6 presents sector-wise shareholding pattern of companies listed on NSE. It is
observed that on an average the promoters hold more than 55% of total shares. Though the
non-promoter holding is about 44.9%, the public held only 17.7% and the institutional holdings
(by FIIs, MFs, FIs) accounted for 16.4%. There is not much significant difference in the
shareholding pattern of companies in different sectors. About 56% of shares in companies in

www.nseindia.com
Securities Market in India - An overview 6ISMR
Petrochemicals sector are held by Indian promoters. The promoter holding is not strikingly
high in respect of companies in the IT sectors.
Table 1-5: Dependence on Securities Market
Year Share (%) of Securities Market in
External Finance of Fiscal Deficit of Fiscal Deficit of Financial SavingsCorporates Central Government State Government of Households
1990-91 19.35 17.9 13.6 14.4
1991-92 19.17 20.7 17.5 22.9
1992-93 33.38 9.2 16.8 17.2
1993-94 53.23 48.0 17.6 14.0
1994-95 44.99 35.2 14.7 12.1
1995-96 21.67 54.9 18.7 7.7
1996-97 22.12 30.0 17.5 6.9
1997-98 28.16 36.5 16.5 4.5
1998-99 27.05 60.9 14.1 4.2
1999-00 33.58 67.1 13.9 7.3
2000-01 31.39 61.4 13.8 4.3
2001-02 20.60 69.4 15.2 8.0
2002-03 (17.98) 77.6 19.9 5.9
2003-04 N . A. 64.9 32.1 N . A.
Source: CMIE & RBI.
Table 1-6 : Shareholding Pattern at the end of March 2004 of Companies Listed on NSE(In per cent)
Sectors Non-Pomoters’ HoldingPromoters’ Holding
Institutional Investors Non-Institutional Investors
FIs FIIs MFs Indian NRIs/ Private Others Indian Foreign PersonsPublic OCBs Corpo- Promo- Promo- Acting in
rate ters ters ConcertBodies
Finance 7.61 10.41 2.04 19.06 0.90 3.97 5.80 46.96 0.10 3.05
FMCG 11.18 10.58 1.12 20.75 0.43 1.42 0.14 13.82 40.43 0.14
Infrastructure 5.62 4.36 1.10 24.27 1.59 5.79 3.72 42.31 4.81 6.42
IT 3.07 10.94 2.16 27.57 2.04 13.34 7.89 28.27 2.69 2.03
Manufacturing 6.22 5.73 3.57 15.45 1.28 4.25 2.83 51.45 5.47 3.75
Media & Entertainment 5.45 11.06 2.77 17.62 0.57 5.49 0.74 51.77 3.96 0.56
Petrochemicals 6.42 2.91 2.75 18.45 0.98 4.42 4.00 56.62 1.33 2.13
Pharmaceuticals 5.40 7.86 2.17 26.93 3.92 5.00 3.48 37.83 5.67 1.75
Services 8.28 5.57 4.03 20.25 1.30 4.48 2.75 45.89 4.51 2.95
Telecommunication 4.42 8.69 2.32 5.09 0.86 1.67 24.51 48.56 3.03 0.86
Misc 9.55 2.62 3.53 20.08 2.47 7.74 5.86 37.35 6.70 4.10
All Companies 6.58 7.06 2.83 17.72 1.27 4.67 4.80 46.85 5.36 2.86
Governments
Due to the increase in fiscal deficits of the Governments, their dependence on market borrowings
to finance fiscal deficits has also increased over the years (Table 1-5). During the year 1990-91,

ISMR
www.nseindia.com
7 Securities Market in India - An overview
the state governments and the central government financed nearly 14% and 18%, respectively,
of their fiscal deficit by market borrowing. In percentage terms, dependence of the state
governments on market borrowing did not increase much during the decade as it ranged between
13.8% and 32.1%. In 2003-04, the state and the central government market borrowings financed
32.1% and 64.9% of the fiscal deficit respectively.
Households
According to the RBI data, household sector accounted for 85.6% of gross domestic savings
during 2002-03. They invested 41.5% of financial savings in deposits, 29.8% in insurance/
provident funds, 14.3% on small savings, and 5.9% in securities (out of which the investment
in Gilts has been 4.3%), including government securities and units of mutual funds during
2002-03 (Table 1-7). Thus the fixed income bearing instruments are the most preferred assets
of the household sector.
Table 1-7: Savings of Household Sector in Financial Assets(In per cent)
Financial Assets 1990-91 1991-92 1992-93 1993-94 1994-95 1995-96 1996-97 1997-98 1998-99 1999-00 2000-01 2001-02 2002-03 (P)
Currency 10.6 12.0 8.2 12.2 10.9 13.3 8.6 7.4 10.4 8.6 6.4 9.5 8.5
Fixed Income 74.9 65.1 74.6 73.9 77.0 79.1 84.5 88.0 85.3 84.2 89.4 82.4 85.6Investments
Deposits 33.3 28.9 42.5 42.6 45.5 42.5 48.1 46.6 39.2 39.2 44.3 37.9 41.5
Insurance/ 28.4 28.6 27.2 25.4 22.5 29.2 29.4 30.1 33.3 34.0 33.5 33.4 29.8
Provident/
Pension Funds
Small Savings 13.2 7.6 4.9 5.9 9.0 7.4 7.0 11.3 12.8 11 11.6 11.1 14.3
Securities Market 14.4 22.9 17.2 14.0 12.1 7.7 6.9 4.5 4.2 7.3 4.3 8.0 5.9
Mutual Funds 9.1 16.4 8.6 5.5 3.8 0.5 2.7 1.4 1.9 4.9 1.3 1.7 1.3
Government 0.2 -0.4 0 0.4 0.1 0.4 0.4 1.6 0.6 0.9 1.6 5.7 4.3
Securities
Other Securities 5.1 6.9 8.6 8.1 8.2 6.8 3.8 1.5 1.7 1.5 1.4 0.6 0.3
Total 100.0 100.0 100.0 100.0 100.0 100.0 100.0 100.0 100.0 100.0 100.0 100.0 100.0
Source: RBI Annual Report
P: Provisional Figures.
Investor Population and PerceptionSEBI in association with National Council of Applied Economic Research (NCAER) conducted
a Survey of Indian Investors in 1998-99 and then followed it up in 2000-01. The survey of
2000-01 was based on a sample of 288,081 geographically dispersed rural and urban areas.
The findings of this survey were released in September 2003. The survey estimated that a
total of 13.1 million or 7.4 per cent of all Indian households totaling 21 million individuals
directly invested in equity shares or debentures or both during 2000-01. The other findings are
as listed below:
1. The number of debenture owning households and individual debenture holders far exceeds
household and individual equity investors. Of the total 13.1 million investor households,
9.6 million households owned bonds or debentures, whereas only 6.5 million investor
households owned equity shares.
2. The percentage of households investing in equity or debentures is more in urban areas
than in rural areas. This divergence is more in case of equities compared to debentures.

www.nseindia.com
Securities Market in India - An overview 8ISMR
Of the 51 million urban households, 7.8 million households representing more than
12 million urban individual investors owned equity shares or debentures or both. Whereas,
of the 125 million rural households, only 5.3 million households representing more than
8 million individual investors shows a definite migration of investors from equity market
to bond market during the period between the two surveys.
3. The survey results also clearly reveal that number of non-investor households have
increased from about 156 million in 1998-99 to nearly 164 million in 2001-02 constituting
nearly 92.6 per cent of all households.
4. It was also observed that the investor population and town size are directly proportional.
The largest city with more than 50 lakh population accounted for about 17 per cent of
investor households and the next higher segment, more than 31 per cent investor
households were in towns with population between 10 and 50 lakh.
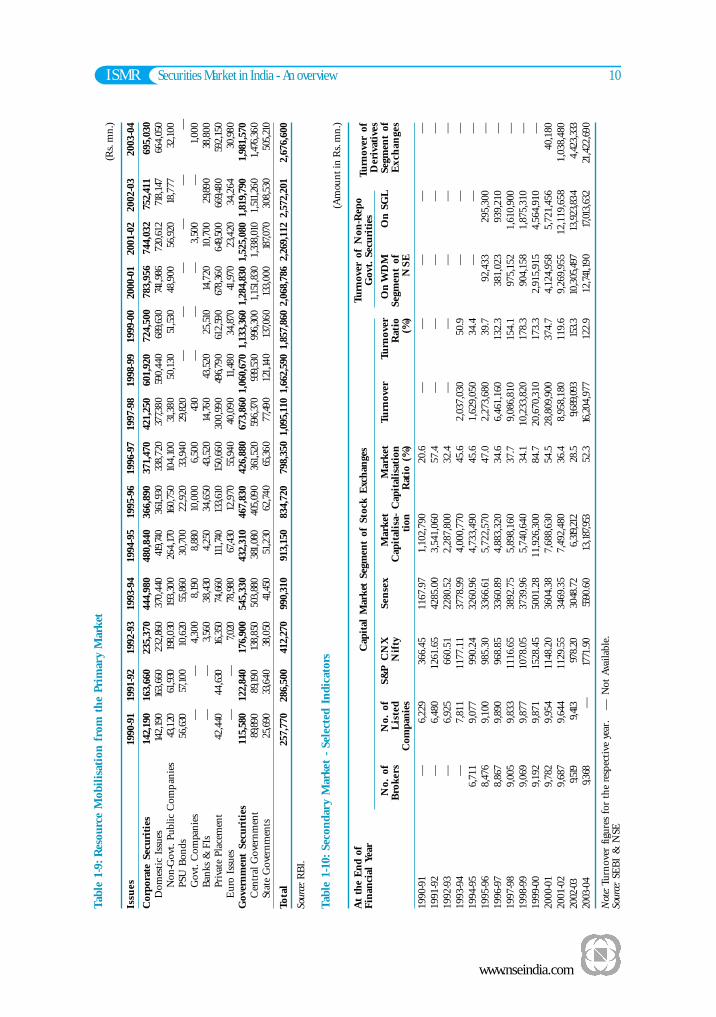
Primary MarketAn aggregate of Rs. 2,676,600 million were raised by the government and corporate sector
during 2003-04 as against Rs. 2,572,201 million during the preceding year. Government
raised about two third of the total resources, with central government alone raising nearly
Rs. 1,476,360 million.
Corporate Securities
The average annual capital mobilisation from the primary market has grown manifold since
the last two-three decades. It received a further boost during the first half of 1990s with
the capital raised by non-government public companies rising sharply from Rs. 43,120 million
in 1990-91 to Rs. 264,170 million in 1994-95. Thereafter, there has been a decline due to
conditions prevailing in the secondary market. However, the year 2003-04 took a turnaround
in its performance as compared to the previous year by mobilising Rs. 32,100 million. The
capital raised, which used to be less than 1% of gross domestic saving (GDS) in the 1970s
increased to about 13% in 1992-93 but thereafter witnessed declines. Though there has been
a considerable increase in the amount mobilised in 2003-04, when seen as a percentage of
GDS, it is 1.20% (Table 1-8). Data in Table 1-9 shows that there is a high preference for
raising resources in the primary market through private placement route. Private placements
accounted for 89% of total resources mobilised through domestic issues by corporate sector
during 2003-04.
As may be seen from the Table 1-9, Indian market is getting integrated with the global
market, though in a limited way through Euro Issues. Since they were permitted access in 1992,
Indian companies have raised about Rs. 30,980 million through American Depository Receipts
(ADRs)/Global Depository Receipts (GDRs).
FIIs have invested heavily in Indian market in 2003-04. They had net cumulative
investments of US$ 25.75 billion as at end of March 2004. There were 540 FIIs registered with
SEBI as of end March 2004.
It appears that more and more people prefer mutual funds (MFs) as their investment
vehicle. This change in investor behavior is induced by the evolution of a regulatory framework
for MFs, tax concessions offered by Government and preference of investors for passive
investing. Starting with an asset base of Rs. 250 million in 1964, the total assets under

ISMR
www.nseindia.com
9 Securities Market in India - An overview
management at the end of March 2004 has risen to Rs. 1,396,160 million. During the last one
decade, the resources mobilized by the MFs are increased from Rs. 112,440 million in 1993-94
to Rs. 476,840 million in 2003-04.
Table 1-8: Resources Mobilised through Public Issues(Amount in Rs. million)
Year Resources raised by % of GDS % of Mobilisationnon-government disbursements by mutual
companies by FIs funds
1990-91 43,120 3.32 33.66 750,800
1991-92 61,930 4.38 38.08 112,530
1992-93 198,030 12.76 85.54 130,210
1993-94 193,300 9.98 74.85 112,430
1994-95 264,170 10.48 78.69 112,750
1995-96 160,750 5.34 41.59 –583,30
1996-97 104,100 3.28 24.40 –203,70
1997-98 31,380 0.84 5.85 40,640
1998-99 50,130 1.27 8.59 36,110
1999-00 51,530 1.11 7.51 199,532
2000-01 49,490 1.01 6.89 111,350
2001-02 56,924 1.17 10.18 71,370
2002-03 18,777 0.74 18.37 45,830
2003-04 32,100 1.20 15.08 476,840
Government Securities
The primary issues of the Central Government have increased manifold during the decade
of 1990s from Rs. 89,890 million in 1990-91 to Rs. 1,476,360 million in 2003-04
(Table 1-9). The issues by state governments have also increased over this period from
Rs. 25,690 million to Rs. 505,210 million. The Central Government mobilised Rs. 1,215,000
million through issue of dated securities and Rs. 261,360 million through issue of
T-bills. After meeting repayment liabilities of Rs. 326,930 million for dated securities,
and redemption of T-bills of Rs. 261,260 million, net market borrowing of Central
Government amounted to Rs. 888,160 million for the year 2003-04. The State Governments
collectively raised Rs. 505,210 million during 2003-04 as against Rs. 308,530 million in
the preceding year. The net borrowings of State Governments in 2003-04 amounted to
Rs. 463,760 million.
Along with growth of the market, the investor base has also widened. In addition to
banks and insurance companies , corporates and individual investors are also investing in
government securities. Due to the soft interest rate policy pursued by the RBI, the coupon
rates offered on government borrowings have fallen sharply. The weighted average cost of its
borrowing have declined to 5.71% in 2003-04. The maturity structure of government debt is
also changing. About 77% of primary issues were raised through securities with maturities
above 5 years and up to 10 years. As a result the weighted average maturity of dated securities
increased to 14.94 years in 2003-04.
www.nseindia.com
Securities Market in India - An overview 10ISMRTa
ble
1-9:
Res
ourc
e M
obil
isat
ion
fro
m t
he
Prim
ary
Mar
ket
(Rs.
mn.)
Issu
es19
90-9
119
91-9
219
92-9
319
93-9
419
94-9
519
95-9
619
96-9
719
97-9
819
98-9
919
99-0
020
00-0
120
01-0
220
02-0
320
03-0
4
Cor
pora
te S
ecur
itie
s14
2,19
016
3,66
023
5,37
044
4,98
048
0,84
036
6,89
037
1,47
042
1,25
060
1,92
072
4,50
078
3,95
674
4,03
275
2,41
169
5,03
0D
om
esti
c Is
sues
142,
190
163,
660
232,
860
370,4
4041
9,74
036
1,93
033
8,720
377,38
059
0,4
40
689,
630
741,
986
720,
612
718,
147
664,0
50N
on-G
ovt
. Public
Com
pan
ies
43,1
2061
,930
198,
030
193,
300
264,1
7016
0,75
010
4,1
00
31,3
80
50,1
3051
,530
48,9
00
56,9
2018
,777
32,1
00
PSU
Bonds
56,6
3057
,100
10,6
2055
,860
30,7
00
22,9
2033
,940
29,8
20—
——
——
—G
ovt
. C
om
panie
s—
—4,
300
8,19
08,
880
10,0
006,
500
430
——
—3,
500
—1,
000
Ban
ks
& F
Is—
—3,
560
38,4
304,
250
34,6
5043
,520
14,760
43,5
2025
,510
14,7
2010
,700
29,8
90
38,8
00
Pri
vate
Pla
cem
ent
42,4
4044,6
3016
,350
74,6
6011
1,74
013
3,61
015
0,66
030
0,9
90
496,
790
612,
590
678,
360
649
,500
669,48
059
2,15
0E
uro
Iss
ues
——
7,02
078
,980
67,4
3012
,970
55,9
40
40,0
90
11,4
80
34,8
7041
,970
23,4
2034
,264
30,9
80
Gov
ern
men
t Se
curi
ties
115,
580
122,
840
176,
900
545,
330
432,
310
467,
830
426,
880
673,
860
1,06
0,67
01,
133,
360
1,28
4,83
01,
525,
080
1,81
9,79
01,
981,
570
Cen
tral
Gove
rnm
ent
89,8
9089
,190
138,
850
503,
880
381,
080
405,
090
361,
520
596,
370
939,
530
996,
300
1,15
1,83
01,
338,
010
1,51
1,26
01,
476,
360
Stat
e G
ove
rnm
ents
25,6
9033
,640
38,0
5041
,450
51,2
3062
,740
65,3
60
77,4
90
121,
140
137,06
013
3,000
187,07
030
8,53
050
5,21
0
Tota
l25
7,77
028
6,50
041
2,27
099
0,31
091
3,15
083
4,72
079
8,35
01,
095,
110
1,66
2,59
01,
857,
860
2,06
8,78
62,
269,
112
2,57
2,20
12,
676,
600
Sour
ce: R
BI.
Tabl
e 1-
10:
Seco
nda
ry M
arke
t -
Sele
cted
In
dica
tors
(Am
ount in
Rs. m
n.)
At
the
En
d of
Cap
ital
Mar
ket
Segm
ent
of S
tock
Exc
han
ges
Turn
over
of
Non
-Rep
oTu
rnov
er o
fF
inan
cial
Yea
rG
ovt.
Sec
urit
ies
Der
ivat
ives
No.
of
No.
of
S&P
CN
XSe
nse
xM
arke
tM
arke
tTu
rnov
erTu
rnov
erO
n W
DM
On
SG
LSe
gmen
t of
Bro
kers
Lis
ted
Nif
tyC
apit
alis
a-C
apit
alis
atio
nR
atio
Segm
ent
ofE
xch
ange
s C
ompa
nie
sti
onR
atio
(%
) (
%)
NS
E
1990-9
1—
6,22
9366.4
51167.9
71,1
02,7
90
20.6
——
——
—
1991-9
2—
6,48
012
61.6
542
85.0
03,
541,
060
57.4
——
——
—
1992-9
3—
6,92
5660.5
12280.5
22,2
87,8
00
32.4
——
——
—
1993-9
4—
7,81
111
77.1
137
78.9
94,
000,
770
45.6
2,03
7,03
050
.9—
——
1994-9
56,
711
9,07
7990.2
43260.9
64,7
33,4
90
45.6
1,6
29,0
50
34.4
——
—
1995-9
68,
476
9,10
0985.3
03366.6
15,7
22,5
70
47.0
2,2
73,6
80
39.7
92,4
33
295,3
00
—
1996-9
78,
867
9,89
0968.8
53360.8
94,8
83,3
20
34.6
6,4
61,1
60
132.
338
1,02
393
9,21
0—
1997-9
89,
005
9,83
311
16.6
538
92.7
55,
898,
160
37.7
9,08
6,81
015
4.1
975,
152
1,61
0,90
0—
1998-9
99,
069
9,87
710
78.0
537
39.9
65,7
40,6
40
34.1
10,2
33,8
2017
8.3
904,
158
1,87
5,31
0—
1999-0
09,
192
9,87
115
28.4
550
01.2
811
,926
,300
84.7
20,6
70,3
1017
3.3
2,91
5,91
54,
564,
910
—
2000-0
19,
782
9,95
411
48.2
036
04.3
87,6
88,6
30
54.5
28,8
09,9
0037
4.7
4,12
4,95
85,7
21,4
56
40,1
80
2001-0
29,
687
9,64
411
29.5
534
69.3
57,
492,
480
36.4
8,95
8,18
011
9.6
9,26
9,95
5 1
2,1
19,6
58
1,03
8,48
0
2002
-03
9,51
99,
413
978.
2030
48.7
26,
319,
212
28.5
9,689
,093
153.
310
,305
,497
13,9
23,8
34
4,42
3,33
3
2003
-04
9,368
—17
71.9
055
90.6
013
,187
,953
52.3
16,2
04,9
7712
2.9
12,741
,190
17,0
13,6
3221
,422
,690
Not
e: Tu
rnove
r figu
res
for
the
resp
ecti
ve y
ear.
— N
ot
Ava
ilab
le.
Sour
ce:
SEB
I &
NSE

ISMR
www.nseindia.com
11 Securities Market in India - An overview
Secondary MarketCorporate Securities
There are 23 exchanges in the country, which offer screen based trading system. The trading
system is connected using the VSAT technology from over 357 cities. There were 9,368 trading
members registered with SEBI as at end March 2004 (Table 1-10).
The market capitalization has grown over the period indicating more companies using
the trading platform of the stock exchange. The all India market capitalization is estimated at
Rs. 13,187,953 million at the end of March 2004. The market capitalization ratio defined as the
value of listed stocks divided by GDP is used as a measure of stock market size. It is of
economic significance since market is positively correlated with the ability to mobilize capital
and diversify risk. It increased sharply to 52.3% in 2003-04 against 28.5% in the previous year.
The trading volumes on exchanges have been witnessing phenomenal growth over the
past decade. The trading volume, which peaked at Rs. 28,809,900 million in 2000-01, fell
substantially to Rs. 9,689,093 million in 2002-03. However, the year 2003-04 saw a turnaround
in the total trading volumes on the exchanges. It registered a volume of Rs. 16,204,977 million.
The turnover ratio, which reflects the volume of trading in relation to the size of the market,
has been increasing by leaps and bounds after the advent of screen based trading system by the
NSE. The turnover ratio for the year 2003-04 accounted at 122.9%.
The relative importance of various stock exchanges in the market has undergone dramatic
change during this decade. The increase in turnover took place mostly at the big exchanges.
The NSE yet again registered as the market leader with more 85% of total turnover (volumes
on all segments) in 2003-04. Top 5 stock exchanges accounted for 99.88% of turnover, while
the rest 18 exchange for less than 0.12% during 2003-04 (Table 1-11). About ten exchanges
reported nil trading volume during the year.
Table 1-11: Growth and Distribution of Turnover on Stock Exchanges(Rs. mn.)
Stock Exchanges 1994-95 1995-96 1996-97 1997-98 1998-99 1999-00 2000-01 2001-02 2002-03 2003-04
1. NSE 85,090 800,090 3,367,820 4,811,970 5,198,520 11,432,680 17,704,580 15,622,830 21,265,445 45,462,793
2. Mumbai 677,480 500,640 1,242,840 2,073,830 3,119,990 6,850,282 10,016,190 3,093,156 3,165,516 5,146,730
3. Calcutta 528,720 621,280 1,056,640 1,787,780 1,717,804 3,571,655 3,550,354 270,747 65,399 19,275
4. Delhi 90,827 100,760 486,310 678,400 517,593 932,889 838,711 58,280 111 34
5. Ahmedabad 56,508 87,860 205,330 307,710 297,342 375,656 540,352 148,435 154,586 45,445
6. Uttar Pradesh 78,230 23,730 160,700 153,900 186,267 240,478 247,467 252,373 147,634 117,510
7. Ludhiana 24,880 48,490 52,740 83,150 59,779 77,405 97,322 8,566 — —
8. Pune 36,720 70,710 99,030 86,240 74,528 60,868 61,705 11,710 18 —
9. Bangalore 7,120 8,900 43,980 86,360 67,790 111,474 60,328 703 — 1
10. Hyderabad 13,752 12,850 4,800 18,600 12,759 12,365 9,778 413 46 20
11. ICSE — — — — 7 5,452 2,331 554 648 1
12. Cochin 5,970 18,030 14,010 17,830 7,730 — 1,866 — — —
13. OCTEI 3,650 2,180 2,210 1,250 1,422 35,879 1,259 38 1 158
14. Madras 30,327 23,150 12,280 3,696 2,502 1,092 241 — 1,009
15. Madhya Pradesh 1,182 2,040 120 10 9 97 24 235 — —
16. Magadh 7,968 16,290 27,550 3,230 — 80 16 — 5 1
17. Vadodara 16,210 12,590 42,680 45,760 17,491 1,593 9 101 25 1
18. Gauhati 2,853 6,190 4,840 200 302 — — 1 1 —
19. Bhubaneshwar 1,434 2,260 2,310 2,020 770 701 — — — —
20. Coimbatore 13,095 25,030 23,980 21,360 3,947 388 — 266 — —
21. Jaipur 8,786 10,470 15,190 4,310 648 21 — — — —
22. Mangalore 615 390 3,730 3,080 112 1 — — — —
23. SKSE 5,447 5,640 3,980 170 — — — — — —
Total 1,696,864 2,376,420 6,883,940 10,199,440 11,288,506 23,712,466 33,133,385 19,468,650 24,799,434 50,792,977
Note: Turnover means total value of transactions of securities in all market segments of an Exchange. For NSE, all three segments
viz., CM, F&O and WDM and BSE, two segments viz., CM and F&O are included.

www.nseindia.com
Securities Market in India - An overview 12ISMR
The movement of the S&P CNX Nifty, the most widely used indicator of the
market, is presented in Chart 1-1. The index movement have been responding to changes
in the government’s economic policies , the increase in FIIs inflows, etc. However, the
year 2003-04 witnessed a favorable movement in the Nifty, wherein it registered its all
time high in January 2004 of 2014.65. The point-to-point return of Nifty was 80.14% for
2003-04.
Government SecuritiesThe trading in government securities exceeded the combined trading in equity segments of all
the exchanges in the country during 2003-04. The aggregate trading in central and state
government dated securities, including treasury bills , increased by manifold over a period of
time. During 2003-04 it reached a level of Rs. 26,792,090 million. The share of WDM segment
of NSE in total turnover for government securities decreased marginally from 52% in 2002-03
to 47.6% in 2003-04. However, the share of WDM segment of NSE in the total of Non-repo
government securities increased marginally from 74.01% in 2002-03 to 74.89% in 2003-04
(Table 1-10).
Derivatives MarketThe number of instruments available in derivatives has been expanded. To begin with, SEBI
only approved trading in index futures contracts based on S&P CNX Nifty Index and BSE-30
(Sensex) Index. This was followed by approval for trading in options based on these two
indices and options on individual securities and also futures on interest rates derivative
instruments (91-day Notional T-Bills and 10-year Notional 6% coupon bearing as well as zero couponbonds). Now, there are futures and options based on benchmark index S&P CNX Nifty and
CNX IT Index as well as options and futures on single stocks (51 stocks).
The total exchange traded derivatives witnessed a value of Rs. 21,422,690 million during
2003-04 as against Rs. 4,423,333 million during the preceding year. While NSE accounted for
ISMR
www.nseindia.com
13 Securities Market in India - An overview
about 99.5% of total turnover, BSE accounted for less than 1% in 2003-04. NSE has created a
niche for itself in terms of derivatives trading in the global market.
Regulatory FrameworkThe four main legislations governing the securities market are (a) the SEBI Act, 1992 (b) the
Companies Act, 1956 (c) the Securities Contracts (Regulation) Act, 1956, and (d) the Depositories
Act, 1996. A brief about these legislations are as given below:
• SEBI Act, 1992: The SEBI Act, 1992 was enacted to empower SEBI with statutory
powers for (a) protecting the interests of investors in securities, (b) promoting the
development of the securities market, and (c) regulating the securities market. Its regulatory
jurisdiction extends over corporates in the issuing capital and all intermediaries and persons
associated with securities market. It can conduct enquiries , audits and inspection of all
concerned participants and adjudicate offences under this Act. It has powers to register
and regulate all the market intermediaries. Further it can also penalize them in case of
violations of the provisions of the Act, Rules and Regulations made thereunder. SEBI
has full autonomy and authority to regulate and develop an orderly securities market.
• Securities Contracts (Regulation) Act, 1956: It provides for direct and indirect control
of virtually all aspects of the securities trading including the running of stock exchanges
with an aim to prevent undesirable transactions in securities. It gives the Central
Government regulatory jurisdiction over (a) stock exchanges through a process of
recognition and continued supervision, (b) contracts in securities , and (c) listing of securities
on stock exchanges. As a condition of recognition, a stock exchange complies with
the requirements prescribed by the Central Government. The stock exchanges frame
their own listing regulations in consonance with the minimum listing criteria set out in
the Rules.
• Depositories Act, 1996: The Depositories Act, 1996 provides for the establishment of
depositories for securities to ensure transferability of securities with speed, accuracy and
security. For this, these provisions have been made: (a) making securities of public limited
companies freely transferable subject to certain exceptions; (b) dematerialising the securities
in the depository mode; and (c) providing for maintenance of ownership records in a
book entry form. In order to streamline the settlement process, the Act envisages transfer
of ownership of securities electronically by book entry without moving the securities
from persons to persons. The Act has made the securities of all public limited companies
freely transferable, restricting the company’s right to use discretion in effecting the transfer
of securities, and the transfer deed and other procedural requirements under the Companies
Act have been dispensed with.
• Companies Act, 1956: It deals with issue, allotment and transfer of securities and various
aspects relating to company management. It provides for standards of disclosure in the
public issues, particularly in the fields of company management and projects, information
about other listed companies under the same management, and management perception
of risk factors. It also regulates underwriting, the use of premium and discounts on
issues , rights and bonus issues, payment of interest and dividends, supply of annual
report and other information.
www.nseindia.com
Securities Market in India - An overview 14ISMR
Rules, Regulations & RegulatorsThe Government has framed rules under the SCRA, the SEBI Act and the Depositories
Act. The SEBI has framed regulations under these acts for registration and regulation of the
market intermediaries and for prevention of unfair trade practices. Under these Acts, the
Government and the SEBI issue notifications, guidelines and circulars , which the market
participants comply with. The SROs like the stock exchanges have also laid down their rules
and regulations.
The regulator has to ensure that the market participants behave in a desired manner so
that securities market continue to be a major source of finance for corporate and government
while protecting the interest of investors.
The responsibility for regulating the securities market is shared jointly by Department of
Economic Affairs (DEA), Department of Company Affairs (DCA), Reserve Bank of India
(RBI) and SEBI. The activities of all these agencies are coordinated by a High Level Committee
on Capital Markets.
Most of the powers under the SCRA are exercisable by DEA while a few others by
SEBI and some are concurrently by them. The regulation of the contracts for sale and purchase
of securities, gold related securities, money market securities and securities derived from
these securities and ready forward contracts in debt securities are exercised concurrently
with the RBI. The SEBI Act and the Depositories Act are mostly administered by SEBI.
While the rules under the securities laws are framed by government, regulations are framed by
SEBI. The powers under the Companies Act relating to issue and transfer of securities and
non-payment of dividend are administered by SEBI in case of listed public companies and
public companies proposing to get their securities listed. The SROs ensure compliance of
market participants with their own rules as well as with the rules relevant for them under the
securities laws.
Reforms in Indian Securities MarketsCorporate Securities Market
During the last decade, there have been substantial regulatory, structural, institutional and
operational changes in the securities industry. These have been carried out with the objective
of improving market efficiency, enhancing transparency, preventing unfair trade practices and
bringing the Indian market up to international standards. The following paragraphs list the
principal reform measures undertaken in the last decade.
Establishment of SEBI: The Securities and Exchange Board of India (SEBI) was set up as
an administrative body in April 1988. It was given statutory status on November 1992 by
promulgation of the SEBI Ordinance. The objective of setting up SEBI is to protect the
interest of investors in securities and to promote the development and to regulate the security
market. Its regulatory jurisdiction extends over corporates in the issuance of capital and transfer
of securities, in addition to all the intermediaries and persons associated with securities market.
The market participants are also required to appoint a compliance officer who is responsible
for monitoring compliance with all the securities laws and for redressal of investor grievances.
The courts have upheld the powers of SEBI to impose monetary penalties and to levy fees
from market intermediaries. In a recent amendment to the SEBI Act, the regulator has also
been given search and seizure powers.
ISMR
www.nseindia.com
15 Securities Market in India - An overview
DIP Guidelines: With the repeal of the Capital Issues (Control) Act, 1947 in May 1992,
Government’s control over issue of capital, pricing of the issues , fixing of premia and rates of
interest on debentures etc. ceased. Thereafter, the market has been allowed to allocate resources
among the competing uses. In the interest of investors , SEBI issued the Disclosure and Investor
Protection (DIP) guidelines. These guidelines contain a slew of requirements for issuers/
intermediaries with a broad intention to ensure that all concerned observe high standards of
integrity and fair dealing. The guidelines also aim to secure fuller disclosure of relevant
information about the issuer and the nature of the securities to be issued. This enables the
investors to take informed decisions. For example, issuers are required to disclose any material
‘risk factors’ and give justification for pricing in their prospectus. The guidelines cast a
responsibility on the lead managers to issue a due diligence certificate, stating that they have
examined the prospectus and that it brings out all the facts and does not contain anything
wrong or misleading. Issuers are now required to comply with the guidelines and then access
the market. The companies can access the market only if they fulfill minimum eligibility norms
in terms of their track record of distributable profits and net worth.
Screen Based Trading: Prior to 1990s, the trading on stock exchanges in India used to
take place through an open outcry system. This system did not allow immediate matching
or recording of trades. This was time consuming and imposed limits on trading. In order
to provide efficiency, liquidity and transparency, NSE introduced a nation-wide on-line
fully-automated screen based trading system (SBTS). In this system a member can punch
into the computer quantities of securities and the prices at which he desires to transact and the
transaction is executed as soon as it finds a matching sale or buy order from a counter
party. SBTS electronically matches orders on price/time priority and hence it cuts down on
time and cost. It enables market participants to see the full market on real-time, making the
market transparent. It allows a large number of participants , irrespective of their geographical
locations, to trade with one another simultaneously, improving the depth and liquidity of the
market. Given the efficiency and cost effectiveness delivered by the NSE’s trading system, it
became the leading stock exchange in the country in its very first year of operation. This forced
the other stock exchanges to adopt SBTS. As a result, open outcry system has disappeared
from India.
Trading Cycle: Initially, the trading cycle varied from 14 days for specified securities to
30 days for others and settlement took another fortnight. Often this cycle was not adhered
to and on several occasions led to defaults and risks in settlement. In order to reduce
large open positions, the trading cycle was reduced over a period of time to a week. The
exchanges , however, continued to have different weekly trading cycles, which enabled shifting
of positions from one exchange to another. Rolling settlement on T+5 basis was introduced in
respect of specified scrips reducing the trading cycle to one day. It was made mandatory for all
exchanges to follow a uniform weekly trading cycle in respect of scrips not under rolling
settlement. All scrips moved to rolling settlement from December 2001. The settlement period
has been reduced progressively from T+5 to T+3 days. Currently T+2 day settlement cycle is
being followed.
Derivatives Trading: To assist market participants to manage risks better through hedging,
speculation and arbitrage, SC(R)A was amended in 1995 to lift the ban on options in securities.
However, trading in derivatives took off much later after the suitable legal and regulatory

www.nseindia.com
Securities Market in India - An overview 16ISMR
framework was out in place. Derivatives trading commenced in June 2000 in the Indian
securities market on NSE and BSE only. The market presently offers index futures and index
options on three indices and stock options and stock futures on individual stocks (presently
51 stocks on NSE) and futures in interest rate products like notional 91-day T-Bills and
notional 10-year bonds.
Demutualisation: Historically, brokers owned, controlled and managed the stock exchanges.
In case of disputes, integrity of the exchange suffered. Therefore regulators focused on reducing
the dominance of trading members in the management of stock exchanges. They advised
them to reconstitute their governing councils to provide for at least 50% non-broker
representation. However, this did not materially alter the situation. In face of extreme volatility
in the securities market in 2000, the Government proposed to corporatise the stock exchanges
by which ownership, management and trading membership would be segregated from one
another. A few exchanges have already initiated demutualisation process. NSE, however, adopted
a pure demutualised governance structure where ownership, management and trading are with
three different sets of people. This completely eliminates any conflict of interest and helped
NSE to aggressively pursue policies.
Depositories Act: The earlier settlement system gave rise to settlement risk. This was due
to the time taken for settlement and due to the physical movement of paper. Further, the
transfer of shares in favour of the purchaser by the company also consumed considerable
amount of time. To obviate these problems, the Depositories Act, 1996 was passed to provide
for the establishment of depositories in securities. The objective was of ensuring free
transferability of securities with speed and accuracy. This act brought in changes by (a) making
securities of public limited companies freely transferable subject to certain exceptions;
(b) dematerialising of securities in the depository mode; and (c) providing for maintenance of
ownership records in a book entry form. In order to streamline both the stages of the settlement
process , the Act envisages transfer of ownership of securities electronically by book entry
without making the securities move from person to person. In order to promote
dematerialisation, the regulator has been promoting settlement in demat form in a phased
manner in an ever-increasing number of securities. The stamp duty on transfer of demat
securities has been waived. There are two depositories in India, viz. NSDL and CDSL. They
have been set up to provide instantaneous electronic transfer of securities. At the end of
March 2004, the number of companies connected to NSDL and CDSL were 5,212 and 4,720,
respectively. The number of dematerialised securities increased to 97.7 billion at the end of
March 2004 from 76.9 billion as of end March 2003. As on the same date, the value of
dematerialsied securities was Rs. 10,701 billion and the number of investor accounts was
5,832,552. All actively traded scrips are held, traded and settled in demat form. Demat settlement
accounts for over 99% of turnover settled by delivery. This has almost eliminated the bad
deliveries and associated problems.
To prevent physical certificates from sneaking into circulation, it has been mandatory
that all new securities issued should be compulsorily traded in dematerialised form. The
admission to a depository for dematerialisation of securities has been made a prerequisite
for making a public or rights issue or an offer for sale. It has also been made compulsory for
public listed companies making IPO of any security for Rs. 10 crore or more only in
dematerialised form.

ISMR
www.nseindia.com
17 Securities Market in India - An overview
Risk Management: With a view to avoid any kind of market failures , the regulator/
exchanges have developed a comprehensive risk management system, which is constantly
monitored and upgraded. It encompasses capital adequacy of members, adequate margin
requirements , limits on exposure and turnover, indemnity insurance, on-line position
monitoring and automatic disablement, etc. They also administer an efficient market surveillance
system to detect and prevent price manipulations. The clearing corporation has also put in
place a system which tracks online real time client level portfolio based upfront margining.
Exchanges have set up trade/settlement guarantee funds for meeting shortages arising out of
non-fulfillment/partial fulfillment of funds obligations by the members in a settlement. As a
part of the risk management system, index based market wide circuit breakers have also been
put in place.
The anonymous electronic order book ushered in by the NSE did not permit members
to assess credit risk of the counter-party necessitated some innovation in this area. To address
this concern, NSE had set up the first clearing corporation, viz. National Securities Clearing
Corporation Ltd. (NSCCL), which commenced its operations in April 1996. The NSCCL assured
the counterparty risk of each member and guaranteed financial settlement. NSCCL established
a Settlement Guarantee Fund (SGF). The SGF provides a cushion for any residual risk and
operates like a self-insurance mechanism wherein members contribute to the Fund. In event
of failure of a trading member to meet his obligations, the fund is utilized to the extent required
for successful completion of the settlement. This has eliminated counter-party risk of trading
on the Exchange.
Investor Protection: The SEBI Act established SEBI with the primary objective of protecting
the interests of investors in securities and empowers it to achieve this objective. SEBI specifies
that the critical data should be disclosed in the specified formats regarding all the concerned
market participants. The Central Government has established a fund called Investor Education
and Protection Fund (IEPF) in October 2001 for the promotion of awareness amongst investors
and protection of the interest of investors.
DEA, DCA, the SEBI and the stock exchanges have set up investor grievance cells for
redressal of investor grievance. The exchanges maintain investor protection funds to take care
of investor claims. The DCA has also set up an investor education and protection fund for the
promotion of investors’ awareness and protection of interest of investors. All these agencies
and investor associations are organising investor education and awareness programmes. In
January 2003, SEBI launched a nation-wide Securities Market Awareness Campaign that aims
at educating investors about the risks associated with the market as well as the rights and
obligations of investors.
Globalisation: Indian securities market is getting increasingly integrated with the rest of the
world. Indian companies have been permitted to raise resources from abroad through issue of
ADRs, GDRs, FCCBs and ECBs. Further, foreign companies are allowed to tap the domestic
stock markets.
Indian companies are permitted to list their securities on foreign stock exchanges by
sponsoring ADR/GDR issues against block shareholding. NRIs and OCBs are allowed to
invest in Indian companies. FIIs have been permitted to invest in all types of securities, including
government securities. The investments by FIIs enjoy full capital account convertibility.
They can invest in a company under portfolio investment route upto 24% of the paid-up

www.nseindia.com
Securities Market in India - An overview 18ISMR
capital of the company. This can be increased up to the sectoral cap/statutory ceiling, as
applicable. The Indian Stock Exchanges have been permitted to set up trading terminals abroad.
The trading platform of Indian exchanges is now accessed through the Internet from anywhere
in the world.
The two-way fungibility for ADRs/GDRs has been permitted by RBI, which meant
that the investors (foreign institutional or domestic) in any company that has issued ADRs/
GDRs can freely convert the ADRs/GDRs into underlying domestic shares. They could also
reconvert the domestic shares into ADRs/GDRs, depending on the direction of price change
in the stock. This is expected to bring about an improvement in the liquidity in ADR/GDR
market and elimination of arbitrage opportunity. This will better align ADR/GDR prices and
domestic share prices of companies that have floated ADRs/GDRs.
Government Securities Market
The Government securities market has witnessed significant transformation in the 1990s.
There have been major institutional and operational changes in the government securities market.
In the primary market, securities are issued through the auction system at market related rates.
They are issued across maturities to develop a yield curve from short to long end, which is
used as a benchmark. Also, the types of bonds issued have diversified include floating
rate bonds, capital index bonds, zero coupon bonds. Further, non-competitive bids are accepted
from retail investors in order to widen investor base. The reforms in the secondary market
include setting up a system of primary dealers, who provide with two way quotes for transactions
in securities, setting up of Clearing Corporation of India as the central clearing agency wherein
Delivery versus Payment system is used for settlement, and negotiated dealing screen for
reporting of all the trades. Further, to facilitate retail investors to invest in Government securities,
RBI permitted select entities to provide custody (Constituent SGL) accounts. Other measures
include abolition of TDS on government securities and stamp duty on transfer of demat
debt securities.
Market Infrastructure: As part of the ongoing ef forts to build debt market
infrastructure, two new systems/set-up have been made operational the Negotiated Dealing
System (NDS) and the Clearing Corporation of India Limited (CCIL). NDS, interalia, facilitates
screen based negotiated dealing for secondary market transactions in government securities
and money market instruments, online reporting of transactions and dissemination of trade
information to the market. Government Securities (including T-bills), call money, notice/
term money, repos in eligible securities, Commercial Papers and Certificate of Deposits are
available for negotiated dealing through NDS among the members. Initially, the settlement of
trades was carried out on individually, that is, irrespective of couterparties each trade was
settled separately. Further, there was no central agency to guarantee the trades. Therefore, the
CCIL was set up to facilitate settlement using the higher versions of Delivery versus Payment
mechanism. It began by settling the securities on gross basis and settlement of funds on net
basis. Subsequently, both the securities and funds are settled on net basis. It, also, acts as a
central counterparty for clearing and settlement of government securities transactions done
on NDS.
The major reforms planned include strengthening and modernising legislative framework
through a Government Securities Act and switching over to order-driven screen based trading
in Government securities on the stock exchanges.

ISMR
www.nseindia.com
19 Securities Market in India - An overview
Research in Securities Market
In order to deepen the understanding and to assist in policy-making, SEBI has been promoting
high quality research in the Indian capital market. Its monthly bulletin carries research articles
pertaining to issues in the capital market. In order to improve market efficiency further
and to set international benchmarks in the securities industry, NSE administers a scheme
called the NSE Research Initiative. The objective of this initiative is to foster research to
better design market microstructure. The NSE Research Initiative has so far come out with
32 Working Papers.
Testing and Certification
With a view to improve the quality of intermediation, a system of testing and certification has
been used in some of the developed and developing markets. This ensures that a person dealing
with financial products has a minimum knowledge about them, the markets and regulations. As
a result, not only the intermediaries benefit due to the improvement in the quality of their
services , but also the career prospectus of the certified professionals is better. Thus, the
confidence of the investors in the market increases.
NSE has evolved a testing and certification mechanism known as the National Stock
Exchange’s Certification in Financial Markets (NCFM). It is an on-line fully automated
nation-wide testing and certification system. The entire process in NCFM from generation of
question paper, invigilation, testing, assessing, scores reporting and certifying is fully automated.
It tests practical knowledge and skills , that are required to operate in financial markets.
A certificate is awarded to those personnel who qualify the tests , which indicates that they
have a proper understanding of the market and skills to service different constituents of the
market. It offers nine securities market related modules.
As such, the reforms in the securities market are far from complete. At the same time,
the reforms undertaken so far have aimed at improving the operational and informational
efficiency in the market by enabling the participants to carry out transactions in a cost
effective manner and providing them with full, relevant and accurate information in time.
A number of checks and balances have been set up to protect investors, enhance their confidence
and avoid systemic failure of the market. As a result of these reforms, the market design has
changed drastically. Today the Indian securities market bears a look which is absolutely different
from what they were 10 years ago or what they will be 10 years hence.
International InitiativesAs a result of the reforms pursued during the past decade, there have been substantial changes
in the operations of the securities market, institutions and the regulatory framework. However,
there is still scope for improving the system as a whole. While charting the agenda for future, it
would be worthwhile to review the international initiatives in the form of standards/guidelines/
recommendations.
Principles of Securities Regulation
In February 2002, IOSCO released a new version of the Objectives and Principles of SecuritiesRegulation, and a technical document titled “Assessment methodology for Recommendations
for Securities Settlement Systems”. These provided advice and a yardstick against which the
www.nseindia.com
Securities Market in India - An overview 20ISMR
progress made towards effective regulation would be measured. IOSCO members , including
SEBI, have endorsed these principles and within their jurisdiction intend to adhere to these
principles. The principles are listed below:
Regulator1. The responsibilities of the regulator should be clear and objectively stated. This requires
a clear definition of responsibilities, preferably set out by law; strong cooperation among
responsible authorities through appropriate channels. In addition, there should be adequate
legal protection for the regulators and their staff acting in bona fide discharge of their
functions and powers. Any division of responsibility should avoid gaps and inequities in
regulation.
2. The regulator should be operationally independent and accountable in the exercise of its
functions and powers. Independence is enhanced by a stable source of funding for the
regulator. The regulator should operate independent of sectoral interests. Nevertheless, a
system of public accountability of the regulator and a system permitting the judicial
review of decisions of the regulator should be in place.
3. The regulator should have adequate powers , proper resources and the capacity to
perform its function and exercise its powers. The regulator should have powers of
licensing, supervision, inspection, investigation and enforcement and also access to
adequate funding.
4. The regulator should adopt clear and consistent regulatory processes. The regulator should
have a process for consultation with the public by openly disclosing its policies. It should
observe standards of procedural fairness and have regard to the cost of compliance with
the regulations. It should also play an active role in the education of investors and other
participants in the capital market.
5. The staff of the regulator should observe the highest professional standards, including
appropriate standards of confidentiality. They should be given clear guidance on conduct
relating to conflict of interest, appropriate use of information obtained in the course of
duty, observance of confidentiality and secrecy provisions, observance of procedural
fairness, etc.
Self-Regulation6. The regulatory regime should make appropriate use of self-regulatory organisations (SROs)
that exercise some direct oversight responsibility in their areas of competence. SROs
should undertake those regulatory responsibilities to the extent of their size and complexity
of the markets.
7. SROs should be subject to the oversight of the regulator and should observe standards
of fairness and confidentiality while exercising powers and responsibilities. The regulator
must ensure that no conflict of interest arises because of SRO’s access to valuable
information about market participants. The conflict may be acute when SRO is responsible
both for supervision of its members and regulation of the market sector. If the powers
of a SRO are inadequate to address a particular misconduct or conflict of interest, then

ISMR
www.nseindia.com
21 Securities Market in India - An overview
the regulator should take over the responsibility. SROs should also follow similar
professional standards as expected of the regulator.
Enforcement of Securities Regulation8. The regulator should have comprehensive inspection, investigation and surveillance powers.
It should have the power to seek information, or to carry out inspections of business
operations to ensure compliance with relevant standards.
9. The regulator should have comprehensive enforcement powers, including regulatory and
investigative powers. It should be able to obtain data/information, to impose administrative
sanctions and/or seek orders from court, to initiate or refer matters for criminal
prosecution, to suspend trading in securities, to enter into enforceable settlements etc. It
is, however, not necessary that all aspects of enforcement of securities law be given to a
single body.
10. The regulatory system should ensure that an effective and credible use of inspection,
investigation, surveillance and enforcement powers is made. The powers of regulator
should be sufficient to ensure its effectiveness in cases of cross border misconduct.
The regulator should require market intermediaries to have in place policies and procedures
to prevent use of their business as a vehicle for money laundering.
Co-operation in Regulation11. The regulator should have authority to share both public and non-public information
with domestic and foreign counterparts.
12. Regulators should establish information sharing mechanisms that set out when and how
they will share both public and non-public information with their domestic and foreign
counterparts.
13. The regulatory system should allow for assistance to be provided to foreign regulators,
who need to make inquiries in the discharge of their functions and exercise of their
powers. There should be arrangements, which identifies the circumstances under which
such assistance may be sought, identification of the types of information and assistance
that can be provided, safeguards of confidentiality of information transmitted, and a
description of permitted uses of information.
Issuers14. There should be full, timely and accurate disclosure of financial results and other
information, which may impact the investors’ decisions. Disclosures should be clear,
reasonably specific and timely.
15. Holders of securities in a company should be treated in a fair and equitable
manner.
16. Accounting and auditing standards should be of a high and internationally acceptable
quality.

www.nseindia.com
Securities Market in India - An overview 22ISMR
Collective Investment Schemes17. The regulatory system should set standards for the eligibility for those who wish to market
or operate a collective investment scheme. The criteria may include honesty and integrity
of the operator, competence to carry out the functions and duties of a scheme operator,
financial capacity, internal management procedures, etc.
18. The regulatory system should provide for rules governing the legal form, structure of
collective investment schemes and protection of client assets.
19. Regulation should require disclosure, which is necessary to evaluate the suitability of a
collective investment scheme for a particular investor and the value of the investor’s
interest in the scheme.
20. Regulation should ensure that there is a proper and disclosed basis for assets valuation,
the pricing and the redemption of units in a collective investment scheme.
Market Intermediaries21. Regulation should provide for minimum entry standards for market intermediaries.
It should reduce the risk to investors caused by negligent or illegal behaviour or inadequate
capital. The licensing process should require a comprehensive assessment of the applicant
and the licensing authority should have the power to withdraw or suspend the license.
The regulator should ensure that the public has access to relevant information concerning
the licensee.
22. There should be initial and on going capital and prudential requirements for market
intermediaries to cover the risks that the intermediaries undertake. The regulations should
provide for inspection, investigation, enforcement, discipline and revocation of license.
23. Market intermediaries should be required to comply with the standards. They should
conduct their operations with the aim to protect the interest of clients by undertaking
proper risk management.
24. There should be a procedure for dealing with the failure of a market intermediary in
order to minimise damage and loss to investors and to contain systemic risk.
Secondary Market25. The establishment of trading systems should be subject to regulatory authorisation and
oversight. The relevant factors for authorisation could be operator’s competence, admission
of products to trading, admission of participants to trading, provision of trading
information, etc.
26. There should be ongoing regulatory supervision of exchanges and trading systems,
which should aim to ensure that the integrity is maintained through fair and equitable
rules that strike an appropriate balance between the demands of different market
participants. Approval of trading system should be re-examined or withdrawn by the
regulator when considered necessary.

ISMR
www.nseindia.com
23 Securities Market in India - An overview
27. Regulation should promote transparency of trading.
28. Regulation should be designed to detect and deter market manipulation and other
unfair trading practices. The regulation should prohibit misleading conduct, insider trading
and other fraudulent or deceptive conduct which may distort price discovery system,
distort prices and unfairly disadvantage investors. These may be addressed by direct
surveillance, inspection, reporting, product design requirements, position limits, market
halts, etc.
29. Regulation should aim to ensure the proper management of large exposures, default risk
and market disruption.
30. Systems for clearing and settlement of securities should be subject to regulatory
oversight. They should be designed in a fair, effective and efficient manner and reduce
systemic risk.
A comparison of these principles and the regulations in the Indian Securities Market
indicates that India has almost complied with all thirty principles.
Recommendations for Securities Settlement Systems
The 19 recommendations of BIS-IOSCO cover legal risk, pre-settlement risk, settlement risk,
operational risk and other issues relating to securities settlement system. India’s readiness
vis-à-vis BIS-IOSCO principles have been discussed in detail in Chapter 5. The
19 recommendations are discussed below:
Legal risk1. Legal framework: Securities settlement systems should have a well-founded, clear and
transparent legal basis in the relevant jurisdictions.
Pre-settlement risk2. Trade confirmation: Confirmation of trades between direct market participants should
occur as soon as possible after trade execution, but no later than trade date (T+0). If
confirmation of trades by indirect market participants (such as institutional investors) is
required, then it should occur as soon as possible after trade execution, preferably on
T+0, but no later than T+1.
3. Settlement cycles: Rolling settlement should be adopted in all the securities markets.
Final settlement should occur no later than T+3. The benefits and costs of a settlement
cycle shorter than T+3 should be evaluated.
4. Central counterparties (CCPs): The benefits and costs of a CCP should be evaluated.
Where such a mechanism is introduced, the CCP should rigorously control the risks it
assumes.
5. Securities lending: Securities lending and borrowing (or repurchase agreements and
other economically equivalent transactions) should be encouraged as a method for
expediting the settlement of securities transactions.
www.nseindia.com
Securities Market in India - An overview 24ISMR
Settlement risk6. Central securities depositories (CSDs): Securities should be immobilised
or dematerialised and transferred by book entry in CSDs to the greatest extent
possible.
7. Delivery versus payment (DVP): CSDs should eliminate principal risk by
linking securities transfers to funds transfers in a way that achieves delivery versus
payment.
8. Timing of settlement finality: Final settlement should occur not later than the end of
the settlement day. Intraday or real-time finality should be provided where necessary to
reduce risks.
9. CSD risk control system to address participants’ failures to settle: CSDs that extend
intraday credit to participants and that operate net settlement systems, should institute
risk controls. To ensure that timely settlement is made even if the participant with the
largest payment obligation is unable to settle. The most reliable set of controls is a
combination of collateral requirements and limits.
10. Cash settlement assets: Assets used to settle the ultimate payment obligations arising
from securities transactions should carry little or no credit or liquidity risk. Efforts must
be taken to protect CSD members from potential losses and liquidity pressures which
may arise due to faulty assets used for that purpose.
Operational risk
11. Operational reliability: the sources of operational risk in the clearing and settlement
process should be identified and minimised through an appropriate systems of controls
and procedures. Systems should be reliable and secure. Contingency plans and backup
facilities should be established to allow for timely recovery of operations and completion
of the settlement process.
Custody risk12. Protection of customers’ securities: Entities holding securities in custody should employ
accounting practices and safekeeping procedures that fully protect customers’ securities.
It is essential that customers’ securities be protected against the claims of a custodian’s
creditors.
Other issues13. Governance: Governance arrangements for CSDs and CCPs should be designed
to fulfill public interest requirements and to promote the objectives of owners
and users.
14. Access: CSDs and CCPs should have objective and publicly disclosed criteria for
participation that permit fair and open access.

ISMR
www.nseindia.com
25 Securities Market in India - An overview
15. Efficiency: While maintaining safe and secure operations, securities settlement systems
should be cost-effective in meeting the requirements of users.
16. Communication procedures and standards: Securities settlement systems should use
or accommodate the relevant international communication procedures and standards in
order to facilitate efficient settlement of cross-border transactions.
17. Transparency: CSDs and CCPs should provide market participants with sufficient
information for them to identify and evaluate accurately the risks and costs associated
with using their services.
18. Regulation and oversight: Securities settlement systems should be subject to transparent
and effective regulation and oversight. Central banks and securities regulators should
cooperate with each other and with other relevant authorities.
19. Risks in cross-border links: CSDs that establish links to settle cross-border trades should
design and operate such links to reduce effectively the risks associated with cross-border
settlements.
World Federation of Exchanges Trading Survey 2002
The World Federation of Exchanges conducted a survey in 2002 on trading practices at major
stock exchanges. This survey was conducted by Professor Maureen O’Hara of Cornell University.
The report was released in March 2003. The survey covered 42 Exchanges and focussed on
6 operational areas: trading platform, traded products, orders and order routing mechanism,
execution, transparency, information.
Trading Platform: The study found that electronic systems prevail and are typically order
driven. 32 Exchanges have order driven system and only 2 stock exchanges have a floor system.
14 Exchanges have introduced new trading platform in the past 12 months and 15 are planning
to do so in next 12 months. About 86% of Exchanges have platforms that include stock watch
or real time error alerts. About 88% of Exchanges have backup systems in place that are fully
redundant.
Trading Products: The study found that 33 exchanges reported negative to flat value growth
over the last year but the growth of derivatives has been stronger. The study also found a
significant growth in Exchange Traded Funds.
Order and Order Routing: The study found that 12% of the Exchanges have the system that
gives direct access for order routing and straight through processing is in place (55%).
Execution: The execution quality has generally improved with the electronic system in place in
most of the Exchanges. The study found that 49% of exchanges offer automatic execution of
small orders and 71% offer opportunities for price improvement. The time taken to process
the order is typically less than a second.
Transparency and Information: The survey indicated that global markets are becoming more
and more transparent. The majority of exchanges disclose substantial market information and

www.nseindia.com
Securities Market in India - An overview 26ISMR
disseminate them through a variety of ways: 90% through data feed, 74% through internet,
69% through trading system, 36% through special information system and 7% through
satellite. The depths of all prices is displayed by 57% of exchanges , another 26% display
depth for specific price levels and 17% allow indicative quotes to be disclosed.
Other Issues: The survey finds that 76% of the Exchanges reported operating within a
self-regulatory framework. The regulatory functions are handled internally in 40% of exchanges,
by a separate non-governmental entity for 14%. While Government regulator handles 21%,
38% are handled jointly with a regulatory agency.


![[PPT]Chapter 9 -- Cash and Marketable Securities …wps.pearsoned.co.uk/wps/media/objects/1669/1709954/... · Web viewTitle Chapter 9 -- Cash and Marketable Securities Management](https://img.pdfslide.us/doc/110x75/5b0e55817f8b9a2c3b8e8a27/pptchapter-9-cash-and-marketable-securities-wps-viewtitle-chapter-9-cash.jpg)