Embed Size (px)
Citation preview

Securities Crowdfunding: More than Family, Friends, and Fools?
Eliot AbramsUniversity of Chicago Booth School of Business
5807 S Woodlawn AveChicago, IL USA [email protected]
January 19, 2017
Abstract: The US securities crowdfunding market opened on May 16th, 2016. I provide the firstdescription of the companies and investors participating in this market using data on the full uni-verse of Regulation Crowdfunding issues. I then demonstrate that investment in an issue is closelytied to economic fundamentals after the first week. This result is consistent with unsophisticatedinvestors arriving in the first week and investing indiscriminately and relatively more sophisticatedinvestors arriving thereafter. Based on this evidence, I conclude that the market provides a promis-ing new way for high quality early stage companies to seek financing.
Keywords: Equity Crowdfunding; Entrepreneurial Finance; New Ventures; StartupsJEL: L26; G29; M13
1

Securities Crowdfunding: More than Family, Friends, and Fools?
Eliot Abrams∗
1 Introduction
On May 16, 2016, unaccredited investors were allowed to purchase securities issued by early stage US
companies for the first time thanks to the implementation of Regulation Crowdfunding. Regulation
Crowdfunding (Reg CF) is the enactment of Title III of the JOBS Act, which was passed in
2012 with bipartisan support to encourage funding of US business startups. Whether the market
established by Regulation Crowdfunding can help accomplish this goal is an open question.
Previously, early stage companies could try to raise capital through personal credit; family,
friends, and other unsophisticated investors (often colorfully termed fools); bank loans; and angel
and venture capital (VC) investment. However, access to bank loans or angel and VC investment is
severely limited for even high quality business startups. Business startups face financing frictions
that range from high fixed bank origination costs and the narrow industry and geographic focus
of angel investors and venture capitalists to the standard challenges of overcoming asymmetric
information and moral hazard.
Consider the company Oculus Rift, which Facebook purchased for nearly $3 billion in the fall
of 2014. Oculus Rift received its first round of VC funding in June, 2013 only after successfully
completing a public rewards-based crowdfunding campaign on Kickstarter in August, 2012. Evi-
dence indicates that Oculus Rift’s late VC funding was not from lack of trying. Oculus Rift failed to
convince VC firm Andreessen Horowitz to invest in the June Series A round and, after substantially
more coaxing, finally succeeded in securing Andreessen Horowitz’s investment in a Series B round
that December. Ostensibly, securities crowdfunding could help create more companies like Oculus
∗University of Chicago, Booth School of Business. I thank Chad Syverson, Thomas Wollmann, Steve Kaplan,and participants at the University of Chicago G3 Research Seminar and IO Working Group for their feedback andexcellent discussions. I also thank Audrey Li for her assistance in collecting data from the SEC filings. All errors aremy own.
2

Rift through establishing a more robust market (that goes beyond simple pre-selling) for very early
access to investors.
That said, US securities crowdfunding1 still faces the same substantial information asymmetry
and moral hazard challenges that restrict existing financing channels. There are good reasons
to expect that the securities crowdfunding market will unravel and fail to attract any investors
beyond family, friends, and fools who might have invested in these early stage companies under
other terms.2 Put another way, securities crowdfunding will provide a viable new funding source for
early stage companies only if high quality issuers can consistently attract relatively sophisticated
outside investors.
I make progress addressing the success of the US securities crowdfunding market in its initial
six months of operation in two ways. First, I document the companies and investors participating
in the market using new datasets on the full universe of issues under Regulation Crowdfunding.
Second, I demonstrate that investors in the market invest more in issuers with more assets and
less long term debt who submit more information to the SEC. Together with the continued growth
of the market and investors’ self-descriptions as sophisticated agents, this result is consistent with
the market successfully attracting relatively sophisticated investors who invest optimally given the
limited information available.
Substantial differences in investor sophistication over time lend credence to interpreting the
above results as evidence that the market attracts more than family, friends, and fools. I find that
investors arriving in the first week do not invest more in issuers with better balance sheets who
submit more information to the SEC and that investors arriving by the end of the first month do.
This finding suggests that family, friends, and fools constitute the majority of investors in the first
week and that relatively more sophisticated investors arrive thereafter. That investors in the first
week are family, friends, and fools is confirmed by anecdotal evidence. Several portals specifically
advise issuers to “activate your crowd” and get “family, friends, and fans” to invest by day seven.3
I conclude that high quality issuers who have otherwise limited access to financing (due to short
operating history, business category outside the current VC focus, etc.) can and should consider
1Often also referred to as equity crowdfunding2Family, friends, and fools can provide loans at their discretion. A company can also issue securities to both
accredited and unaccredited family and friends under Regulation D rules 506 or 504. These issues are notablyrestricted to preexisting contacts through a strict ban on advertising or widespread communication of the issue
3See, for example, the language in Wefunder’s launch guide at link
3

turning to securities crowdfunding. Far from unraveling, the market is, so far, robust. I expect the
market to continue to grow in the foreseeable future.
The paper is organized as follows. Section 2 reviews the related literature, Section 3 details
the current market structure, Section 4 sketches a model motivating a set of credible issuer quality
signals that optimizing investors should respond to, Section 5 presents the securities crowdfunding
data, Section 6 contains the results of the analysis, and Section 7 concludes. All tables and figures
are in the respective appendices.
2 Related Literature
My work extends the literature on financing decisions of early stage companies. At a high level,
there is consensus that early stage companies struggle to secure financing and that banking frictions
are a main problem. Venture capital is part of the solution for some companies, but venture
capital does not tend to reach very early stage companies and is expensive. Work on rewards-
based crowdfunding suggests that, though available very early, this market inefficiently funds both
high and low quality companies. Initial theoretical work suggests securities crowdfunding could
efficiently fund very early stage companies, but there is limited empirical evidence on whether the
market will succeed.
Berger and Udell (1998) provide a helpful taxonomy of financing options used by companies at
different stages of development and document that early stage companies have limited access to
external financing. Robb and Robinson (2014) provide a detailed breakdown of the financing of
business startups in the Kauffman Firm Survey that incorporated in 2004 and survived through
2007. Of the 3,093 startups in the sample, 1,439 have outside debt and only 205 have outside equity
as of 2007. 11% of the average startup’s financing comes from family and friends, 2% from business
bank loans and credit lines, 6% from angel investors, and <1% from venture capital. The majority
of a given startup’s financing consists of personal loans taken out by the founders and business and
personal credit card balances.
Recent research suggests that early stage companies have an increasingly hard time securing
bank loans. Mills and McCarthy (2014) note that despite bank loans to large businesses rising 4%
over 2009-2014, lending to small businesses fell 20% during the same period. Mills and McCarthy
4

identify bank consolidation as a major cause. Large banks using standardized quantitative criteria
to assess loan applications are less likely to make loans to small businesses than smaller, more local
banks who can better utilize relationship and qualitative information. Other important frictions
include the fact that transaction costs incentivize banks to focus on larger loans and that stricter
bank capitalization requirements and bank examiner assessments in the wake of the financial crisis
put pressure on banks to shed their small loan portfolios.
There is potential for the venture capital market to fill some of this financing void. Gompers
and Lerner (2001) overview the growth of the VC market and its role in financing early stage
companies. That said, the VC market is characterized by large investments in few companies. VCs
invested roughly $24 billion in early stage companies in 2014, but did so through only 2,800 deals
according to PitchBook. For comparison, over 27,000 startups are registered in just Silicon Valley
on the popular angel investing site AngelList.com.
Put another way, the venture capital market works well to the extent that VCs can take signifi-
cant equity stakes and then add value through active management. As such, VCs spend significant
resources screening companies and negotiating investment terms. These salient features have been
extensively explored in the finance literature. Lerner (1994) and Sørensen (2007) provide evidence
that VCs can add value through activities including timing the IPO market, monitoring, and gen-
eral management. Kaplan and Stromberg (2003) analyze around 200 contracts between VCs and
early stage companies and show that VCs seek rights that match proposed theoretical solutions to
classic principal-agent problems.
By construction, as described below, the US securities crowdfunding market is instead targeted
to earlier, smaller investments. As such, the closest existing financing source is rewards-based
crowdfunding. Rewards-based crowdfunding became a mainstream funding channel with the launch
of SellaBand, a platform for artists to raise money from their fans, in 2006. The market is now
represented by websites such as Kickstarter and Indiegogo and features entrepreneurs pre-selling
a new consumer product or piece of media to be developed and then sold commercially at a later
date.
Research on rewards-based crowdfunding suggests that the market is characterized by family,
friends, and fools “gift-giving” to entrepreneurs. Cordova et al. (2015) consider technology projects
launched on Kickstarter, Indiegogo, and two other sites, and find that investors back projects
5

without regard to the technical merits of the project. Frydrych et al. (2014) reach a similar
conclusion using data from just Kickstarter. Gerber et al. (2012) interview supporters of projects
on Kickstarter and conclude that feelings of connectedness and community drive their contributions.
That rewards-based crowdfunding is driven by foolish money is perhaps epitomized by Zack Brown’s
success in raising $55,000 from over 6,900 backers on Kickstarter to make a bowl of potato salad.
In contrast, initial theoretical work suggests that securities crowdfunding could provide an effi-
cient market for financing early stage companies. Strausz (2016) illustrates how securities crowd-
funding allows entrepreneurs to reduce their demand uncertainty, but that potential gains here
are traded off against costs associated with solving the moral hazard problem. Brown and Davies
(2016) provide a model of securities crowdfunding when both unsophisticated and sophisticated
investors are present. They show that efficient financing occurs for a wide range of project sizes as
sophisticated agents are able to learn from the actions of unsophisticated agents and invest only in
high quality projects.
Still it is far from obvious that a securities crowdfunding market in practice would not unravel
in the face of severe information asymmetry and moral hazard challenges. Empirical work to date
has been extremely limited as the first securities crowdfunding portal for unaccredited investors,
Seedrs, only opened in the UK in 2012. So far, the literature’s focus has been on the effectiveness of
entrepreneur signals. Ahlers et al. (2015) use data from the Australian Small Scale Offerings Board
(ASSOB) and find that investors invest more in companies whose founders retain more equity and
provide more detailed information about company risks. Vismara (2016) conduct a similar exercise
using a sample of 271 projects listed on two UK portals, Crowdcube and Seedrs, and find that the
entrepreneur’s social capital is also important.
3 Background on US Securities Crowdfunding
The idea of securities crowdfunding took hold in the US following the collapse of the IPO market
after the 2008 recession. In an influential series of articles and congressional testimony, David
Weild, a former Vice Chairman of NASDAQ, argued that increased regulatory requirements and the
decline of buy-and-hold investing caused this collapse by reducing the return to going public. See,
for example, Weild and Kim (2010). Weild continues that, consequent to this, venture capitalists
6

now seek to maximize their returns through pursuing private buyouts and so focus on investing in
early stage companies with obvious Fortune 500 buyers. Arguably, a noteable recent example is
Walmart’s acquisition of Jet.com for $3 billion on August 8th, 2016. In his view, ultimately fewer
early stage companies are funded than otherwise; there is a bias to funding companies in established
industries rather than risky, new ventures; and everyday investors miss out on the potentially large
returns from participating in IPOs.
The 2012 Jumpstart Our Business Startups (JOBS) Act was designed largely to address Weild’s
three long-term concerns. Taking a page from rewards-based crowdfunding (that itself only started
gaining prominence in 2006), Title III of the act allows companies to issue up to $1 million dollars
worth of securities a year to unaccredited individuals through SEC approved funding portals. In
2015, regulators finalized Regulation Crowdfunding (Reg CF) to enact Title III of the JOBS Act,
and the US securities crowdfunding market finally went live on May 16th, 2016.
3.1 Regulation Crowdfunding
The investment community is excited about Reg CF for two specific reasons. First, it allows
unaccredited investors to invest in companies through easy online interfaces. All investors can
invest at least $2,000 a year with the cap growing with investor income. See Table 1 for example
investment limits. Second, it permits this investment with minimal reporting requirements for
issuers. Before the issue, companies only need to file a short form, Form C, with the SEC listing basic
information about officers, directors, the issuer’s business, method for pricing the issue, minimum
offering amount and deadline, and reviewed (rather than audited) GAAP financial statements.4.
Preparation costs for filing this form are as low as $2,500. After the issue, most companies need to
file only a single annual report, Form C-AR, with certified financial statements.5
Beyond the above, several other regulatory details shape the market. Issuers cannot advertise
their Reg CF offering beyond a notice that directs investors to the portal’s website. Securities
purchased in a Reg CF issue generally cannot be resold for a period of one year. And issuers with
more than $25 million in total assets and over 500 unaccredited equity holders of record do still
need to separately file financials with the SEC under section 12(g) of the Exchange Act. See the
4Issuers raising $100,000 or less only need financial statements certified by the principal executive officer5Form C-AR needs to be filed on an ongoing basis if the issuer has more than 300 holders of record, but companies
with total assets under $10 million are only required to submit three annual reports
7

complete SEC rule here.
The first month of securities crowdfunding saw 40 companies start issues seeking an upper
bound total of $25 million in funding through 8 funding portals. By the end of the first month,
over $2 million had been invested in Reg CF issues for an impressive capital inflow rate of around
$70,000 per day.
3.2 Portals
As of November 12, 2016, the SEC has approved 21 funding portals to conduct securities crowdfund-
ing issues.6 Several have yet to open and one, uFundingPortal, has already gone out of business.
Visually, these portals are similar to their rewards-based crowdfunding counterparts. The typical
portal has a landing page with a statement that describes securities crowdfunding, explains why it
is exciting, and provides examples of companies that have successfully conducted an issue and links
to all current issues. The current issues are often displayed in a large table with cards containing
the issuer logo and issue details. Clicking on a card takes a potential investor to the issue page
that provides details on the issuing company through text, video, pictures, and financial statements
along with information on the number of investors and the amount invested in the issue so far.
See Figures 13 and 14 in the online appendix for representative screenshots of the various landing
pages. See Figure 15 in the online appendix for a representative issue page.
In addition to serving as the financial intermediary, portals have several fiduciary duties with
respect to the unaccredited investors. Portals must take steps to ensure that the issuers comply
with Reg CF, have a system for recording securities holders, and do not intend to defraud investors.
Portals must also work to check that investors comply with investment limitations and provide a
channel for companies and investors to publicly discuss the offering on the platform. Portals are not
allowed to have a financial interest in a company apart from compensation for their intermediary
services and must disclose any compensation they expect to receive. Finally, portals are prohibited
from offering investment advice, soliciting purchases, or compensating promoters for solicitations.
6Indiegogo, a popular rewards-based crowdfunding site, created a securities crowdfunding portal joint with Mi-croVentures on November 15th, 2016
8

3.3 Companies
As of November 12th, 2016, 141 companies have started or concluded securities issues under Regu-
lation Crowdfunding. These companies represent a diverse set of industries ranging from consumer
products to healthcare. Issuers include:
• Haint Blue Brewing Company, “The only craft microbrewery in Mobile, Alabama”
• Evelo, “Smart electric bikes, sold direct to the consumer”
• Sondors Electric Car, “Most attractive, affordable electric car ever”
• Whim, “A dating app that sets you up on actual dates”
• Vetpronto, “On-demand, house call veterinarians”
Alcoholic beverage companies are particularly well-represented with over 10 breweries and dis-
tilleries seeking funding. Rewards-based crowdfunding platforms historically prohibited companies
from offering alcoholic products as the reward. Securities crowdfunding is then the first chance
many breweries and distilleries have had to access any sort of crowfunding market.7
Despite often being referred to as equity crowdfunding, the SEC rule does not provide strict
guidance on what securities can and cannot be issued under Regulation Crowdfunding. In practice,
companies issue equity only about half the time. Many companies instead choose to issue debt,
convertible notes, LLC membership units, or revenue sharing agreements.
Beyond choosing a type of security to issue and a portal to issue through–multihoming is
prohibited–companies must also choose a minimum offering amount and deadline date. The min-
imum offering amount is restricted to be under the maximum of $1 million and the deadline date
is restricted to be greater than 21 days after the start of the issue. The minimum offering amount
and deadline date are important values because securities crowdfunding operates under an all-or-
nothing principle. Investments in an issue are put in escrow and are not released to the company
unless the sum is greater than the minimum offering amount by the deadline date. Interestingly,
companies are allowed to change both the minimum offering amount and deadline date over the
course of the issue subject to SEC approval. However, the potential for abuse is limited as portals
are required to notify investors of such changes and investors are allowed to cancel their investments
7Various rewards-based crowdfunding platforms also ban rewards that claim to treat illnesses, energy food anddrinks, genetically modified organisms, and aviation
9

at any point up to 48 hours before the deadline. In practice, many issuers do change either their
minimum offering amount or deadline date at least once. Finally, if the issue is over-subscribed,
then securities are allocated at the discretion of the issuer. In practice, issuers usually pre-specify
that they will allocate on a first-come first-served basis.
4 Model of Security Issuance
Securities crowdfunding faces classic problems of information asymmetry and moral hazard. In-
vestors may not be able to screen for high quality issuers, nor incentivize them to work after the
issue. As such, a priori, there are good reasons to expect the market to unravel and fail to attract
investors other than family, friends, and fools.
Economic theory suggests several ways for high quality issuers to mitigate information asym-
metry and moral hazard problems. A unified model of a securities crowdfunding issue is beyond
the scope of this paper and is a promising avenue for future theoretical work. For now, I consider
a basic asymmetric information model of security issuance to fix ideas. Other models, including
Myers and Majluf (1984) and the principle-agent moral hazard models in Tirole (2006), suggest
similar conclusions.
Following DeMarzo and Duffie (1999), assume that an entrepreneur has already invested I in a
project and needs cash immediately to meet some outside expenses (and so discounts future payoffs
at δ < 1 relative to cash in hand). Also assume that the project will produce a random payoff, π,
tomorrow that is independent of the entrepreneur’s effort and that the entrepreneur has a private
signal, Z, on this next-period payoff.
The entrepreneur can raise money now by selling a fraction q of a security B that she writes on
the project’s payoff (respecting limited liability constraints) to risk neutral, competitive investors
for price P (q). The interest rate is taken to be negligible. Assuming that investors have a lower
bound expectation on the payoff based on information, Zo, that is E(B(π)|Z) ≥ E(B(π)|Zo), the
entrepreneur solves
maxB,q
qP (q) + δ(1− q)E(B(π)|Z) (1)
10

With some mild additional restrictions, DeMarzo and Duffie (1999) show that the optimal
security is debt. Intuitively, debt is relatively insensitive to the entrepreneur’s private information.
As such, the entrepreneur is able to sell off more of the right to future positive cashflows through
debt than otherwise. DeMarzo and Duffie also demonstrate that a separating equilibrium exists with
the price of the security increasing in the investors’ lower bound expectation and the entrepreneur’s
retention of potential future payoff:
P (q) = E(B(π)|Zo)qδ−1 (2)
It is important to stress here that the securities crowdfunding market is not itself a pricing
mechanism. A securities crowdfunding issuer designs and prices a security on its company and
then offers this security for sale as is. Of course, any limited liability security is a good bargain at
some price. To apply DeMarzo and Duffie (1999), I assume that entrepreneurs generally attempt to
“put lipstick on the pig,” and so many securities on closer inspection will not warrant their price.
With that qualification, the DeMarzo and Duffie model suggests that if the securities crowd-
funding market consists of optimizing investors, then companies issuing debt, with high retention,
and positive information, Zo, should receive more investment. That is, investors should prefer to
invest in debt issues over equity and convertibles issues as the latter may reflect market inefficien-
cies and so be less likely to support their valuation. Similarly, investors should be more willing
to invest in issues where the entrepreneur retains a lot of the company and where there is good
evidence to suggest high lower bound payoffs as these issues are more likely worthy of their stated
price. I investigate the extent to which the US securities crowdfunding market is consistent with
the assumption of optimizing investors after first documenting the market.
5 Data
The US securities crowdfunding market opened on May 16th, 2016. I have collected data on the
full universe of issues. The main data consists of hourly observations from June 13th through
November 12th, 2016 on the progress of each individual issue–capturing the current number of
investors, amount invested, and issue details. The data also includes the SEC filings of all issuers,
11

two years of GAAP financial statements for every issuer, all tweets sent by issuers, and self-reported
locations and social media accounts of a large sub-sample of investors along with which issues they
have invested in.
The data appears to depict a robust market. The US securities crowdfunding market is growing
linearly in the number of investors and amount invested, is attracting diverse companies who due
to their short operating history would likely struggle to secure traditional financing, and features
investors who self-describe as sophisticated. Moreover, simple comparisons of issues that succeeded
to those that did not suggest that investors are screening out lemons. I more formally investigate
whether investors are more than just family, friends, and fools in Section 6 below.
5.1 Market
As of November 12th, 2016, 141 companies have started Regulation Crowdfunding issues across
19 funding portals. 5 companies have already completed a first issue and begun a second issue.8
These 146 issues have collectively attracted over $13.6 million in funding through 17,000 distinct
investments. The average issue has raised $90,000 from 120 investors against a minimum offering
amount of $100,000 and still has 37 days to collect the rest. Table 2 provides additional statistics
on the aggregate market.
The largest funding portal by any metric is Wefunder. 58 issues have been started on Wefunder
that have together attracted $9 million in funding through 13,000 distinct investments. The second
largest funding portal is StartEngine with 19 issues that have together attracted $2 million through
1,800 distinct investments. See Table 3 for a breakdown of the issues by funding portal.9
Given that the US securities crowdfunding market has only existed for half a year, $13.6 million
in funding is an impressive figure. The market continues to grow rapidly measured in both the
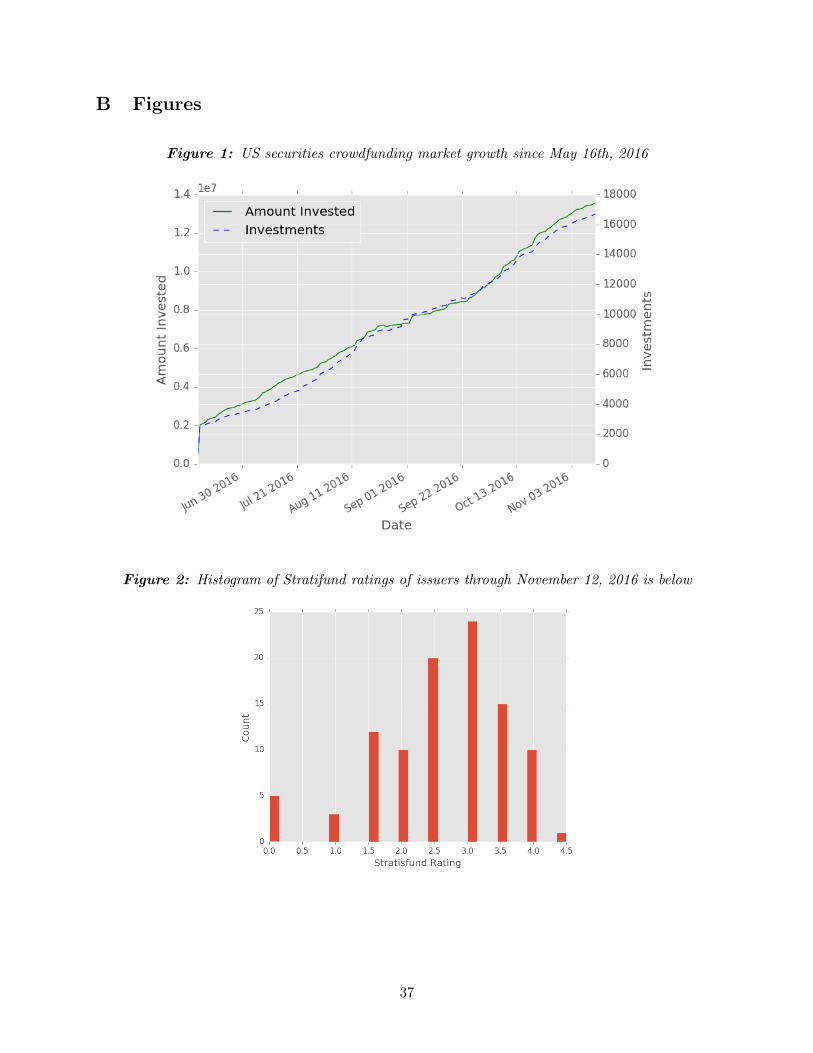
number of investors and the amount invested. The time series in Figure 1 shows that the market is
experiencing nearly constant linear growth in both metrics. Correspondingly, there has also been
a steady deal flow of around 20 new issues a month.
Companies issuing securities range from new craft breweries like Haint Blue Brewing Company,
which advertises itself as “The only craft microbrewery in Mobile, Alabama,” to new consumer
8Companies are not allowed to multihome and so can only conduct a single issue at a time9uFundingPortal was delisted as a funding portal on November 9th, 2016. No issue listed on the portal succeeded
and the links on its website are now broken
12

goods producers such as Evelo, “Smart electric bikes, sold direct to the consumer.” Some other
notable issuers include Vetpronto, “On-demand, house call veterinarians,” and Tradeshow, “The
world’s first virtual conventions and trade shows.” The three most common securities issued are
equity, convertible notes, and debt. 62 companies have chosen to issue equity, 43 have chosen to
issue convertible notes (all but one of which is a SAFE), and 25 have chosen to issue debt. Table
5 provides the number of issues offering each type of security.
Many of the issuers in the US securities crowdfunding market are startlingly young companies.
The median issuer is only 10 months old. Due to lack of operating history alone, most of these
companies would likely fail to secure traditional outside financing.10 At the start of the issue, the
median issuer has 3 employees, assets of $26,000, and no debt or revenue. The median issuer is
seeking to raise $70,000 and so almost triple its asset base. Of note, several of the companies
pursuing issues are already profitable. Additional summary statistics from the financial statements
of these issuers are collected in Table 6.
As the US securities crowdfunding market is still in its infancy, ongoing issues easily outnumber
issues that have already closed. A total of 50 issues have closed as of November 12th, 2016. 26 of
these closed issues succeeded in meeting their minimum offering amount by their deadline date. 3
of these successful closed issues raised the maximum of $1 million, whereas most raised between
$100,000 and $200,000.
Importantly, US securities crowdfunding operates under an all-or-nothing principle. Only issuers
who raise more than their minimum offering amount by their deadline date receive the financing.
However, terming an issue successful is somewhat misleading as issuers can (and do) change their
minimum offering amount and deadline over the course of the issue subject to SEC approval. The
median issuer has made one such amendment. The potential for abuse here is limited though as
current investors in the issue are alerted to the change and can withdraw their investments. As
such, it is not possible to turn any issue into a “success.”
Comparing the attributes of unsuccessful and successful issues already provides some evidence
that investors in the US securities crowdfunding market are able to screen out lemons. Issuers
10Previously, the quickest a typical company has been able to receive financing is through online small businesslenders such as OnDeck or Kabbage (opened in 2006 and 2009 respectively). OnDeck and Kabbage offer $100,000lines of credit at between 9%-108% APR to businesses that are at least 9 months old with $75,000 of annual revenue(OnDeck) or over 1 year old with $50,000 of annual revenue (Kabbage). Any draws on the line of credit are consideredindependent loans and must be paid back within 6 or 12 months
13
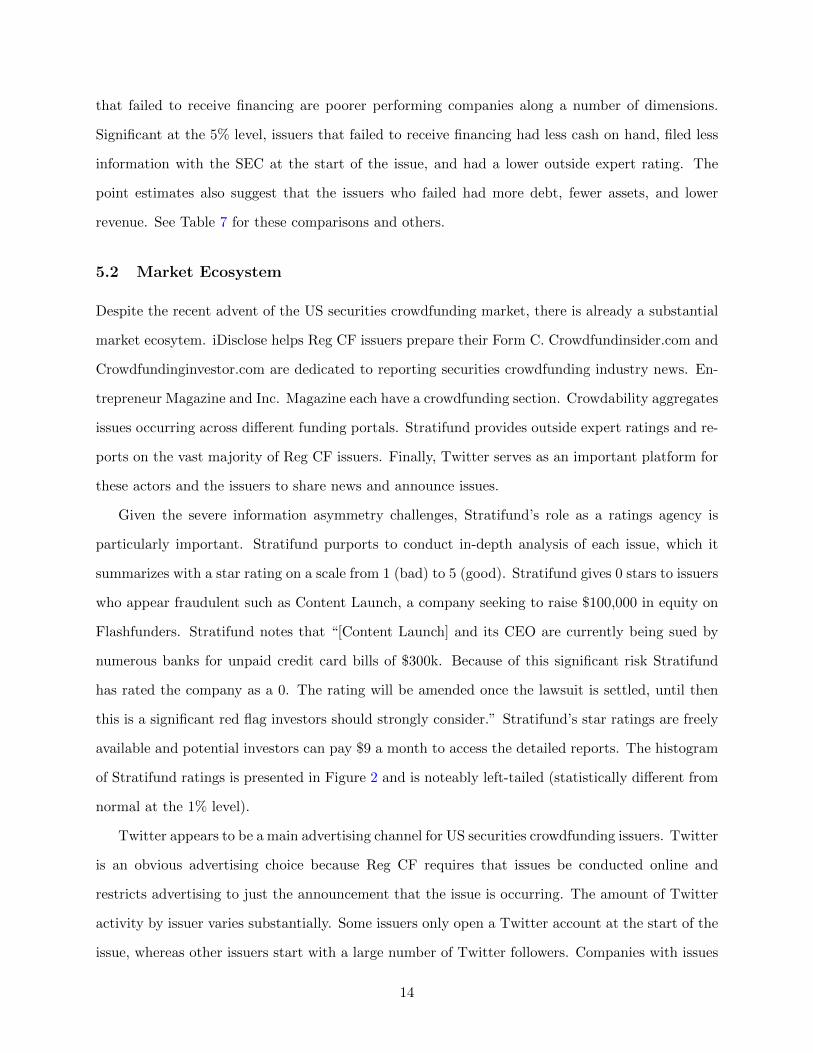
that failed to receive financing are poorer performing companies along a number of dimensions.
Significant at the 5% level, issuers that failed to receive financing had less cash on hand, filed less
information with the SEC at the start of the issue, and had a lower outside expert rating. The
point estimates also suggest that the issuers who failed had more debt, fewer assets, and lower
revenue. See Table 7 for these comparisons and others.
5.2 Market Ecosystem
Despite the recent advent of the US securities crowdfunding market, there is already a substantial
market ecosytem. iDisclose helps Reg CF issuers prepare their Form C. Crowdfundinsider.com and
Crowdfundinginvestor.com are dedicated to reporting securities crowdfunding industry news. En-
trepreneur Magazine and Inc. Magazine each have a crowdfunding section. Crowdability aggregates
issues occurring across different funding portals. Stratifund provides outside expert ratings and re-
ports on the vast majority of Reg CF issuers. Finally, Twitter serves as an important platform for
these actors and the issuers to share news and announce issues.
Given the severe information asymmetry challenges, Stratifund’s role as a ratings agency is
particularly important. Stratifund purports to conduct in-depth analysis of each issue, which it
summarizes with a star rating on a scale from 1 (bad) to 5 (good). Stratifund gives 0 stars to issuers
who appear fraudulent such as Content Launch, a company seeking to raise $100,000 in equity on
Flashfunders. Stratifund notes that “[Content Launch] and its CEO are currently being sued by
numerous banks for unpaid credit card bills of $300k. Because of this significant risk Stratifund
has rated the company as a 0. The rating will be amended once the lawsuit is settled, until then
this is a significant red flag investors should strongly consider.” Stratifund’s star ratings are freely
available and potential investors can pay $9 a month to access the detailed reports. The histogram
of Stratifund ratings is presented in Figure 2 and is noteably left-tailed (statistically different from
normal at the 1% level).
Twitter appears to be a main advertising channel for US securities crowdfunding issuers. Twitter
is an obvious advertising choice because Reg CF requires that issues be conducted online and
restricts advertising to just the announcement that the issue is occurring. The amount of Twitter
activity by issuer varies substantially. Some issuers only open a Twitter account at the start of the
issue, whereas other issuers start with a large number of Twitter followers. Companies with issues
14

closed by November 12th, 2016 had on average 2,200 followers and 800 friends by the end of the
issue. The average company sent approximately 1,000 tweets before the issue and 200 tweets over
the course of the issue. See Table 8. On inspection, tweets over the course of the issue are a mix
of regular business advertisements along with specific references and links to the Reg CF issue. I
hope to explore the impact of advertising on the success of issues in later work.
5.3 Specific Issues
Examining the hourly data on the number of investors and amount invested in each issue sheds
important light on how issues unfold over time. Issues typically last four months and start with
a rapid influx of investors and investments that is perhaps driven by family and friends. For a
representative example, see the surge in investments at the beginning of Mobodexter’s, “Backend
software platform makes it easy to launch any IoT company,” ongoing issue depicted in Figure 3.
The arrival rate of additional investors and investments often slows after the first week. Sometimes
this middle period of the issue is broken by a few periods of rapid progress that may be attributable
to advertising. The ongoing issue of Sondors Electric Car in Figure 4 displays an unusually large
number of such surges. Finally, several issues end with another rapid influx of investors and invest-
ments possibly because portals tend to heavily promote concluding issues through page placement
and emails to registered users. The last week of the closed issue of Hops and Grain, “Gold Medal
winning craft brewery in Austin, Texas,” in Figure 5 is a good illustration. That these dynamics
are rather general can be seen in Figures 16 and 17 in the online appendix, which respectively
display the number of investors and amount invested in each issue over time.
In a handful of cases, it appears that issuers make an attempt to “save” an issue that has
currently attracted little investment–again issuers need to raise more than their minimum offering
amount by their deadline date in order to receive any financing. An issuer might try to increase the
likelihood of success through lowering its minimum offering amount or extending its deadline date.
For example, Farm from a Box, “Complete off-grid toolkit for tech-powered agriculture,” original
sought to issue at least $465,000 by September 19th, 2016 on Republic, but as of November 12th
was trying to issue at least $100,000 by December 16th, 2016. Alternatively, sometimes issues
manage to ensure success through what seem to be “pre-arranged” investments. See the ongoing
issue of Green Sense Farms, “Transforming farming and disrupting produce distribution,” in Figure
15

6, wherein the issuer met its minimum offering amount through a comparatively massive investment
of $100,000 on the first day.
The high frequency of the data also provides some insight into the individual transactions. Two
thirds of hours of issues that saw any investment had only a single investment. As such, by and
large, the individual investments are identified in the data. Surprisingly, there is a large amount
of dispersion in the identified individual investments and large portal fixed effects. The average
investor on Republic (notably a “social cause”–themed portal) invested only $400, whereas the
average investor on Wefunder invested $900. The standard deviation of investments on Republic is
$1,300, whereas the standard deviation of investments on Wefunder is over $3,000. See Table 9 for
summary statistics on the identified individual investments across all portals.
5.4 Investors
There is a wealth of data on who exactly is investing in the US securities crowdfunding market.
Importantly, these investors do not appear to be just family, friends, and fools. Many investors
are, on face, sophisticated members of start-up communities and the financial sector.
This data comes from a subset of investors on Wefunder who elect to create profile pages
displaying their name, location, a descriptive sentence, and links to their social media accounts
(most commonly their LinkedIn and Facebook). Further, a large subset of issuers on Wefunder
choose to display who their investors are through linking to these profile pages. There is potential
for selection as I only see an investor’s profile if the investor creates a profile and if the issuer links
to the portfolio. Still I am able to collect the profiles of 1,700 of the approximately 13,000 total
investors on Wefunder.
Most issuers and their investors are based in Silicon Valley, New York, Seattle, and Chicago.
Austin and DC are also well represented. See Figures 7 and 8 for maps of where issuers and
investors are located respectively.11 One immediate finding is that investment is not particularly
localized. The average investor is located over 900 miles from the issuer she invests in. Also of
note, international investors (though not issuers) are allowed to participate in the US securities
crowdfunding market. Already most European and Asian countries are represented. Summary
statistics on the distances between issuers and their investors are provided in Table 10.
11Issuers are required to report their physical location in their Form C filing
16

Only a handful of issuers, notably Rodeo Donuts, “Gourmet donuts served with fried chicken and
whiskey,” and The Speakeasy, “Sold-out San Francisco show featuring 35+ actors in a 1,200 page
script,” attract primarily investors within short driving distance. The visualizations of investor
locations clearly illustrate this fact. Investors in Rodeo Donuts, Figure 9, are almost entirely
concentrated around the company’s store in Seattle, Washington. In contrast, investors in Cleveland
Whiskey are spread widely across the United States, Figure 10.
Many of these investors claim to be quite sophisticated. See for example the descriptive sen-
tences posted by investors in N1CE, “Frozen cocktails from superstar DJs Ingrosso, Axwell &
Alesso” in Figure 11. Investing are James Donnell, “58, an auditor and former banker for past 20
years...,” and Robert Dyson, “Real Estate Consultant and avid stock market investor looking for
alternative ways to grow portfolio....” Of course, these are just selected examples. A full exploration
of the LinkedIn and Facebook accounts of investors is a promising direction for future research.
That said, the above investors are not alone. Of the 600 investors who write a biographical sen-
tence, 173 mention a financial title, 44 mention entrepreneur or VC, and 31 mention a degree. Only
35 bios mention family or friends.
From the same data it is possible to discern part of the investor network. While most investors
only invest in a single issue, a handful of investors invest in up to eight issues. In the visualization
of the network in Figure 12 investors (nodes) are connected with an edge whenever they co-invest
in the same issue. That there is little co-investment can be seen from the fact that the separate
issues appear as distinct clouds of red points. The handful of connecting investors show up as lone
red dots. It will be interesting to track whether co-investment increases over time. In particular,
I hope to examine the extent to which investors follow each other into issues and their motivation
for doing so.
The data detailed above depict a growing market, attracting very early stage companies and
fairly sophisticated investors from around the world. The data appears to suggest that investors
are more than just family, friends, and fools. I now turn to regressions that demonstrate that, after
the first week, investors invest more in issuers with more assets and less debt who submit more
information to the SEC. This result is consistent with family, friends, and fools arriving in the first
week and investing indiscriminately and relatively more sophisticated investors arriving after and
driving the outcome of the issue.
17

6 Results
At issue is whether US securities crowdfunding provides a new source of funding for very early
stage companies. The answer is far from apparent as the market could certainly unravel in face of
severe asymmetric information and moral hazard problems. Despite these challenges, examining the
universe of closed issues, I show that investors invest more in issuers with stronger balance sheets
who provide more information to the SEC. This result is consistent with the market attracting
optimizing investors who find and invest more in higher quality issuers.
Lending credence to this interpretation is a stark difference in apparent sophistication between
investors in the first week and the first month. I demonstrate that total investment by the end
of the first week is not explained by issuer balance sheets nor information submitted to the SEC
and that investment by the end of the first month is. This result is consistent with family, friends,
and fools constituting the majority of investors in the first week, and relatively more sophisticated
investors arriving thereafter. That early investors are family, friends, and fools is confirmed by
anecdotal evidence. Several portals specifically advise issuers to “activate your crowd” and get
“family, friends, and fans” to invest by day seven.
6.1 Closed Issues
I examine whether investors invest more in issuers who are issuing debt, who have stronger balance
sheets and higher outside ratings, and who submit more information to the SEC using the 50
Regulation Crowdfunding issues that have closed as of November 12th, 2016.12 Broadly speaking,
I find evidence affirming that this is the case. Controlling for the scale of the issue, investors invest
more in companies with more assets, less long term debt who have higher Stratifund ratings and
who submit more information to the SEC. Tables 12, 13, and 14 build this conclusion through short
regressions, and Table 15 presents the long regression. All regression tables display dollar values in
thousands, White standard errors, and adjusted R2s.
To understand whether investors discriminate between issues by security type offered, Table 12
considers short regressions of the amount invested (Column 1), the amount invested scaled by the
original minimum offering amount (Column 2), and the number of investors (Column 3) on fixed
12The 50 closed issues are from 50 distinct companies. That is, no issuer closed multiple issues before November12th, 2016
18
effects for the type of security offered and the original minimum offering amount. That is, the
specification in Column 1 is:
Amount Investedi = α+ βe1Equity + βd1Debt + βmMin Offeringi + ei (3)
Here equity groups common and preferred stock and the omitted category consists of SAFEs, a
convertible note, and LLC membership units.
Interestingly, Table 12 provides no evidence of investor preference for different securities. The
point estimates suggest that investors invest more in debt than SAFEs and LLC membership units
than equity. The point estimates also suggest that equity issues attract the most investors though
this result is driven by the highly successful issue of Legion M. Still, none of these differences are
statistically significant at conventional levels.
To understand whether investors discriminate between issues by balance sheet metrics, Table
13 considers short regressions of the amount invested (Column 1), the amount invested scaled by
the original minimum offering amount (Column 2), and the number of investors (Column 3) on
the issuer’s assets, cash, short term debt, long term debt, revenue, and debt to asset ratio in the
most recent (and often only) fiscal year along with the original minimum offering amount. The
specifications are of the form:
Amount Investedi = α+ βaAssetsi + βcCashi + βsdShort Term Debti + βldLong Term Debti
+ βrRevenuei + βbDebt to Assetsi + βmMin Offeringi + ei
(4)
Across all three outcomes considered, I find that investors invest more in issuers with more assets
(and specifically more cash) and less in companies with more long term debt. As seen in Column 1,
a $1,000 increase in the issuer’s assets is associated with $170 in additional investments, a $1,000
increase in cash is associated with $760 in additional investments, and a $1,000 increase in long
term debt is associated with a $180 decrease in investments. Alternatively, as seen across Columns
2 and 3, a $100,000 increase in issuer assets is associated with the issue raising an additional 32% of
its original minimum offering amount and receiving 28 additional investors. Meanwhile, a $100,000
increase in long term debt is associated with the issue raising 29% less of its original minimum
offering amount and receiving 36 fewer investors. Overall, there is strong evidence that investors
19

invest based on issuer balance sheets. Balance sheet variables alone explain a notable 30% of the
variance in amount invested.
Finally, to understand whether investors discriminate between issues based on the amount and
quality of information released, Table 14 considers the same short regressions on the amount of
information the issuer filed with the SEC in megabytes, the Stratifund rating of the issuer, a dummy
for no Stratifund rating, and the original minimum offering amount.
These regressions suggest that investors invest more in issuers who offer more and higher quality
information. As seen in Column 1, a 1 megabyte increase in the amount of information filed with
the SEC is associated with receiving $3,300 in additional investments. Similarly, a 1 star increase in
the issuer’s Stratifund rating is associated with receiving $49,000 in additional investments. These
results largely hold for the other outcomes considered. In particular, a 1 megabyte increase in the
amount of information filed with the SEC is associated with raising an additional 5.8% against the
original minimum offering amount and securing an additional 3 investors.
Together, the short regressions provide substantial evidence that investors distinguish between
issues based on issuers’ balance sheets and information released. This conclusion is affirmed in the
long regressions in Table 15. Specifically, Table 15 considers long regressions of the amount invested
(Column 1), the amount invested scaled by the original minimum offering amount (Column 2), and
the number of investors (Column 3) on security type fixed effects; issuer assets and long term debt
in the most fiscal recent year; the amount of information the issuer filed with the SEC in megabytes;
the Stratifund rating of the issuer, a dummy for no Stratifund rating, and the original minimum
offering amount. The main specification is:
Amount Investedi = α+ βe1Equity + βd1Debt + βaAssetsi + βldLong Term Debti
+ βfFiling Sizei + βratRatingi + βnrat1No Rating + βmMin Offeringi + ei
(5)
As seen in Column 1, the results from the short regressions are largely confirmed. A $1,000
increase in issuer assets is associated with $125 in additional investments, a $1,000 increase in long
term debt is associated with a $154 decrease in investments, and a 1 megabyte increase in the
amount of information submitted to the SEC is associated with $3,000 in additional investments.
20

Similarly, as seen across Columns 2 and 3, a $100,000 increase in issuer assets is associated with
the issue raising an additional 25% of its original offering amount and receiving an additional 15
investors, whereas a $100,000 increase in long term debt is associated with the issue raising 25%
less of its original minimum offering amount and receiving 21 fewer investors.
6.2 Investors in First Week vs First Month
That at least some investors are relatively sophisticated is further supported by substantial hetero-
geneity in how investors assess issuers over time. I document below that investors in the first week
do not invest more in issuers with stronger balance sheets who submit more information to the
SEC. Several portals specifically advise issuers to “activate your crowd” and get “family, friends,
and fans” to invest by day seven. As such, I conclude that the majority of investors in the first
week consist of family, friends, and fools. After the first week, relatively more sophisticated in-
vestors arrive. Already by the end of the first month, their more discriminating money dominates.
I conclude that the US securities crowdfunding market attracts a substantial number of relatively
more sophisticated investors after the first week.
Table 16 considers long regressions of the amount invested by the end of the first week (Column
1), the amount invested by the end of the first week scaled by the original minimum offering amount
(Column 2), and the number of investors by the end of the first week (Column 3) on security
type fixed effects; issuer assets and long term debt in the most fiscal recent year; the amount of
information filed with the SEC in megabytes; the Stratifund rating of the issuer, a dummy for no
Stratifund rating,13 and the original minimum offering amount. That is the main specification is
again:
Amount Invested in First Weeki = α+ βe1Equity + βd1Debt + βaAssetsi + βldLong Term Debti
+ βfFiling Sizei + βratRatingi + βnrat1No Rating
+ βmMin Offeringi + ei
(6)
I estimate these long regressions on the universe of 71 issuers to whom I can associate the
13Stratifund posts a rating for most issuers within the first three business days of their filing
21
number of investors and amount invested seven days after the issuer filed its Form C with the
SEC.14 Of note, an issue is typically listed on its chosen funding portal the day after filing Form
C. From the population of 146 Reg CF issues, I lose 52 issues due to delays in setting up recording
of the various portals, 2 issues who filed less than a week before November 12th, and 21 issues
because the computer program collecting data from the portals did not complete its run on the
seventh day15 As a result, the sample is selected towards issues that occurred over a month after
the opening of the portal hosting the issue. If anything, I expect this selection to bias my results
against finding that early investors are family, friends, and fools because the excitement of being
one of the first ever US securities crowdfunding investors probably drew in a lot of foolish money
in the first weeks of the market.
The results in Table 16 suggest that investors in the first week do not discriminate much between
issuers. Looking across Columns 1, 2, and 3, there is no evidence that investors invest more in debt
issues than issues of SAFEs and LLC units. There is also no evidence that investors invest more in
issuers with higher assets nor in issuers with less debt. For example, a $1,000 increase in the issuer’s
assets is associated with only $15 of additional investment, which is economically and statistically
insignificant. There is some evidence that investors do invest more in issuers who submit more
information to the SEC. As seen in Column 3, a 1 megabyte increase in information submitted to
the SEC is associated with receiving 1 additional investor. Still, tellingly, only 15% of the variance
in the amount invested by the end of the first week is attributable to these variables, whereas they
explain 35% of the variance in the amount invested by the end of the issue. Investments made in
the first week appear to be largely blind to fundamentals.
It must then be the case that the discriminating money arrives after the first week. This is
certainly possible as the majority of investment occurs after the first week. The average issuer has
only raised $27,000 by day seven and will go on to raise over $150,000 by the end of the issue. I now
show that the data suggest that relatively sophisticated investors arrive even before the close of
the first month, whereat the average issuer has raised $55,000, and that their investments by then
already dominate those of the family, friends, and fools from the first week. By the end of the first
month, investments reflect substantially the same assessments of the issuer as total investments at
14The results at days five and nine are broadly similar15These last losses are concentrated in September when I was only able to run the collection program sporadically
22

the conclusion of the issue.
Table 17 presents the results of re-estimating the long regressions from above on the universe of
93 issuers to whom I can associate the number of investors and amount invested thirty days after
the issuer filed its Form C with the SEC.16 From the population of 146 Reg CF issues, I lose 22
issues due to delays in setting up recording of the various portals, 14 issues who filed less than a
month before November 12th, and 17 issues because the computer program collecting data from
the portals did not complete its run on the thirtieth day.
In sharp contrast to investors arriving by the end of the first week, I find that investors arriving
by the end of the month invest more in issuers with more assets, less long term debt, who submit
more information to the SEC and who have a higher Stratifund rating. As seen in Column 1
of Table 17, a $1,000 increase in issuer assets is associated with $24 in additional investments, a
$1,000 increase in long term debt is associated with a $50 decrease in investments, and a 1 megabyte
increase in the amount of information submitted to the SEC is associated with $1,500 in additional
investments. Alternatively, as seen across Columns 2 and 3, a $100,000 increase in issuer assets
is associated with the issue raising an additional 5% of its original minimum offering amount and
receiving 4 additional investors, whereas a $100,000 increase in issuer long term debt is associated
with the issue raising 8% less against its original minimum offering amount and receiving 7 fewer
investors. From these results, I conclude that the US securities crowdfunding market attracts
relatively sophisticated investors to issues even within the first month of the issue.
7 Conclusion
The US securities crowdfunding market opened on May 16th, 2016. Operating under Regulation
Crowdfunding, the enactment of Title III of the 2012 JOBS Act, the market allows unaccredited
investors to purchase securities issued by private companies for the first time.17 The stated goal of
the market is to provide a novel financing source for early stage US companies. However, it is far
from obvious that the market will succeed. To do so, it will need to overcome severe information
asymmetry and moral hazard challenges. The market may unravel and fail to attract anyone other
16The results at days twenty eight and thirty two are broadly similar17With the exception that unaccredited family and friends could previously invest in a private company issuing
under Regulation D with some restrictions
23

than family, friends, and fools.
I show that, now six months in, the US securities crowdfunding market is providing a viable
new funding channel for early stage companies. The data detailed above depict a growing market,
attracting very early stage companies and self-described sophisticated investors from around the
world. The data also reveals that, after the first week, investors invest more in issuers with more
assets and less debt who submit more information to the SEC. This result is consistent with family,
friends, and fools arriving in the first week and investing indiscriminately and relatively more
sophisticated investors arriving after and driving the outcome of the issue.
I conclude that the US securities crowdfunding market is so far robust. High quality early
stage companies can enter the market, signal their quality, and gain access to investors beyond just
family, friends, and fools. I expect the market to continue to grow for the foreseeable future. If
so, there are many promising areas for further research. Open questions include whether potential
investors herd on a new issue and what company attributes are predictive of eventual successful
or unsuccessful exits. Lessons from the securities crowdfunding market will be informative on the
market itself, rewards based crowdfunding, the venture capital and IPO markets, and other settings
where securities are issued.
24

References
Ahlers, G. K., Cumming, D., Gunther, C., and Schweizer, D. (2015). Signaling in equity crowd-funding. Entrepreneurship Theory and Practice, 39(4):955–980.
Berger, A. N. and Udell, G. F. (1998). The economics of small business finance: The roles ofprivate equity and debt markets in the financial growth cycle. Journal of banking & finance,22(6):613–673.
Brown, D. C. and Davies, S. W. (2016). Equity crowdfunding: Harnessing the wisdom of the crowd.
Cordova, A., Dolci, J., and Gianfrate, G. (2015). The determinants of crowdfunding success:Evidence from technology projects. Procedia-Social and Behavioral Sciences, 181:115–124.
DeMarzo, P. and Duffie, D. (1999). A liquidity-based model of security design. Econometrica,67(1):65–99.
Frydrych, D., Bock, A. J., Kinder, T., and Koeck, B. (2014). Exploring entrepreneurial legitimacyin reward-based crowdfunding. Venture Capital, 16(3):247–269.
Gerber, E. M., Hui, J. S., and Kuo, P.-Y. (2012). Crowdfunding: Why people are motivated topost and fund projects on crowdfunding platforms. In Proceedings of the International Workshopon Design, Influence, and Social Technologies: Techniques, Impacts and Ethics.
Gompers, P. and Lerner, J. (2001). The venture capital revolution. The journal of economicperspectives, 15(2):145–168.
Kaplan, S. N. and Stromberg, P. (2003). Financial contracting theory meets the real world: Anempirical analysis of venture capital contracts. The Review of Economic Studies, 70(2):281–315.
Lerner, J. (1994). Venture capitalists and the decision to go public. Journal of financial Economics,35(3):293–316.
Mills, K. and McCarthy, B. (2014). The state of small business lending. Technical report, HarvardBusiness School Working Paper.
Myers, S. C. and Majluf, N. S. (1984). Corporate financing and investment decisions when firmshave information that investors do not have. Journal of financial economics, 13(2):187–221.
Robb, A. M. and Robinson, D. T. (2014). The capital structure decisions of new firms. Review ofFinancial Studies, 27(1):153–179.
Sørensen, M. (2007). How smart is smart money? a two-sided matching model of venture capital.The Journal of Finance, 62(6):2725–2762.
Strausz, R. (2016). A theory of crowdfunding-a mechanism design approach with demand uncer-tainty and moral hazard.
Tirole, J. (2006). The theory of corporate finance princeton university press princeton usa.
Vismara, S. (2016). Equity retention and social network theory in equity crowdfunding. SmallBusiness Economics, 46(4):579–590.
Weild, D. and Kim, E. (2010). Market structure is causing the ipo crisis—and more. Capital MarketSeries, Grant Thornton.
25

A Tables
Table 1: SEC provided example securities crowdfunding yearly investment limits
Investor Annual Income Investor Net Worth Investment Limit
$30,000 $105,000 $2,000$150,000 $80,000 $4,000$150,000 $100,000 $10,000$200,000 $900,000 $20,000$1,200,000 $2,000,000 $100,000
Table 2: Summary statistics for the universe of Regulation Crowdfunding issues as of November12th, 2016. The missing values are due to funding portals that do not display the number of daysremaining, the number of investors, or the minimum investment for the issues that they host
Count Mean Std Min Max Sum
Amount Invested 146 93,763 178,034 0 1,000,000 13,689,384Min Offering Amount 146 110,528 135,309 10,000 1,000,000 16,137,016Days Left 65 37 34 0 181 2,437Investors 139 124 325 0 3,346 17,265Minimum Investment Allowed 84 295 666 0 5,556 24,795
26

Table 3: Total participation in Regulation Crowdfunding issues by funding portal as of November12th, 2016. North Capital, Venture, and Netcapital do not display the number of investors in theissues they host
Portal Count Amount Invested Min Offering Amount Investors
Wefunder 58 9,354,291 4,200,000 13,112StartEngine 19 1,817,582 2,282,395 1,821NextSeed 7 1,442,200 1,040,000 1,053SeedInvest 5 306,563 850,000 299Republic 5 273,370 370,000 614North Capital 1 251,000 251,000 nanFlashfunders 8 124,890 390,000 307Venture.co 4 48,002 1,150,000 nantruCrowd 6 39,440 683,066 46Localstake Marketplace 1 14,000 100,000 6Netcapital 2 12,825 45,000 nanJumpstart Micro 4 5,200 260,000 7uFundingPortal 18 20 1,700,000 0Dreamfunded Marketplace 2 0 1,010,000 0Indie Crowd Funder 1 0 50,000 0Opening Night Capital 1 0 1,000,000 0I-Bankers Direct 2 0 600,000 0Crowdsourcefunded.com 2 0 155,556 0
Table 5: Count of Regulation Crowdfunding issues as of November 12th, 2016 by security offered
Security Type Count
Equity 86SAFE 71Debt 45Unit 15Revenue 5Series Seed Preferred Stock 1Series D-1 Preferred Participating Non-Voting ... 1
27

Table 6: Summary statistics covering the financial statements, SEC filings, Stratifund rating, andfunding portal terms for all Regulation Crowdfunding issues as of November 12th, 2016
Mean Std Min 50% Max
Assets 221,990 641,912 0 25,376 5,015,954Cash 51,041 125,251 -3,286 2,163 774,459AR 5,480 20,234 -1,097 0 133,000Short Term Debt 89,829 296,232 0 0 2,416,993Long Term Debt 175,772 533,894 0 0 3,496,391Revenue 125,493 350,412 0 0 2,597,111COGS 59,941 256,543 -1,057,865 0 2,015,565Tax Paid 344 2,551 -1,622 0 29,082Debt to Assets 4 20 0 0 205Days Since Incorporation 724 973 4 318 4,569Employees 3 4 0 3 28Digital Filing Size (MBs) 20 26 0 16 178Num Docs filed with SEC 6 4 1 6 36Stratifund Rating 2 1 0 2 4% Portal Fee Cash 5 2 0 nan 10% Portal Fee Equity 0 1 0 nan 5Min Offering Amount 110,528 135,309 10,000 72,500 1,000,000Max Offering Amount 628,384 409,830 25,000 999,938 1,000,000Minimum Investment Allowed 295 666 0 nan 5,556
28

Table 7: Comparison of the financial statements, SEC filings, Stratifund rating, and funding portalterms between Regulation Crowdfunding issues that succeeded and failed as of November 12th, 2016
Mean forSuccessful
Issues
Mean forFailed Issues
Difference T Stat
Assets 530,997.56 136,385.64 394,611.92 1.54Cash 72,249.39 20,060.36 52,189.04 2.17AR 6,811.88 1,210.67 5,601.22 1.17Short Term Debt 52,693.24 77,581.35 -24,888.11 -0.56Long Term Debt 247,304.96 294,460.31 -47,155.35 -0.23Revenue 196,234.76 55,733.20 140,501.56 1.19COGS 39,577.76 131,830.40 -92,252.63 -0.82Tax Paid 1,514.71 161.14 1,353.57 1.16Debt to Assets 0.75 5.13 -4.38 -1.34Days Since Incorporation 798.77 690.33 108.44 0.37Employees 3.62 2.38 1.24 1.36Digital Filing Size (MBs) 29.99 9.45 20.54 2.86Num Docs filed with SEC 7.42 4.96 2.46 2.77Stratifund Rating 2.73 1.62 1.11 3.35% Portal Fee Cash 4.73 5.77 -1.04 -1.64% Portal Fee Equity 0.35 0.21 0.14 0.46Min Offering Amount 107,923.08 153,669.42 -45,746.34 -1.45Max Offering Amount 530,807.69 572,723.42 -41,915.72 -0.35Minimum Investment Allowed 270.42 240.00 30.42 0.21
Table 8: Summary statistics of all-time Twitter usage by companies with closed Regulation Crowd-funding issues as of November 12th, 2016
Count Mean Std Min 25% 50% 75% Max
Followers 50 2,218 5,028 0 54 528 1,916 29,290Friends 50 795 1,103 0 17 302 1,092 5,049Likes 50 904 2,214 0 1 131 723 10,507Statuses 50 1,207 2,387 0 11 358 1,452 14,588Tweets Before Issue 50 667 903 0 7 219 1,028 3,163Tweets During Issue 50 166 486 0 0 18 52 2,371
29

Table 9: Summary statistics for individual investments in issues by funding portal
Portal Count Mean Std Min 25% 50% 75% Max
Wefunder 3,758 933 3,103 -49,900 100 250 1,000 100,000StartEngine 434 1,241 5,552 -964 133 500 1,000 100,000Republic 311 436 1,328 20 100 100 250 15,000Flashfunders 215 285 435 50 100 100 250 3,500NextSeed 197 1,339 2,731 -1,900 100 500 1,000 25,000SeedInvest 93 1,011 1,309 350 500 500 1,000 10,000truCrowd 30 2,165 9,426 20 142 228 521 52,000
Table 10: Summary statistics of the distance between the physical address given by an issuer inits Form C and the self-reported location of investors in the issuer
Issuer Count Mean Std Min 25% 50% 75% Max
Cleveland Whiskey 393 941 1,249 0 143 446 1,631 9,462Shape Labs 185 2,110 2,061 0 335 1,858 2,569 8,458N1CE 156 1,495 1,576 10 297 975 2,363 9,604Slingfin 124 1,544 1,698 0 392 1,349 2,419 10,537My Trail Company, Pbc 95 1,099 856 8 796 928 1,281 7,614Red Bay Coffee Company 63 1,047 1,352 0 8 342 2,383 6,935Hawaiian Ola Brewing Corporation 63 3,217 1,750 0 2,389 3,310 4,778 6,821Rodeo Donut 56 593 1,212 0 0 11 752 7,395Everyfit 51 1,467 1,153 3 437 1,214 2,464 5,530Community Ventures 43 1,074 1,291 6 28 336 2,256 5,934Sam Lee Laundry 42 379 789 0 0 4 122 2,567Exemplars 39 2,331 1,810 17 1,573 2,407 2,579 8,425Monday Night Mile — Dba Beerfit 33 824 853 0 417 720 817 4,203Proof Of Concept 29 1,093 924 6 215 941 1,979 2,570Nextdoorganics 28 867 1,258 0 0 197 1,107 4,067Do. Inc 28 1,465 1,900 11 547 830 1,973 10,157Urban Juncture 22 901 717 0 570 594 1,819 1,855Kibin 20 1,871 1,764 10 580 1,692 2,407 6,932Mobodexter 13 1,526 903 103 739 1,626 2,246 2,563Subsector Solutions Corporation 13 1,887 2,044 486 818 1,398 1,837 8,445Still Company 6 2,047 2,911 426 657 929 1,349 7,941Spotlight:Girls 5 262 550 0 5 24 36 1,245
30

Table 12: Linear regressions of the amount invested (Column 1), the amount invested scaled bythe original minimum offering amount (Column 2), and the number of investors (Column 3) onfixed effects for the type of security and original minimum offering amount fit on the universe of 50Regulation Crowdfunding issues closed by November 12th, 2016. Investor observations are missingfor issues conducted on North Capital, Venture, and Netcapital.
(1) (2) (3)Amount Invested % of Min Offering Invested Investors
Equity Dummy -20.36 -33.77 65.97(79.576) (127.162) (153.644)
Debt Dummy 67.85 46.31 -121.2(78.116) (142.213) (108.961)
Min Offering Amount 0.425 2.254(0.459) (1.587)
Constant 85.57 194.6∗∗ -42.85(57.490) (61.819) (153.379)
Observations 50 50 45Adjusted R2 -0.002 -0.036 0.212
Standard errors in parentheses∗ p < 0.05, ∗∗ p < 0.01, ∗∗∗ p < 0.001
31

Table 13: Linear regressions of the amount invested (Column 1), the amount invested scaled bythe original minimum offering amount (Column 2), and the number of investors (Column 3) onthe issuer’s assets, cash, short term debt, long term debt, revenue, and debt to asset ratio in themost recent fiscal year along with the original minimum offering amount fit on the universe of 50Regulation Crowdfunding issues closed by November 12th, 2016
(1) (2) (3)Amount Invested % of Min Offering Invested Investors
Assets 0.171∗∗∗ 0.318∗∗∗ 0.275∗∗
(0.030) (0.058) (0.089)
Cash 0.766∗∗ 1.410∗∗ 0.866(0.233) (0.403) (0.448)
Short Term Debt -0.138 -0.0651 -1.088(0.186) (0.262) (1.045)
Long Term Debt -0.180∗∗∗ -0.292∗∗∗ -0.355∗
(0.043) (0.081) (0.143)
Revenue -0.0378 -0.137 0.0101(0.048) (0.068) (0.095)
Debt to Assets -1.480 -1.847 -1.272(0.842) (1.205) (1.028)
Min Offering Amount 0.789 3.127(0.484) (1.975)
Constant 20.68 127.0 -168.1(69.381) (65.532) (161.440)
Observations 50 50 45Adjusted R2 0.265 0.354 0.314
Standard errors in parentheses∗ p < 0.05, ∗∗ p < 0.01, ∗∗∗ p < 0.001
32

Table 14: Linear regressions of the amount invested (Column 1), the amount invested scaled bythe original minimum offering amount (Column 2), and the number of investors (Column 3) onthe amount of information the issuer filed with the SEC in megabytes, the Stratifund rating of theissuer, a dummy for no Stratifund rating, and the original minimum offering amount fit on theuniverse of 50 Regulation Crowdfunding issues closed by November 12th, 2016
(1) (2) (3)Amount Invested % of Min Offering Invested Investors
Filing Size (MBs) 3.301∗∗ 5.775∗∗ 2.926(1.136) (1.698) (2.697)
Stratifund Rating 49.21∗ 52.55 87.07(18.691) (28.614) (48.190)
No Rating Dummy 78.65 37.39 148.7(52.129) (69.321) (149.809)
Min Offering Amount 0.623 2.487(0.413) (1.707)
Constant -112.9 -40.04 -363.2(70.505) (51.063) (261.068)
Observations 50 50 45Adjusted R2 0.168 0.147 0.243
Standard errors in parentheses∗ p < 0.05, ∗∗ p < 0.01, ∗∗∗ p < 0.001
33

Table 15: Linear regressions of the amount invested (Column 1), the amount invested scaled bythe original minimum offering amount (Column 2), and the number of investors (Column 3) onsecurity type fixed effects; issuer assets and long term debt in the most fiscal recent year; the amountof information filed with the SEC in megabytes; the Stratifund rating of the issuer, a dummy for noStratifund rating, and the original minimum offering amount fit on the universe of 50 RegulationCrowdfunding issues closed by November 12th, 2016
(1) (2) (3)Amount Invested % of Min Offering Invested Investors
Equity Dummy 31.34 59.45 309.2(58.166) (67.238) (252.271)
Debt Dummy 105.9 114.6 -153.1(94.190) (178.113) (148.397)
Assets 0.125∗∗ 0.247∗∗ 0.152∗∗∗
(0.042) (0.086) (0.032)
Long Term Debt -0.154∗∗ -0.245∗ -0.205∗∗
(0.056) (0.104) (0.058)
Filing Size (MBs) 3.001∗∗∗ 4.460∗∗∗ 1.622(0.683) (1.071) (1.633)
Stratifund Rating 33.97 37.07 197.1(29.326) (41.230) (111.086)
No Rating Dummy 2.461 -39.31 532.7(104.393) (166.890) (378.267)
Min Offering Amount 0.805 2.771(0.400) (1.563)
Constant -133.5 -44.32 -702.6(104.146) (106.824) (466.997)
Observations 50 50 45Adjusted R2 0.351 0.364 0.361
Standard errors in parentheses∗ p < 0.05, ∗∗ p < 0.01, ∗∗∗ p < 0.001
34

Table 16: Linear regressions of the amount invested by day 7 (Column 1), the amount investedby day 7 scaled by the original minimum offering amount (Column 2), and the number of investorsby day 7 (Column 3) on security type fixed effects; issuer assets and long term debt in the mostfiscal recent year; the amount of information filed with the SEC in megabytes; the Stratifund ratingof the issuer, a dummy for no Stratifund rating, and the original minimum offering amount fit onthe universe of 71 Regulation Crowdfunding issues to which I can associate the status of the issueon the 7th day after the issuer filed its Form C with the SEC
(1) (2) (3)
Amount InvestedFirst Week
% of Min Offering InvestedFirst Week
InvestorsFirst Week
Equity Dummy -9.031 -16.39 -22.79∗
(7.580) (10.359) (10.648)
Debt Dummy 33.55 48.63 6.879(20.172) (34.470) (16.335)
Assets 0.0147 0.0161 0.0239(0.014) (0.021) (0.022)
Long Term Debt 0.00869 -0.00672 -0.000992(0.013) (0.012) (0.011)
Filing Size (MBs) 0.726 1.831∗ 0.936∗
(0.370) (0.691) (0.408)
Stratifund Rating -2.242 -3.788 -0.387(6.500) (9.607) (7.566)
No Rating Dummy -3.307 3.468 3.823(18.353) (24.665) (20.429)
Min Offering Amount 0.0556 -0.0402(0.077) (0.074)
Constant 5.992 7.250 17.20(17.081) (22.767) (19.888)
Observations 71 71 68Adjusted R2 0.148 0.133 0.189
Standard errors in parentheses∗ p < 0.05, ∗∗ p < 0.01, ∗∗∗ p < 0.001
35

Table 17: Linear regressions of the amount invested by day 30 (Column 1), the amount investedby day 30 scaled by the original minimum offering amount (Column 2), and the number of investorsby day 30 (Column 3) on security type fixed effects; issuer assets and long term debt in the mostfiscal recent year; the amount of information filed with the SEC in megabytes; the Stratifund ratingof the issuer, a dummy for no Stratifund rating, and the original minimum offering amount fit onthe universe of 93 Regulation Crowdfunding issues to which I can associate the status of the issueon the 30th day after the issuer filed its Form C with the SEC
(1) (2) (3)
Amount InvestedFirst Month
% of Min Offering InvestedFirst Month
InvestorsFirst Month
Equity Dummy 13.09 16.09 -16.05(17.020) (23.882) (26.497)
Debt Dummy 60.53 81.73 -0.696(34.273) (65.751) (26.386)
Assets 0.0237∗ 0.0455∗ 0.0399∗∗
(0.009) (0.018) (0.013)
Long Term Debt -0.0486∗∗∗ -0.0754∗ -0.0705∗∗∗
(0.013) (0.029) (0.017)
Filing Size (MBs) 1.555∗∗ 2.590∗∗∗ 1.365(0.520) (0.720) (1.010)
Stratifund Rating 14.26∗ 20.54 12.67(6.919) (11.713) (10.391)
No Rating Dummy 27.65 42.84 44.20(32.516) (47.832) (52.600)
Min Offering Amount 0.140 0.288(0.083) (0.202)
Constant -43.02 -46.24 -27.31(24.608) (40.734) (45.135)
Observations 93 93 88Adjusted R2 0.174 0.156 0.076
Standard errors in parentheses∗ p < 0.05, ∗∗ p < 0.01, ∗∗∗ p < 0.001
36
B Figures
Figure 1: US securities crowdfunding market growth since May 16th, 2016
Figure 2: Histogram of Stratifund ratings of issuers through November 12, 2016 is below
37

Figure 3: Number of investors and amount invested in Mobodexter over the course of its ongoingRegulation Crowdfunding issue
Figure 4: Number of investors and amount invested in Sondors Electric Car over the course ofits ongoing Regulation Crowdfunding issue
38

Figure 5: Number of investors and amount invested in Hops and Grain over the course of itsclosed Regulation Crowdfunding issue
Figure 6: Number of investors and amount invested in Green Sense Farms over the course of itsongoing Regulation Crowdfunding issue
39

Figure 7: Physical addresses of all companies pursuing a Regulation Crowdfunding issue throughNovember 12, 2016
Figure 8: Self-reported locations of investors who have invested in Regulation Crowdfunding issueson Wefunder through November 12, 2016
40

Figure 9: Investors in Rodeo Donuts self-report as being located near the store’s physical locationin Seattle
Figure 10: Investors in Cleveland Whiskey self-report as being located across the United States
41
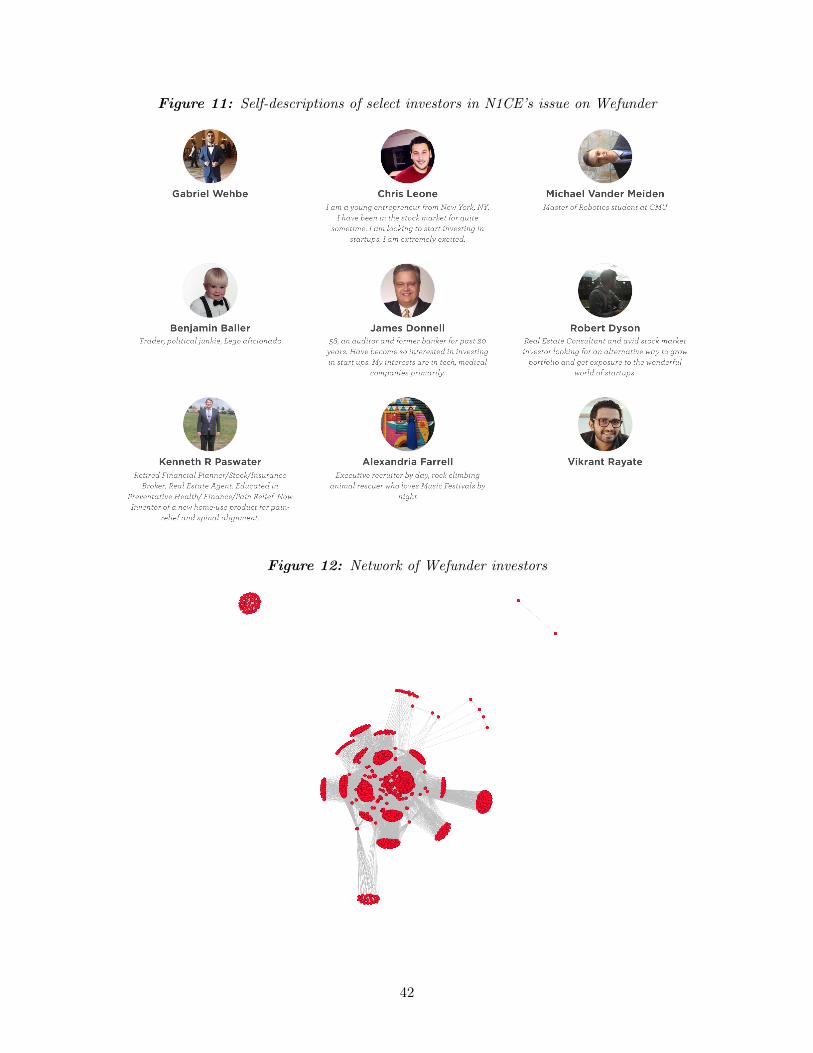
Figure 11: Self-descriptions of select investors in N1CE’s issue on Wefunder
Figure 12: Network of Wefunder investors
42

C Online Appendix
Figure 13: Wefunder is the largest securities crowdfunding portal by the number of issues con-ducted, number of investors, and amount invested. Wefunder’s landing page displays a banner thatcycles through different reasons investors should invest in securities crowdfunding issues, links toall the current issues on the site, and links to successful past issues (not visible in the screenshotbelow)
43
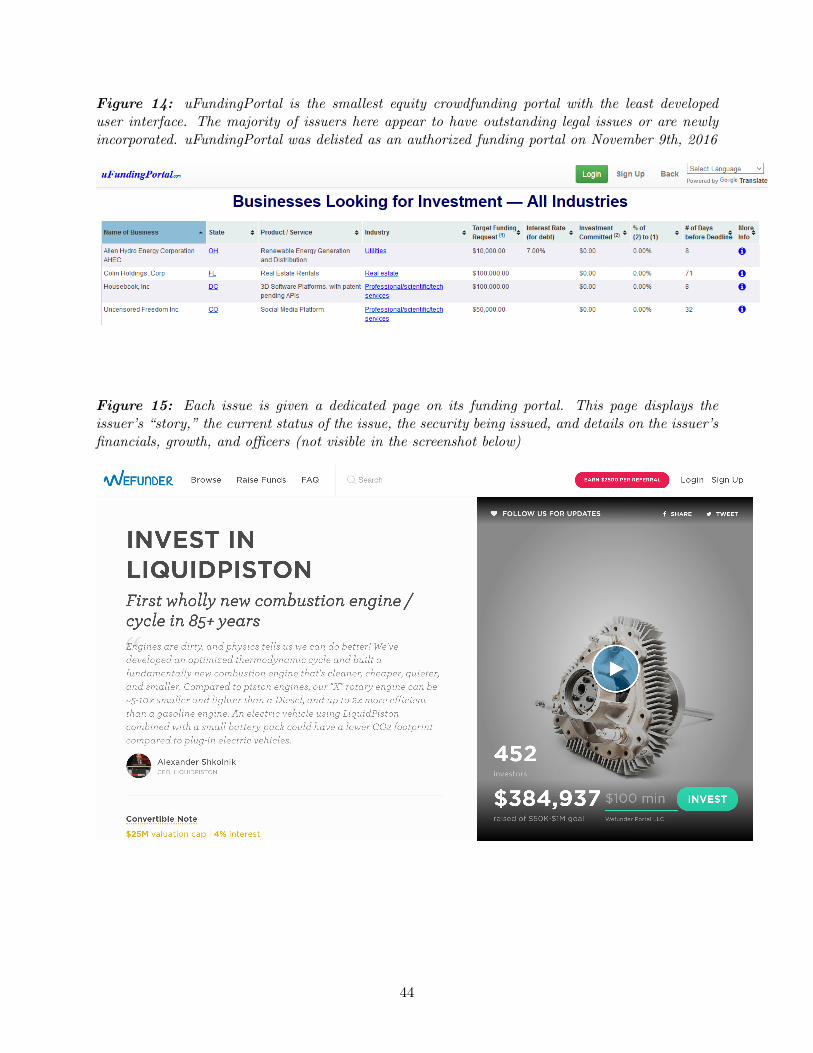
Figure 14: uFundingPortal is the smallest equity crowdfunding portal with the least developeduser interface. The majority of issuers here appear to have outstanding legal issues or are newlyincorporated. uFundingPortal was delisted as an authorized funding portal on November 9th, 2016
Figure 15: Each issue is given a dedicated page on its funding portal. This page displays theissuer’s “story,” the current status of the issue, the security being issued, and details on the issuer’sfinancials, growth, and officers (not visible in the screenshot below)
44

Figure 16: Number of investors in each Regulation Crowdfunding issue over time
Figure 17: Amount invested in each Regulation Crowdfunding issue over time
45


![Crowdfunding and the Federal Securities Laws[1]](https://img.pdfslide.us/doc/110x75/544ec950af7959e91e8b4d26/crowdfunding-and-the-federal-securities-laws1.jpg)