Embed Size (px)
Citation preview

SECURITIES AND EXCHANGE COMMISSION
SEC FORM 17-Q
QUARTERLY REPORT PURSUANT TO SECTION 17 OF THE SECURITIES REGULATION CODE AND SRC RULE 17(2)(b) THEREUNDER
1. For the quarterly period ended 30 June 2014
2. Commission Identification Number: 167423 3. BIR Tax Identification No.: 000-477-103
4. MEGAWORLD CORPORATION Exact name of issuer as specified in its charter
5. Metro Manila Province, Country or other jurisdiction of incorporation or organization
6. (SEC Use Only) Industry Classification Code
7. 28th Floor, The World Centre 330 Sen. Gil J. Puyat Avenue Makati City, Philippines 1227 Address of issuer’s principal office
8. (632) 867-8826 to 40 Issuer’s telephone number, including area code
9. Securities registered pursuant to Sections 8 and 12 of the Code, or Sections 4 and 8 of the RSA
Title of Each Class Number of Shares of Stock Outstanding
Common 32,141,138,454 Preferred 6,000,000,000
Total 38,141,138,454
10. Are any or all of the securities listed on a Stock Exchange?
Yes [X] No [ ]
If yes, state the name of such Stock Exchange and the class/es of securities listed therein:
The shares of common stock of the Company are listed on the Philippine Stock Exchange.
11. Indicate by check mark whether the registrant:
(a) has filed all reports required to be filed by Section 17 of the Code and SRC Rule 17
thereunder or Section 11 of the RSA and RSA Rule 11(a)-1 thereunder, and Sections 26
and 141 of The Corporation Code of the Philippines, during the preceding twelve (12)
months (or for such shorter period the registrant was required to file such reports).
Yes [X] No [ ]


MEGAWORLD CORPORATION AND SUBSIDIARIES
CONSOLIDATED STATEMENTS OF FINANCIAL POSITION
(In thousand pesos)
Unaudited Audited
June 30, 2014 December 31, 2013
CURRENT ASSETS
Cash and cash equivalents 28,581,341 P 31,751,906 P
Trade and other receivables - net 22,959,681 19,557,352
Financial assets at fair value through profit or loss 291,000 258,000
Residential and condominium units for sale 48,395,331 35,109,686
Property development costs 10,284,625 9,707,715
Prepayments and other current assets - net 3,325,454 2,073,711
Total Current Assets 113,837,432 98,458,370
NON-CURRENT ASSETS
Trade and other receivables - net 27,313,778 23,439,511
Advances to landowners and joint ventures 4,775,001 3,737,052
Land for future development 12,976,428 5,049,385
Investments in available-for-sale securities 6,674,411 3,928,755
Investments in and advances to associates and other
related parties - net 5,057,164 12,774,500
Investment property - net 33,288,701 24,946,939
Property and equipment - net 1,660,710 701,674
Deferred tax assets - net 48,639 43,615
Other non-current assets 1,896,914 802,304
Total Non-current Assets 93,691,746 75,423,735
TOTAL ASSETS 207,529,178 P 173,882,105 P
A S S E T S
EXHIBIT 1

Unaudited Audited
June 30, 2014 December 31, 2013
CURRENT LIABILITIES
Interest-bearing loans and borrowings 1,735,863 P 1,564,723 P
Bonds payable 5,000,000 -
Trade and other payables 9,727,727 7,198,373
Customers' deposits 6,086,163 4,112,697
Reserve for property development 6,850,392 6,879,582
Deferred income on real estate sales 4,892,270 4,118,887
Income tax payable 10,792 66,466
Other current liabilities 2,151,701 1,955,789
Total Current Liabilities 36,454,908 25,896,517
NON-CURRENT LIABILITIES
Interest-bearing loans and borrowings 1,476,763 2,235,182
Bonds payable 19,413,103 24,826,702
Customers' deposits 1,994,086 1,002,305
Redeemable preferred shares 1,257,988 -
Reserve for property development 6,799,968 5,385,667
Deferred income on real estate sales 4,326,522 3,349,019
Deferred tax liabilities - net 7,575,151 6,733,095
Advances from associates and other related parties 741,481 120,488
Retirement benefit obligation 827,730 748,399
Other non-current liabilities 1,862,499 1,631,710
Total Non-current Liabilities 46,275,291 46,032,567
Total Liabilities 82,730,199 71,929,084
EQUITY
Total equity attributable to the company's shareholders 107,486,858 91,927,391
Non-controlling interests 17,312,121 10,025,630
Total Equity 124,798,979 101,953,021
TOTAL LIABILITIES AND EQUITY 207,529,178 P 173,882,105 P
-2-
LIABILITIES AND EQUITY

MEGAWORLD CORPORATION AND SUBSIDIARIES
CONSOLIDATED STATEMENTS OF INCOME
(In thousand pesos, except earnings per share)
2014 Unaudited 2014 Unaudited 2013 Unaudited 2013 Unaudited
Apr 1 - Jun 30 Jan 1 - Jun 30 Apr 1 - Jun 30 Jan 1 - Jun 30
(As Restated) (As Restated)
REVENUES AND INCOME
Real estate sales 6,556,797 P 12,010,448 P 5,742,101 P 10,533,135 P
Interest income on real estate sales 397,288 786,040 371,500 726,700
Realized gross profit on prior years' sales 883,935 1,820,136 776,171 1,608,186
Rental income 1,731,638 3,444,284 1,434,467 2,828,913
Hotel operations 253,474 368,419 112,407 224,789
Equity share in net earnings of associates 131,870 304,394 122,682 230,261
Interest and other income - net 12,056,057 13,223,762 570,573 1,128,847
22,011,059 31,957,483 9,129,901 17,280,831
COSTS AND EXPENSES
Real estate sales 3,855,855 7,142,998 3,421,777 6,366,280
Deferred gross profit 1,407,284 2,612,132 1,115,642 2,396,161
Hotel operations 117,409 177,132 63,113 119,597
Operating expenses 1,781,026 3,213,134 1,026,161 2,293,372
Interest and other charges - net 85,068 710,159 376,289 596,030
Tax expense 937,228 1,577,251 710,154 1,280,278
8,183,870 15,432,806 6,713,136 13,051,718
PROFIT FOR THE PERIOD
BEFORE PREACQUISITION INCOME 13,827,189 16,524,677 2,416,765 4,229,113
PREACQUISITION INCOME OF SUBSIDIARIES 78,159 )( 83,362 )( - -
NET PROFIT FOR THE PERIOD 13,749,030 P 16,441,315 P 2,416,765 P 4,229,113 P
Net profit attributable to:
Company's shareholders 13,678,417 P 16,326,574 P 2,406,986 P 4,187,698 P
Non-controlling interests 70,613 114,741 9,779 41,415
13,749,030 P 16,441,315 P 2,416,765 P 4,229,113 P
Earnings Per Share
Basic 0.433 P 0.517 P 0.083 P 0.145 P
Diluted 0.430 P 0.513 P 0.083 P 0.144 P
EXHIBIT 2

MEGAWORLD CORPORATION AND SUBSIDIARIES
CONSOLIDATED STATEMENTS OF COMPREHENSIVE INCOME
(In thousand pesos)
2014 Unaudited 2014 Unaudited 2013 Unaudited 2013 Unaudited
Apr 1 - Jun 30 Jan 1 - Jun 30 Apr 1 - Jun 30 Jan 1 - Jun 30
(As Restated) (As Restated)
NET PROFIT FOR THE PERIOD 13,749,030 P 16,441,315 P 2,416,765 P 4,229,113 P
OTHER COMPREHENSIVE INCOME (LOSS)
Items that will not be reclassified
subsequently to profit or loss -
Actuarial gains(losses) on retirement benefit obligations 4,630 )( 4,630 )( 4,725 9,449
Items that will be reclassified
subsequently to profit or loss:
Net unrealized fair value gains (losses) on
available-for-sale securities 22,081 )( 423,497 329,978 931,758
Exchange difference on translating foreign operations 53,053 )( 113,477 )( 15,936 (10,774)
75,134 )( 310,020 345,914 920,984
79,764 )( 305,390 350,639 930,433
TOTAL COMPREHENSIVE INCOME
FOR THE PERIOD 13,669,266 P 16,746,705 P 2,767,404 P 5,159,546 P
Total comprehensive income attributable to:
Company’s shareholders 13,598,653 16,631,964 2,757,625 5,118,131
Non-controlling interests 70,613 114,741 9,779 41,415
13,669,266 P 16,746,705 P 2,767,404 P 5,159,546 P

MEGAWORLD CORPORATION AND SUBSIDIARIES
STATEMENTS OF CHANGES IN EQUITY
(In thousand pesos)
Unaudited Unaudited
June 30, 2014 June 30, 2013
(As Restated)
CAPITAL STOCK 32,326,715 P 29,595,080 P
ADDITIONAL PAID-IN CAPITAL 16,647,265 8,432,990
TREASURY STOCK 633,722 )( 633,722 )(
NET ACTUARIAL GAINS (LOSSES) ON
RETIREMENT BENEFIT PLAN 131,978 )( 152,913 )(
NET UNREALIZED GAINS ON
AVAILABLE-FOR-SALE SECURITIES 2,226,729 1,645,138
SHARE IN OTHER COMPREHENSIVE
INCOME OF ASSOCIATES - 1,445
ACCUMULATED TRANSLATION ADJUSTMENT 504,332 )( 437,263 )(
RETAINED EARNINGS 57,556,181 38,709,269
NON-CONTROLLING INTERESTS 17,312,121 9,992,069
TOTAL EQUITY 124,798,979 P 87,152,093 P
EXHIBIT 3

MEGAWORLD CORPORATION AND SUBSIDIARIESCONSOLIDATED STATEMENTS OF CASH FLOW(In thousand pesos)
Unaudited UnauditedJune 30, 2014 June 30, 2013
(As Restated)
CASH FLOWS FROM OPERATING ACTIVITIES
Income before tax 18,018,566 P 5,509,391 P
Adjustments for:
Depreciation and amortization 571,978 442,579
Interest expense 642,985 508,065
Interest and other income 12,550,414 )( 838,848 )(
Share option benefits expense 26,586 35,114
Equity in net earnings of associates 304,394 )( 230,261 )(
Operating income before working capital changes 6,405,307 5,426,040
Net Changes in Operating Assets and Liabilities
Increase in current and non-current assets 6,251,523 )( 5,542,915 )(
Increase in current and other current liabilities 1,739,531 883,398
Increase in reserve for property development 577,245 1,004,873
Cash generated from operations 2,470,560 1,771,396
Cash paid for income taxes 978,361 )( 648,742 )(
NET CASH FROM OPERATING ACTIVITIES 1,492,199 1,122,654
CASH FLOWS USED IN INVESTING ACTIVITIES 7,560,967 )( 3,428,712 )(
CASH FLOWS FROM (USED IN) FINANCING ACTIVITIES 1,273,080 )( 12,187,180
NET INCREASE (DECREASE) IN CASH AND CASH EQUIVALENTS 7,341,848 )( 9,881,122
BEGINNING BALANCE OF CASH AND CASH EQUIVALENTS OF ACQUIRED SUBSIDIARIES 4,514,093 -
PREACQUISITION CHANGES IN CASH AND CASH EQUIVALENTS OF ACQUIRED SUBSIDIARIES 342,810 )( -
CASH AND CASH EQUIVALENTS
AT BEGINNING OF PERIOD 31,751,906 26,826,715
CASH AND CASH EQUIVALENTS
AT END OF THE PERIOD 28,581,341 P 36,707,837 P
EXHIBIT 4
MEGAWORLD CORPORATION AND SUBSIDIARIES NOTES TO INTERIM FINANCIAL INFORMATION
FOR THE SIX MONTHS ENDED JUNE 30, 2014 AND 2013 (UNAUDITED)
(Amounts in Philippine Pesos)
1. CORPORATE INFORMATION Megaworld Corporation (the Company) was incorporated in the Philippines on
August 24, 1989, primarily to engage in the development of large scale mixed-use planned communities or townships that integrate residential, commercial, leisure and entertainment components. The Company is presently engaged in property-related activities, such as, project design, construction and property management. The Company’s real estate portfolio includes residential condominium units, subdivision lots and townhouses, as well as office projects and retail spaces.
All of the Company’s common shares of stock are listed at the Philippine Stock
Exchange (PSE).
The registered office of the Company, which is also its principal place of business, is located at the 28th Floor, The World Centre Building, Sen. Gil Puyat Avenue, Makati City.
Alliance Global Group, Inc. (AGI or parent company), also a publicly listed company in the Philippines, is the ultimate parent company of Megaworld Corporation and its subsidiaries (the Group). AGI is a holding company and is presently engaged in the food and beverage business, real estate, quick service restaurant and tourism-oriented businesses. AGI’s registered office, which is also its primary place of business, is located at the 7th Floor, 1880 Eastwood Avenue, Eastwood City CyberPark, 188 E. Rodriguez Jr. Avenue, Quezon City.
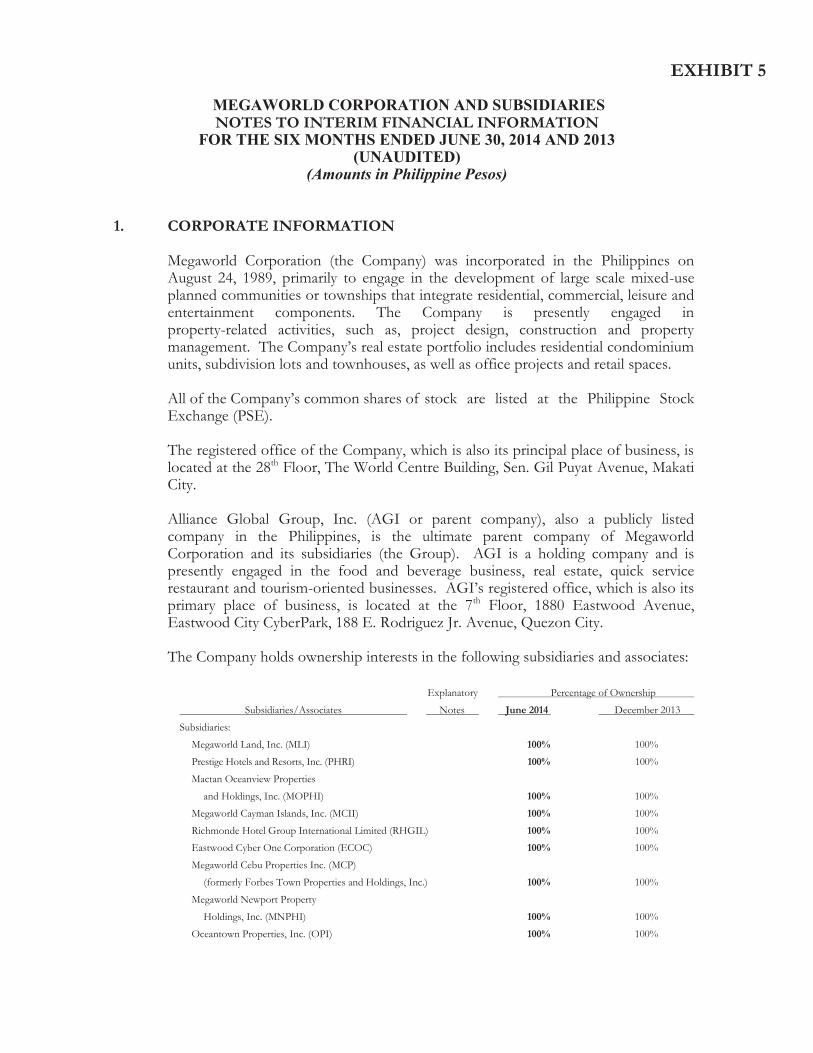
The Company holds ownership interests in the following subsidiaries and associates: Explanatory Percentage of Ownership
Subsidiaries/Associates Notes June 2014 December 2013
Subsidiaries:
Megaworld Land, Inc. (MLI) 100% 100%
Prestige Hotels and Resorts, Inc. (PHRI) 100% 100%
Mactan Oceanview Properties
and Holdings, Inc. (MOPHI) 100% 100%
Megaworld Cayman Islands, Inc. (MCII) 100% 100%
Richmonde Hotel Group International Limited (RHGIL) 100% 100%
Eastwood Cyber One Corporation (ECOC) 100% 100%
Megaworld Cebu Properties Inc. (MCP)
(formerly Forbes Town Properties and Holdings, Inc.) 100% 100%
Megaworld Newport Property
Holdings, Inc. (MNPHI) 100% 100%
Oceantown Properties, Inc. (OPI) 100% 100%
EXHIBIT 5

Explanatory Percentage of Ownership
Subsidiaries/Associates_________ Notes June 2014 December 2013_
Subsidiaries:
Piedmont Property Ventures, Inc. (PPVI) 100% 100%
Stonehaven Land, Inc. (SLI) 100% 100%
Streamwood Property, Inc. (SP) 100% 100%
Suntrust Properties, Inc. (SPI) 100% 100%
Lucky Chinatown Cinemas, Inc. (LCCI) 100% 100%
Luxury Global Hotels and Leisure, Inc. (LGHLI) 100% 100%
Suntrust Ecotown Developers, Inc. (SEDI) 100% 100%
Woodside Greentown Properties Inc. (WGPI)
(formerly Union Ajinomoto Realty Corporation) 100% 100%
Citywalk Building Administration, Inc. (CBAI) (a) 100% -
Forbestown Commercial Center
Administration, Inc. (FCCAI) (a) 100% -
Paseo Center Building Administration, Inc. (PCBAI) (a) 100% -
Megaworld Global-Estates, Inc. (MGEI) (b) 88.25% -
Empire East Land Holdings, Inc. and Subsidiaries (EELHI) 81.72% 81.53%
Global-Estate Resorts, Inc. and Subsidiaries (GERI) (c) 80.41% -
Megaworld Central Properties, Inc. (MCPI) 76.54% 76.50%
La Fuerza, Inc. (LFI) (d) 66.67% -
Twin Lakes Corporation (TLC) (e) 61.17% -
Megaworld-Daewoo Corporation (MDC) 60% 60%
Eastwood Cinema 2000, Inc. (EC2000) 55% 55%
Gilmore Property Marketing Associates, Inc. (GPMAI) 52.13% 52.04%
Megaworld Resort Estates, Inc. (MREI) 51% 51%
Manila Bayshore Property Holdings, Inc. (MBPHI) (f) 50.92% 54.50%
Megaworld Globus Asia, Inc. (MGAI) 50% 50%
Philippine International Properties, Inc. (PIPI) 50% 50%
Townsquare Development, Inc. (TDI) 30.60% 30.60%
Associates:
Bonifacio West Development Corporation (BWDC) (g) 46.11% -
Suntrust Home Developers, Inc. (SHDI) 42.48% 42.48%
Palm Tree Holdings and Development
Corporation (PTHDC) 40% 40%
Resorts World Bayshore City, Inc. (RWBCI) 10% 10%
Travellers International Hotel Group, Inc. (TIHGI) (h) - 9%
Megaworld Global Estates, Inc. (MGEI) (b) - 54.82%
La Fuerza, Inc. (LFI) (d) - 50%
Twin Lakes Corporation (TLC) (e) - 31.35%
Global Estate Resorts, Inc. (GERI) (c) - 24.70%
Explanatory Notes:
(a) CBAI, FCCAI and PCBAI were incorporated to engage in operation, maintenance, and administration of
Citywalk and Cyber Mall, Forbestown Center and Paseo Center, respectively. These companies became
subsidiaries of the Company through MLI, its parent company.
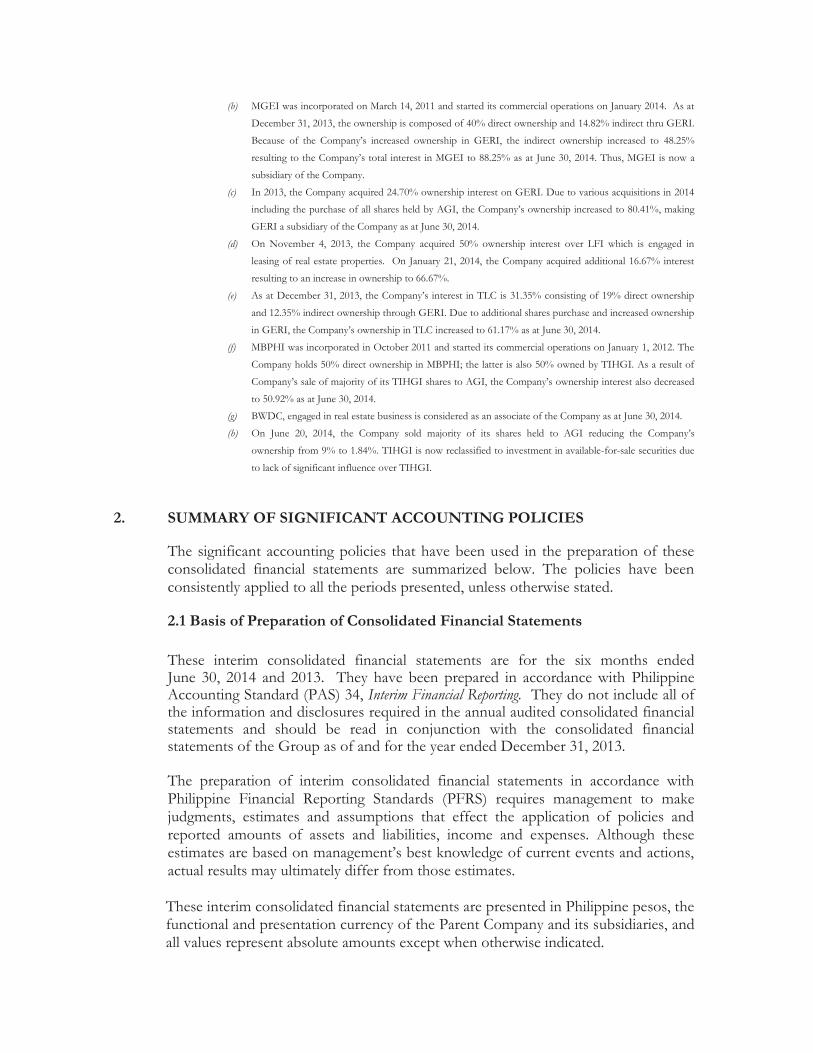
(b) MGEI was incorporated on March 14, 2011 and started its commercial operations on January 2014. As at
December 31, 2013, the ownership is composed of 40% direct ownership and 14.82% indirect thru GERI.
Because of the Company’s increased ownership in GERI, the indirect ownership increased to 48.25%
resulting to the Company’s total interest in MGEI to 88.25% as at June 30, 2014. Thus, MGEI is now a
subsidiary of the Company.
(c) In 2013, the Company acquired 24.70% ownership interest on GERI. Due to various acquisitions in 2014
including the purchase of all shares held by AGI, the Company’s ownership increased to 80.41%, making
GERI a subsidiary of the Company as at June 30, 2014.
(d) On November 4, 2013, the Company acquired 50% ownership interest over LFI which is engaged in
leasing of real estate properties. On January 21, 2014, the Company acquired additional 16.67% interest
resulting to an increase in ownership to 66.67%.
(e) As at December 31, 2013, the Company’s interest in TLC is 31.35% consisting of 19% direct ownership
and 12.35% indirect ownership through GERI. Due to additional shares purchase and increased ownership
in GERI, the Company’s ownership in TLC increased to 61.17% as at June 30, 2014.
(f) MBPHI was incorporated in October 2011 and started its commercial operations on January 1, 2012. The
Company holds 50% direct ownership in MBPHI; the latter is also 50% owned by TIHGI. As a result of
Company’s sale of majority of its TIHGI shares to AGI, the Company’s ownership interest also decreased
to 50.92% as at June 30, 2014. (g) BWDC, engaged in real estate business is considered as an associate of the Company as at June 30, 2014.
(h) On June 20, 2014, the Company sold majority of its shares held to AGI reducing the Company’s
ownership from 9% to 1.84%. TIHGI is now reclassified to investment in available-for-sale securities due
to lack of significant influence over TIHGI.
2. SUMMARY OF SIGNIFICANT ACCOUNTING POLICIES
The significant accounting policies that have been used in the preparation of these consolidated financial statements are summarized below. The policies have been consistently applied to all the periods presented, unless otherwise stated.
2.1 Basis of Preparation of Consolidated Financial Statements
These interim consolidated financial statements are for the six months ended
June 30, 2014 and 2013. They have been prepared in accordance with Philippine Accounting Standard (PAS) 34, Interim Financial Reporting. They do not include all of the information and disclosures required in the annual audited consolidated financial statements and should be read in conjunction with the consolidated financial statements of the Group as of and for the year ended December 31, 2013.
The preparation of interim consolidated financial statements in accordance with Philippine Financial Reporting Standards (PFRS) requires management to make judgments, estimates and assumptions that effect the application of policies and reported amounts of assets and liabilities, income and expenses. Although these estimates are based on management’s best knowledge of current events and actions, actual results may ultimately differ from those estimates. These interim consolidated financial statements are presented in Philippine pesos, the functional and presentation currency of the Parent Company and its subsidiaries, and all values represent absolute amounts except when otherwise indicated.

2.2 Adoption of New and Amended PFRS
These interim consolidated financial statements have been prepared in accordance with the accounting policies adopted in the last annual financial statements for the year ended December 31, 2013:
Effective in 2014 that are relevant to the Group i. PAS 19 (Amendment), Employee Benefits – Defined Benefit Plans – Employee
Contributions (effective from January 1, 2014). The amendment clarifies that if the amount of the contributions from employees or third parties is dependent on the number of years of service, an entity shall attribute the contributions to periods of service using the same attribution method (i.e., either using the plan’s contribution formula or on a straight-line basis) for the gross benefit. The amendment has no impact on the Group’s consolidated financial statements.
ii. PAS 32 (Amendment), Financial Instruments: Presentation – Offsetting Financial
Assets and Financial Liabilities (effective from January 1, 2014). The amendment provides guidance to address inconsistencies in applying the criteria for offsetting financial assets and financial liabilities. It clarifies that a right of set-off is required to be legally enforceable, in the normal course of business, in the event of default and in the event of insolvency or bankruptcy of the entity and all of the counterparties. The amendment also clarifies the principle behind net settlement and includes an example of a gross settlement system with characteristics that would satisfy the criterion for net settlement. The amendment affects presentation only and has no impact on the Group’s financial performance and financial position.
iii. PAS 36 (Amendment), Impairment of Assets – Recoverable Amount Disclosures for
Non-financial Assets (effective from January 1, 2014). The amendment clarifies that the requirements for the disclosure of information about the recoverable amount of assets or cash-generating units is limited only to the recoverable amount of impaired assets that is based on fair value less cost of disposal. It also introduces an explicit requirement to disclose the discount rate used in determining impairment (or reversals) where recoverable amount based on fair value less cost of disposal is determined using a present value technique. The amendment pertains to disclosure requirements only and has no impact on the Group’s financial performance and financial position.
iv. PAS 39 (Amendment), Financial Instruments: Recognition and Measurement –
Novation of Derivatives and Continuation of Hedge Accounting (effective from January 1, 2014). The amendment provides some relief from the requirements on hedge accounting by allowing entities to continue the use of hedge accounting when a derivative is novated to a clearing counterparty resulting in termination or expiration of the original hedging instrument as a consequence of laws and regulations, or the introduction thereof. As the Group neither enters into
transactions involving derivative instruments nor it applies hedge accounting, the amendment has no impact on the consolidated financial statements.
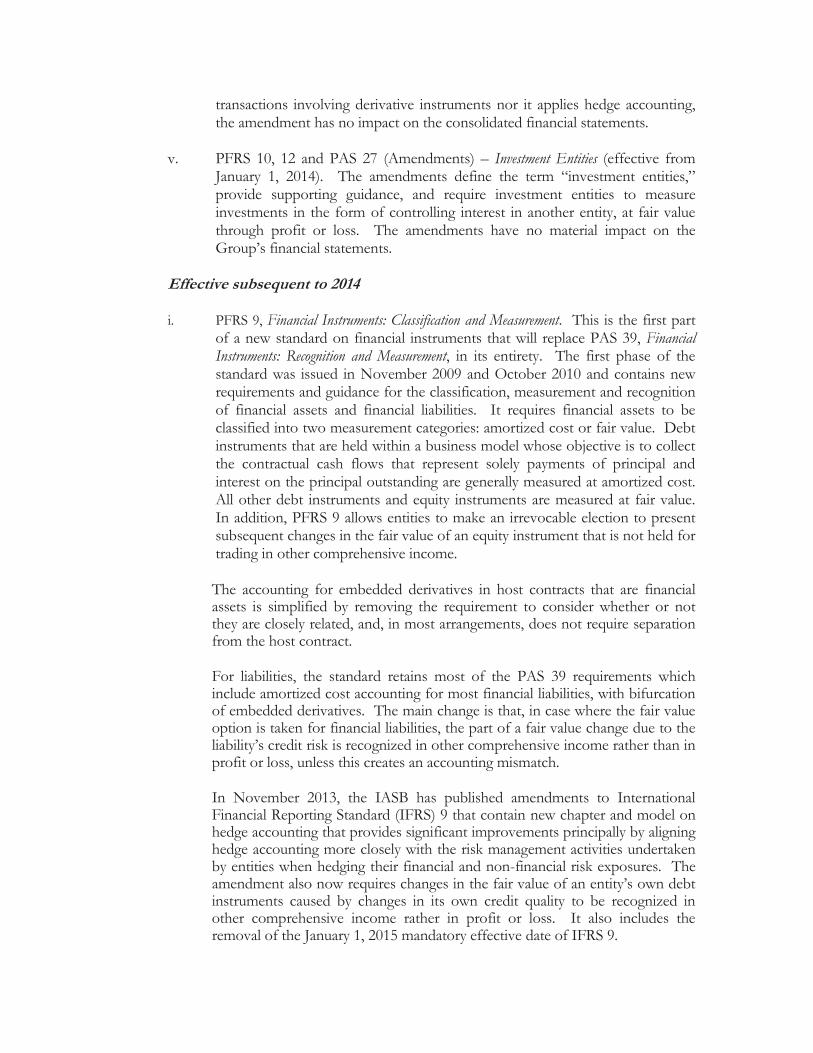
v. PFRS 10, 12 and PAS 27 (Amendments) – Investment Entities (effective from
January 1, 2014). The amendments define the term “investment entities,” provide supporting guidance, and require investment entities to measure investments in the form of controlling interest in another entity, at fair value through profit or loss. The amendments have no material impact on the Group’s financial statements.
Effective subsequent to 2014
i. PFRS 9, Financial Instruments: Classification and Measurement. This is the first part
of a new standard on financial instruments that will replace PAS 39, Financial Instruments: Recognition and Measurement, in its entirety. The first phase of the standard was issued in November 2009 and October 2010 and contains new requirements and guidance for the classification, measurement and recognition of financial assets and financial liabilities. It requires financial assets to be classified into two measurement categories: amortized cost or fair value. Debt instruments that are held within a business model whose objective is to collect the contractual cash flows that represent solely payments of principal and interest on the principal outstanding are generally measured at amortized cost. All other debt instruments and equity instruments are measured at fair value. In addition, PFRS 9 allows entities to make an irrevocable election to present subsequent changes in the fair value of an equity instrument that is not held for trading in other comprehensive income.
The accounting for embedded derivatives in host contracts that are financial
assets is simplified by removing the requirement to consider whether or not they are closely related, and, in most arrangements, does not require separation from the host contract.
For liabilities, the standard retains most of the PAS 39 requirements which
include amortized cost accounting for most financial liabilities, with bifurcation of embedded derivatives. The main change is that, in case where the fair value option is taken for financial liabilities, the part of a fair value change due to the liability’s credit risk is recognized in other comprehensive income rather than in profit or loss, unless this creates an accounting mismatch.
In November 2013, the IASB has published amendments to International
Financial Reporting Standard (IFRS) 9 that contain new chapter and model on hedge accounting that provides significant improvements principally by aligning hedge accounting more closely with the risk management activities undertaken by entities when hedging their financial and non-financial risk exposures. The amendment also now requires changes in the fair value of an entity’s own debt instruments caused by changes in its own credit quality to be recognized in other comprehensive income rather in profit or loss. It also includes the removal of the January 1, 2015 mandatory effective date of IFRS 9.

To date, the remaining chapter of IFRS/PFRS 9 dealing with impairment
methodology is still being completed. Further, the IASB is currently discussing some limited modifications to address certain application issues regarding classification of financial assets and to provide other considerations in determining business model.
The Group does not expect to implement and adopt PFRS 9 until its effective date. In addition, management is currently assessing the impact of PFRS 9 on the consolidated financial statements of the Group and it will conduct a comprehensive study of the potential impact of this standard prior to its mandatory adoption date to assess the impact of all changes.
ii. Philippine IFRIC 15, Agreements for Construction of Real Estate. This Philippine interpretation is based on IFRIC interpretation issued by the IASB in July 2008 effective for annual periods beginning on or after January 1, 2009. The adoption of this interpretation in the Philippines, however, was deferred by the FRSC and Philippine Securities and Exchange Commission after giving due considerations on various application issues and the implication on this interpretation of the IASB’s on-going revision of the Revenue Recognition standard. This interpretation provides guidance on how to determine whether an agreement for the construction of real estate is within the scope of PAS 11, Construction Contracts, or PAS 18, Revenue, and accordingly, when revenue from the construction should be recognized. The main expected change in practice is a shift from recognizing revenue using the percentage of completion method (i.e., as a construction progresses, by reference to the stage of completion of the development) to recognizing revenue at completion upon or after delivery. The Group is currently evaluating the impact of this interpretation on its consolidated financial statements in preparation for its adoption when this becomes mandatorily effective in the Philippines.
iii. Annual Improvements to PFRS. Annual Improvements to PFRS (2010-2012 Cycle) and PFRS (2011-2013 Cycle) made minor amendments to a number of PFRS, which are effective for annual period beginning on or after July 1, 2014. Among those improvements, the following amendments are relevant to the Group but management does not expect a material impact on the Group’s consolidated financial statements:
Annual Improvements to PFRS (2010-2012 Cycle)
(a) PAS 16 (Amendment), Property, Plant and Equipment and PAS 38 (Amendment), Intangible Assets. The amendments clarify that when an item of property, plant and equipment, and intangible assets is revalued, the gross carrying amount is adjusted in a manner that is consistent with a revaluation of the carrying amount of the asset.
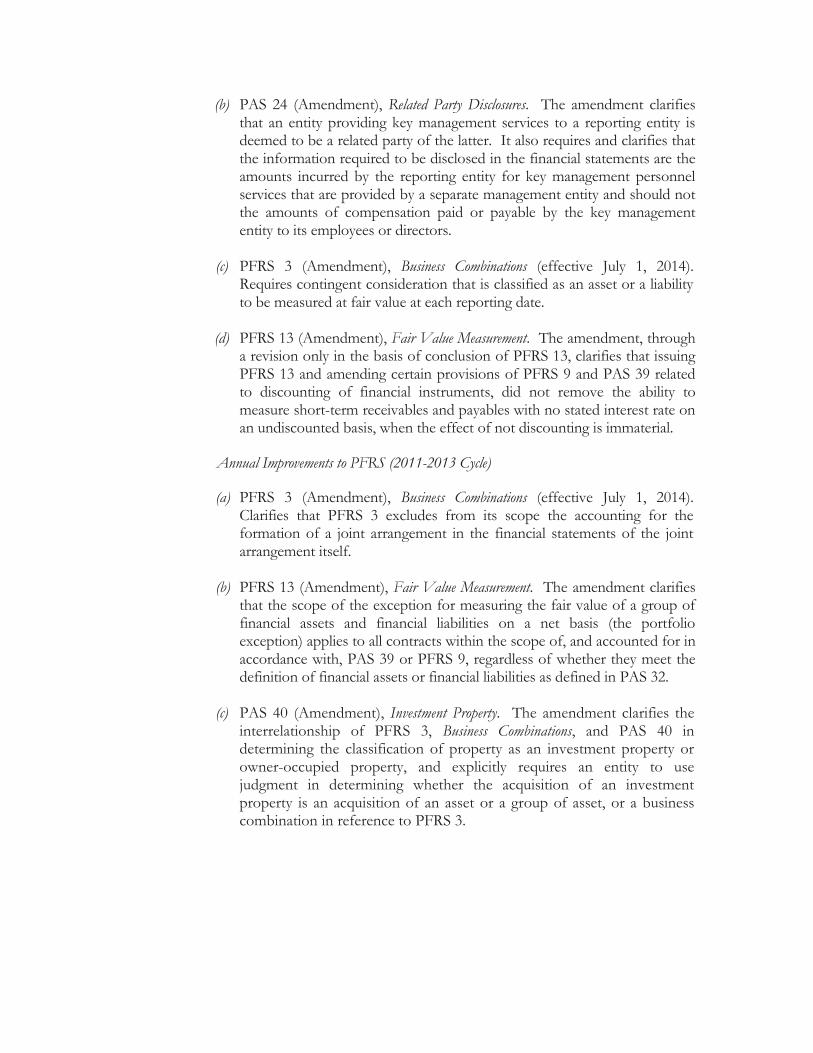
(b) PAS 24 (Amendment), Related Party Disclosures. The amendment clarifies that an entity providing key management services to a reporting entity is deemed to be a related party of the latter. It also requires and clarifies that the information required to be disclosed in the financial statements are the amounts incurred by the reporting entity for key management personnel services that are provided by a separate management entity and should not the amounts of compensation paid or payable by the key management entity to its employees or directors.
(c) PFRS 3 (Amendment), Business Combinations (effective July 1, 2014).
Requires contingent consideration that is classified as an asset or a liability to be measured at fair value at each reporting date.
(d) PFRS 13 (Amendment), Fair Value Measurement. The amendment, through
a revision only in the basis of conclusion of PFRS 13, clarifies that issuing PFRS 13 and amending certain provisions of PFRS 9 and PAS 39 related to discounting of financial instruments, did not remove the ability to measure short-term receivables and payables with no stated interest rate on an undiscounted basis, when the effect of not discounting is immaterial.
Annual Improvements to PFRS (2011-2013 Cycle)
(a) PFRS 3 (Amendment), Business Combinations (effective July 1, 2014). Clarifies that PFRS 3 excludes from its scope the accounting for the formation of a joint arrangement in the financial statements of the joint arrangement itself.
(b) PFRS 13 (Amendment), Fair Value Measurement. The amendment clarifies that the scope of the exception for measuring the fair value of a group of financial assets and financial liabilities on a net basis (the portfolio exception) applies to all contracts within the scope of, and accounted for in accordance with, PAS 39 or PFRS 9, regardless of whether they meet the definition of financial assets or financial liabilities as defined in PAS 32.
(c) PAS 40 (Amendment), Investment Property. The amendment clarifies the
interrelationship of PFRS 3, Business Combinations, and PAS 40 in determining the classification of property as an investment property or owner-occupied property, and explicitly requires an entity to use judgment in determining whether the acquisition of an investment property is an acquisition of an asset or a group of asset, or a business combination in reference to PFRS 3.

3. SIGNIFICANT ACCOUNTING ESTIMATES AND JUDGMENTS
The Group’s consolidated financial statements prepared in accordance with PFRS require management to make judgments and estimates that affect amounts reported in the financial statements and related notes. Judgments and estimates are continually evaluated and are based on historical experience and other factors, including expectations of future events that are believed to be reasonable under circumstances. Actual results may ultimately vary from these estimates.
3.1 Critical Judgments in Applying Accounting Policies
In the process of applying the Group’s accounting policies, management has made the
following judgments, apart from those involving estimation, which have the most significant effect on the amounts recognized in the consolidated financial statements:
(a) Impairment of Investment in AFS Securities
The determination when an investment is other than temporarily impaired requires significant judgment. In making this judgment, the Group evaluates, among other factors, the duration and extent to which the fair value of an investment is less than its cost; and the financial health of and near-term business outlook for the investee, including factors such as industry and sector performance, changes in technology and in operational and financing cash flows.
(b) Distinction Among Investment Property and Owner-Occupied Properties and Land for Future Development
The Group determines whether a property qualifies as Investment Property. In making its judgment, the Group considers whether the property generates cash flows largely independently of the other assets held by an entity. Owner-occupied properties generate cash flows that are attributable not only to property but also to other assets used in the production or supply process while Land for Future Development are properties intended solely for future development.
(c) Distinction between Operating and Finance Leases
The Group has entered into various lease agreements. Critical judgment was exercised by management to distinguish each lease agreement as either an operating or finance lease by looking at the transfer or retention of significant risk and rewards of ownership of the properties covered by the agreements. Failure to make the right judgment will result in either overstatement or understatement of assets and liabilities.
(d) Consolidation of Entities in which the Group Holds Less than 50% Management considers that the Group has de facto control of TDI even though it holds less than 50% of the ordinary shares and voting rights in the latter. The Group is the majority shareholder of TDI with a 30.60% equity interest and has appointed 4 out of a total 5 members of the BOD. In making judgment
regarding its involvement in TDI, management considered the Group’s voting rights, the relative size and dispersion of the voting rights held by other shareholders and the extent of recent participation by those shareholders in general meetings. Based on recent experience, there is no history of other shareholders forming a group to exercise their votes collectively or to prevent the Group from having the practical ability to direct the relevant activities of TDI.
3.2 Key Sources of Estimation Uncertainty The following are the key assumptions concerning the future, and other key sources of estimation uncertainty at the end of the reporting period, that have a significant risk of causing a material adjustment to the carrying amounts of assets and liabilities within the next financial year.
(a) Revenue Recognition Using the Percentage-of-Completion Method
The Group uses the percentage-of-completion method in accounting for its realized gross profit on real estate sales. The use of the percentage-of-completion method requires the Group to estimate the portion completed using relevant information such as costs incurred to date as a proportion of the total budgeted cost of the project and estimates by engineers and other experts.
(b) Determining Net Realizable Value of Residential and Condominium Units for Sale and Property Development Costs and Land for Future Development
In determining the net realizable value of residential and condominium units for sale and property development costs, management takes into account the most reliable evidence available at the times the estimates are made. The future realization of the carrying amounts of real estate for sale and property development costs is affected by price changes in the different market segments as well as the trends in the real estate industry. These are considered key sources of estimation and uncertainty and may cause significant adjustments to the Group’s Residential and Condominium Units for Sale and Property Development Costs within the next financial year.
(c) Fair Value of Share Options The Company estimates the fair value of the share options by applying an option valuation model, taking into account the terms and conditions on which the share options were granted.
(d) Fair Value Measurement of Investment Property
Investment Property is measured using the cost model. The fair value disclosed in the consolidated financial statements is determined by the Group using the discounted cash flows valuation technique since the information on current or recent prices of investment property is not available. The Group uses assumptions that are mainly based on market conditions existing at each reporting period, such as: the receipt of contractual rentals; expected future
market rentals; void periods; maintenance requirements; and appropriate discount rates. These valuations are regularly compared to actual market yield data and actual transactions by the Group and those reported by the market. The expected future market rentals are determined on the basis of current market rentals for similar properties in the same location and condition.
(e) Estimating Useful Lives of Property and Equipment and Investment Property
The Group estimates the useful lives of property and equipment and investment property based on the period over which the assets are expected to be available for use. The estimated useful lives of property and equipment and investment property are reviewed periodically and are updated if expectations differ from previous estimates due to physical wear and tear, technical or commercial obsolescence and legal or other limits on the use of the assets. In addition, estimation of the useful lives of property and equipment and investment property is based on collective assessment of industry practice, internal technical evaluation and experience with similar assets.
(f) Impairment of Trade and Other Receivables
Adequate amount of allowance is provided for specific and groups of accounts, where an objective evidence of impairment exists. The Group evaluates these accounts based on available facts and circumstances, including, but not limited to, the length of the Group’s relationship with the customers, the customers’ current credit status based on third party credit reports and known market forces, average age of accounts, collection experience and historical loss experience.
(g) Valuation of Financial Assets Other than Trade and Other Receivables
The Group carries certain financial assets at fair value, which requires the extensive use of accounting estimates and judgment. In cases when active market quotes are not available, fair value is determined by reference to the current market value of another instrument which is substantially the same or is calculated based on the expected cash flows of the underlying net base of the instrument. The amount of changes in fair value would differ had the Group utilized different valuation methods and assumptions. Any change in fair value of these financial assets and liabilities would affect profit and loss and equity.
(h) Determining Realizable Amount of Deferred Tax Assets
The Group reviews its deferred tax assets at the end of each reporting period and reduces the carrying amount to the extent that it is no longer probable that sufficient taxable profit will be available to allow all or part of the deferred tax asset to be utilized.

(i) Impairment of Non-financial Assets
In assessing impairment, management estimates the recoverable amount of each asset or a cash-generating unit based on expected future cash flows and uses an interest rate to calculate the present value of those cash flows. Estimation uncertainties relates to assumptions about future operating results and the determination of suitable discount rate. Management believes that the assumptions used in the estimation of fair values reflected in the consolidated financial statements are appropriate and reasonable, significant changes in these assumptions may materially affect the assessment of recoverable values and any resulting impairment loss could have a material adverse effect on the results of operations.
(j) Valuation of Post-employment Defined Benefit
The determination of the Company’s obligation and cost of post-employment defined benefit is dependent on the selection of certain assumptions used by actuaries in calculating such amounts. Those assumptions include, among others, discount rates, salary rate increase, and employee turnover rate. A significant change in any of these actuarial assumptions may generally affect the recognized expense and the carrying amount of the post-employment benefit obligation in the next reporting period.
(k) Business Combinations On initial recognition, the assets and liabilities of the acquired business and the consideration paid for them are included in the consolidated financial statements at their fair values. In measuring fair value, management uses estimates of future cash flows and discount rates. Any subsequent change in these estimates would affect the amount of goodwill if the change qualifies as a measurement period adjustment. Any other change would be recognized in profit or loss in the subsequent period.

4. SEGMENT INFORMATION
4.1 Business Segments
The Group’s operating businesses are organized and managed separately according to the nature of products and services provided, with each segment representing a strategic business unit that offers different products and serves different markets. The Group is engaged in the development of residential and office units including urban centers integrating office, residential and commercial components. The Real Estate segment pertains to the development and sale of residential and office developments. The Rental segment includes leasing of office and commercial spaces. The Hotel Operations segment relates to the management of hotel business operations. The Corporate and Others segment includes cinema operations, marketing services, general and corporate income and expense items. The Group generally accounts for intersegment sales and transfers as if the sales or transfers were to third parties at current market prices.
4.2 Segment Assets and Liabilities
Segment assets are allocated based on their physical location and use or direct association with a specific segment and they include all operating assets used by a segment and consist principally of operating cash, receivables, real estate inventories, property and equipment, and investment property, net of allowances and provisions. Similar to segment assets, segment liabilities are also allocated based on their use or direct association with a specific segment. Segment liabilities include all operating liabilities and consist principally of accounts, wages, taxes currently payable, and accrued liabilities.
4.3 Intersegment Transactions
Segment revenues, expenses and performance include sales and purchases between business segments. Such sales and purchases are eliminated in consolidation.

4.4 Analysis of Segment Information
The following tables present revenue and profit information regarding industry segments for the six months ended June 30, 2014 and 2013 and certain asset and liability information regarding segments as at June 30, 2014 and June 30, 2013.
June 30, 2014 Hotel Corporate Real Estate Rental Operations and Others Elimination Consolidated
TOTAL REVENUES
Sales to external customers P 14,616,624,218 P 3,444,283,749 P 368,418,777 P 793,763,398 P - P 19,223,090,142
Intersegment sales - 110,323,197 - 258,808,376 ( 369,131,573) -
Total revenues P 14,616,624,218 P 3,554,606,946 P 368,418,777 P 1,052,571,774 (P 369,131,573) P 19,223,090,142
RESULTS
Segment results P 3,400,215,175 P 2,512,005,503 P 89,943,309 P 38,011,699 (P 29,654,813) P 6,010,520,873
Interest and other income 12,429,998,591
Interest and other charges ( 642,985,529) ( 641,713,218)
Equity in net earnings of associates 304,394,257
Tax expense ( 1,577,250,807)
Pre-acquisition income of subsidiaries ( 83,362,308)
Net Profit P 16,441,315,077
ASSETS AND LIABILITIES
Segment assets P 154,785,163,150 P39,212,712,352 P 1,105,722,535 P 7,368,417,205 P - P 202,472,015,242
Investments in and advances
to associates and other
related parties - net - - - 5,057,164,390 - 5,057,164,390
Total assets P154,785,163,150 P39,212,712,352 P 1,105,722,535 P 12,425,581,595 P - P 207,529,179,632
Segment liabilities P 73,764,180,938 P5,599,128,633 P 200,132,214 P 3,166,758,828 P - P 82,730,200,613

June 30, 2013 (As Restated)
Hotel Corporate Real Estate Rental Operations and Others Elimination Consolidated
TOTAL REVENUES
Sales to external customers P 12,868,020,309 P 2,828,913,058 P 224,789,443 P 317,902,090 P - P 16,239,624,900
Intersegment sales - 56,518,234 - 226,237,781 ( 282,756,015) -
Total revenues P 12,868,020,309 P 2,885,431,292 P 224,789,443 P 544,139,871 (P 282,756,015) P 16,239,624,900
RESULTS
Segment results P 2,686,901,768 P 2,226,576,292 P 47,682,015 P 6,360,963 P 12,944,427 P 4,980,465,465
Interest and other income 810,945,105
Interest and other charges ( 512,280,666) ( 641,713,218)
Equity in net earnings of associates 230,261,131
Tax expense ( 1,280,278,149)
Net Profit P 4,229,112,886
ASSETS AND LIABILITIES
Segment assets P 122,801,233,374 P19,021,620,341 P 250,052,696 P12,929,029,224 P - P 155,001,935,635
Investments in and advances
to associates and other
related parties - net - - - 8,183,504,164 - 8,183,504,164
Total assets P 122,801,233,374 P 19,021,620,341 P 250,052,696 P21,112,533,388 P - P 163,185,439,799
Segment liabilities P 67,487,689,162 P 2,304,240,711 P 106,777,036 P 6,134,639,515 P - P 76,033,346,424
5. STOCK RIGHTS
As a result of the stock rights offering, 5,127,556,725 common shares were subscribed and issued on June 1, 2009. Of the total exercise price, 50% was paid as of May 31, 2009 and the remaining 50% was paid by the subscribers in 2010. Relative to the share subscription, 4,102,045,380 stock warrants were issued and these will be exercisable beginning on the second year until five years from issue date. As of the second quarter of 2014, 3,997,510,899 stock warrants were exercised. The remaining warrants are exercisable until 2015.

6. EMPLOYEE BENEFITS
Effect of Restatement to Comparative Financial Statements
The Group has applied PAS 19 (Revised) retrospectively in accordance with its transitional provisions. Consequently, it restated the comparative financial statements for June 30, 2013. The effects of the adoption of PAS 19 (Revised) on the consolidated statements of income, consolidated statements of comprehensive income, and consolidated components of equity as at and for the six months ended June 30, 2013 are shown below:
Increase(Decrease) Consolidated Statements of Income
Operating Expenses P 8,118,411 Interest and Other Charges – net 18,484,313 Tax Expense (7,980,817) P 18,621,907
Consolidated Statements of Comprehensive Income Actuarial Gains (Losses) on
Retirement Benefit Obligations P 9,448,879
Consolidated Components of Equity Retained Earnings P (9,932,522) Net Actuarial Gains (Losses) on Retirement Benefit Plan (152,912,835) Non-controlling Interest (9,994,638)
(P 172,839,995)
7. CASH DIVIDENDS The details of the Company’s cash dividend declarations, both for preferred and common shares, are as follows:
2014
Declaration date/date of approval by BOD
June 16, 2014
Date of record
June 30, 2014
Date of payment
July 24, 2014
Amounts declared and for payment
P 1,246,941,619

8. EARNINGS PER SHARE Earnings per share (EPS) amounts were computed as follows:
June 30, 2014 June 30, 2013 (As Restated)
Net profit attributable to Company’s shareholders
P 16,326,574,092
P 4,187,697,549 Computed dividends on cumulative preferred shares series “A”
( 297,534)
( 297,534)
Profit available to Company’s common shareholders
P 16,326,276,558
P 4,187,400,015 Divided by weighted average number of outstanding common shares
31,607,906,288
28,811,940,441
Basic EPS P 0.517 P 0.145
Divided by weighted average number of outstanding common shares and potential dilutive shares
31,831,289,628
29,037,708,847
Diluted EPS P 0.513 P 0.144
9. COMMITMENTS AND CONTINGENCIES
There are commitments, guarantees and contingent liabilities that arise in the normal course of operations of the Group which are not reflected in the accompanying interim consolidated financial statements. The management of the Group is of the opinion, that losses, if any, from these items will not have any material effect on its consolidated financial statements. In addition, there are no material off-balance sheet transactions, arrangements, obligations and other relationships of the Group with unconsolidated entities or other persons created during the reporting period.

10. SEASONAL FLUCTUATIONS There were no seasonal aspects that had a material effect on the financial condition
or results of operations of the Group.
11. RISK MANAGEMENT OBJECTIVES AND POLICIES
The Group has various financial instruments such as cash and cash equivalents, financial assets at FVTPL, available-for-sale securities, interest-bearing loans and borrowings, bonds, trade receivables and payables which arise directly from the Group’s business operation. The financial debts were issued to raise funds for the Group’s capital expenditures. Exposure to currency, interest rate, credit, liquidity and equity risk arise in the ordinary course of the Group’s business activities. The main objective of the Group’s risk management is to identify, monitor, and minimize those risks and to provide cost with a degree of certainty. The Group does not actively engage in the trading of financial assets for speculative purposes.
11.1 Foreign Currency Sensitivity
Most of the Group’s transactions are carried out in Philippine peso, its functional currency. Exposures to currency exchange rates arise mainly from the Group’s U.S. dollar-denominated cash and cash equivalents, and bonds which have been used to fund new projects and to refinance certain indebtedness for general corporate purposes. Exposures to foreign exchange rates vary during the period depending on the volume of overseas transactions and mainly affect consolidated profit or loss of the Group. Management is confident that any exposure to foreign exchange rates will not adversely affect the Group’s financial performance. 11.2 Interest Rate Sensitivity The Group’s interest risk management policy is to minimize interest rate cash flow risk exposures to changes in interest rates. The Group maintains a debt portfolio unit of both fixed and floating interest rates. Changes in the market interest rates related primarily to the Group’s interest-bearing debt obligations with floating interest rate can directly cause a change in the amount of interest payment. The Group manages its interest risk by leveraging the fixed interest rate debt obligations over the floating interest rate debt obligations in its debt portfolio.
11.3 Credit Risk Generally, the Group’s credit risk is attributable to trade receivables, rental receivables and other financial assets. The Group maintains defined credit policies and continuously monitors defaults of customers and other counterparties, identified either individually or by group, and incorporate this information into its credit risk controls. Where available at a reasonable cost, external credit ratings and/or reports on customers and other counterparties are obtained and used. The Group’s policy is to deal only with creditworthy counterparties. In addition, for a significant proportion of sales, advance payments are received to mitigate credit risk.
11.4 Liquidity Risk The Group manages its liquidity needs by carefully monitoring scheduled debt servicing payments for long-term financial liabilities as well as cash outflows due in a day-to-day business. Liquidity needs are monitored in various time bands, on a day-to-day and week-to-week, as well as on the basis of a rolling 30-day projection. Long-term needs for a six-month and a one-year period are identified monthly. The Group maintains cash to meet its liquidity requirements for up to 60-day periods. Excess cash are invested in time deposits or short-term marketable securities. Funding for long-term liquidity needs is additionally secured by an adequate amount of committed credit facilities and the ability to sell long-term financial assets. 11.5 Other Price Risk Sensitivity
The Group’s market price risk arises from its investments carried at fair value (financial assets classified as FVTPL and AFS). It manages its risk arising from changes in market price by monitoring the changes in the market price of the investments. The investments in listed equity securities are considered long-term strategic investments. In accordance with the Group’s policies, no specific hedging activities are undertaken in relation to these investments. The investments are continuously monitored and voting rights arising from these equity instruments are utilized in the Group’s favor.
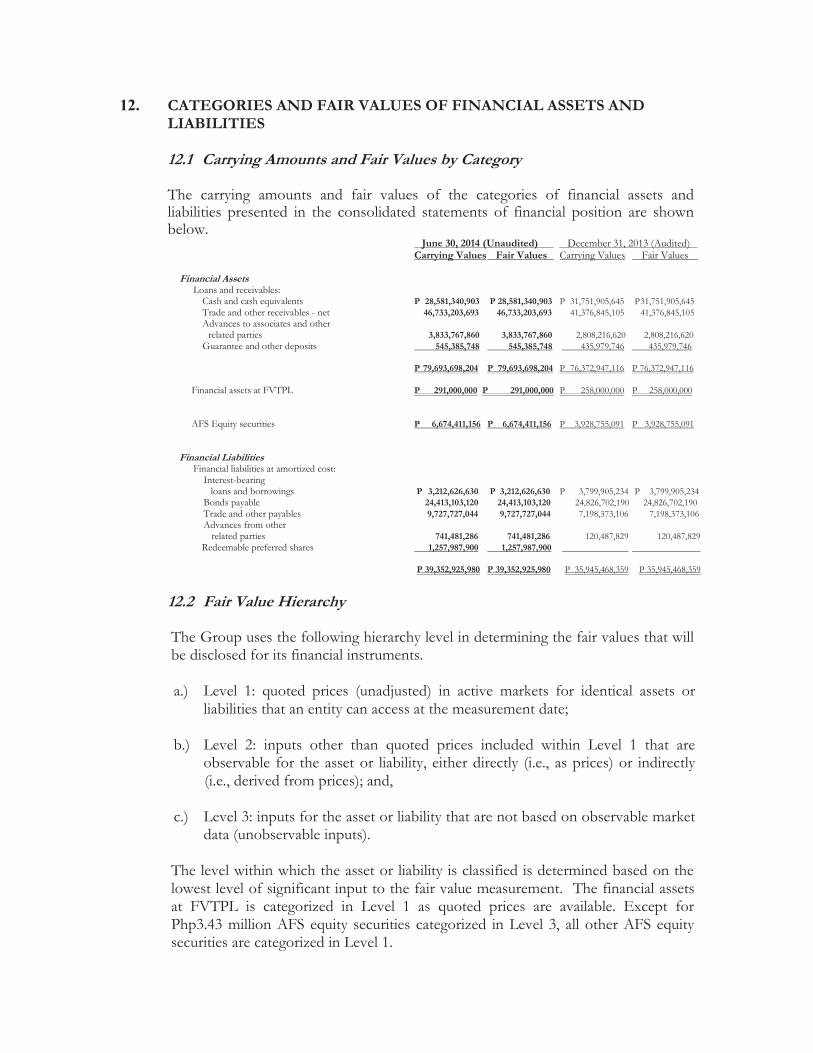
12. CATEGORIES AND FAIR VALUES OF FINANCIAL ASSETS AND LIABILITIES
12.1 Carrying Amounts and Fair Values by Category
The carrying amounts and fair values of the categories of financial assets and liabilities presented in the consolidated statements of financial position are shown below.
June 30, 2014 (Unaudited) December 31, 2013 (Audited) Carrying Values Fair Values Carrying Values Fair Values Financial Assets Loans and receivables: Cash and cash equivalents P 28,581,340,903 P 28,581,340,903 P 31,751,905,645 P 31,751,905,645 Trade and other receivables - net 46,733,203,693 46,733,203,693 41,376,845,105 41,376,845,105 Advances to associates and other related parties 3,833,767,860 3,833,767,860 2,808,216,620 2,808,216,620 Guarantee and other deposits 545,385,748 545,385,748 435,979,746 435,979,746 P 79,693,698,204 P 79,693,698,204 P 76,372,947,116 P 76,372,947,116 Financial assets at FVTPL P 291,000,000 P 291,000,000 P 258,000,000 P 258,000,000 AFS Equity securities P 6,674,411,156 P 6,674,411,156 P 3,928,755,091 P 3,928,755,091 Financial Liabilities Financial liabilities at amortized cost: Interest-bearing loans and borrowings P 3,212,626,630 P 3,212,626,630 P 3,799,905,234 P 3,799,905,234 Bonds payable 24,413,103,120 24,413,103,120 24,826,702,190 24,826,702,190 Trade and other payables 9,727,727,044 9,727,727,044 7,198,373,106 7,198,373,106 Advances from other related parties 741,481,286 741,481,286 120,487,829 120,487,829 Redeemable preferred shares 1,257,987,900 1,257,987,900 P 39,352,925,980 P 39,352,925,980 P 35,945,468,359 P 35,945,468,359
12.2 Fair Value Hierarchy The Group uses the following hierarchy level in determining the fair values that will be disclosed for its financial instruments.
a.) Level 1: quoted prices (unadjusted) in active markets for identical assets or
liabilities that an entity can access at the measurement date; b.) Level 2: inputs other than quoted prices included within Level 1 that are
observable for the asset or liability, either directly (i.e., as prices) or indirectly (i.e., derived from prices); and,
c.) Level 3: inputs for the asset or liability that are not based on observable market
data (unobservable inputs). The level within which the asset or liability is classified is determined based on the lowest level of significant input to the fair value measurement. The financial assets at FVTPL is categorized in Level 1 as quoted prices are available. Except for Php3.43 million AFS equity securities categorized in Level 3, all other AFS equity securities are categorized in Level 1.
1
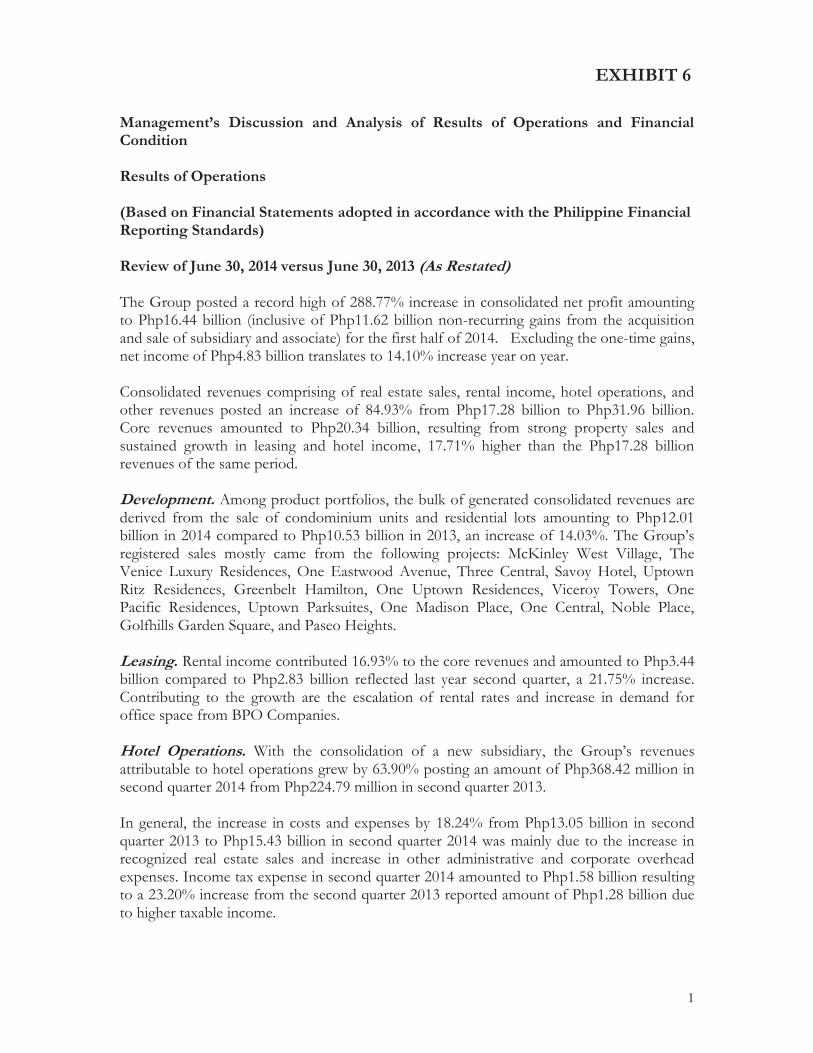
Management’s Discussion and Analysis of Results of Operations and Financial Condition Results of Operations (Based on Financial Statements adopted in accordance with the Philippine Financial Reporting Standards) Review of June 30, 2014 versus June 30, 2013 (As Restated) The Group posted a record high of 288.77% increase in consolidated net profit amounting to Php16.44 billion (inclusive of Php11.62 billion non-recurring gains from the acquisition and sale of subsidiary and associate) for the first half of 2014. Excluding the one-time gains, net income of Php4.83 billion translates to 14.10% increase year on year. Consolidated revenues comprising of real estate sales, rental income, hotel operations, and other revenues posted an increase of 84.93% from Php17.28 billion to Php31.96 billion. Core revenues amounted to Php20.34 billion, resulting from strong property sales and sustained growth in leasing and hotel income, 17.71% higher than the Php17.28 billion revenues of the same period. Development. Among product portfolios, the bulk of generated consolidated revenues are derived from the sale of condominium units and residential lots amounting to Php12.01 billion in 2014 compared to Php10.53 billion in 2013, an increase of 14.03%. The Group’s registered sales mostly came from the following projects: McKinley West Village, The Venice Luxury Residences, One Eastwood Avenue, Three Central, Savoy Hotel, Uptown Ritz Residences, Greenbelt Hamilton, One Uptown Residences, Viceroy Towers, One Pacific Residences, Uptown Parksuites, One Madison Place, One Central, Noble Place, Golfhills Garden Square, and Paseo Heights. Leasing. Rental income contributed 16.93% to the core revenues and amounted to Php3.44 billion compared to Php2.83 billion reflected last year second quarter, a 21.75% increase. Contributing to the growth are the escalation of rental rates and increase in demand for office space from BPO Companies. Hotel Operations. With the consolidation of a new subsidiary, the Group’s revenues attributable to hotel operations grew by 63.90% posting an amount of Php368.42 million in second quarter 2014 from Php224.79 million in second quarter 2013. In general, the increase in costs and expenses by 18.24% from Php13.05 billion in second quarter 2013 to Php15.43 billion in second quarter 2014 was mainly due to the increase in recognized real estate sales and increase in other administrative and corporate overhead expenses. Income tax expense in second quarter 2014 amounted to Php1.58 billion resulting to a 23.20% increase from the second quarter 2013 reported amount of Php1.28 billion due to higher taxable income.
EXHIBIT 6
2
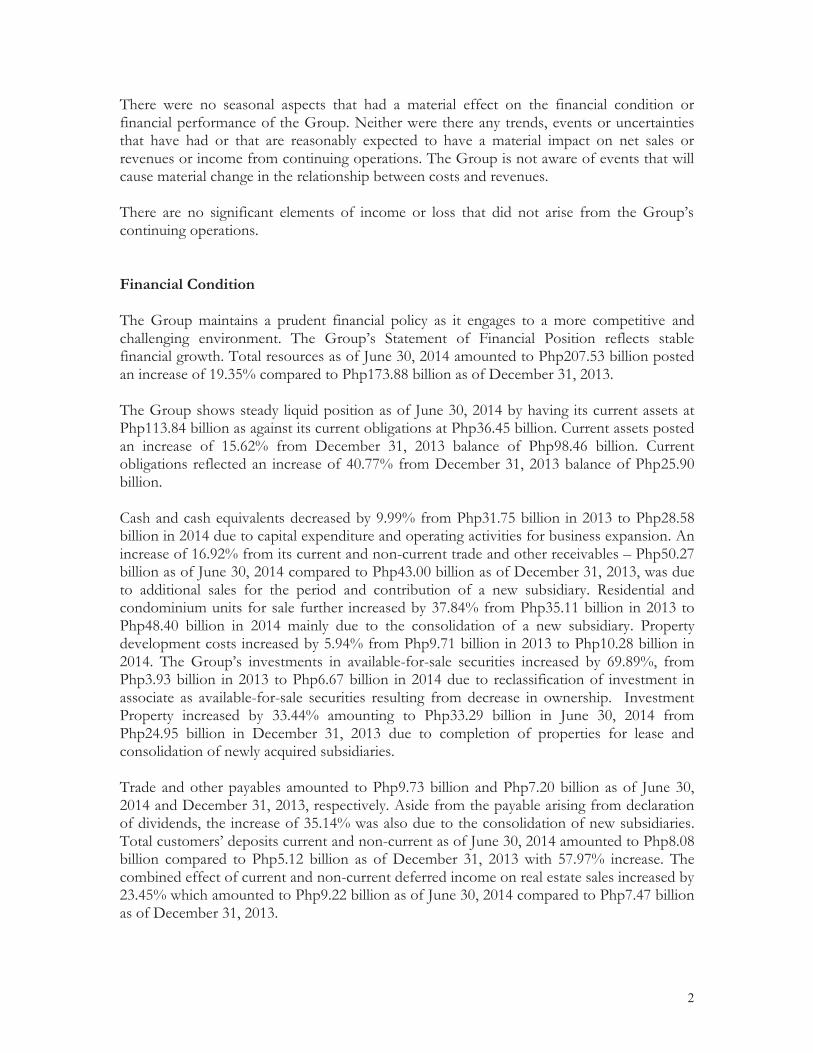
There were no seasonal aspects that had a material effect on the financial condition or financial performance of the Group. Neither were there any trends, events or uncertainties that have had or that are reasonably expected to have a material impact on net sales or revenues or income from continuing operations. The Group is not aware of events that will cause material change in the relationship between costs and revenues. There are no significant elements of income or loss that did not arise from the Group’s continuing operations.
Financial Condition The Group maintains a prudent financial policy as it engages to a more competitive and challenging environment. The Group’s Statement of Financial Position reflects stable financial growth. Total resources as of June 30, 2014 amounted to Php207.53 billion posted an increase of 19.35% compared to Php173.88 billion as of December 31, 2013. The Group shows steady liquid position as of June 30, 2014 by having its current assets at Php113.84 billion as against its current obligations at Php36.45 billion. Current assets posted an increase of 15.62% from December 31, 2013 balance of Php98.46 billion. Current obligations reflected an increase of 40.77% from December 31, 2013 balance of Php25.90 billion. Cash and cash equivalents decreased by 9.99% from Php31.75 billion in 2013 to Php28.58 billion in 2014 due to capital expenditure and operating activities for business expansion. An increase of 16.92% from its current and non-current trade and other receivables – Php50.27 billion as of June 30, 2014 compared to Php43.00 billion as of December 31, 2013, was due to additional sales for the period and contribution of a new subsidiary. Residential and condominium units for sale further increased by 37.84% from Php35.11 billion in 2013 to Php48.40 billion in 2014 mainly due to the consolidation of a new subsidiary. Property development costs increased by 5.94% from Php9.71 billion in 2013 to Php10.28 billion in 2014. The Group’s investments in available-for-sale securities increased by 69.89%, from Php3.93 billion in 2013 to Php6.67 billion in 2014 due to reclassification of investment in associate as available-for-sale securities resulting from decrease in ownership. Investment Property increased by 33.44% amounting to Php33.29 billion in June 30, 2014 from Php24.95 billion in December 31, 2013 due to completion of properties for lease and consolidation of newly acquired subsidiaries. Trade and other payables amounted to Php9.73 billion and Php7.20 billion as of June 30, 2014 and December 31, 2013, respectively. Aside from the payable arising from declaration of dividends, the increase of 35.14% was also due to the consolidation of new subsidiaries. Total customers’ deposits current and non-current as of June 30, 2014 amounted to Php8.08 billion compared to Php5.12 billion as of December 31, 2013 with 57.97% increase. The combined effect of current and non-current deferred income on real estate sales increased by 23.45% which amounted to Php9.22 billion as of June 30, 2014 compared to Php7.47 billion as of December 31, 2013.
3
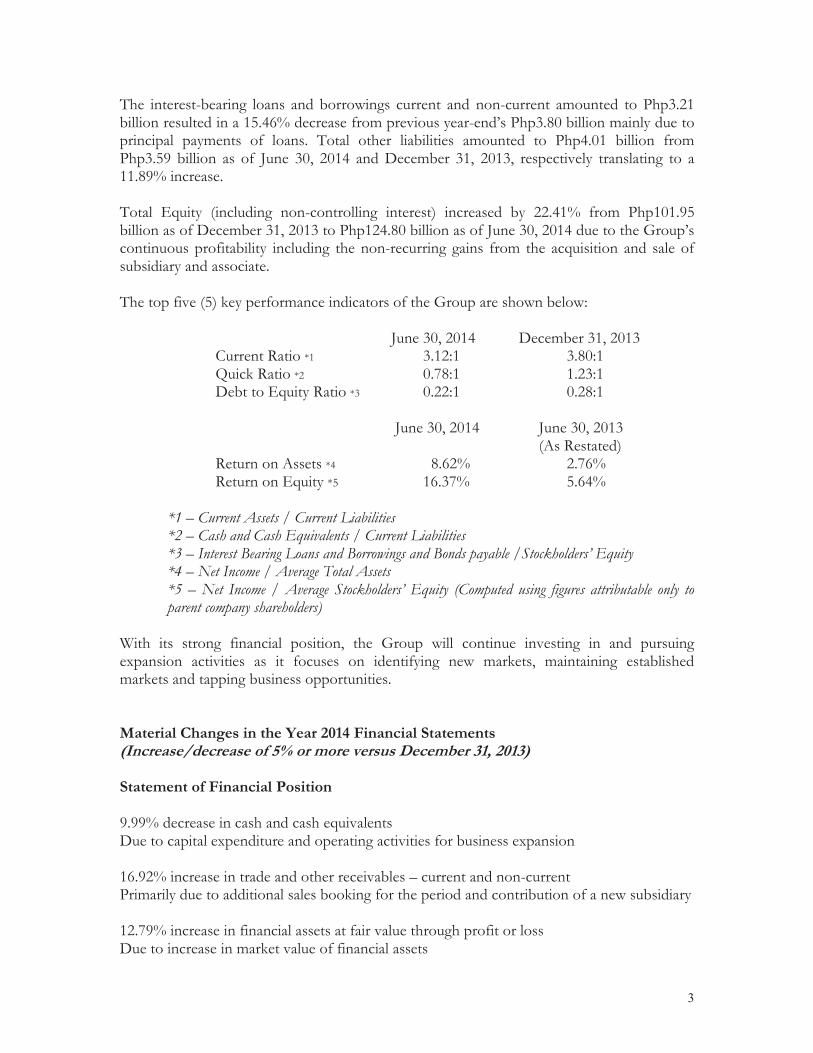
The interest-bearing loans and borrowings current and non-current amounted to Php3.21 billion resulted in a 15.46% decrease from previous year-end’s Php3.80 billion mainly due to principal payments of loans. Total other liabilities amounted to Php4.01 billion from Php3.59 billion as of June 30, 2014 and December 31, 2013, respectively translating to a 11.89% increase. Total Equity (including non-controlling interest) increased by 22.41% from Php101.95 billion as of December 31, 2013 to Php124.80 billion as of June 30, 2014 due to the Group’s continuous profitability including the non-recurring gains from the acquisition and sale of subsidiary and associate. The top five (5) key performance indicators of the Group are shown below:
June 30, 2014 December 31, 2013
Current Ratio *1 3.12:1 3.80:1 Quick Ratio *2 0.78:1 1.23:1
Debt to Equity Ratio *3 0.22:1 0.28:1 June 30, 2014 June 30, 2013 (As Restated)
Return on Assets *4 8.62% 2.76% Return on Equity *5 16.37% 5.64%
*1 – Current Assets / Current Liabilities *2 – Cash and Cash Equivalents / Current Liabilities *3 – Interest Bearing Loans and Borrowings and Bonds payable /Stockholders’ Equity *4 – Net Income / Average Total Assets *5 – Net Income / Average Stockholders’ Equity (Computed using figures attributable only to parent company shareholders)
With its strong financial position, the Group will continue investing in and pursuing expansion activities as it focuses on identifying new markets, maintaining established markets and tapping business opportunities. Material Changes in the Year 2014 Financial Statements (Increase/decrease of 5% or more versus December 31, 2013) Statement of Financial Position 9.99% decrease in cash and cash equivalents Due to capital expenditure and operating activities for business expansion 16.92% increase in trade and other receivables – current and non-current Primarily due to additional sales booking for the period and contribution of a new subsidiary 12.79% increase in financial assets at fair value through profit or loss Due to increase in market value of financial assets

4
37.84% increase in residential condominium units for sale Due to consolidation of a new subsidiary 5.94% increase in property development costs Due to consolidation of a new subsidiary, net of reclassifications to residential and condominium units for sale and real properties for lease by the Company 81.58% increase in other assets – current and non-current Mainly due to contributions of new subsidiaries and recognition of goodwill 27.77% increase in advances to landowners and joint ventures Due to consolidation of a new subsidiary 156.99% increase in land for future development Due to consolidation of a new subsidiary 69.89% increase in investments in available-for-sale securities Due to reclassification of investment in associate as available-for-sale securities resulting from decrease in ownership 60.41% decrease in investment in and advances to associates and other related parties Due to elimination of investments in subsidiaries previously classified as associates 33.44% increase in investment property - net Due to completion of properties for lease and consolidation of newly acquired subsidiaries 136.68% increase in property and equipment - net Due to consolidation of new subsidiaries 11.52% increase in deferred tax assets Higher deferred tax assets on taxable temporary differences 15.46% decrease in interest-bearing loans and borrowings – current and non-current Due to principal payments of loans 35.14% increase in trade and other payables Due to payables arising from declaration of dividends and consolidation of new subsidiaries 57.97% increase in customers’ deposit – current and non-current Due to aggressive marketing and pre-selling of various projects and contribution from new subsidiary 11.29% increase in reserve for property development – current and non-current Represents estimated cost to complete the development of various projects 23.45% increase in deferred income on real estate sales – current and non-current Represents increase in unearned revenue

5
83.76% decrease in income tax payable Due to payment of prior year income tax due 100% increase in redeemable preferred shares Due to consolidation of a new subsidiary 12.51% increase in deferred tax liabilities Pertains to tax effects of taxable and deductible temporary differences 515.40% increase in advances from associates and other related parties Due to consolidation of a new subsidiary 10.60% increase in retirement benefit obligation Additional accrual of retirement plan of employees 11.89% increase in other liabilities – current and non-current Additional increase on deferred income and consolidation of new subsidiaries (Increase/decrease of 5% or more versus June 30, 2013) Statements of Income 14.03% increase in real estate sales Primarily due to higher sales recognized for the period 8.17% increase in interest income on real estate sales Recognition of interest income from prior years’ sales 13.18% increase in realized gross profit on prior years’ sales Represents portion of gross profit from real estate sales made in prior years realized for the period 21.75% increase in rental income Due to escalation of rental rates and increase in demand for office space from BPO Companies 63.90% increase in hotel operations Due to consolidation of a new subsidiary 32.20% increase in equity share in net earnings of associates Represents the company’s share in the net earnings of its associates 1071.44% increase in interest and other income-net Mainly due to non-recurring gains from the acquisition and sale of subsidiary and associate 12.20% increase in cost of real estate sales Due to increase in real estate sales
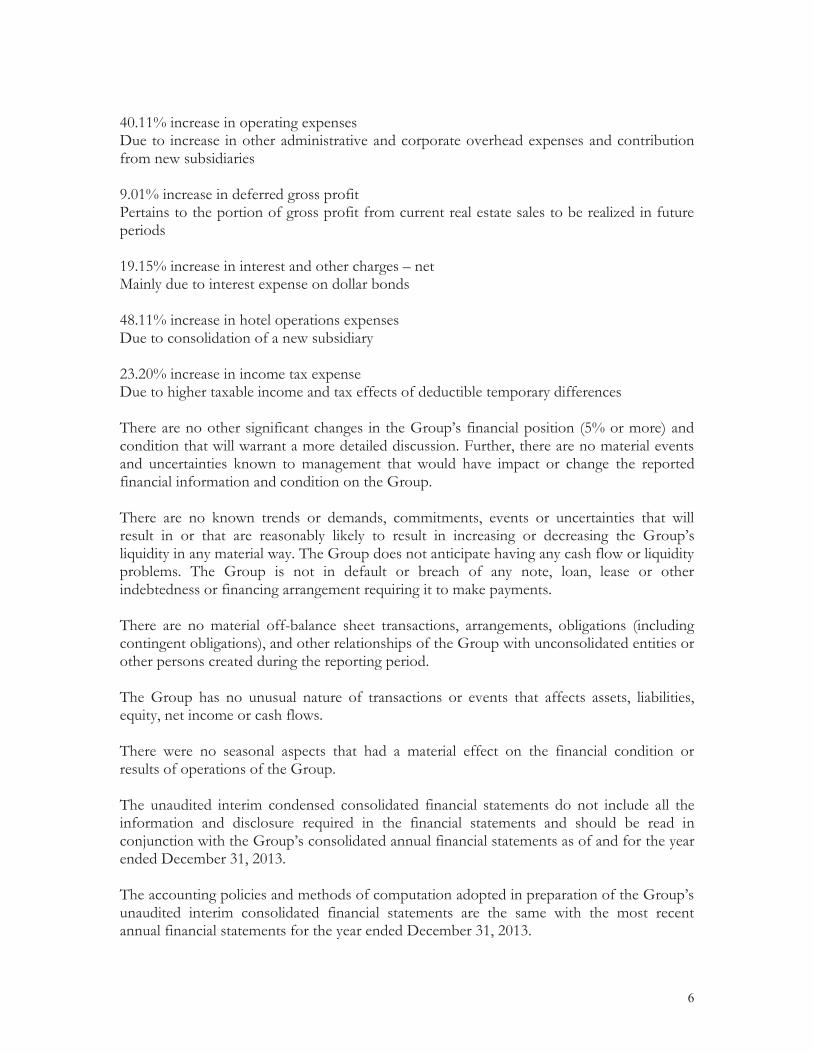
6
40.11% increase in operating expenses Due to increase in other administrative and corporate overhead expenses and contribution from new subsidiaries 9.01% increase in deferred gross profit Pertains to the portion of gross profit from current real estate sales to be realized in future periods 19.15% increase in interest and other charges – net Mainly due to interest expense on dollar bonds 48.11% increase in hotel operations expenses Due to consolidation of a new subsidiary 23.20% increase in income tax expense Due to higher taxable income and tax effects of deductible temporary differences There are no other significant changes in the Group’s financial position (5% or more) and condition that will warrant a more detailed discussion. Further, there are no material events and uncertainties known to management that would have impact or change the reported financial information and condition on the Group. There are no known trends or demands, commitments, events or uncertainties that will result in or that are reasonably likely to result in increasing or decreasing the Group’s liquidity in any material way. The Group does not anticipate having any cash flow or liquidity problems. The Group is not in default or breach of any note, loan, lease or other indebtedness or financing arrangement requiring it to make payments. There are no material off-balance sheet transactions, arrangements, obligations (including contingent obligations), and other relationships of the Group with unconsolidated entities or other persons created during the reporting period. The Group has no unusual nature of transactions or events that affects assets, liabilities, equity, net income or cash flows. There were no seasonal aspects that had a material effect on the financial condition or results of operations of the Group. The unaudited interim condensed consolidated financial statements do not include all the information and disclosure required in the financial statements and should be read in conjunction with the Group’s consolidated annual financial statements as of and for the year ended December 31, 2013. The accounting policies and methods of computation adopted in preparation of the Group’s unaudited interim consolidated financial statements are the same with the most recent annual financial statements for the year ended December 31, 2013.

7
There were no known material events subsequent to the end of the interim period that have not been reflected in the Group’s Financial Statements for the second quarter of 2014. There were no changes in estimates of amount reported in the current financial year or changes in estimates of amounts reported in prior financial years. There was no contingent liability reflected in the most recent annual financial statements, the same in the current year consolidated financial statements for the second quarter of 2014. There are commitments, guarantees and contingent liabilities that arise in the normal course of operations of the Group which are not reflected in the accompanying interim consolidated financial statements. The management of the Group is of the opinion that losses, if any, from these items will not have any material effect on its interim consolidated financial statements. There were no other material issuances, repurchases or repayments of debt and equity securities. There are no material commitments for capital expenditures, events or uncertainties that have had or that are reasonable expected to have a material impact on the continuing operations of the Group.

MEGAWORLD CORPORATION AND SUBSIDIARIES
Aging of Accounts Receivables
June 30, 2014
(In thousand pesos)
Past due
TOTAL CURRENT/ 7 Months - Above accounts & items
NOT YET DUE 1-3 Months 4-6 Months 1 Year 1 Year in Litigation
Type of Receivables:
a. Trade and other receivables 50,273,459 48,608,538 995,706 346,410 181,561 141,244 -
EXHIBIT 7

Current ratio 3.12 :1.00 3.80 :1.00
Quick ratio 0.78 :1.00 1.23 :1.00
Debt-to-equity ratio 0.22 :1.00 0.28 :1.00
Interest-bearing debt to total capitalization ratio 0.20 :1.00 0.24 :1.00
Asset-to-equity ratio 1.66 :1.00 1.71 :1.00
Interest rate coverage ratio
Net profit margin
Return on assets
Return on equity
MEGAWORLD CORPORATION AND SUBSIDIARIES
SCHEDULE OF FINANCIAL SOUNDNESS INDICATORS
JUNE 30, 2014 AND DECEMBER 31, 2013
JUNE 30, 2014 DECEMBER 31, 2013
8.62% 2.76%
16.37% 5.64%
JUNE 30, 2013
( As Restated )
2172.37% 821.00%
51.45% 24.47%
EXHIBIT 8
LIQUIDITY RATIOS measure the business’ ability to pay short-term debt. Current ratio – computed as current assets divided by current liabilities Quick ratio – computed as cash and cash equivalents divided by current liabilities
SOLVENCY RATIOS measure the business’ ability to pay all debts, particularly long-term debt. Debt to equity ratio – computed as interest bearing loans and borrowings and bonds payable divided by total stockholders’ equity. Interest-bearing debt to total capitalization ratio – computed as interest-bearing debt divided by interest-bearing debt+stockholders’ equity attributable to the company's shareholders. ASSET-TO-EQUITY RATIOS measure financial leverage and long-term solvency. It shows how much of the assets are owned by the company. It is computed as total assets divided by stockholders’ equity. INTEREST RATE COVERAGE RATIOS measure the business’ ability to meet its interest payments. It is computed as Earnings before income tax and interest expense (EBIT) divided by interest payments. PROFITABILITY RATIOS Net margin – computed as net profit divided by revenues Return on assets – net profit divided by average total assets Return on equity – net profit attributable to the company's shareholders divided by average
stockholders' equity attributable to the company's shareholders.


![Untitled-6 [] · tis 1227-2539 (1996) tis 1390-2539 (1996) tis 1227-2539 (1996) tis 1390-2539 (1996) tis 1227-2539 (1996)](https://img.pdfslide.us/doc/110x75/5e1a6a0f6b8d9f48bd19bcad/untitled-6-tis-1227-2539-1996-tis-1390-2539-1996-tis-1227-2539-1996-tis.jpg)