Embed Size (px)
Citation preview

Securities Analysis, Section IV
Security Valuation
&
EIC Analysis
(Part 2)

Lecture Presentation Software to accompany
Investment Analysis and Portfolio Management
Sixth Editionby
Frank K. Reilly & Keith C. Brown
Chapters 11,14,15, & 18

Copyright © 2000 by Harcourt, Inc. All rights reserved
Top-Down Approach, Step Three
• Company and Stock Analysis

Copyright © 2000 by Harcourt, Inc. All rights reserved
Company Analysis and Stock Selection• After analyzing the economy and stock markets
for several countries you have decided to invest some portion of your portfolio in common stocks
• After analyzing various industries, you have identified those industries that appear to offer above-average risk-adjusted performance over your investment horizon
• Which are the best companies?
• Are they overpriced?

Copyright © 2000 by Harcourt, Inc. All rights reserved
Company Analysis and Stock Selection
• Good companies are not necessarily good investments
• Compare the intrinsic value of a stock to its market value
• Stock of a great company may be overpriced
• Stock of a growth company may not be growth stock

Copyright © 2000 by Harcourt, Inc. All rights reserved
Types of Companies and Stocks
• Growth
• Defensive
• Cyclical
• Speculative

Copyright © 2000 by Harcourt, Inc. All rights reserved
• Growth companies have historically been defined as companies that consistently experience above-average increases in sales and earnings
• Financial theorists define a growth company as one with management and opportunities that yield rates of return greater than the firm’s required rate of return
Growth Companies
Copyright © 2000 by Harcourt, Inc. All rights reserved
Growth Stocks
• Growth stocks are not necessarily shares in growth companies
• A growth stock has a higher rate of return than other stocks with similar risk
• Superior risk-adjusted rate of return occurs because of market undervaluation compared to other stocks

Copyright © 2000 by Harcourt, Inc. All rights reserved
Value versus Growth Investing• Growth stocks will have positive
earnings surprises and above-average risk adjusted rates of return because the stocks are undervalued
• Value stocks appear to be undervalued for reasons besides earnings growth potential
• Value stocks usually have low P/E ratio or low ratios of price to book value

Copyright © 2000 by Harcourt, Inc. All rights reserved
Value versus Growth Investing• Buffett’s view:
– Growth is a key determinant of value for any stock, so it is always a component of determining whether or not a stock is undervalued
– Furthermore, so long as the market is under-valuing a stock, then he would categorize it as a “value” stock
– Finally, he considers all investing to be “value” investing
– Thus, he considers “value” vs. “growth” investing to be a false dichotomy
Copyright © 2000 by Harcourt, Inc. All rights reserved
Defensive Companies and Stocks
• Defensive companies’ future earnings are more likely to withstand an economic downturn
• Low business risk
• Not excessive financial risk
• Stocks with low or negative systematic risk

Copyright © 2000 by Harcourt, Inc. All rights reserved
Cyclical Companies and Stocks
• Sales and earnings heavily influenced by aggregate business activity
• Stocks with high betas

Copyright © 2000 by Harcourt, Inc. All rights reserved
Speculative Companies and Stocks
• Assets involve great risk– e.g., biotechs, bankruptcies, etc.
• Can be viewed as a gamble– Possible great gain
– Stock may be overpriced

Copyright © 2000 by Harcourt, Inc. All rights reserved
Economic, Industry, and Structural Links to Company Analysis
• Company analysis is the final step in the top-down approach to investing
• Macroeconomic analysis identifies industries expected to offer attractive returns in the expected future environment
• Analysis of firms in selected industries concentrates on a stock’s intrinsic value based on growth and risk

Copyright © 2000 by Harcourt, Inc. All rights reserved
Economic and Industry Influences
• If trends are favorable for an industry, the company analysis should focus on firms in that industry that are positioned to benefit from the economic trends
• Firms with sales or earnings particularly sensitive to macroeconomic variables should also be considered
• Research analysts need to be familiar with the cash flow and risk of the firms

Copyright © 2000 by Harcourt, Inc. All rights reserved
Structural Influences• Social trends, technology, political, and
regulatory influences can have significant influence on firms
• Early stages in an industry’s life cycle see changes in technology that followers may imitate and benefit from
• Politics and regulatory events can create opportunities even when economic influences are weak

Copyright © 2000 by Harcourt, Inc. All rights reserved
Company Analysis
• Industry competitive environment
• SWOT analysis
• Present value of cash flows
• Relative valuation ratio techniques
Copyright © 2000 by Harcourt, Inc. All rights reserved
Firm Competitive Strategies
• Current rivalry
• Threat of new entrants
• Potential substitutes
• Bargaining power of suppliers
• Bargaining power of buyers

Copyright © 2000 by Harcourt, Inc. All rights reserved
Firm Competitive Strategies• Defensive or offensive• Defensive strategy deflects competitive
forces in the industry• Offensive competitive strategy affects
competitive force in the industry to improve the firm’s relative position
• Porter suggests two major strategies: low-cost leadership and differentiation

Copyright © 2000 by Harcourt, Inc. All rights reserved
Low-Cost Strategy
• Seeks to be the low cost leader in its industry– Through economies of scale (in production or
marketing), better logistics, etc.
• Must still command prices near industry average, so still must differentiate
• Discounting too much erodes superior rates of return

Copyright © 2000 by Harcourt, Inc. All rights reserved
Differentiation Strategy
• Identify as unique in its industry in an area that is important to buyers
• Above average rate of return only comes if the price premium exceeds the extra cost of being unique

Copyright © 2000 by Harcourt, Inc. All rights reserved
Focusing a Strategy• Select segments in the industry• Tailor strategy to serve those specific
groups• Determine which strategy a firm is
pursuing and its success• Evaluate the firm’s competitive
strategy over time

Copyright © 2000 by Harcourt, Inc. All rights reserved
SWOT Analysis
• Examination of a firm’s:
– Strengths
– Weaknesses
– Opportunities
– Threats

Copyright © 2000 by Harcourt, Inc. All rights reserved
SWOT Analysis
• Examination of a firm’s:
– Strengths
– Weaknesses
– Opportunities
– Threats
INTERNAL ANALYSIS

Copyright © 2000 by Harcourt, Inc. All rights reserved
SWOT Analysis
• Examination of a firm’s:
– Strengths
– Weaknesses
– Opportunities
– ThreatsEXTERNAL ANALYSIS
Copyright © 2000 by Harcourt, Inc. All rights reserved
Lynch’s Favorable Attributes
1. Firm’s product is not faddish2. Company has competitive advantage over
rivals3. Industry or product has potential for market
stability4. Firm can benefit from cost reductions5. Firm is buying back its own shares or
managers (insiders) are buying

Copyright © 2000 by Harcourt, Inc. All rights reserved
Lynch’s Categories of Companies
1. Slow growers2. Stalwart3. Fast growers4. Cyclicals5. Turnarounds6. Asset plays

Copyright © 2000 by Harcourt, Inc. All rights reserved
Approaches to the Valuation of Common Stock
Two general approaches have developed:1. Discounted cash-flow valuation
• Present value of some measure of cash flow, such as dividends, operating cash flow, and free cash flow
2. Relative valuation technique• Value estimated based on its price relative to
significant variables, such as earnings, cash flow, book value, or sales

Copyright © 2000 by Harcourt, Inc. All rights reserved
Approaches to the Valuation of Common Stock
These two approaches have some factors in common
• Both are affected by:– Investor’s required rate of return– kV– Estimated growth rate of the variable used– gV
Copyright © 2000 by Harcourt, Inc. All rights reserved
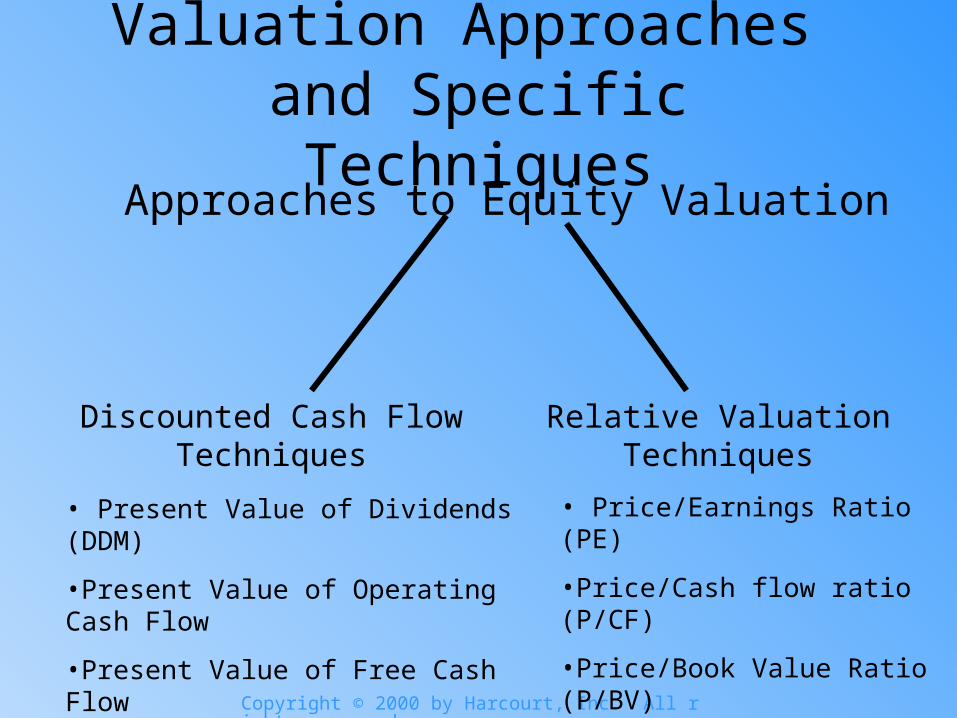
Valuation Approaches and Specific Techniques
Approaches to Equity Valuation
Discounted Cash Flow Techniques
Relative Valuation Techniques
• Present Value of Dividends (DDM)
•Present Value of Operating Cash Flow
•Present Value of Free Cash Flow
• Price/Earnings Ratio (PE)
•Price/Cash flow ratio (P/CF)
•Price/Book Value Ratio (P/BV)
•Price/Sales Ratio (P/S)

Copyright © 2000 by Harcourt, Inc. All rights reserved
Why and When to Use the Discounted Cash Flow Valuation Approach
• The measure of cash flow used– Dividends
• Cost of equity as the discount rate
– Operating cash flow• Weighted Average Cost of Capital (WACC)
– Free cash flow to equity• Cost of equity
• Dependent on growth rates and discount rate
Copyright © 2000 by Harcourt, Inc. All rights reserved
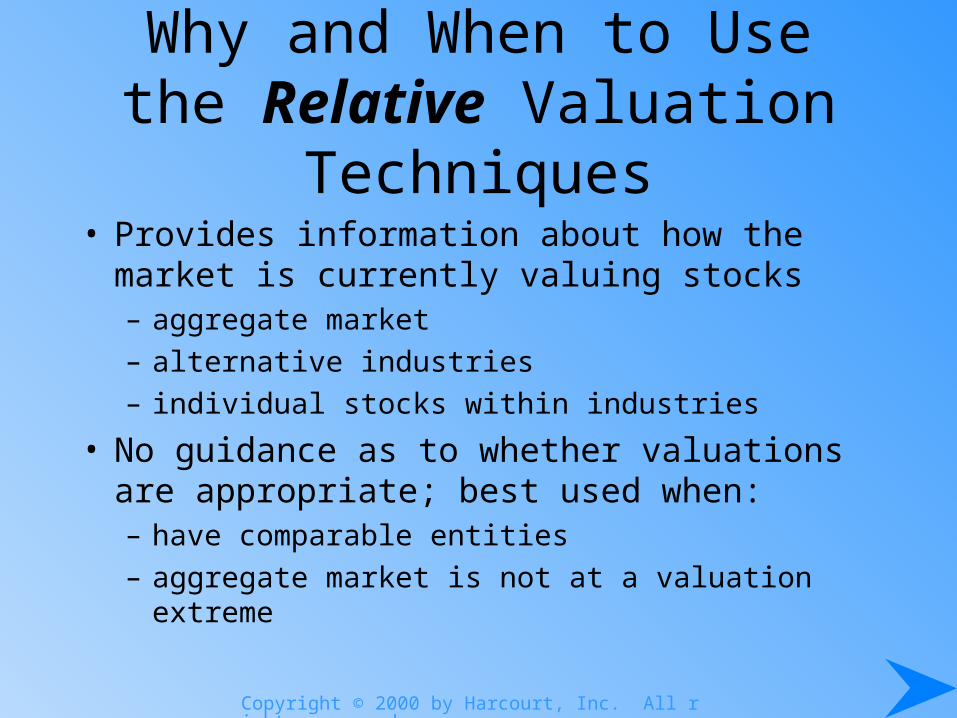
Why and When to Use the Relative Valuation Techniques
• Provides information about how the market is currently valuing stocks– aggregate market
– alternative industries
– individual stocks within industries
• No guidance as to whether valuations are appropriate; best used when:– have comparable entities
– aggregate market is not at a valuation extreme

Copyright © 2000 by Harcourt, Inc. All rights reserved
Discounted Cash-Flow Valuation Techniques
1 )1(tt
tj k
CFV
Where:
Vj = value of stock j
n = life of the asset
CFt = cash flow in period t
k = the discount rate that is equal to the investor’s required rate of return for asset j, which is determined by the uncertainty (risk) of the stock’s cash flows

Copyright © 2000 by Harcourt, Inc. All rights reserved
The Dividend Discount Model (DDM)
The value of a share of common stock is the present value of all future dividends
1
33
221
)1(
)1(...
)1()1()1(
tt
t
j
k
D
k
D
k
D
k
D
k
DV
Where:
Vj = value of common stock j
Dt = dividend during time period t
k = required rate of return on stock j

Copyright © 2000 by Harcourt, Inc. All rights reserved
The Dividend Discount Model (DDM)
If the stock is not held for an infinite period, a sale at the end of year 2 would imply:
2
2
221
)1()1()1( k
SP
k
D
k
DV j
j

Copyright © 2000 by Harcourt, Inc. All rights reserved
The Dividend Discount Model (DDM)
If the stock is not held for an infinite period, a sale at the end of year 2 would imply:
Selling price at the end of year two is the value of all remaining dividend payments, which is simply an extension of the original equation
2
2
221
)1()1()1( k
SP
k
D
k
DV j
j

Copyright © 2000 by Harcourt, Inc. All rights reserved
The Dividend Discount Model (DDM)
Stocks with no dividends are expected to start paying dividends at some point else they would not have any value!
Copyright © 2000 by Harcourt, Inc. All rights reserved
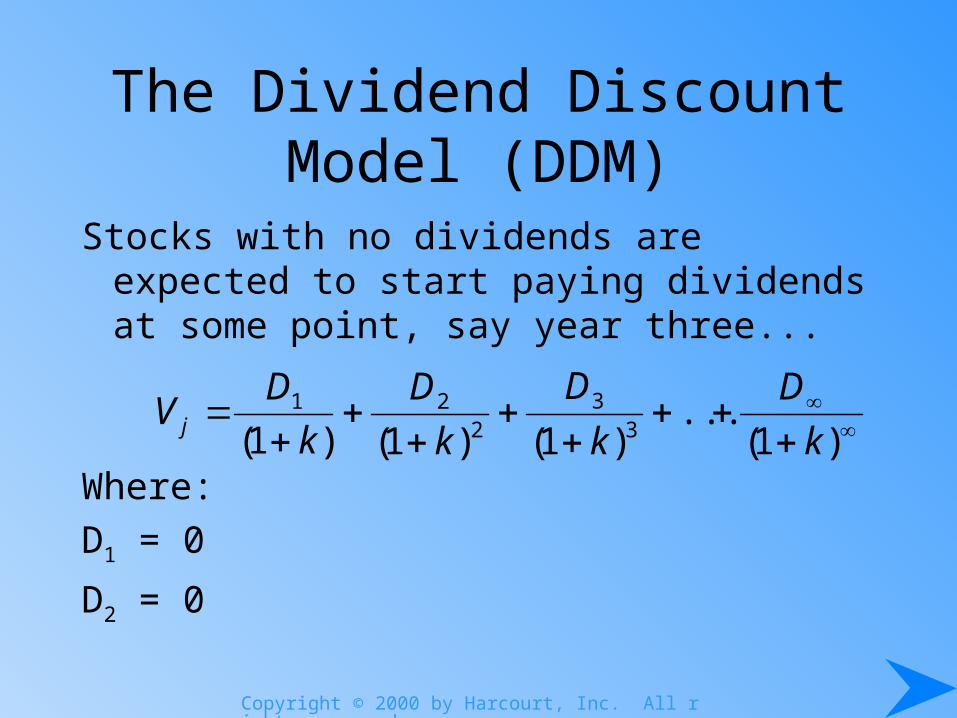
The Dividend Discount Model (DDM)
Stocks with no dividends are expected to start paying dividends at some point, say year three...
Where:
D1 = 0
D2 = 0
)1(...
)1()1()1( 33
221
k
D
k
D
k
D
k
DV j

Copyright © 2000 by Harcourt, Inc. All rights reserved
The Dividend Discount Model (DDM)
Infinite period model assumes a constant growth rate for estimating future dividends

Copyright © 2000 by Harcourt, Inc. All rights reserved
The Dividend Discount Model (DDM)
Infinite period model assumes a constant growth rate for estimating future dividends
Where:
Vj = value of stock j
D0 = dividend payment in the current period
g = the constant growth rate of dividends
k = required rate of return on stock j
n = the number of periods, which we assume to be infinite
n
n
j k
gD
k
gD
k
gDV
)1(
)1(...
)1(
)1(
)1(
)1( 02
200

Copyright © 2000 by Harcourt, Inc. All rights reserved
The Dividend Discount Model (DDM)
Infinite period model assumes a constant growth rate for estimating future dividends
This can be reduced to:
1. Estimate the required rate of return (k)
2. Estimate the dividend growth rate (g)
n
n
j k
gD
k
gD
k
gDV
)1(
)1(...
)1(
)1(
)1(
)1( 02
200
gk
DV j
1

Copyright © 2000 by Harcourt, Inc. All rights reserved
Infinite Period DDM and Growth Companies
Assumptions of DDM:
1. Dividends grow at a constant rate
2. The constant growth rate will continue for an infinite period
3. The required rate of return (k) is greater than the infinite growth rate (g)

Copyright © 2000 by Harcourt, Inc. All rights reserved
Infinite Period DDM and Growth Companies
Growth companies have opportunities to earn return on investments greater than their required rates of return
To exploit these opportunities, these firms generally retain a high percentage of earnings for reinvestment, and their earnings grow faster than those of a typical firm
This is inconsistent with the infinite period DDM assumptions

Copyright © 2000 by Harcourt, Inc. All rights reserved
Infinite Period DDM and Growth Companies
The infinite period DDM assumes constant growth for an infinite period, but abnormally high growth usually cannot be maintained indefinitely
Risk and growth are not necessarily related
Temporary conditions of high growth cannot be valued using the CGR-DDM

Copyright © 2000 by Harcourt, Inc. All rights reserved
Valuation with Temporary Supernormal Growth
Combine the models to evaluate the years of supernormal growth and then use DDM to compute the remaining years at a sustainable rate

Copyright © 2000 by Harcourt, Inc. All rights reserved
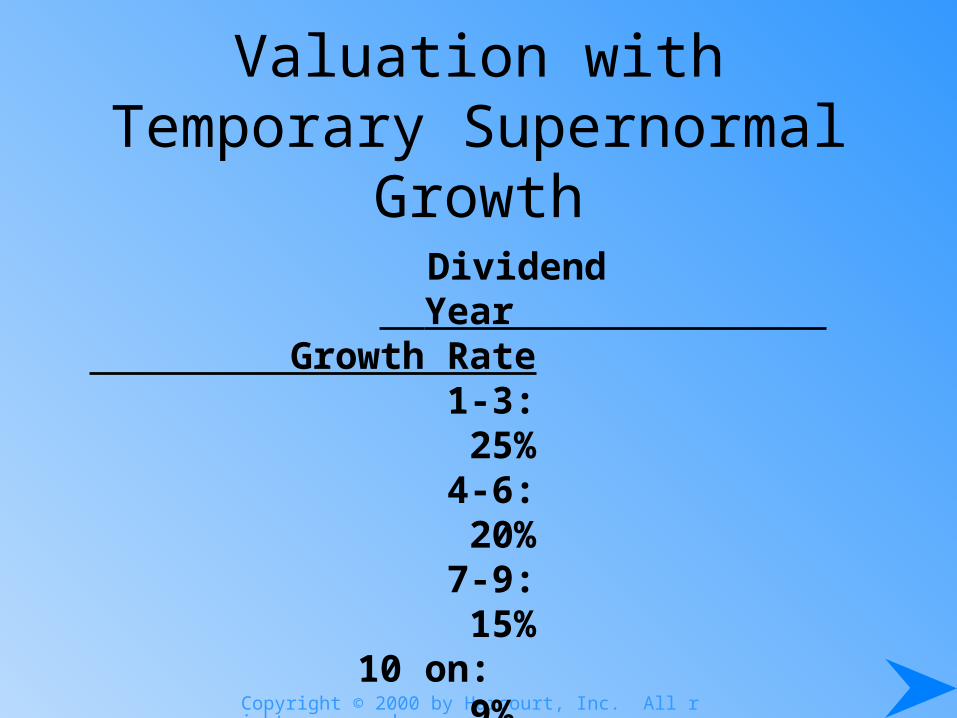
Valuation with Temporary Supernormal Growth
Combine the models to evaluate the years of supernormal growth and then use DDM to compute the remaining years at a sustainable rate
For example:With a 14 percent required rate of return, a most recently paid dividend of $2.00 per share, and dividend growth of:
Copyright © 2000 by Harcourt, Inc. All rights reserved
Valuation with Temporary Supernormal Growth
Dividend Year Growth Rate 1-3: 25% 4-6: 20% 7-9: 15% 10 on: 9%

Copyright © 2000 by Harcourt, Inc. All rights reserved
Valuation with Temporary Supernormal Growth
The value equation becomes
9
333
9
333
8
233
7
33
6
33
5
23
4
3
3
3
2
2
)14.1(
)09.14(.
)09.1()15.1()20.1()25.1(00.2
14.1
)15.1()20.1()25.1(00.2
14.1
)15.1()20.1()25.1(00.2
14.1
)15.1()20.1()25.1(00.2
14.1
)20.1()25.1(00.2
14.1
)20.1()25.1(00.2
14.1
)20.1()25.1(00.2
14.1
)25.1(00.2
14.1
)25.1(00.2
14.1
)25.1(00.2
iV

Copyright © 2000 by Harcourt, Inc. All rights reserved
Computation of Value for Stock of Company with Temporary Supernormal Growth
Discount Present Growth
Year Dividend Factor Value Rate
1 2.50$ 0.8772 2.193$ 25%2 3.13 0.7695 2.408$ 25%3 3.91 0.6750 2.639$ 25%4 4.69 0.5921 2.777$ 20%5 5.63 0.5194 2.924$ 20%6 6.76 0.4556 3.080$ 20%7 7.77 0.3996 3.105$ 15%8 8.94 0.3506 3.134$ 15%9 10.28 0.3075 3.161$ 15%
10 11.21 9%
224.20$ a 0.3075 b 68.943$
94.365$
aValue of dividend stream for year 10 and all future dividends, that is$11.21/(0.14 - 0.09) = $224.20bThe discount factor is the ninth-year factor because the valuation of theremaining stream is made at the end of Year 9 to reflect the dividend inYear 10 and all future dividends.

Copyright © 2000 by Harcourt, Inc. All rights reserved
Present Value of Operating Cash Flows
• 2nd DCF method
Derive the value of the total firm by discounting the total operating cash flows prior to the payment of interest to the debt-holders
Then subtract the value of debt to arrive at an estimate of the value of the equity

Copyright © 2000 by Harcourt, Inc. All rights reserved
Present Value of Operating Cash Flows
n
tt
j
tj WACC
OCFV
1 )1(Where:
Vj = value of firm j
n = number of periods; assumed to be infinite
OCFt = the firms operating cash flow in period t
WACC = firm j’s weighted average cost of capital
(OCF and WACC to be discussed in Chapter 20)
Copyright © 2000 by Harcourt, Inc. All rights reserved
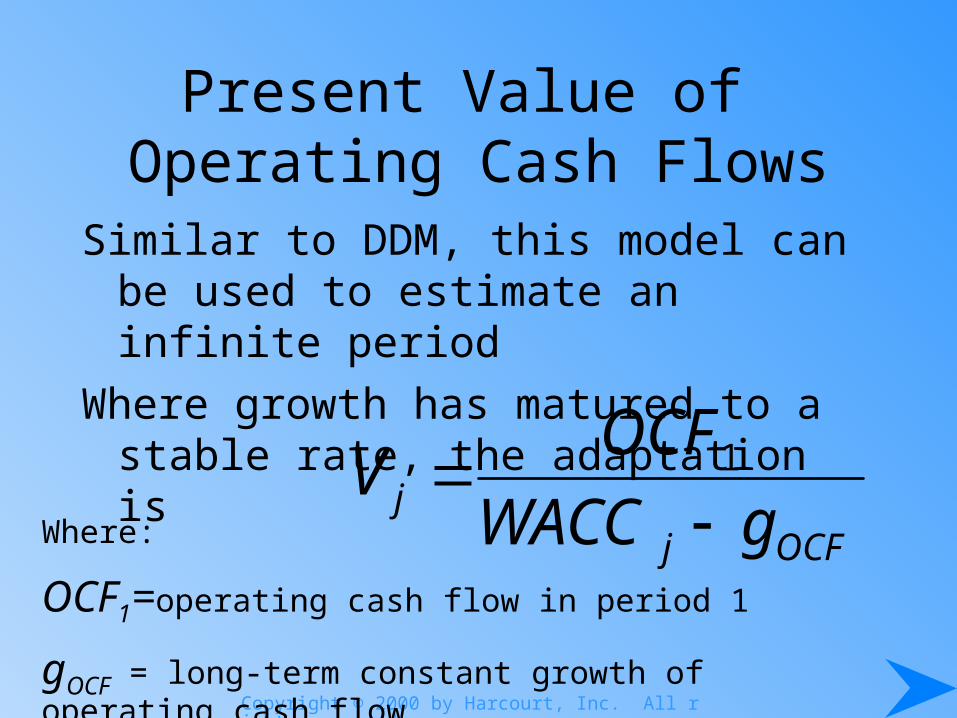
Present Value of Operating Cash Flows
Similar to DDM, this model can be used to estimate an infinite period
Where growth has matured to a stable rate, the adaptation is
OCFjj gWACC
OCFV
1
Where:
OCF1=operating cash flow in period 1
gOCF = long-term constant growth of operating cash flow
Copyright © 2000 by Harcourt, Inc. All rights reserved
Present Value of Operating Cash Flows
• Assuming several different rates of growth for OCF, these estimates can be divided into stages as with the supernormal dividend growth model
• Estimate the rate of growth and the duration of growth for each period
• This will be demonstrated later

Copyright © 2000 by Harcourt, Inc. All rights reserved
Present Value of Free Cash Flows to Equity
• 3rd DCF method
• “Free” cash flows to equity are derived after operating cash flows have been adjusted for debt payments (interest and principle)
• The discount rate used is the firm’s cost of equity (k) rather than WACC

Copyright © 2000 by Harcourt, Inc. All rights reserved
• Volume• Pricing • Expenses• Leases • Tax Provision• Deferred Taxes• Tax Shield
Sales
OperatingMargin
CashTaxes
Free Cash Flow
Cash availablefor distribution toall claimholders
CashEarnings
Investment
minus
Free cash flow to equity defined
WorkingCapital
CapitalExpenditures
Acquisitions/Divestitures
• A/R• Inventories• A/P
• Net PP&E•Operating Leases
Follow the Cash

Copyright © 2000 by Harcourt, Inc. All rights reserved
Present Value of Free Cash Flows to Equity
Where:
Vj = Value of the stock of firm j
n = number of periods assumed to be infinite
FCFt = the firm’s free cash flow in period t
1 )1(tt
j
tj k
FCFV
Copyright © 2000 by Harcourt, Inc. All rights reserved
Relative Valuation Techniques
• Value can be determined by comparing to similar stocks based on relative ratios
• Relevant variables include earnings, cash flow, book value, and sales
• Multiply this variable by some “capitalization factor”
• The most popular relative valuation technique is based on price to earnings (the P/E approach)

Copyright © 2000 by Harcourt, Inc. All rights reserved
Earnings Multiplier Model
• This values the stock based on expected annual earnings
• The price earnings (P/E) ratio, or
Earnings Multiplier
EarningsMonth -Twelve Expected
PriceMarket Current
Copyright © 2000 by Harcourt, Inc. All rights reserved
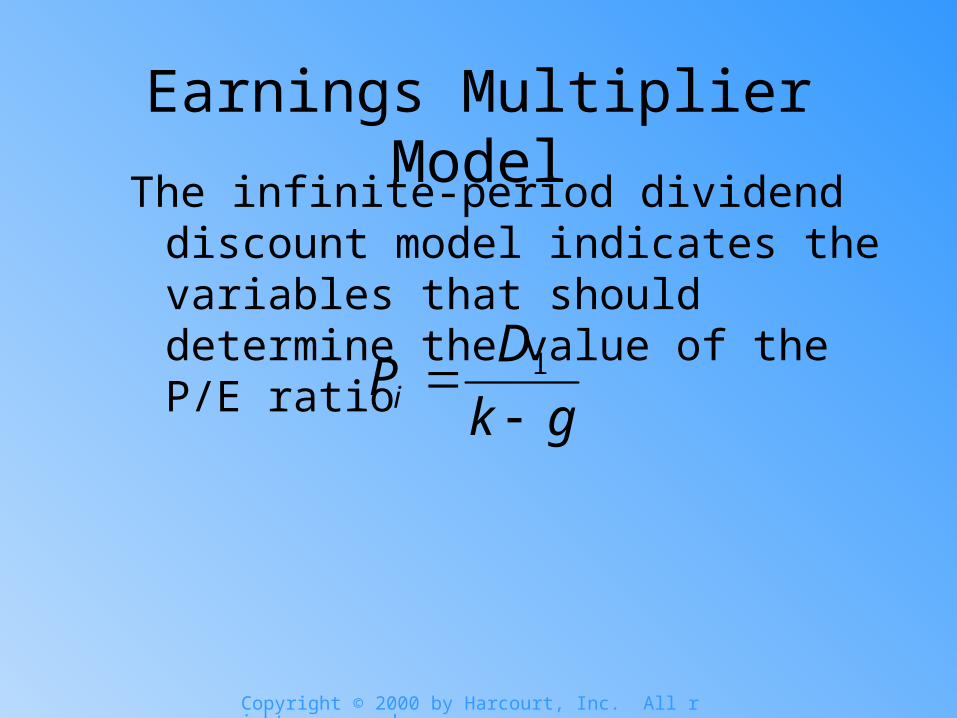
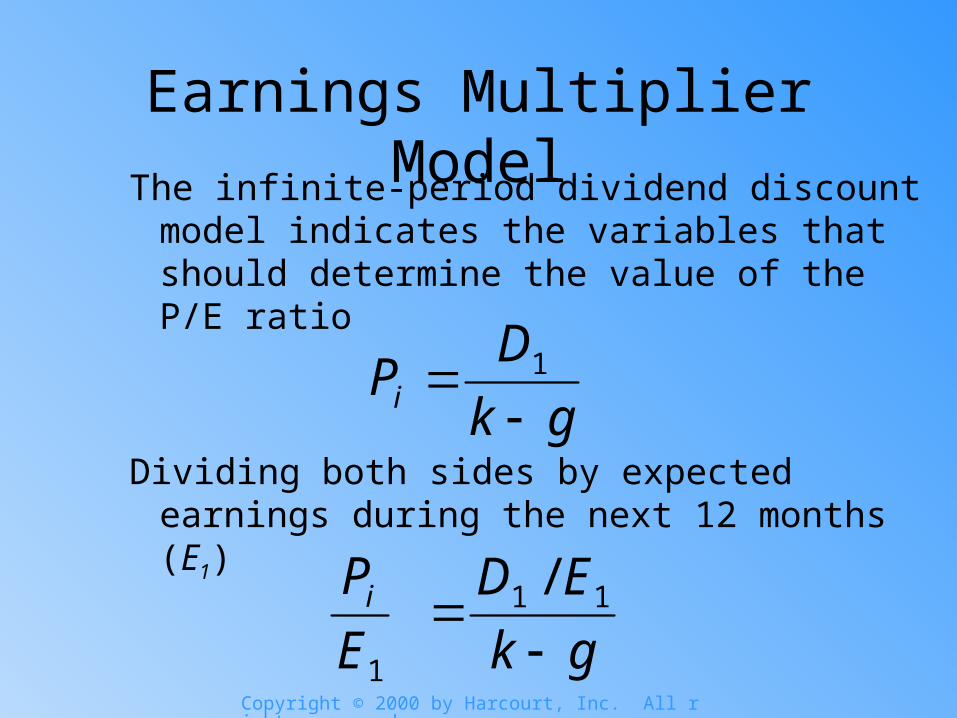
Earnings Multiplier ModelThe infinite-period dividend discount model
indicates the variables that should determine the value of the P/E ratio
gk
DPi
1
Copyright © 2000 by Harcourt, Inc. All rights reserved
Earnings Multiplier ModelThe infinite-period dividend discount model
indicates the variables that should determine the value of the P/E ratio
Dividing both sides by expected earnings during the next 12 months (E1)
gk
DPi
1
gk
ED
E
Pi
11
1
/

Copyright © 2000 by Harcourt, Inc. All rights reserved
Earnings Multiplier Model
Thus, the P/E ratio is determined by– 1. Expected dividend payout ratio– 2. Required rate of return on the stock (k)– 3. Expected growth rate of dividends (g)
gk
ED
E
Pi
11
1
/

Copyright © 2000 by Harcourt, Inc. All rights reserved
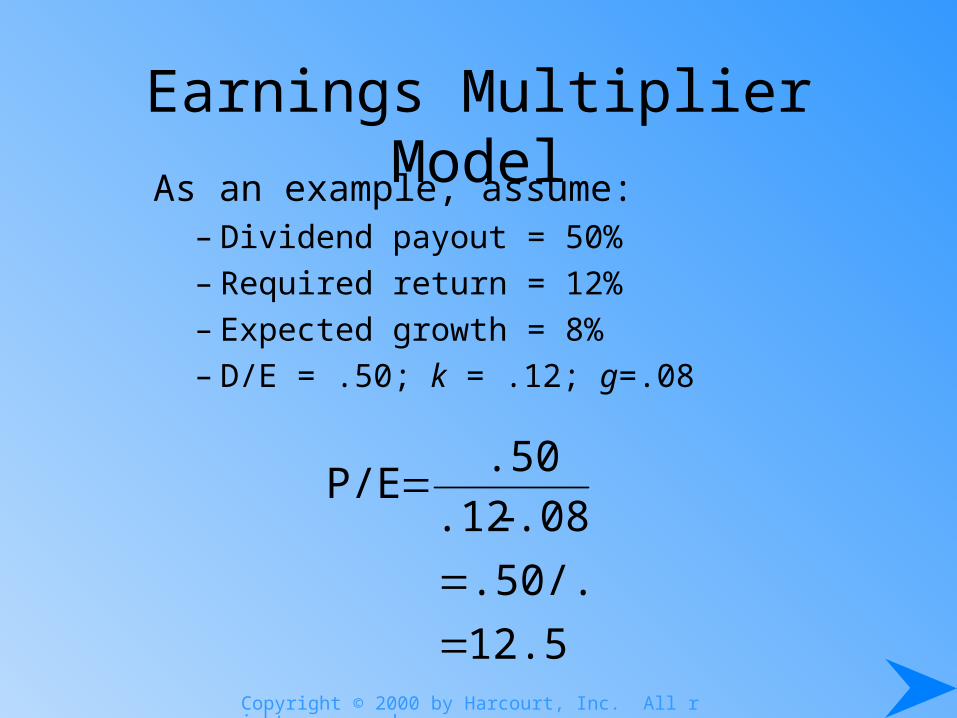
Earnings Multiplier ModelAs an example, assume:
– Dividend payout = 50%
– Required return = 12%
– Expected growth = 8%
– D/E = .50; k = .12; g=.08
Copyright © 2000 by Harcourt, Inc. All rights reserved
Earnings Multiplier ModelAs an example, assume:
– Dividend payout = 50%
– Required return = 12%
– Expected growth = 8%
– D/E = .50; k = .12; g=.08
12.5
.50/.04
.08-.12
.50P/E

Copyright © 2000 by Harcourt, Inc. All rights reserved
Earnings Multiplier Model
A small change in either or both k or g can have a large impact on the multiplier
gk
ED
E
Pi
11
1
/

Copyright © 2000 by Harcourt, Inc. All rights reserved
Earnings Multiplier Model
A small change in either or both k or g can have a large impact on the multiplier
D/E = .50; k=.13; g=.08
gk
ED
E
Pi
11
1
/

Copyright © 2000 by Harcourt, Inc. All rights reserved
Earnings Multiplier Model
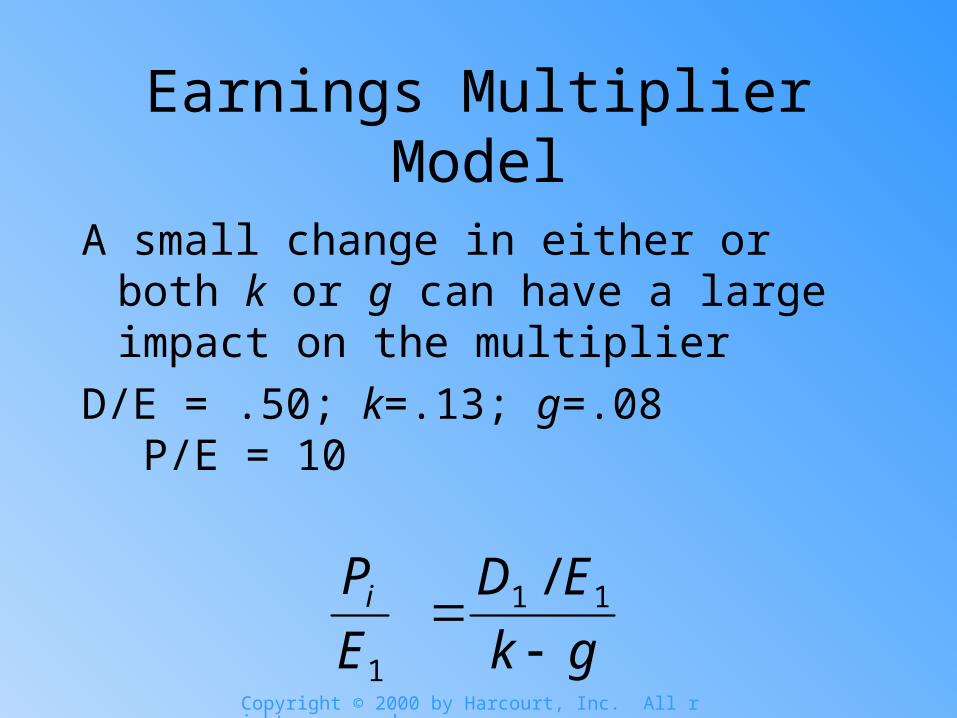
A small change in either or both k or g can have a large impact on the multiplier
D/E = .50; k=.13; g=.08
P/E = .50/(.13-/.08) = .50/.05 = 10
gk
ED
E
Pi
11
1
/
Copyright © 2000 by Harcourt, Inc. All rights reserved
Earnings Multiplier Model
A small change in either or both k or g can have a large impact on the multiplier
D/E = .50; k=.13; g=.08 P/E = 10
gk
ED
E
Pi
11
1
/

Copyright © 2000 by Harcourt, Inc. All rights reserved
Earnings Multiplier Model
A small change in either or both k or g can have a large impact on the multiplier
D/E = .50; k=.13; g=.08 P/E = 10
D/E = .50; k=.12; g=.09 P/E = 16.7
D/E = .50; k=.11; g=.09 P/E = 25
gk
ED
E
Pi
11
1
/
Copyright © 2000 by Harcourt, Inc. All rights reserved
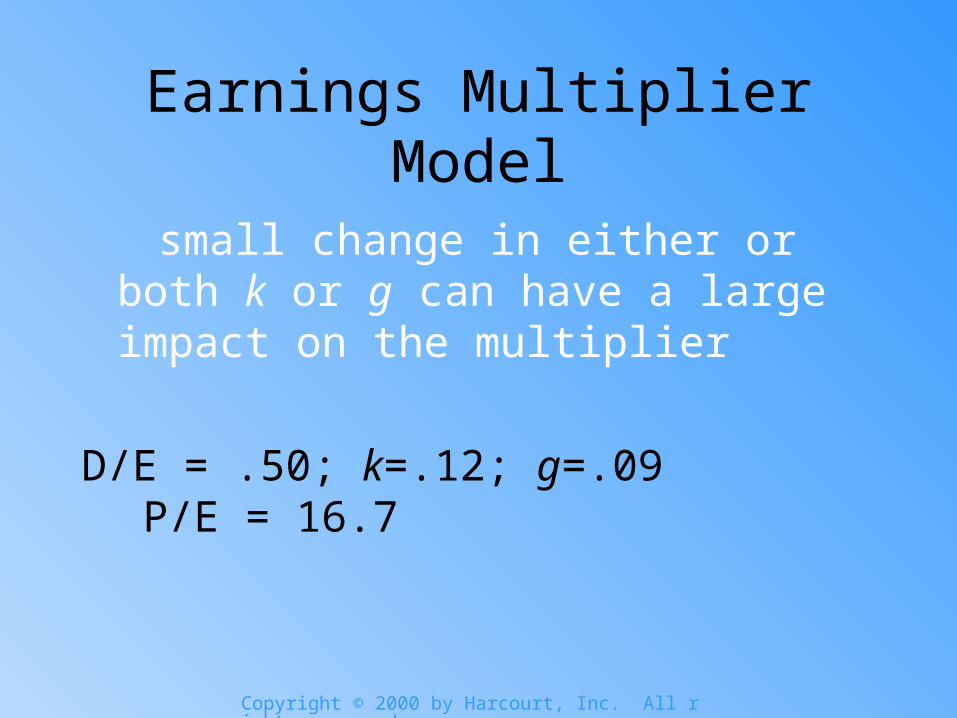
Earnings Multiplier Model
small change in either or both k or g can have a large impact on the multiplier
D/E = .50; k=.12; g=.09 P/E = 16.7

Copyright © 2000 by Harcourt, Inc. All rights reserved
Valuation Using theEarnings Multiplier Model
Given current earnings of $2.00 and growth of 9%
You would expect E1 to be $2.18
D/E = .50; k=.12; g=.09 P/E = 16.7

Copyright © 2000 by Harcourt, Inc. All rights reserved
Valuation Using theEarnings Multiplier Model
Given current earnings of $2.00 and growth of 9%
You would expect E1 to be $2.18
D/E = .50; k=.12; g=.09 P/E = 16.7
V = 16.7 x $2.18 = $36.41
Compare this estimated value to market price to decide if you should invest in it

Copyright © 2000 by Harcourt, Inc. All rights reserved
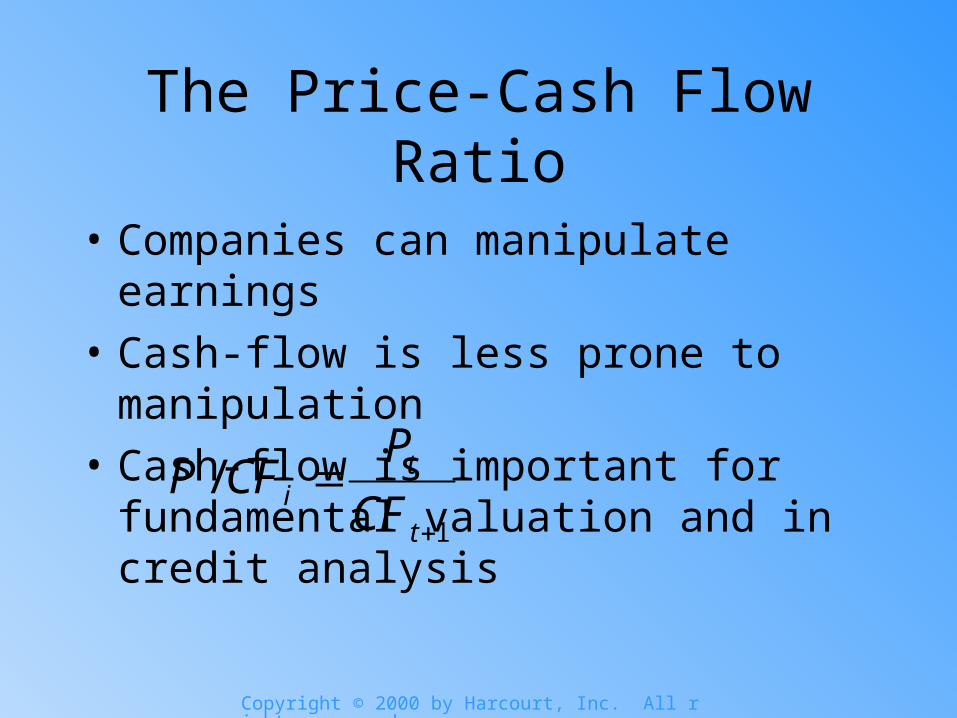
The Price-Cash Flow Ratio
• 2nd relative valuation approach
• Companies can manipulate earnings
• Cash-flow is less prone to manipulation
• Cash-flow is important for fundamental valuation and in credit analysis
Copyright © 2000 by Harcourt, Inc. All rights reserved
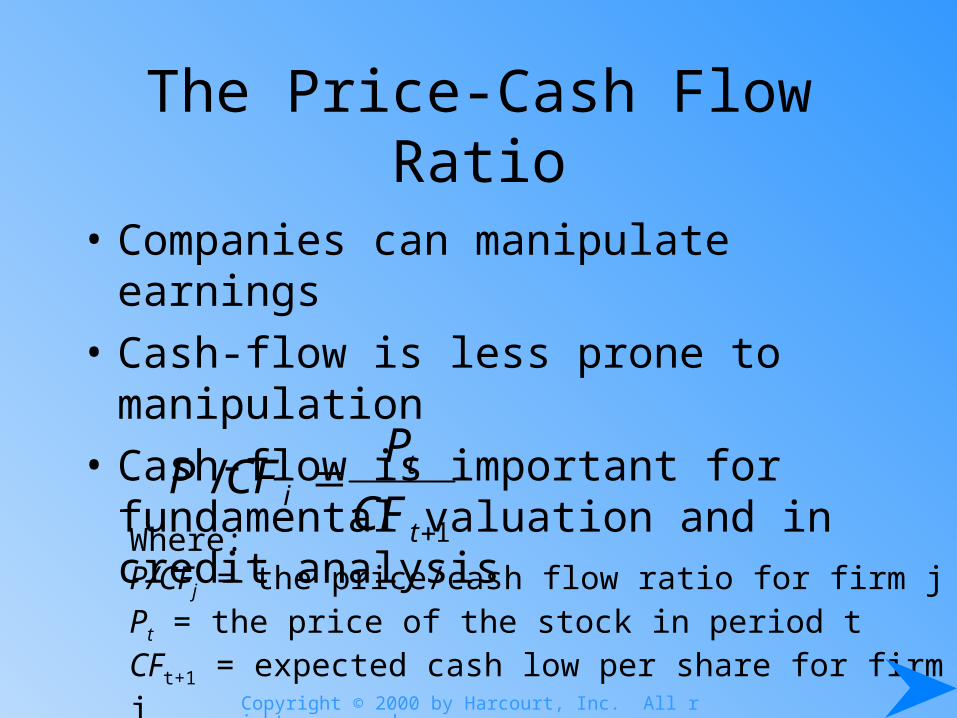
The Price-Cash Flow Ratio
• Companies can manipulate earnings
• Cash-flow is less prone to manipulation
• Cash-flow is important for fundamental valuation and in credit analysis
1
/
t
ti CF
PCFP
Copyright © 2000 by Harcourt, Inc. All rights reserved
The Price-Cash Flow Ratio
• Companies can manipulate earnings
• Cash-flow is less prone to manipulation
• Cash-flow is important for fundamental valuation and in credit analysis
1
/
t
ti CF
PCFP
Where:P/CFj = the price/cash flow ratio for firm jPt = the price of the stock in period tCFt+1 = expected cash low per share for firm j

Copyright © 2000 by Harcourt, Inc. All rights reserved
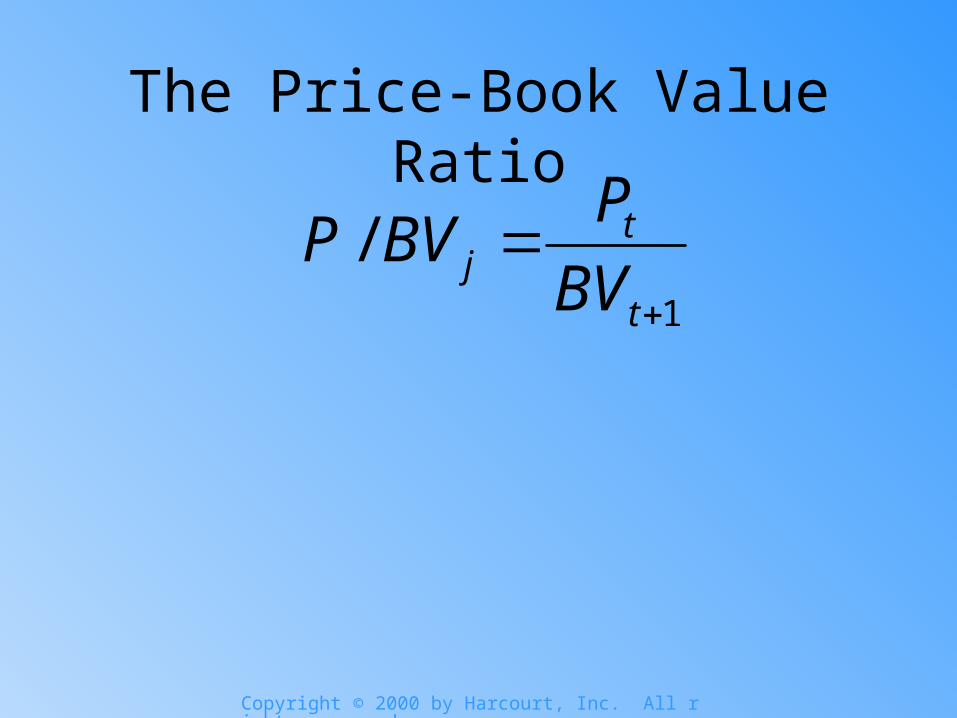
The Price-Book Value Ratio
• 3rd relative valuation approach
Widely used to measure bank values (most bank assets are liquid (bonds and commercial loans)
Fama and French study indicated inverse relationship between P/BV ratios and excess return for a cross section of stocks
Copyright © 2000 by Harcourt, Inc. All rights reserved
The Price-Book Value Ratio
1
/
t
tj BV
PBVP
Copyright © 2000 by Harcourt, Inc. All rights reserved
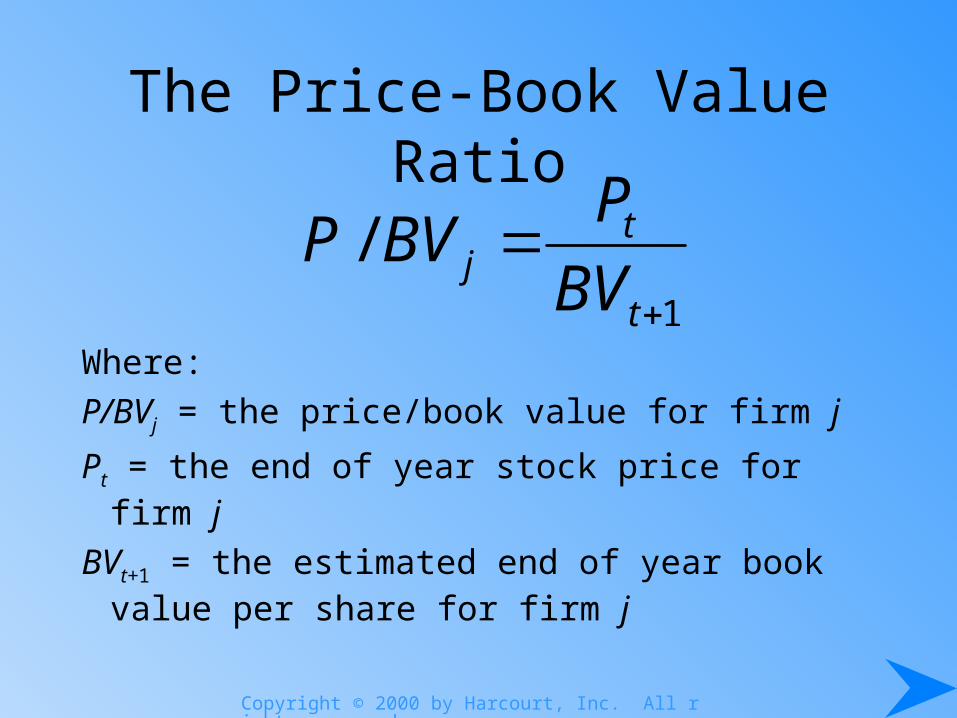
The Price-Book Value Ratio
Where:
P/BVj = the price/book value for firm j
Pt = the end of year stock price for firm j
BVt+1 = the estimated end of year book value per share for firm j
1
/
t
tj BV
PBVP

Copyright © 2000 by Harcourt, Inc. All rights reserved
The Price-Book Value Ratio
• Be sure to match the price with either a recent book value number, or estimate the book value for the subsequent year
• Can derive an estimate based upon historical growth rate for the series or use the growth rate implied by the (ROE) X (Ret. Rate) analysis

Copyright © 2000 by Harcourt, Inc. All rights reserved
The Price-Sales Ratio
• 4th relative valuation approach
• Strong, consistent growth rate is a requirement of a growth company
• Sales is less subject to manipulation than other financial data
• Popularized by Ken Fisher
Copyright © 2000 by Harcourt, Inc. All rights reserved
The Price-Sales Ratio
1
t
t
S
P
S
P

Copyright © 2000 by Harcourt, Inc. All rights reserved
The Price-Sales Ratio
Where: 1
t
t
S
P
S
P
tjS
jP
jS
P
t
t
j
j
Year during firmfor shareper sales annual
firmfor pricestock year of end
firmfor ratio sales toprice
1

Copyright © 2000 by Harcourt, Inc. All rights reserved
The Price-Sales RatioMatch the stock price with recent annual
sales, or future sales per share
This ratio varies dramatically by industry
Profit margins also vary by industry
Relative comparisons using P/S ratio should be between firms in similar industries
Copyright © 2000 by Harcourt, Inc. All rights reserved
Estimating the Inputs: The Required Rate of Return and The Expected Growth Rate of
Valuation Variables
Valuation procedure is the same for securities around the world, but the required rate of return (k) and expected growth rate of earnings and other valuation variables (g) such as book value, cash flow, and dividends differ among countries

Copyright © 2000 by Harcourt, Inc. All rights reserved
Required Rate of Return (k)
• Required rate of return on equity (ke) affects valuation, regardless of approach:– kV , and vice versa
• This required rate of return will be used as the discount rate and also affects relative-valuation
• Although ke is not directly used in the present value of operating cash flow approach, it is nonetheless a component of WACC

Copyright © 2000 by Harcourt, Inc. All rights reserved
Required Rate of Return (k)
• But, what is the proper approach for deriving ke?– CAPM?– APT?– Haugen’s ad hoc expected return factor model?
• Still an open question– CAPM most widely used in practice– Even then, questions can remain in terms of
how to apply the model
Copyright © 2000 by Harcourt, Inc. All rights reserved
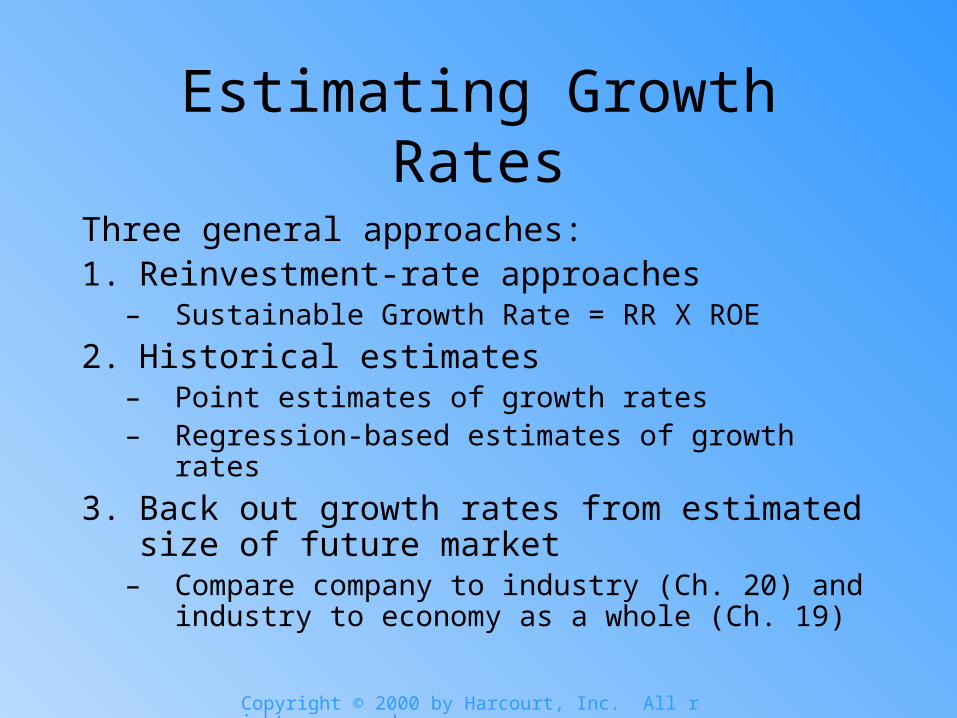
Estimating Growth Rates
Three general approaches:1. Reinvestment-rate approaches
– Sustainable Growth Rate = RR X ROE
2. Historical estimates– Point estimates of growth rates– Regression-based estimates of growth rates
3. Back out growth rates from estimated size of future market
– Compare company to industry (Ch. 20) and industry to economy as a whole (Ch. 19)
Copyright © 2000 by Harcourt, Inc. All rights reserved
Expected Growth Rate of Dividends• Determined by
– the growth of earnings– the proportion of earnings paid in dividends
• In the short run, dividends can grow at a different rate than earnings due to changes in the payout ratio
• Earnings growth is also affected by compounding of earnings retention
g = (Retention Rate) x (Return on Equity)
= RR x ROE

Copyright © 2000 by Harcourt, Inc. All rights reserved
DuPont Breakdown of ROE
EquityCommon
Assets Total
Assets Total
Sales
Sales
IncomeNet
ROE
Profit Total Asset Financial
Margin Turnover Leverage= xx

Copyright © 2000 by Harcourt, Inc. All rights reserved
Estimating Growth Based on History• Alternative to reinvestment rate approach
• Historical growth rates of sales, earnings, cash flow, and dividends
• Two general techniques1. arithmetic or geometric average of annual
percentage changes (point estimates)
2. linear or log-linear regression models
• Both use time-series plot of data

Copyright © 2000 by Harcourt, Inc. All rights reserved
Checking Your Figures:Three Alternative Measures of Value
(cf., Value Investing)1. Value of Company’s Assets
– Graham & Dodd net-net approach– Book Value of Assets – P/BV for valuation– Market value / replacement value of assets
2. Earnings Power Value– Value company’s current earnings, adjusted for seasonality /
cyclicality – DCF value assuming growth = 0 or = long-run growth in economy
– Greater than value of company’s underlying assets iff company holds competitive advantage or benefits from barriers to entry
– Understanding value requires knowledge of industry

Copyright © 2000 by Harcourt, Inc. All rights reserved
Checking Your Figures:Three Alternative Measures of Value
(cf., Value Investing)
3. What is Growth Worth?– Adds value only if growth occurs “within the franchise”
• Potential problem - firm retains earnings, but reinvestment returns are below the firm’s cost of capital (i.e., project NPV is negative)
• Taking on more projects means that sales and earnings will grow, but not by enough to cover additional costs of capital, so growth will actually destroy value held by current shareholders
• Key lesson = not all growth is “value-adding”
• Only projects with positive NPV’s will create value, and projects will only have positive NPV if they exploit or occur within the firm’s realm of competitive advantage, i.e., within the firm’s franchise

Copyright © 2000 by Harcourt, Inc. All rights reserved
Analysis of Growth Companies
• Generating rates of return greater than the firm’s cost of capital is considered to be temporary
• Earnings higher than the required rate of return are pure profits
• How long cancan they earn these excess profits?• How long are they likely toare they likely to earn these excess
profits?• How long does the market expect them todoes the market expect them to earn these
excess profits?• Is the stock properly valued?

Copyright © 2000 by Harcourt, Inc. All rights reserved
Measures of Value-Added• The Franchise Factor
– Breaks P/E into two components• P/E based on ongoing business (base P/E)
• Franchise P/E the market assigns to the expected value of new and profitable business opportunities
Franchise P/E = Observed P/E - Base P/EIncremental Franchise P/E = Franchise Factor X Growth Factor
Grk
kR

Copyright © 2000 by Harcourt, Inc. All rights reserved
Growth Duration
• Evaluate the high P/E ratio by relating P/E ratio to the firm’s rate and duration of growth
• P/E is function of – expected rate of growth of earnings per share– stock’s required rate of return– firm’s dividend-payout ratio
• Use the ratio of P/E’s, related to growth and dividend rates, to infer the market’s implied growth duration:

Copyright © 2000 by Harcourt, Inc. All rights reserved
Intra-Industry Analysis• Directly compare two firms in the same industry• An alternative use of T to determine a reasonable
P/E ratio• Factors to consider
– A major difference in the risk involved– Inaccurate growth estimates– Stock with a low P/E relative to its growth rate
is undervalued– Stock with high P/E and a low growth rate is
overvalued

Copyright © 2000 by Harcourt, Inc. All rights reserved
Growth Duration
T
BB
Tgg
BB
gg
)DG(1
)DG(1
(0)E/0P
(0)(0)/EP
BB
gg
BB
gg
DG1
DG1 ln
(0)E/0P
(0)(0)/EPln T
DG1
DG1 ln
P/E
P/Eln
BB
gg
B
g
T

Copyright © 2000 by Harcourt, Inc. All rights reserved
Growth Duration
T
BB
ggBg DG1
DG1P/E P/E
Alternatively, the equation can be rearranged to determine a justified P/E ratio for a firm, given its expected dividend yield and growth rate and the expected length of time over which the firm will continue to experience above-average growth, relative to its benchmark (B).

Copyright © 2000 by Harcourt, Inc. All rights reserved
Extensions on Growth Duration
• For more information and additional extensions and applications in using market-based information to infer the market’s assumptions about the various factors that drive a stock’s valuation, see:– www.expectationsinvesting.com

Copyright © 2000 by Harcourt, Inc. All rights reserved
When to Sell• Knowing when to sell is an even harder decision than
knowing when to buy– Holding a stock too long may lead to lower returns than
expected
– If stocks decline right after purchase, is that a further buying opportunity or an indication of incorrect analysis?
– Continuously monitor key assumptions
– Evaluate closely when market value approaches estimated intrinsic value
– Know why you bought it and watch for that to change
– Always need a “sell discipline”

Copyright © 2000 by Harcourt, Inc. All rights reserved
Efficient Markets• Opportunities are mostly among less well-known
companies• To outperform the market you must find disparities
between stock values and market prices - and you must be correct
• Concentrate on identifying what is wrong with the market consensus and what earning surprises may exist– Again, useful to examine the expectations that underlie the
current market price
– Are these realistic/optimistic/pessimistic?

Copyright © 2000 by Harcourt, Inc. All rights reserved
Next Up:Final Topics
• Bond Portfolio Management
• Are the Markets Rational?

Copyright © 2000 by Harcourt, Inc. All rights reserved