Embed Size (px)
Citation preview


i
Securing Water and Land in the Tana Basin: a resource book for water managers and practitioners

The contents of this report do not necessarily reflect the views or policies of UNEP or contributory organizations. The designations employed and the presentations do not imply the expression of any opinion whatsoever on the part of UNEP or contributory organizations concerning the legal status of any country, territory, city, company or area or its authority or concerning the delimitation of its frontiers or boundaries.
ii
I Acknowledgements
The main authors of this publication are Lenneke Knoop, Francesco Sambalino and Frank van
Steenbergen.
Special acknowledgements are made to: Eline Boelee, Thomas Chiramba, Elizabeth Khaka, Tim
Jones, Peter Manyara and Bancy Mati.
Significant contributions were made by: Abraham Abhishek (MetaMeta), Abraham Mehari Haile
(UNESCO-IHE), Albert Tuinhof (Acacia Water), Alejandro Jiménez (Wetlands International), Alex
Oduor (ICRAF), Bosco Kilonzo (WRMA), Catherine Yaa (Kenya Wetlands Forum / East African
Wildlife Society), Dick Bouman (Aqua for All), Eliud K. Mwangi (WRMA), Emma Greatix (Wetlands
International), Erik Nissen-Petersen (ASAL), Francis Gachuga (WRMA), Godert van Lynden (ISRIC),
Henk Holtslag (Connect International), Jacinta Waigwa (WRMA), Lakew Desta, Linda Navis
(MetaMeta), Maimbo Malesu (ICRAF). Mathias Gurtner (GIZ), Meshack Nyabenge (ICRAF), Oliver
Nasirwa (Wetlands International), Patrick Gatumu (WRMA), Paul Matiku (Nature Kenya), Peter
Muthigani (Cactus Analysis and Management Services), Robinson Kimari (WRMA), Silas Mogoi
(UNEP), Stephen Foster, Zachary Engelking (Drylands Natural Resources Center).
isbn: 978-90-79658-06-0
Knoop L., Sambalino F. , and F. Van Steenbergen. 2012. Securing Water and Land in the Tana Basin:
a resource book for water managers and practitioners. Wageningen, The Netherlands: 3R Water
Secretariat.
WAHARAWATER HARVESTING FOR RAINFED AFRICA

1
II Foreword WRMA
For many years the need for integrated river basin development and ecosystem management has
been discussed and considerable effort has gone into setting up the prerequisite laws, institutions
and technical capacity in Kenya and elsewhere. All these efforts are now gradually coming to
fruition, as the recently formed river basin-based agencies undertake activities aimed at improving
water resources management. The Tana Basin – source of Kenya’s largest river – is an example of the
challenges: water availability per capita has decreased to 520 m³/capita per year – firmly classifying
the catchment as water scarce. At the same time there are plans abound to further develop both
irrigation and hydropower potential in the Tana. Sedimentation and land management are major
challenges: at low flows of 0.10 m³/s sediment loads are 2-5 mg/l, this increases drastically to
sediment loads 100 mg/l at discharges of 100 m³/s.
The Water Resource Management Authority (WRMA), through its Tana Regional Office has since its
establishment in 2005 under the Water Act 2002 been working to put water resources management
‘on the ground’ – among others by issuing and enforcing water use permits and charges. WRMA is
also supporting the development of Water Resource Users Associations (WRUAs) at sub-catchment
level. The WRUAs develop and plan improvements in water resources management in their area
of jurisdiction – identifying investments and also overseeing the regulation of water abstraction.
By the time of development of this manual, the Tana Catchment consisted of about 241 sub-
catchments. As we write 56 Water Resources Users Associations are in place and have developed
Sub-Catchment Management Plans, while half of them are implementing their plans through
funding from different sources.
These efforts are done so as to put integrated river basin management in practice – and not only at
high policy level but also more importantly down-to-earth in the different sub-catchments through
thousands of local appropriate measures. It is my belief that basin management needs to happen
everywhere in the basin through the WRUAs to have a chance of success.
We hope to take this work further and welcome this manual as part of it. The manual describes
the Tana Catchment Area and zooms in on what can practically be done in the different parts of
the basin to secure land and water. There is a large range of measures that can be introduced in
different parts of the Basin – bench terraces and tied ridges in the Upper Catchment; retention
through sand dams and subsurface dams in the Middle Catchment; flood water management in
the Lower Tana; improved agroforestry throughout the area. What is obvious is that much remains
to be done – in out scaling successful experiences and introducing new techniques to better secure
ecosystems and make use of water buffers. This book can be seen as ongoing work and will be
updated frequently. We are privileged to work on such an exciting challenge.
We express our gratitude to those that facilitated the preparation of the manual – first and foremost
UNEP. Tana Catchment is not only one of the largest basin in Kenya but also its different physio-
graphical zones are a good representative of catchment areas in other parts of Kenya. We therefore
hope that the manual brings forth inspiring practical ideas to offer for other catchment areas in
Kenya and the world at large.
Boniface Mwaniki
Regional Manager
Securing Water and Land in the Tana Basin: a resource book for water managers and practitioners
2
I Acknowledgements
II Foreword WRMA
1 Introduction: Managing ecosystems, transforming landscapes, creating buffers
2 Understanding the Tana Basin
2.1 The Tana Basin
2.2 Main challenges in the Tana Catchment
2.2.1 Upper Tana Basin
2.2.2 Middle Tana Basin
2.2.3 Lower Tana Basin
3 Knowing what to do where
3.1 Main ecosystem approaches for different parts of the Tana Catchment
3.1.1 What to do in the Upper Catchment
3.1.2 What to do in the Middle Catchment
3.1.3 What to do in the Lower Catchment
3.1.4 What to do on a slope
4 Ecosystem management techniques
4.1 Contour bunds
4.2 Grass strips
4.3 Gully plugging
4.4 Bench terraces
4.5 Stone bunds
4.6 Trapezoidal bunds
4.7 Tied ridges
4.8 Demi lunes
4.9 Tal Ya trays
4.10 Double dug beds
4.11 Composting
4.12 Bio-char
4.13 Organic mulching
4.14 Plastic mulching
4.15 Making use of invertebrates
4.16 Planting pits
4.17 Percolation ponds and contour trenches
4.18 Tube recharge
4.19 Subsurface dams
4.20 Sand dams
II
1
4
8
8
14
15
16
18
22
23
23
25
26
28
38
42
45
48
52
56
60
64
67
70
72
74
78
80
82
85
88
91
94
97
101

3
4.21 Sand dune and desert water infiltration
4.22 Harvesting water from roads
4.23 Small hill-side storages
4.24 Water harvesting ponds
4.25 Harvesting water from rock outcrops
4.26 Harvesting water from roofs
4.27 Spate irrigation
4.28 Flood water spreading
4.29 Flood recession farming
4.30 Controlling sand and gravel mining
4.31 Protection of springs and groundwater recharge zones
4.32 Protection of footpaths
4.33 River bank plantation
4.34 Protecting wetlands
4.35 Intensive controlled grazing
4.36 Farm forestry and windbreaks
4.37 Utilizing prosopis juliflora
4.38 Conservation agriculture
5 References and further reading
104
106
109
112
115
119
122
125
128
132
135
139
141
143
149
152
156
160
164

This manual is about ecosystem management in the Tana Catchment – the second largest basin in Kenya with a large variety of landscapes from high potential upland areas to mainly pastoralist arid and semi-arid lowlands. The ecosystem approach is a strategy for the integrated management of land, water and living resources that promotes conservation and sustainable use in an equitable way. Adopting it will help to reach a balance between three objectives: conservation, sustainable use, and the fair and equitable sharing of the benefits1.
Ecosystem services are defined as the benefits humans receive from ecological systems and include provisioning, regulating, cultural, and supporting services (MA 2005). An ecosystem service could be food products, but can also describe as more complex functions that benefit human life in an indirect way. Ecosystem services have been categorized by the Millennium Ecosystem Assessment into four types (see figure 1):
• Provisioning services are perhaps the most recognizable as benefits to people and can be easily valued in economic terms. These include food (such as fish, but also crops), fibre and fuel, but also genetic material.
• Regulating services ensure that ecosystems keep on functioning through changes and include climate regulation, water regulation, water purification and waste treatment, erosion regulation, natural hazard regulation, and pollination.
• Cultural services are non-tangible and hard to put a value on. These services can be spiritual and inspirational, recreational, aesthetic, and educational.
• Supporting services are functions that provide over a long-term time. They include soil formation and nutrient cycling.
Ecosystem services can also be divided into direct market goods (such as water for domestic use or crop yields) and non-market goods (such as biodiversity, or soil formation) (Wilson & Carpenter 1999). Estimating the values of goods and services in an ecosystem helps to make hidden social and environmental cost and benefits visible (Wilson & Carpenter 1999). In some instances, services can be replaced by technology but often only at a higher cost than maintaining the original service (Cairns 1995). It may be a useful thinking exercise to try and value the service. For example, a watershed’s purification functions can be monetized and compared to the cost of substituting these by a water treatment facility to provide clean water to a community.
1 According to the Convention on Biodiversity COP 5 Decision V/6. The decision recommends five operational principles: (1) Focus on the functional relationships and processes within ecosystems; (2) Enhance benefit- sharing (3) Use adaptive management practices (4) Carry out management actions at the scale appropriate for the issue being addressed, with decentralization to lowest level, as appropriate (5) Ensure intersectoral cooperation.
1 Introduction: Managing ecosystems, transforming landscapes, creating buffers
4

5
Agriculture can be seen as the enhancement of specific provisioning ecosystem services, often to the detriment of other types of services. Ultimately, if regulating and supporting services are degraded, long term sustainability of ecosystems is undermined and food security reduced (Boelee et al. 2011). Land and water management techniques can help to strengthen regulating ecosystem services and even, if they stay in place long enough, enhance supporting services. For instance when such techniques help reduce erosion, valuable soil is preserved for farming use by future generations.
An ecosystem approach strives for integrated environmental management of forests, land, freshwater, and coastal ecosystems. Ecosystem concerns are thus considered in relation to development concerns, recognizing the interdependence of ecosystem services and human needs, and acknowledging the diverse effects on various social groups of declining ecosystem services. Against this background, this manual is meant to help Water Resource Users Associations (WRUAs) in implementing their sub catchment management plans, now and in the future. It is also meant to inform water managers and catchment conservation officers in the Tana Catchment and in similar areas on the potential for creating more resilient and productive natural systems – primarily
Box 1: Ecosystems management at catchment level
There is large unutilised scope for better retention of water in the Tana Basin and reducing erosion. Studies in the Upper Tana catchment have revealed that basin-wide implementation of tied ridges terracing would not only improve productivity in the uplands but also reduce sediment inflow to the Masinga reservoir by about one million tons annually. This would be a most economical way to extend the life of the reservoir.
Also, the systematic adaptation of mulching would lead to a reduction in non-beneficial soil evaporation, which is more than 100 million m3 per year. This water would be available for productive use in the Upper Catchment but would also be added to the total amount of water in the basin. Enhancement of groundwater recharge through the different practices could improve the usage of the natural storage capacity in the basin by about 20%. This would mean less competition for surface water, more regular flow and better groundwater availability.
Source : ISRIC 2010
Provisioning Services
• Food • Wood & Fibre • Freshwater • Energy
Cultural Services
• Recreational • Aesthetic • Educational • Spiritual
Regulatory Services
• Flood regulation • Climate regulation • Water purification • Disease regulation
Supporting Services
• Soil formation • Nutrient cycling • Primary production
Figure 1. Examples of ecosystem services (based on MA 2005)
6
by better retaining and reusing water in the different areas. By taking an ecosystem approach, supporting functions in the basin can be enhanced by designing and implementating of appropriate land and water management.
Ecosystem management is the main approach for realizing the ‘green economy’ – combining growth with better resource management. There is much unused opportunity in the improved management of the natural landscapes and the biodiversity, microclimates, water storage and soil management that are part of it. This promise of improved ecosystems management applies at all levels: the individual field and the subcatchment level, but also at the level of the entire basin.
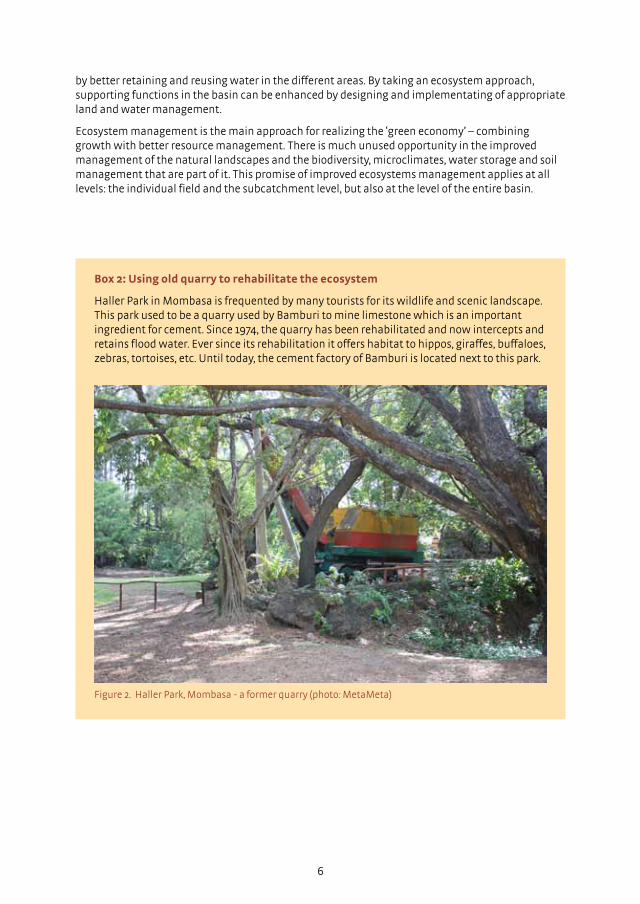
Box 2: Using old quarry to rehabilitate the ecosystem
Haller Park in Mombasa is frequented by many tourists for its wildlife and scenic landscape. This park used to be a quarry used by Bamburi to mine limestone which is an important ingredient for cement. Since 1974, the quarry has been rehabilitated and now intercepts and retains flood water. Ever since its rehabilitation it offers habitat to hippos, giraffes, buffaloes, zebras, tortoises, etc. Until today, the cement factory of Bamburi is located next to this park.
Figure 2. Haller Park, Mombasa - a former quarry (photo: MetaMeta)

7
In the ecosystem approach described in this manual managing land and water is a central element. The ‘3R’ approach of ‘recharging, retaining and reusing water’ has been followed. The ultimate aim is to create secure land and water buffers. This translates into better livelihoods for women and men alike – less risks during drought periods, higher productivity and increased access to drinking water.
Central to 3R is making use of the soil profile and shallow aquifers to store water. Recharge adds water to the buffer; retention slows down the outflow and raises water tables; reuse recirculates water in the system. The larger idea is that tackling a local water crisis is not so much about allocating scarce water, but to extend the chain of water use and reuse as much as possible, taking into account all people (women and men) and all uses including the environment across the entire basin: local drinking water, the sourcing of water to Nairobi City, small and large scale farming, forestry, livestock, fishery, wildlife management, hydropower, tourism and industry. This also includes safeguarding ecosystems and valuing ecosystems and their services, which would keep the hydrological system running for the basin stakeholders .
The Verified Carbon Standard2 developed in 2012 has approved the first methodology on soil carbon – captured by improved land management practices. This would entitle farmers adopting improved sustainable farming techniques to earn carbon credits.
In many areas – including the Tana Catchment – there is much to do still. Water and land resources can be restored and reset to ecological and economic functions of much higher value. The main message is that we can reverse environmental degradation and that there are many opportunities to revert to ecosystems that are more sustainable and more productive.
2 This was developed by the World Bank for the Smallholder Agriculture Carbon Finance Project run by the non-governmental organization Vi Agroforestry in western Kenya. The pilot, involving more than 60,000 smallholders who are farming 45,000 hectares of land, is run together with smallholder farmers and supported by the World Bank’s BioCarbon Fund.
8
2 Understanding the Tana Basin
2.1 The Tana Basin
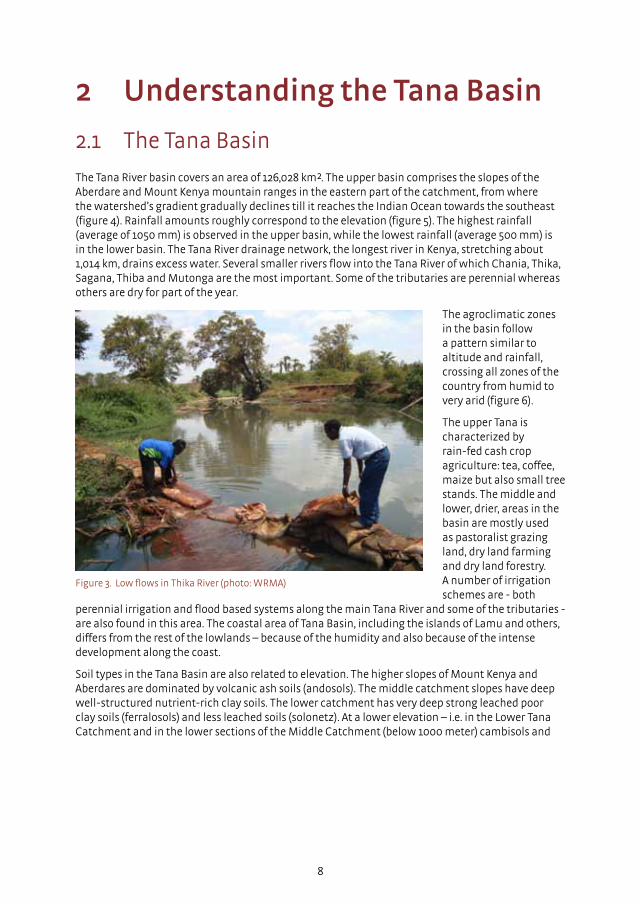
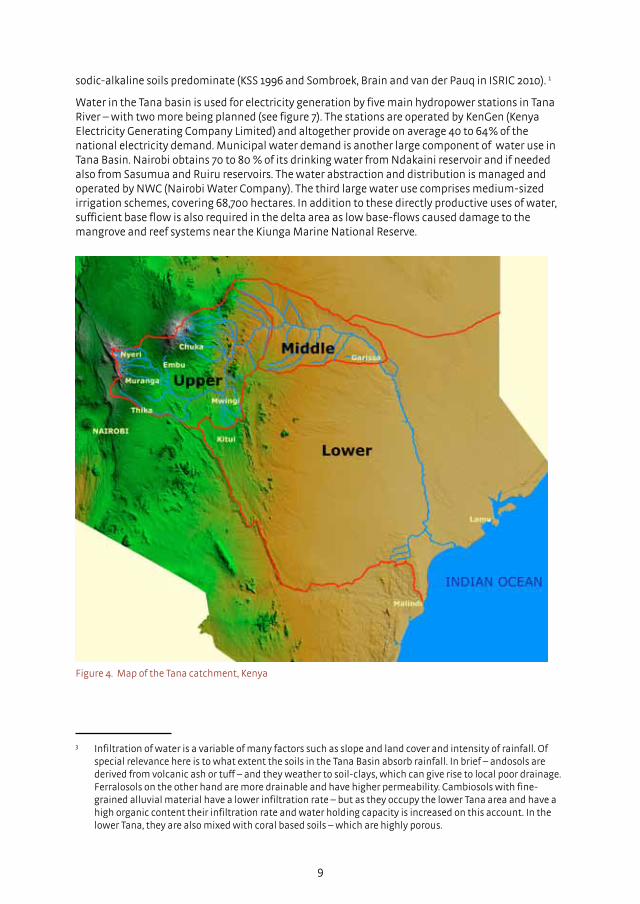
The Tana River basin covers an area of 126,028 km². The upper basin comprises the slopes of the Aberdare and Mount Kenya mountain ranges in the eastern part of the catchment, from where the watershed’s gradient gradually declines till it reaches the Indian Ocean towards the southeast (figure 4). Rainfall amounts roughly correspond to the elevation (figure 5). The highest rainfall (average of 1050 mm) is observed in the upper basin, while the lowest rainfall (average 500 mm) is in the lower basin. The Tana River drainage network, the longest river in Kenya, stretching about 1,014 km, drains excess water. Several smaller rivers flow into the Tana River of which Chania, Thika, Sagana, Thiba and Mutonga are the most important. Some of the tributaries are perennial whereas others are dry for part of the year.
The agroclimatic zones in the basin follow a pattern similar to altitude and rainfall, crossing all zones of the country from humid to very arid (figure 6).
The upper Tana is characterized by rain-fed cash crop agriculture: tea, coffee, maize but also small tree stands. The middle and lower, drier, areas in the basin are mostly used as pastoralist grazing land, dry land farming and dry land forestry. A number of irrigation schemes are - both
perennial irrigation and flood based systems along the main Tana River and some of the tributaries - are also found in this area. The coastal area of Tana Basin, including the islands of Lamu and others, differs from the rest of the lowlands – because of the humidity and also because of the intense development along the coast.
Soil types in the Tana Basin are also related to elevation. The higher slopes of Mount Kenya and Aberdares are dominated by volcanic ash soils (andosols). The middle catchment slopes have deep well-structured nutrient-rich clay soils. The lower catchment has very deep strong leached poor clay soils (ferralosols) and less leached soils (solonetz). At a lower elevation – i.e. in the Lower Tana Catchment and in the lower sections of the Middle Catchment (below 1000 meter) cambisols and
Figure 3. Low flows in Thika River (photo: WRMA)
9
sodic-alkaline soils predominate (KSS 1996 and Sombroek, Brain and van der Pauq in ISRIC 2010). 1
Water in the Tana basin is used for electricity generation by five main hydropower stations in Tana River – with two more being planned (see figure 7). The stations are operated by KenGen (Kenya Electricity Generating Company Limited) and altogether provide on average 40 to 64% of the national electricity demand. Municipal water demand is another large component of water use in Tana Basin. Nairobi obtains 70 to 80 % of its drinking water from Ndakaini reservoir and if needed also from Sasumua and Ruiru reservoirs. The water abstraction and distribution is managed and operated by NWC (Nairobi Water Company). The third large water use comprises medium-sized irrigation schemes, covering 68,700 hectares. In addition to these directly productive uses of water, sufficient base flow is also required in the delta area as low base-flows caused damage to the mangrove and reef systems near the Kiunga Marine National Reserve.
3 Infiltration of water is a variable of many factors such as slope and land cover and intensity of rainfall. Of special relevance here is to what extent the soils in the Tana Basin absorb rainfall. In brief – andosols are derived from volcanic ash or tuff – and they weather to soil-clays, which can give rise to local poor drainage. Ferralosols on the other hand are more drainable and have higher permeability. Cambiosols with fine- grained alluvial material have a lower infiltration rate – but as they occupy the lower Tana area and have a high organic content their infiltration rate and water holding capacity is increased on this account. In the lower Tana, they are also mixed with coral based soils – which are highly porous.
Figure 4. Map of the Tana catchment, Kenya

10
Figure 5. Mean annual rainfall in Tana River Basin (map by M. Nyabenge of ICRAF, 2012)
Figure 7. Types of land cover in Tana River Basin as well as protected areas and national parks (map by M. Nyabenge of ICRAF, 2012).
Figure 6.Map of Kenya with agroclimatic zones, river basins and hydropower dams (map by M. Nyabenge of ICRAF, 2012).

11
Tana Catchment Area also boasts of several protected and gazetted areas. This includes four National Parks and eight Game Reserves, the major ones being the Aberdare Ranges, Mt. Kenya Forest, Meru National Park, Tsavo East National Park and the Tana River Primate Reserve. In these natural landscapes ecosystem management is equally important. In Tsavo East National Park the maintenance of drinking water ponds is important to ensure that wildlife thrive and remain within the boundaries of the Park. Figure 7 shows a map of the wide variety of land use in the Tana Basin, as well as the protected areas.
Figure 8. Water availability per capita in the Tana Basin (Source: WRMA, 2009)
Figure 9. Main components of water balance in 2005 (dry) and 2006 (wet) in Upper Catchment (source: Hunink et al., 2010)
Over the years, per capita water availability in Tana catchment has been shrinking (figure 8). This has been caused primarily by high population growth. In 1962, the population in Tana was about 1.5 million, in 2006 the estimated population was 6.1 million and in 2012 the population is projected to reach around 7.1 million. Taking the year 1962 as a basis (water availability per capita being 2400 m³), the water availability per capita today in Tana is 520 m³/capita or only 22% of the amount it was 50 years ago. This classifies the catchment as ‘water scarce’ (TWRMA 2007). Parallel to this per capita land availability has declined too – with some holdings becoming too small to be economical – (for instance in the tea estate areas). To counter the effects of smaller holdings it is imperative to continue to improve land and water management and achieve higher productivities. It is also important that land is widely accessible to a large range of small farmers and that excessively concentrated land ownership is discouraged.
Water availability fluctuates from year to year (see also figure 9) which looks at the water balance in a dry as well as a wet year for the Upper Tana. As in most semi-arid and semi-humid areas rainfall differs considerably between a wet and a dry year. In a wet year water is added to the storage whereas water losses from evaporation and evapotranspiration (from vegetation) are less – due to the higher humidity and higher cloud cover.
Faced with decreasing water capacity the main strategic directions for the Tana Basin hence are:
1. Increase storage – in small and large reservoirs, in shallow groundwater and as soil moisture and by preserving of wetlands that are often part of the “natural infrastructure”.
2. Reduce non-beneficial evaporation – the loss of water to air humidity.
There is considerable scope in Tana to work on these two strategies. At present groundwater is not used intensively throughout the Tana Basin – with the exception of a few subcatchments. Groundwater is used mainly for drinking water. As the pressure on resources increases one may expect groundwater use to increase for agriculture and livestock too. There is a need and a scope to recharge and retain groundwater more effectively through a large number of measures – grass strips, terracing, sand dams but also several measures that are common elsewhere but not yet known in the Tana Basin. There is also a potential to do much better in reducing non-beneficial evaporation – for instance through more widespread application of mulching and other soil water conservation measures.
In general, there is a large scope to do substantially better in ecosystem management throughout the Tana Catchment. The area covered with terraces or tied ridges both in Upper and Middle Catchment is still a fraction of what could be covered – in spite of the potential for higher yields. The seasonal flood water in the Middle and Lower Catchment is not systematically used – either for rangeland, recharge or agriculture. In the Upper Catchment, some of the steep slopes continue to be encroached – even though spectacular improvements have been made in terms of increased vegetation and reduced soil erosion in some areas. This has been achieved for instance by enclosing some of the most vulnerable areas. In some areas a remarkable restoration of the landscape has taken place in the last few years (see for instance box 3). These changes have also been achieved in a short time frame indicating that change can be rapid.
12

13
Box 3: Rehabilitating the Upper Catchment
In the Chania subcatchment the slopes of Aberdare were heavily encroached and degraded. As part of the subcatchment management activities of the WRUA the area was closed and replanted and the adjoining areas partly treated – leading to a transformation of the landscape. The base flow has been regulated and erosion has reduced dramatically. There is a much larger scope for harvesting non-timber forest products in the enclosed area and productive agriculture in the area adjacent to it.
Figure 10 a, b. Parts of Chania subcatchment before (above) and after (below) rehabilitation (photos: WRMA)
2.2 Main challenges in the Tana Catchment
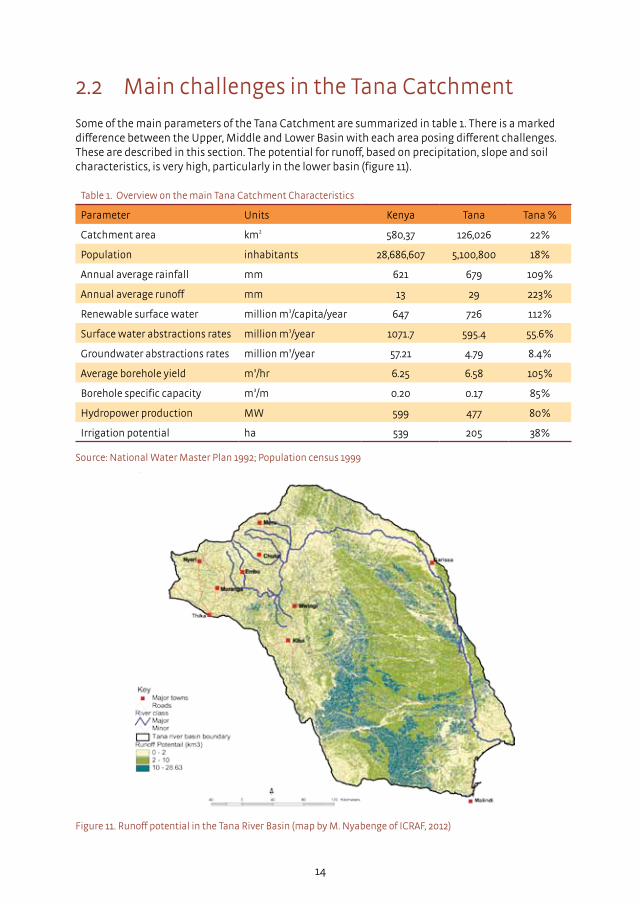
Some of the main parameters of the Tana Catchment are summarized in table 1. There is a marked difference between the Upper, Middle and Lower Basin with each area posing different challenges. These are described in this section. The potential for runoff, based on precipitation, slope and soil characteristics, is very high, particularly in the lower basin (figure 11).
Table 1. Overview on the main Tana Catchment Characteristics
Parameter Units Kenya Tana Tana %
Catchment area km² 580,37 126,026 22%
Population inhabitants 28,686,607 5,100,800 18%
Annual average rainfall mm 621 679 109%
Annual average runoff mm 13 29 223%
Renewable surface water million m³/capita/year 647 726 112%
Surface water abstractions rates million m³/year 1071.7 595.4 55.6%
Groundwater abstractions rates million m³/year 57.21 4.79 8.4%
Average borehole yield m³/hr 6.25 6.58 105%
Borehole specific capacity m³/m 0.20 0.17 85%
Hydropower production MW 599 477 80%
Irrigation potential ha 539 205 38%
Source: National Water Master Plan 1992; Population census 1999
Figure 11. Runoff potential in the Tana River Basin (map by M. Nyabenge of ICRAF, 2012)
14

15
2.2.1 Upper Tana Basin
The Upper Tana region is a high potential area. This extensive upland area (all above 1,300 m ASL) of moderate seasonal rainfall comprises the southeastern slopes of Mount Kenya and the eastern facing slopes of the Aberdare and Nyambene Hills. Geologically, it is predominantly volcanic terrain with steep slopes, but with naturally good infiltration characteristics, resulting in both plentiful direct and streambed recharge to the complex underlying volcanic aquifer systems. However, where the more fractured or partly cemented volcanic rocks are at the surface, not only will there be excellent recharge conditions but vulnerability to groundwater pollution will also be very high.
The Upper Tana is also characterized by catchment degradation leading to higher and faster flows. Sedimentation is a key issue – especially in high rainfall seasons. As can be seen in figure 12, the volume of sediment increases in direct proportion to the volume of flow. Whereas at low flows of 0.10 m³/s sediment loads are 2-5 mg/l, this increases drastically to sediment loads of 30 mg/l at discharges of 10 m³/s to even 100 mg/l at discharges of 100 m³/s. This correlation is fairly constant all over the Upper Basin.
Saba Saba catchment is the only exception. The sediment load here is consistently much higher compared to the other stations. The probable reason is the high erosion of the riverbanks in Saba Saba. In general, there is a strong case to attenuate and retain flows in the Upper Tana.
Figure 12. Sediment Discharge – Flow graph (Source: Z&A, 2011)
Moreover, high population densities and intense agriculture in these areas are a cause of over-abstraction of surface water and conflicts are common. The high number of agro-based factories and urbanization contribute to pollution to the water resource. In this zone, water quality is affected by pollution from tea factories, and sanitation from tea zone dwellers (there is a lack of sanitation facilities in tea zones).
The major issues within Upper Tana Basin are as follows: • Over-abstraction locally: of surface water and, in some areas, groundwater – for instance
around Makuyu, Warazo Lusoi (Nyeri); • Concerns over catchment degradation from land use changes that may affect recharge in this
unit; risk of deterioration of water quality; • A significant rate of urbanisation and related surface excavation and/or compaction leading to
reductions in infiltration, landslides and serious soil erosion and water pollution arising from inadequate sanitation;
• Agro-based factories which also contribute to water pollution; • Encroachment of protected forests – controlled to a certain degree in the past few years by
planting tea estates, fencing and protection by local committees; • Encroachment of natural wetlands – that earlier stored runoff water, recharged aquifers, and
produced valuable biodiversity e.g. Bwathonaro Wetland; • Encroachment, landslides, degradation and subsequent siltation and pollution of spring heads
(many places, such as Maua, Murang’a, Tamani Springs, Meru: Kambiti Springs, Maragua); • Localised heavy abstraction of surface water and groundwater for intensive commercial
plantations (eucalyptus in particular); • Water quality – fluoride and manganese levels are high in certain locations causing health
issues.
2.2.2 Middle Tana Basin
The Middle Tana Catchment lies at an altitude below 1300 m to about 500 m. The region is semi-arid to arid. It extends over the Tharaka, Kitui, Mwingi and parts of Yatta district. Because of the low rainfall and absence of main rivers, the region is a low potential area. It is, nevertheless, used intensively for livestock, agriculture, and tree harvesting - without there being much management of resources by way of land management, controlled grazing, managed forestry or high intensity water harvesting.
The aquifers are localized and typically poor. In some areas water quality is an issue because of quarrying, sand harvesting and chemical wastes from farms. Towns and settlements in these zones are sources of pollution because they lack functional sewerage systems. There are pockets in these zones where there is excessive fluorides, irons, manganese etc. in groundwater.
The main issues within Middle Tana Basin region are: • Water scarcity – rainfall ranging between 400 m to 700 m; • Unevenly distributed groundwater availability and seasonal variation of shallow groundwater
levels, for instance in Kitui; • Salinity of groundwater in several areas; • Uncontrolled sand mining – reducing the buffering and water storage capacity of the ephemeral
and seasonal streams in the area; • Sedimentation in reservoirs; • No protection of natural trees stands – leading to removal of trees and no regeneration; • No management of grazing areas (with a few exceptions) – as a result most palatable grasses
16

17
are overgrazed and woody species take the upper hand ; • Invasion of alien species – in particular prosopis juliflora. Though the species has economic
value, it tends to suffocate the area, not allowing the development of native species and the undergrowth.
Box 4: Uncontrolled sand mining in the Middle Tana Basin
Due to the proximity to urban centres and the popular belief that this area has the best construction sand, sand mining is rampant in many parts of the middle catchment. Sand and gravel are removed from the riverbed – taking away the capacity to absorb flood water during high rainfall, store it in the riverbed and feed local aquifers. Instead local aquifers now ‘lose’ water to the dry and empty riverbeds. A related problem is the excavation of watering holes for irrigation systems in the riverbeds. During floods these fill with clay and this reduces the capacity of the local stream to buffer and store flood water.
Figure 14. Uncontrolled sandmining (photo: MetaMeta)
Figure 13. Depleted riverbed (photo: MetaMeta)
18
2.2.3 Lower Tana Basin
The Lower Tana Basin lies at an altitude of less than 500 m. It is an extensive zone characterised by water scarcity in time and space. Evapotranspiration rates are high due to the high temperatures.
The area around the Lower Tana River is nevertheless eyed as a major area for agricultural growth with much potential for sugar farming, bio-fuel plantations, horticulture and rice, even though the potential may be fragile and compete with environmental functions.
Discharge in the Tana River fluctuates. At present, it sustains flood based farming (using tidal effects) and riverine forests with high and unique biodiversity. This may change drastically with the construction of a hydropower dam upstream. It will be important to carefully build in mechanisms for artificial releases of early floods.
Groundwater is important for water supply and for irrigation. It faces challenges of salinity and high fluoride and iron content due to the nature of the rock formation. Other challenges include seawater intrusion, tourism generated waste and poor management of domestic waste. The coastal zone, which is characterised by total dependency on groundwater exploitation, is particularly vulnerable.
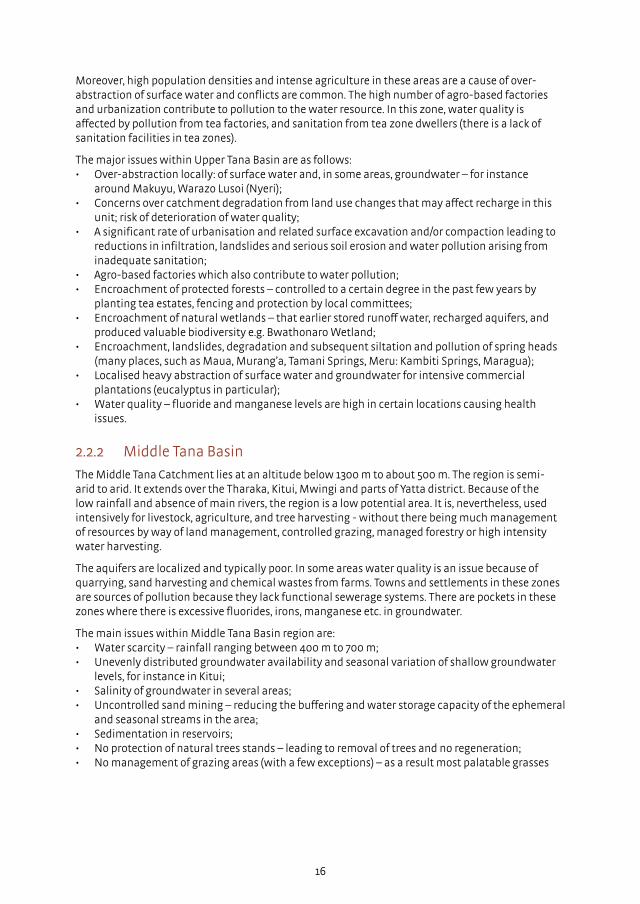
The floodplain wetlands and in particular the oxbow lakes are considered to be of high value for recession agriculture of sorghum and millet, fishing, reeds for roof thatch, fresh water, grazing. The same applies to the Tana River itself (water has various uses including irrigation, transportation, sand for building and as a protective barrier against tresspassers). The floodplains have a very important function also in the attenuation of flood peaks through the over spilling of the banks, storage on the floodplains and in the oxbow lakes, infiltration into soils raising the ground- water level, etc. thus protecting downstream areas from their destructive power. This can be seen from figure 15 – which shows flood peaks at Garissa even out in downstream Garsen (Hamerlynck et al., 2010).
Figure 15. Flood peak discharges in the Tana River – effect of flood plains (source: (Hamerlynck et al., 2010)
Discharge m³ / s

19
The region comprises of complex local and semi-regional aquifers, found within Tertiary Sediments and Quaternary alluvium deposits. Recharge takes place from the Tana Rivers but also from the dry riverbeds (laghas). Lamu Island’s aquifer is small and risks overuse by the island’s rapidly growing economy.
The south-eastern parts of the main Merti aquifer covers southern Garissa district. It is a very productive aquifer from which common yields exceed 10 m³/hr. The areas north and south of the Merti Aquifer (the greater part of the North Eastern Province), however, lies within the low groundwater potential zone. The general arid climate of the area and the deep fine-grained soil forming the sub-surface cover of the plains may not recharge the aquifer under normal conditions. It is, however, possible that direct recharge through the surface may be occurring through sinkholes observed in the area. These sinkholes are cavities that result from solution of the carbonaceous rock by excess CO
2 (such holes are e.g. observed in Shantabak). Certain structural features may be
aiding this process by allowing water to flow along the lineament and into permeable sand layers in the aquifer. The recharge volume for the whole Merti aquifer is in the range of 10,000 m³ per day. The most important recharge mechanism is indirect recharge from the laghas through buried river channels. From the River Tana system inter-aquifer flow via the Hagadera lineament adds further to the recharge (Earth Water, 2009).
The Tana River alluvial aquifer stretches from 125 km upstream of Garissa to 200 km downstream of Garissa. The total minimum width of the alluvial deposits is estimated at 450 m. The aquifer thickness is therefore approximately 20 m. The total volume of the aquiferous formation is an estimated 2.93 x 10⁹ m³. It should be understood that Tana alluvium does not always contain fresh water, nor is it always sustainable. Shallow boreholes in this unit have dried over time, in some places (in Hola, for example). The water quality (in terms of electrical conductivity) within the alluvium is generally less than 1000 μS/cm. Yields vary from one place to another, ranging from less than 10 m³/hr to more than 60 m³/hr. The alluvial belt on both banks along the Tana River and Daua Parmar river basin falls within the high groundwater potential zone. The aquifers are shallow with a water level of fresh water at no more than 10 m. Underlying this shallow aquifer is saline water layer at a depth of 30-40 m. Other medium groundwater potential zones occurs as isolated distinct patches.
The Tana River Delta (130,000 ha) contains a diversity of habitats – such as savannah grassland, riverine forests and rangelands. It is amongst the most important freshwater wetland systems in the country. Also, a significant local community of cattle herders and others depend on the lake as the water source of last resort in the dry season. The forests along the Lower Tana are part of a globally important biodiversity hotspot. Though modest in size and growing in patches, they harbour numerous endemic or restricted-range species of plants, primates, and birds (Hamerlynck et al, 2010). The Lower Tana River itself is home to a number of endemic fish species.
The main issues within Lower Tana aquifer region are as follows: • Fluctuation of water levels in the main rivers – especially the Tana – causing meandering and
damage to cultivated fields close to the river bank; • Water scarcity during the dry season; • Wet season flooding – with the flood water usually not utilized optimally for beneficial
purposes; • Damage due to peak rainfall events – in particular during El Niño years; • Encroachment of land by invasive species – in particular prosopis juliflora (mathenge); • Salinity of groundwater – with salinity increasing with distance from dry river streams (laghas); • Limited groundwater storage; • (In coastal areas) deterioration of water quality as a result of intrusion of saline water. • (On the coastal islands) groundwater pollution from sewerage, pit latrines and encroachment
around the well heads as well as the risk of over-abstraction; • Over use of the southern wells of the Lamu aquifer and their encroachment by saline water.
There are also concerns that with increased development and construction of harbour, the problems of overuse will be compounded;
• Substantial competition for land and water in the Tana Delta – between unique wetland and biodiversity functions and ambitious development plans for sugar estates and Jatropha plantations and the rehabilitation of irrigation infrastructure.
20
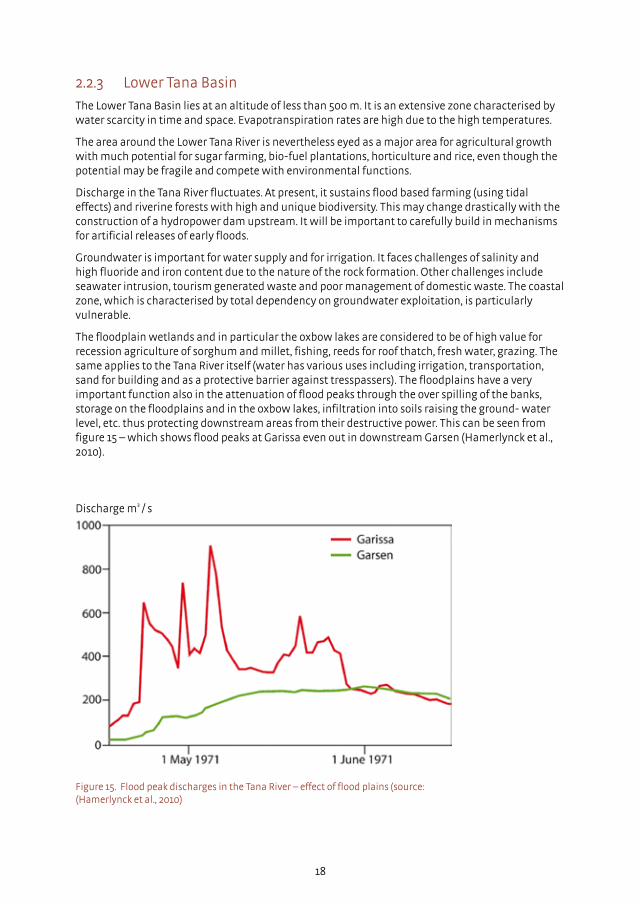
Box 5: Conflicts between farmers and pastoralists
Around Lake Kenyatta conflicts between pastoralists and farmers arise frequently. Farmers have taken conservation measures such as tree planting and banning of agricultural activities within the lake’s immediate boundaries. The lake feeds boreholes, that are the main source of water supply to the inhabitants of Mpeketoni. Pastoralists travel to this green area over large distances with goats and cows.
Conservation of the lake is usually discussed through barazas (community meetings). Pastoralists are not represented in these meetings. Several separate meetings have been organized with both parties, but without much result so far.
Figure 16. Grazing around lake Kenyatta (photo: MetaMeta)

21
There are several ways through which groundwater is discharged in the area. These include abstraction from boreholes and shallow wells by pumping (artificial) and flow through primary and secondary porosity (pores, faults and fractures) of the formations (natural). In the study area, the direction of groundwater flow is towards the Somali border. Discharge through evapotranspiration by vegetation and soils in the vadose zones, via capillarity have also been experienced. Discharge from the aquifer can also take place via deep vertical percolation into deeper storage e.g. the Jurassic sediments.
Discharge zones are found along the coastal basin in Somalia and North Coast in Kenya, the underground flow being towards the sea which forms the piezometric base level. It is thus evident that the main discharge occurs along the shoreline.
Box 6: Vulnerability in El Niño years
The 1997 El Niño that hit Kenya left a big impact. The picture below shows a bridge in the TARDA project area in Garsen, which was flushed away. As the structure is not damaged, TARDA will attempt to put it back in to place whenever funds are available.
The trail of the devastating El Niño also encouraged villagers of Mpeketoni to plant seedlings of indigenous trees around Lake Kenyatta to protect its shores.
Figure 17 a,b. El Niño consequences (photos: MetaMeta)

3 Knowing what to do whereIn integrated landscape management and ecosystem management at scale, it is important to know what to do where – how to manage sedimentation processes; where water can be stored and retained, where it infiltrates into the aquifer systems and what land cover and land management support this; how shallow groundwater travels, how it links to soil moisture; how micro-climate is influenced. Equally important is protecting the quality of ecosystems and maintaining water quality 1.
The applicability of land and water management techniques and water quality protection, (described in more detail later in this manual) vary widely across the different parts of the Basin. Also varying greatly is the capacity for recharge enhancement and increased water storage, and thus the potential for ‘landscape transformation’.
4 It should also be noted that naturally-occurring groundwater quality hazards (notably excessive fluoride and soluble iron and or manganese concentrations) occur patchily across wide areas of the entire Tana Basin. Such problems require rather specific local solutions (including treatment and removal plant of appropriate scale) and do not necessarily lend themselves to integrated land-and-water management (landscape transformation) approaches.
22
Box 7: 3R: Recharge, Retention and Reuse
Recharge
Recharge adds water to the buffer and as such it adds water to the circulation. Recharge can be natural – the infiltration of rain and runoff water in the landscape – or it can be managed (artificial recharge) through special structures or by considerate planning of roads and paved surfaces. Recharge can also be can be a welcome by-product of, for instance, inefficient irrigation or leakage in existing water systems.
Retention
Retention slows down the lateral flow of groundwater. This helps pond up groundwater and creates large ‘wet’ buffers. In such conditions it is easier to retrieve and circulate water. Hence, retention makes it possible to extend the chain of water uses. It also raises the groundwater table. Slowing down or even controlling lateral outflow of the water table affects soil moisture and soil chemistry: this can have a large impact on agricultural productivity.
Reuse
Reuse is the third element in buffer management. The large challenge of 3R is to make water revolve in the water cycle as much as possible. Scarcity is resolved not only by managing demand through reduction in use but also by keeping water in active circulation. In managing reuse, two processes are important. The first is to manage non-beneficial evaporation to the atmosphere. Water that evaporates ‘leaves’ the system and can no longer circulate in it. Rather than that, one should try the opposite and capture air moisture, such as dew, wherever possible. Another process is the management of water quality – to make sure that water can move from one use to another, even as water quality changes in the chain of uses.

23
There are no standard prescriptions. Ecosystem management at scale needs to be rooted in local leadership, local planning and local innovation – as in the case of the Water Resource Users Associations. It also requires strong interaction with land use planning, including the planning of built up areas and roads. Roads, for instance, when placed on embankments greatly affect surface runoff and hence infiltration and retention.
It should be borne in mind that when applied at large-scale, modifications to the hydrology of the Upper Tana catchment will have a cumulative impact (potentially positive or negative) on the Middle and -Lower Tana. Thus the incremental application of the techniques elaborated here has to be done within broader water resource management planning which is in hand through the harmonised Catchment Management Strategy and the Sub-Catchment Management Plans.
In the following section of this chapter (3.1) the main land and water management approaches for the component units of the Tana Basin are summarised briefly and the scope for management interventions in terms of the 3R approach are explained:
• Influencing Surface Processes – the recharge runoff phase; • Maximising Groundwater Storage – the retention phase; • Exploiting the Water Buffer – the reuse phase; • Soil management – controlling erosion and making use of sediments; • Influencing the micro-climate.
In the next chapter different techniques in ecosystem management as appropriate for the Tana Basin are introduced.
3.1 Main ecosystem approaches for different parts of the Tana Catchment
3.1.1 What to do in the Upper Catchment
A first main strategy in the upper catchment is the comprehensive introduction of measures to reduce landslides and soil erosion, coupled with techniques to maximise retention of soil moisture and infiltration to groundwater (both on the land surface and in the beds of surface water courses). Ecosystem management (including wetlands and forests conservation and (natural) restoration initiatives) in the Upper Tana will positively affect water availability in the entire basin and will also safeguard the sustainability of main reservoirs that are of national importance, generating hydro-power and providing water to Nairobi.
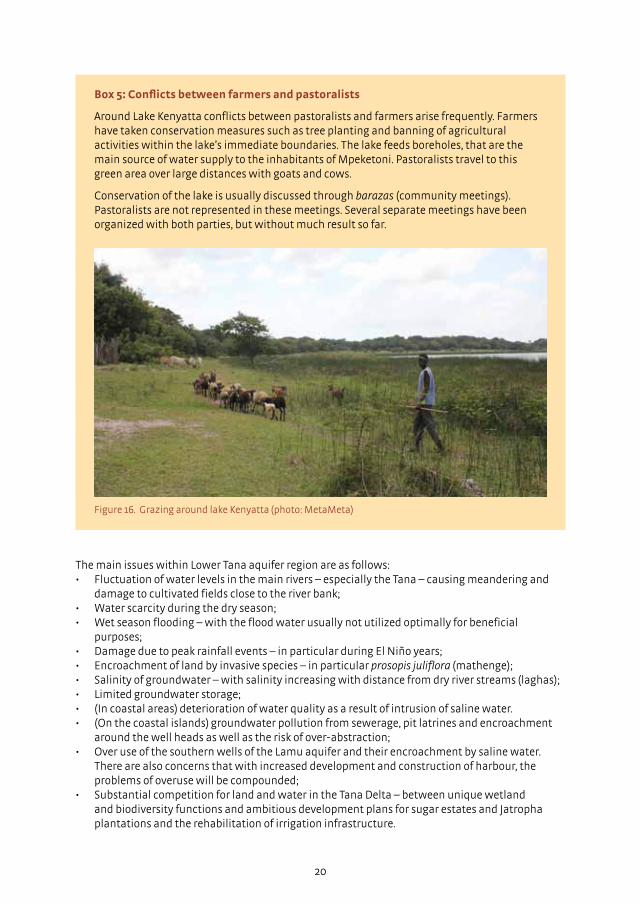
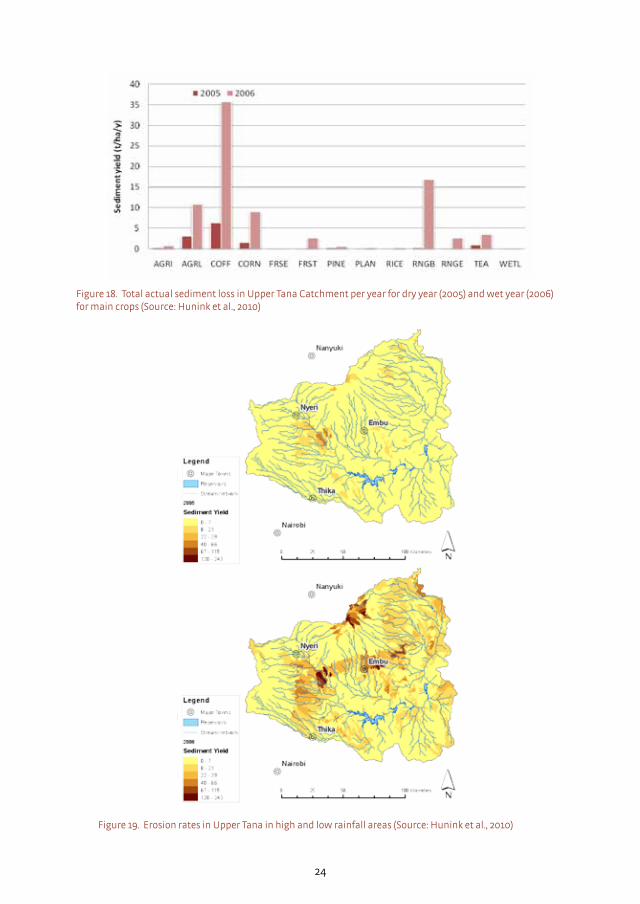
Figures 18 and 19 show that in high rainfall years, such as 2006, sedimentation and erosion are important problems. Erosion is particularly severe in the coffee and maize producing areas of the Upper Catchment due to poor ground cover (figure 18). The areas with peak erosion correspond to these coffee and maize cultivation areas (figure 19). Measures to conserve soil and retain moisture are particularly important in these hotspots.
A second strategy is to protect and develop surface storage in this area – by protecting the wetlands and creating small surface storages. At the same time groundwater recharge and storage can be improved through tied ridges, terracing, and specific recharge measures. These measures are generally dual purpose as they also reduce soil erosion. While the underlying aquifers appear to have relatively steep bases and high rates of groundwater flow to springs (and thus do not lend themselves to major increases in long-term storage) such measures will help much in stabilising discharges at major springheads at lower altitude. Their overflow, in turn, will provide some baseflow to rivers.
24
Figure 18. Total actual sediment loss in Upper Tana Catchment per year for dry year (2005) and wet year (2006) for main crops (Source: Hunink et al., 2010)
Figure 19. Erosion rates in Upper Tana in high and low rainfall areas (Source: Hunink et al., 2010)
25
Thirdly, of equal importance will be conserving groundwater quality at these major springs to potable standards. This can be done through immediate protection measures to prevent encroachment and physical degradation of the springheads themselves, coupled with controlling of polluting discharges from urbanisation, agro-based factories and agricultural land-use in their capture zones. Given the increasing demands for water supply in the area, improved water resource administration will also be required to ensure the equitable allocation of the scarce resource. Surface water should also be protected – the continued rehabilitation of degraded buffer strips through planting of appropriate vegetation along riverbanks remains very important here.
The final strategy for the Upper Tana Catchment is to reduce non-beneficial evaporation, i.e. minimize the water that is lost to the atmosphere without being used. This can be done by improving land cover and also by measures such as mulching and windbreaks. These measures will also affect the micro-climate, influence soil temperatures, and prolong the growing season.
3.1.2 What to do in the Middle Catchment
The Middle Tana area lies mainly at an altitude of 500-1300 m. It is characterized by a semi-arid, drought-prone, rain-shadow type of climate and only localised low-potential aquifers (patchy thin alluvial/colluvial deposits and weathered hardrocks with often natural salinity).
The area has been degraded over extensive tracts by overharvesting of local wood stands, uncontrolled livestock grazing, and farming ‘on the slope’. This has caused serious soil erosion problems, aggravated further by quarrying operations – in particular sand and gravel mining from riverbeds. In addition, water pollution is generated from the municipal urban centers, livestock farmyards, and agro-based industries. The use of agrochemicals on cultivated farmland may also be generating diffuse water pollution in some parts of the Middle Tana basin.
The Middle Tana catchment presents a considerable challenge to water harvesting and creating more productive land and water ecosystems. There are several opportunities that need to be systematically explored. The main strategies are:
• Small-scale improvements in groundwater recharge and retention along all alluvial tracts and in river beds, through sand dams, subsurface dams and regulated sand and gravel harvesting coupled with the use of shallow wells for livestock watering and small patches of irrigated cultivation.
• Taking every opportunity for soil treatment to improve moisture retention in cultivated soils and secure better rainy-season crops, the use of compost and different types of mulching and bio-char on the land, and the widespread application of terracing and bunding, especially on sandy-loamy soils.
• Developing opportunities for small-scale surface water storage in the arid landscape, ranging from roof top water harvesting to rock outcrops and systematic water harvesting from roads.
• Making use of the short-duration floods running down the hill side through flood water spreading and spate irrigation for farming, range land improvement, soil regeneration, and local recharge.
• Improved management of grazing areas – for instance through controlled holistic grazing, whereby livestock is moved around from area to area, allowing each area to be utilized briefly and intensely. Holistic grazing stimulates the regeneration of all biomass and enables better infiltration of water as the soil crusts are broken by the hooves of grazing livestock.
• Working on protecting and developing useful wood stands suitable for arid conditions, so as to cater for the enormous market for charcoal amongst others. This would also help to build a better ecosystem and improve soil fertility. This strategy includes the control and managed conversion of invasive species – especially prosopis juliflora.
3.1.3 What to do in the Lower Catchment
The Lower Tana (at an altitude of below 500 m) is largely a coastal and inland zone characterised by severe surface-water scarcity, high evapotranspiration rates and heavy reliance on groundwater and a limited number of rivers. Fortunately, it is underlain by some useful (but complex) aquifers mainly within the underlying Tertiary Sedimentary Formations and Quaternary Alluvial Deposits. The zone can also suffer serious flash flooding as a result of its flat terrain and poor drainage. River Tana is a lifeline in this area. It meanders along its course with the transverse section varying between 400 and 800 m width, equidistant from the river axis. The riverbed has a gentle gradient. Vertical and lateral erosion of the Tana in its lower course has resulted in widening of the valley and consequently numerous meanders along its course. Fast moving water during heavy rains is directed towards the downstream side of the outer bank causing undercutting, while a return flow of water across the bottom of the channel deposits some of the load against the inner bank. There is a constant risk of loss of productive farmland along such incised banks.
The zone faces important water management challenges. It confronts increasing problems of saline water intrusion in aquifers, and of aquifer pollution associated with inappropriate densities of pit-latrine sanitation in urban centres and tourist complexes.
In the Lower Tana coastal zone there is a special need to make a concerted effort into all aspects of groundwater resource management, in view of its critical importance to water supply in the zone and absence of any viable alternatives. Some of the instruments and measures that need to be considered include:
• Investigating and developing all opportunities for the use of local aquifers for artificial recharge, storage, recovery of storm-runoff and any excess riverflows.
• Dune infiltration in the coastal areas – from several sources – so as to safeguard the current and future supply for urban and tourist settlements along the coast. This includes careful engineering of the handling and/or disposal of wastewater at all locations with concentrated domestic wastewater generation, so as to maximise its re-use potential whilst minimizing its polluting impacts.
• Developing opportunities for small-scale surface water storage in the arid landscape, ranging from roof top water harvesting to rock outcrops, ponds, and systematic water harvesting from roads.
• Making best use of the flood based farming – in particular improved recession and tidal plain agriculture, using retention dikes and drains, fingerponds and shallow tubewells.
• Develop a coherent participatory plan for the Tana Delta – where there are various high value landscape functions competing related to biodiversity, rangeland, and commercial agriculture.
• Developing appropriate mechanisms to control the timing and quantity of artificial flood releases from the newly planned reservoirs so as to maintain the valuable downstream eco-systems of the Tana Delta.
• Planting trees and seeding grass to serve as ecosystem stabilizers.
Some of these measures require more sophisticated engineering and larger capital investment, compared to those recommended for the Middle and Upper Tana. These measures appear justified given the high economic value of water in the zone and the fact that it is limiting further development. However, it is important to assess carefully the impact of such interventions on the ecosystem services.
26

27
Box 8: Changing water levels in Tana River (lower catchment)
The Tana River changes course naturally eroding riverbeds on one side while depositing on the other. The water level in the river changes from year to year. This farmer from Maendeleo Farm in Garissa shows what was the water level in 2006, indicated by the colour difference on a wall in his pumping station. The pumping station (figure 20) has been moved several times over the last years as the river keeps changing course.
Figure 21. Garissa, Nasra group farm. Riverside erosion is a big problem in this area. This mango tree, which is over 30 years old, will soon be lost to the river. The owner of this field was expecting to pass his mango business on to his children securing their financial future. Unfortunately, this might be the last year that the fruits can be harvested (photos: MetaMeta).
Figure 20 a, b. Pumping station; Exceptional water levels of Lake Kenyatta, 1997 was an El Nino year

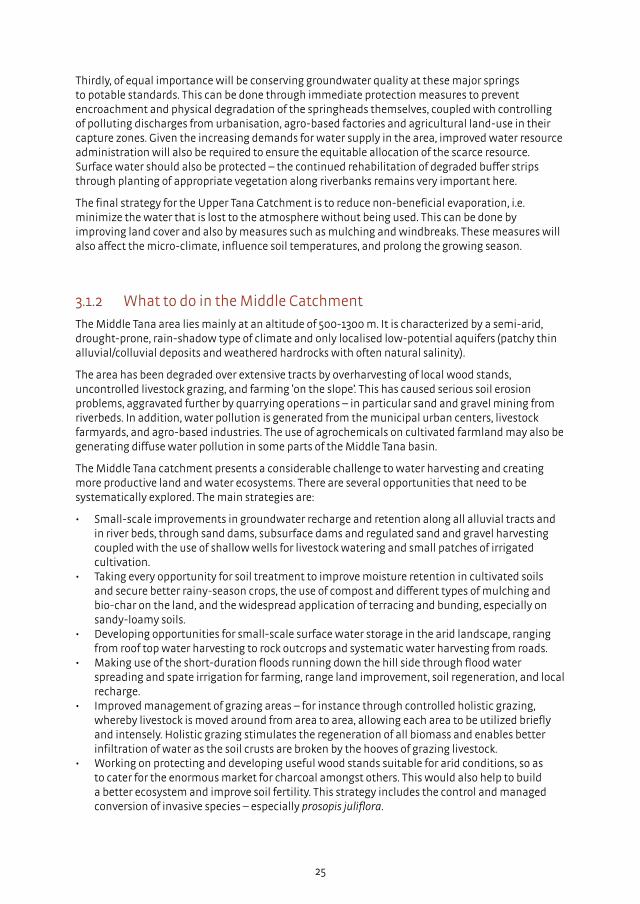
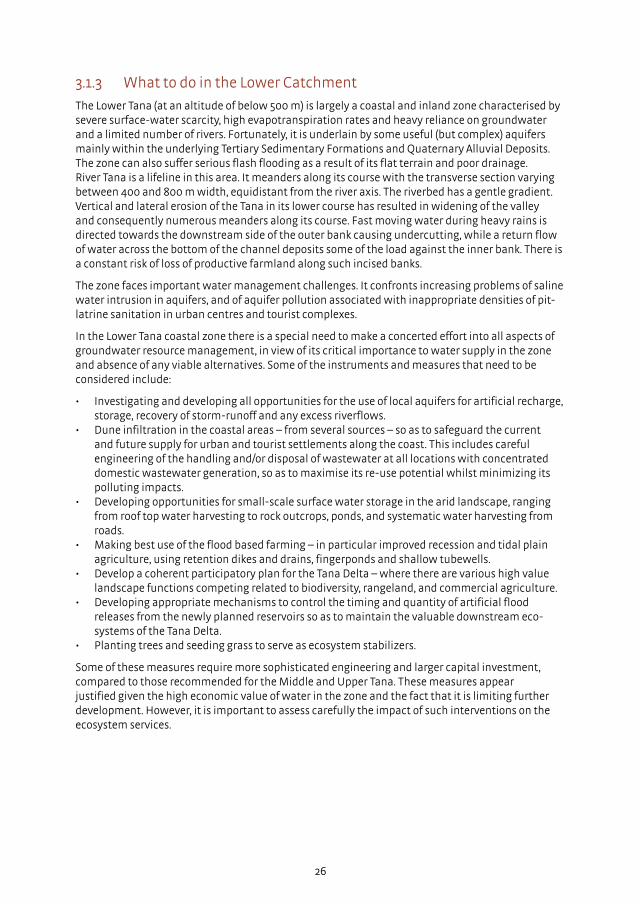
3.1.4 What to do on a slope
In the Tana catchment there are many slopes (mainly in the upper catchment) on which a large variety of potential sustainable land management practices can take place. The overview in table 3 describes the most dominant and resembling physical soil and water conservation measures. It is important to keep in mind that the measures should be designed to fit the land use, slope, soil, construction material, rainfall, farming system, etc. If they are not applied in view of these specifications, they tend to aggravate erosion and land degradation.
28
Aquifer Unit Recommendations
Main Merti • Reduce hardness by chemical softening or ion exchange • Drilling should not go through the fresh aquifer into the saline layers at
greater depths
Alluviums • Sealing of the saline aquifers during drilling • Modified pumping patterns • Freshwater infection barriers • Physical subsurface barriers. Options include driving sheet pile, installing a
clay trench • Hardness can be reduced by chemical softening
Tana • Reduce over pumping at one point of the river to reduce up coning
Table 2. Managing groundwater quality in the Lower Tana
(Source: Earth Water, 2009)

29
Tabl
e 3.
Wh
at to
do
on a
slo
pe: p
oten
tial
su
stai
nab
le la
nd
man
agem
ent p
ract
ices
Tech
nol
ogy
Lan
d u
seSl
ope
Soil
Mat
eria
l of
con
stru
ctio
nD
ista
nce
b/n
bu
nds
Tech
nol
ogie
s th
at n
eed
to b
e in
corp
orat
ed/
inte
grat
ed w
ith
Lim
itat
ion
sR
emar
ks
Leve
l soi
l bu
nds
Cou
ld a
lso
be c
alle
d Fa
nya
ch
ini
wh
ich
mea
ns
“th
row
dow
n”;
“F
anya
” mea
ns
“Th
row
” an
d “C
hin
i” m
ean
s “D
own
”
Usu
ally
cu
ltiv
ated
Max
imu
m
20 %
All s
oils
not
co
mm
on o
n
hea
vy b
lack
co
tton
soi
ls -
th
is is
b/c
of
swel
ling
on
wet
tin
g an
d cr
acki
ng
on
dryi
ng.
Wh
ere
ston
e is
not
av
aila
ble:
st
one-
face
d-so
il bu
nd
Dep
ends
on
th
e ve
rtic
al
inte
rval
; on
ge
ntl
e sl
opes
th
ey a
re w
ide;
on
ste
ep
slop
es th
ey
are
clos
er to
ea
ch o
ther
Tren
ches
of
moi
sure
an
d so
il co
nse
rvat
ion
is
nee
ded;
nee
d st
abili
zed
wit
h
suit
able
gra
ss/
legu
me
for f
orag
e -
also
mak
ing
it
prod
uct
ive;
cu
t an
d ca
rry
of th
e gr
ass/
legu
me
than
free
gra
zin
g;
mai
nte
nan
ce
acco
rdin
g to
fan
ya
juu
pri
nci
ple
for
quic
k be
nch
ing
Com
pare
d to
st
one
bun
ds
they
take
mor
e la
nd;
requ
ires
re
gula
r m
ain
ten
ance
; th
e be
nch
ing
spee
d is
low
b/
c de
posi
ted
soil
in th
e u
pper
ch
ann
el
is re
mov
ed fo
r m
ain
tain
ing
and
upg
radi
ng
the
bun
d; to
o cl
ose
spac
ing
take
s u
p la
nd
Vert
ical
inte
rval
(VI)
: fl
exib
le a
nd
qual
ity
orie
nte
d ap
proa
ch:
•Sl
ope
3-8
% V
I = 1
-1.5
m•
Slop
e 8-
15 %
VI =
1-2
m•
Slop
e 15
-20
% V
I = 1.
5-2.
5 m
(on
ly e
xcep
tion
al c
ases
-
rein
forc
ed)
(Cau
tion
: soi
l bu
nds
> 1
5 %
to
max
20
% o
nly
if s
pace
re
duce
d an
d w
ith
tran
ch,
shor
t bu
nds
abo
ve 1
5 %
be
tter
app
ly s
ton
efac
ed
or s
ton
e bu
nds
). La
you
t al
ong
the
con
tou
rs u
sin
g lin
e -d
iscu
ss s
paci
ng
wit
h fa
rmer
s an
d in
cas
e of
late
ral s
lope
s tr
y to
m
ain
tain
lin
es a
s st
raig
ht
as p
ossi
ble
by a
pply
ing
rein
forc
emen
ts o
n
depr
essi
on p
oin
ts (t
o av
oid
curv
ing
a lo
t or c
utt
ing
the
plou
gh li
ne)
. Mak
e bu
nd
len
ght m
ax 5
0-80
m (t
he
> th
e sl
ope
the
< th
e le
ngt
h.

30
Tech
nol
ogy
Lan
d u
seSl
ope
Soil
Mat
eria
l of
con
stru
ctio
nD
ista
nce
b/n
bu
nds
Tech
nol
ogie
s th
at n
eed
to b
e in
corp
orat
ed/
inte
grat
ed w
ith
Lim
itat
ion
sR
emar
ks
Gra
ded
soil
bun
d; (T
he
grad
can
var
y fr
om 0
.5 to
1 %
i.e
. 5 to
10
cm
vert
ical
dro
p fo
r eve
ry 1
0 m
te
rrac
e le
ngt
h.)
Cu
ltiv
ated
la
nd
Max
imu
m
20 %
Sam
e as
ab
ove
Wh
ere
ston
e is
not
av
aila
ble.
Sam
e as
ab
ove
Gra
ded
is in
hig
h
rain
fall
area
s or
fo
r soi
ls w
ith
poo
r in
filt
rati
on; n
eed
to
be s
tabi
lized
wit
h
suit
able
gra
ss/
legu
me
for f
orag
e -
also
mak
ing
it
prod
uct
ive;
cu
t an
d ca
rry
of th
e gr
ass/
legu
me
than
free
gr
azin
g;
The
grad
ien
t is
sen
siti
ve
and
diff
icu
lt
to m
ain
tain
it.
Wh
en s
mal
l th
ere
is w
ater
lo
ggin
g an
d w
hen
larg
e er
osio
n/
scou
rin
g oc
curs
. In
tegr
atio
n
wit
h
wat
erw
ays
is a
m
ust
Terr
aces
or b
un
ds a
re li
ke
cou
nto
urs
of t
he
map
. If
you
see
the
con
tou
r on
a
map
in s
teep
er a
reas
they
be
com
e cl
oser
wh
ile o
n
gen
tle
slop
es th
ey b
ecom
e fa
r apa
rt i.
e. fo
r a fi
xed
vert
ical
inte
rval
.
Leve
l fan
ya
Juu
; (Li
tera
l tr
ansl
atio
n:
“Th
row
up”
)
Cu
ltiv
ated
th
e sl
ope
shou
ld n
ot
be to
o st
eep
Max
imu
m
15 %
Dee
p so
ilO
nly
by
soil
nee
d to
be
stab
ilize
d
Sam
e as
ab
ove
Tren
ches
if
moi
stu
re a
nd
soil
con
serv
atio
ns
is
nee
ded;
nee
d to
be
sta
biliz
ed w
ith
su
itab
le g
rass
/le
gum
e fo
r for
age
- al
so m
akin
g it
pr
odu
ctiv
e; c
ut a
nd
carr
y of
the
gras
s/le
gum
e th
an fr
ee
graz
ing;
Not
pos
sibl
e on
st
eep
slop
es;
can
not
be
cros
sed
by
lives
tock
; mor
e
labo
ur b
/c
thro
win
g th
e so
il u
p; c
lose
sp
acin
g ta
kes
up
lan
d
Com
pare
d to
con
ven
tion
al
soil
bun
ds m
enti
oned
ab
ove
they
take
less
lan
d
31
Tech
nol
ogy
Lan
d u
seSl
ope
Soil
Mat
eria
l of
con
stru
ctio
nD
ista
nce
b/n
bu
nds
Tech
nol
ogie
s th
at n
eed
to b
e in
corp
orat
ed/
inte
grat
ed w
ith
Lim
itat
ion
sR
emar
ks
Gra
ded
Fan
ya
Juu
Sam
e as
ab
ove
Max
imu
m
15 %
Dee
p so
ilO
nly
by
soil
bun
d n
eed
to
be s
tabi
lized
Sam
e as
ab
ove
Bio
logi
cal
stab
iliza
tion
; fo
dder
sou
rce;
in
tegr
atio
n w
ith
a
wat
erw
ay is
a m
ust
Sam
e as
abo
veW
ith
a m
axim
um
gra
dien
t of
1 %
dis
char
ges
exce
ss
run
off g
ener
ated
from
th
e in
ter t
erra
ce s
pace
s to
the
adjo
inin
g n
atu
ral
or a
rtif
icia
l wat
erw
ay a
t a
non
-ero
sive
vel
ocit
y.
Vert
ical
inte
rval
s: fl
exib
le
and
qual
ity
orie
nte
d ap
proa
ch.
•Sl
ope
3-8
% V
I = 1
-1.5
m
•Sl
ope
8-15
% V
I = 1
-2 m
Layo
ut a
lon
g th
e co
nto
urs
bu
t is
1 %
gra
dien
t usi
ng
line
leve
l - d
iscu
ss s
paci
ng
wit
h fa
rmer
s
Ston
e bu
nd.
If
sto
ne
is n
ot
abu
nda
nt t
hen
ca
n b
e st
one-
face
d-so
il bu
nd
All l
and
use
sIn
all
slop
es
wh
ere
soil
bun
ds w
ork
and
beyo
nd
All s
oils
Loca
lly
avai
labl
e st
ones
or
bou
lder
s
Dep
ends
on
th
e ve
rtic
al
inte
rval
ch
osen
Is a
lso
good
for
dest
onin
g fi
elds
; th
e st
one
take
s le
ss
spac
e co
mpa
red
to s
oil b
un
ds a
nd
fan
ya ju
u;
In lo
w
tem
pera
ture
ar
eas
cou
ld
har
bor r
oden
ts;
freq
uen
t m
ain
ten
ance
an
d at
ten
dan
ce
nee
ded
as
it c
ann
ot b
e st
abili
zed
wit
h
plan
ts; n
eed
to s
top
free
m
ovem
ent o
f liv
esto
ck
Avoi
d ro
un
d st
ones
(riv
er
ston
es);.
fou
ndt
ion
is
requ
ired
. Pla
ce b
igge
r st
ones
on
the
low
er s
ide
and
smal
ler o
nes
on
the
upp
er s
ide;
ther
e is
no
nee
d to
mak
e it
gra
ded
b/c
exce
ss w
ater
can
eit
her
in
filt
rate
of h
ave
a ch
ance
to
pas
s th
rou
gh th
e st
one
itse
lf.

32
Tech
nol
ogy
Lan
d u
seSl
ope
Soil
Mat
eria
l of
con
stru
ctio
nD
ista
nce
b/n
bu
nds
Tech
nol
ogie
s th
at n
eed
to b
e in
corp
orat
ed/
inte
grat
ed w
ith
Lim
itat
ion
sR
emar
ks
Cu
t-of
f dra
in
- di
sch
arge
s w
ater
to th
e w
ater
way
. In
dry
are
as
it c
an a
ct a
s in
filt
rati
on/
wat
er
rete
nti
on
ditc
h.
In a
ll la
nd
use
s; b
ut
con
stru
cted
b/
n tw
o di
ffer
ent
lan
d u
ses
or
slop
e br
eaks
0.5
to 1
%
grad
ien
t (b
ut d
one
acrr
oss
al
the
nat
ura
l sl
opes
)
All s
oils
Soil
dug
and
the
ditc
h
is u
sed
as
a dr
ain
age
stru
ctu
re
wh
ile th
e di
ke a
s em
ban
kmen
t pr
otec
tion
in
cas
e of
ov
erto
ppin
g
Dep
ends
on
th
e de
nsi
ty o
f sl
ope
brea
ks
and
chan
ge in
la
nd
use
.
Stab
ilizi
ng
the
emba
nkm
ent/
dike
w
ith
pla
nts
; apr
on
or d
rop
stru
ctu
re
is n
eede
d at
the
outl
et; e
xper
t/en
gin
eer d
esig
ned
-
nee
d es
tim
atio
n
of p
eak
run
off
Eros
ion
risk
at
the
outl
et d
ue
to im
prop
er
atte
nti
on fo
r pr
ovis
ion
of
drop
str
uct
ure
s.
See
page
84
the
gree
n
guid
elin
e pa
rt I
for
mor
e de
tail
and
desi
gn
proc
edu
res.
Wh
en
com
pare
d to
the
wat
erw
ays
its
shap
e is
usu
ally
dee
per a
nd
nar
row
er.
Wat
erw
ay -
ca
n re
ceiv
e ex
cess
wat
er/
run
off f
rom
cu
toff
dra
in
and
grad
ed
terr
aces
Alon
g th
e n
atu
ral o
r ar
tifi
cial
w
ater
way
(c
an b
e co
nst
ruct
ed
by a
djoi
nin
g m
ix o
f on
e or
mor
e la
nd
use
s)
All s
lope
s b/
c it
follo
ws
nat
ura
l sl
ope
All s
oils
(can
be
gras
s/so
d pa
ved
or
ston
e pa
ved)
Dep
ends
on
th
e in
ten
sity
of
run
off;
if n
atu
ral
wat
erw
ay
is e
nou
gh
or n
eed
of
arti
fici
al
wat
erw
ay
depe
ndi
ng
of ru
nof
f qu
anti
ty
The
chan
nel
bed
an
d th
e si
de s
hou
ld
be s
tabi
lized
w
ith
veg
etat
ion
; pi
tch
ing
requ
ired
de
pen
din
g on
slo
pe a
nd
vege
tati
on c
over
. Fo
r hig
her
slo
pe
drop
str
uct
ure
s ar
e n
eede
d
No
limit
atio
n,
how
ever
, on
ar
tifi
cial
ly
con
stru
cted
on
e m
ore
stab
iliza
tion
ef
fort
is
nee
ded.
Can
be
calle
d n
atu
ral
wat
erw
ay o
r art
ific
ial
wat
erw
ay. I
ts s
hap
e is
u
sual
ly s
hal
low
an
d w
ider
. Se
e pa
ge 8
3 th
e gr
een
(par
t I)
of th
e gu
idel
ine
for m
ore
deta
il.
33
Tech
nol
ogy
Lan
d u
seSl
ope
Soil
Mat
eria
l of
con
stru
ctio
nD
ista
nce
b/n
bu
nds
Tech
nol
ogie
s th
at n
eed
to b
e in
corp
orat
ed/
inte
grat
ed w
ith
Lim
itat
ion
sR
emar
ks
Gra
ss s
trip
sAl
l lan
d u
sers
Gen
tle
slop
es u
p to
8
%
All s
oils
By
leav
ing
un
plou
ghed
st
rip
or
plan
tin
g gr
asse
s al
ong
the
con
tou
r st
rip
Dep
ends
on
th
e ve
rtic
al
inte
rval
; b/c
it
is m
ade
on
gen
tly
slop
es
com
pare
d w
ith
oth
er
stru
ctu
res
it
is a
str
uct
ure
w
ith
hig
her
sp
acin
g
Ster
ile g
rass
that
do
not
exp
and
side
way
s is
re
quir
ed
Not
use
d on
ste
eper
sl
opes
; far
mer
s re
luct
ant t
o le
ave
a st
rip
of
lan
d
It c
an g
radu
ally
dev
elop
in
to s
tabi
lized
bu
nds
Ben
ch
terr
acin
gC
ult
ivat
ed
fiel
ds a
nd
un
use
d st
eep
hill
side
s
On
ave
rage
12
- 5
8 %
co
nsi
deri
ng
the
vari
ous
lan
d u
se
type
s (c
erea
l, fr
uit
, et
c.).
Dee
p so
ilsC
an b
e re
info
rced
w
ith
sto
ne
but s
oil
stab
ilize
d w
ith
ve
geta
tion
b/c
it is
co
nst
ruce
d on
st
eepe
r slo
pes
the
spac
e b/
n
is s
mal
ler
Ban
k st
abili
zati
on
inw
ard;
ou
twar
d sl
opin
g de
pen
din
g on
run
off;
good
for
pere
nn
ial c
rops
on
st
eep
slop
es
Hea
vy l
abou
r n
eede
d;Fo
ur s
teps
are
nee
ded:
1. p
eg th
e te
rrac
e
2. r
emov
e th
e to
p so
il an
d h
eap
at th
e ce
nte
r
3. c
ut a
nd
fill
4. r
epla
ce b
ack
the
top
soil;
It c
an b
e co
nst
ruct
ed
as ‘r
adia
l ter
race
’ or
‘pro
gres
sive
’ ter
race
de
pen
din
g on
spe
ed
nee
ded
and
labo
ur
avai
labi
lity.
See
pag
e 11
7 on
th
e gr
een
boo
k.

34
Tech
nol
ogy
Lan
d u
seSl
ope
Soil
Mat
eria
l of
con
stru
ctio
nD
ista
nce
b/n
bu
nds
Tech
nol
ogie
s th
at n
eed
to b
e in
corp
orat
ed/
inte
grat
ed w
ith
Lim
itat
ion
sR
emar
ks
Ch
eckd
ams
All l
and
use
sAl
l slo
pes,
h
owev
er,
gulli
es a
re
mor
e pr
one
afte
r th
e fo
ot s
lope
s an
d do
wn
ly
ing
area
s
All s
oils
; U
-typ
e;
V-ty
pe; a
nd
trap
ezoi
dal
type
de
pen
din
g on
the
resi
stan
ce o
f u
pper
str
ata
to th
e lo
wer
st
arat
a
Ston
e ch
eckd
am;
gabi
on
chec
kdam
;
Gab
ion
fille
d w
ith
pla
ctic
an
d so
il;
bru
shw
ood
chec
kdam
; liv
e ch
eckd
am
The
hig
her
th
e ch
eckd
am
hei
ght t
he
furt
her
apa
rt
chec
kdam
s ca
n b
e sp
aced
; h
owev
er:
gully
spa
cin
g is
1.2
H/s
lope
; w
her
e H
is
chec
kdam
h
eigh
t an
d sl
ope
in
deci
mal
Bio
logi
cal
stab
iliza
tion
is
a m
ust
; are
a cl
osu
re o
f fen
cin
g;
mai
nte
nan
ce;
ben
efit
sh
arin
g m
ech
anis
m a
s u
sual
ly g
ulli
es
are
loca
ted
eith
er
at b
oun
dari
es
or c
omm
un
al
own
ersh
ip
Nee
d of
upp
er
catc
hm
ent
trea
tmen
t is
a m
ust
; it
is h
eavy
in
vest
men
t re
quir
ing
hu
ge
labo
ur
See
the
Gu
idel
ine
Hill
side
te
rrac
ing
On
de
grad
ed
lan
ds; f
ores
t la
nds
; gr
azin
g la
nds
; co
mm
un
al
graz
ing
lan
ds
Stee
p h
illsi
des (
20-
50 %
Shal
low
soi
ls
usu
ally
< 2
5; <
50
cm
dep
th
Usu
ally
sto
ne;
ro
nk
and
bou
lder
s;
if s
ton
e is
a
limit
atio
n
then
sto
ne-
face
d-so
il bu
nd
2-3
m v
erti
cal
inte
rval
an
d di
stan
ce
b/n
hill
side
te
rrac
es 2
m
Can
be
com
bin
ed
wit
h tr
ench
es fo
r m
aixm
um
run
off
har
vest
ing;
b/n
te
rrac
es p
itti
ng
and
plan
tin
g; a
rea
clos
ure
; avo
id fr
ee
graz
ing
and
cut
and
carr
y
Hea
vy l
abou
r;
area
clo
sure
is
a m
ust
Vert
ical
inte
rval
(VI)
: 2-3
m
; hei
ght o
r sto
ne
rise
r:
min
0.5
m (r
ange
0.5
-0.7
5 m
)
Wid
th o
f ter
race
: min
1.5
m
(ran
ge 1
.5-2
m)
Fou
nd
atio
n: 0
.3 m
dep
th x
0.
3 m
wid
th fo
un
dati
on
Gra
de
of s
ton
e ri
ser:
wel
l pl
aced
sto
ne
wal
l (gr
ade
1 h
oriz
onta
l to
3 ve
rtic
al);
In lo
wer
rain
fall
area
s (m
ost c
ases
) hill
side
te
rrac
e h
ave
5-10
%
grad
ien
t bac
k sl
ope

35
Tech
nol
ogy
Lan
d u
seSl
ope
Soil
Mat
eria
l of
con
stru
ctio
nD
ista
nce
b/n
bu
nds
Tech
nol
ogie
s th
at n
eed
to b
e in
corp
orat
ed/
inte
grat
ed w
ith
Lim
itat
ion
sR
emar
ks
Ch
eckd
ams
All l
and
use
sAl
l slo
pes,
h
owev
er,
gulli
es a
re
mor
e pr
one
afte
r th
e fo
ot s
lope
s an
d do
wn
ly
ing
area
s
All s
oils
; U
-typ
e;
V-ty
pe; a
nd
trap
ezoi
dal
type
de
pen
din
g on
the
resi
stan
ce o
f u
pper
str
ata
to th
e lo
wer
st
arat
a
Ston
e ch
eckd
am;
gabi
on
chec
kdam
;
Gab
ion
fille
d w
ith
pla
ctic
an
d so
il;
bru
shw
ood
chec
kdam
; liv
e ch
eckd
am
The
hig
her
th
e ch
eckd
am
hei
ght t
he
furt
her
apa
rt
chec
kdam
s ca
n b
e sp
aced
; h
owev
er:
gully
spa
cin
g is
1.2
H/s
lope
; w
her
e H
is
chec
kdam
h
eigh
t an
d sl
ope
in
deci
mal
Bio
logi
cal
stab
iliza
tion
is
a m
ust
; are
a cl
osu
re o
f fen
cin
g;
mai
nte
nan
ce;
ben
efit
sh
arin
g m
ech
anis
m a
s u
sual
ly g
ulli
es
are
loca
ted
eith
er
at b
oun
dari
es
or c
omm
un
al
own
ersh
ip
Nee
d of
upp
er
catc
hm
ent
trea
tmen
t is
a m
ust
; it
is h
eavy
in
vest
men
t re
quir
ing
hu
ge
labo
ur
See
the
Gu
idel
ine
Vari
ous
tren
ches
Deg
rade
d h
illsi
des
Max
imu
m
of 1
00 %
Soils
of g
ood
infi
ltra
tion
w
hic
h
oth
erw
ise
the
wat
er
cou
ld b
e lo
st to
ev
apor
atio
n;
nee
d so
me
50 c
m o
f top
so
il to
be
appl
ied
Wit
h th
e so
il av
aila
ble
on
the
lan
d
800
to 1
200
per h
ecta
reC
an b
e co
mbi
ned
w
ith
oth
er
mea
sure
s su
ch a
s h
illsi
de te
rrac
es,
ston
e bu
nds
, an
d tr
ench
es b
ased
u
pon
soi
l, sl
ope
and
ston
ines
s.
Can
als
o be
ap
plie
insi
de la
rge
gully
are
as fo
r tre
e pl
anti
ng
labo
ur
inte
nsi
veFo
r mor
e in
tegr
atio
n
requ
irem
ents
, lay
out a
nd
desi
gn s
ee th
e G
uid
elin
e
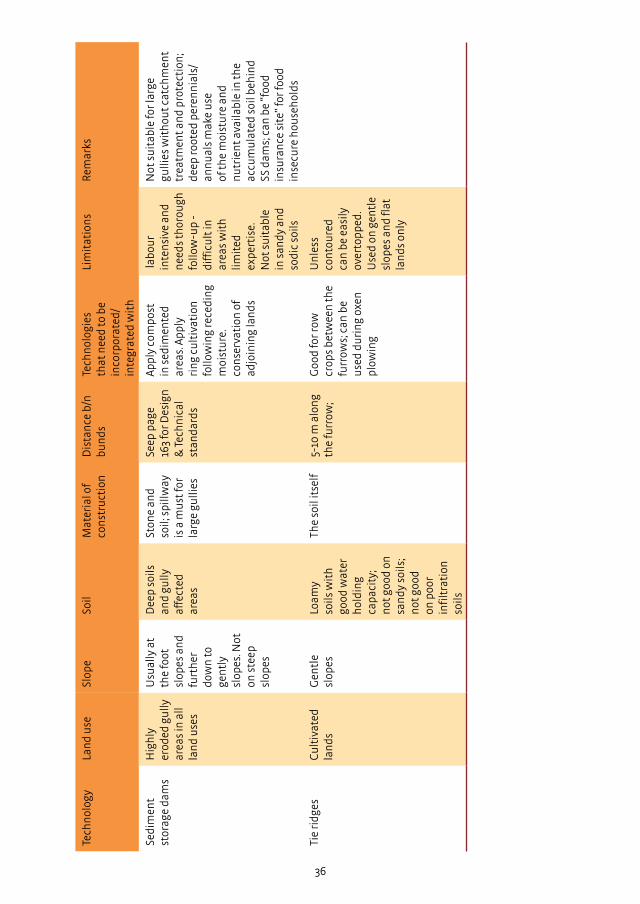
36
Tech
nol
ogy
Lan
d u
seSl
ope
Soil
Mat
eria
l of
con
stru
ctio
nD
ista
nce
b/n
bu
nds
Tech
nol
ogie
s th
at n
eed
to b
e in
corp
orat
ed/
inte
grat
ed w
ith
Lim
itat
ion
sR
emar
ks
Sedi
men
t st
orag
e da
ms
Hig
hly
er
oded
gu
lly
area
s in
all
lan
d u
ses
Usu
ally
at
the
foot
sl
opes
an
d fu
rth
er
dow
n to
ge
ntl
y sl
opes
. Not
on
ste
ep
slop
es
Dee
p so
ils
and
gully
af
fect
ed
area
s
Ston
e an
d so
il; s
pillw
ay
is a
mu
st fo
r la
rge
gulli
es
Seep
pag
e 16
3 fo
r Des
ign
&
Tec
hn
ical
st
anda
rds
Appl
y co
mpo
st
in s
edim
ente
d ar
eas.
App
ly
rin
g cu
ltiv
atio
n
follo
win
g re
cedi
ng
moi
stu
re.
con
serv
atio
n o
f ad
join
ing
lan
ds
labo
ur
inte
nsi
ve a
nd
nee
ds th
orou
gh
follo
w-u
p -
diff
icu
lt in
ar
eas
wit
h
limit
ed
expe
rtis
e.
Not
su
itab
le
in s
andy
an
d so
dic
soils
Not
su
itab
le fo
r lar
ge
gulli
es w
ith
out c
atch
men
t tr
eatm
ent a
nd
prot
ecti
on;
deep
root
ed p
eren
nia
ls/
ann
ual
s m
ake
use
of
the
moi
stu
re a
nd
nu
trie
nt a
vaila
ble
in th
e ac
cum
ula
ted
soil
beh
ind
SS d
ams;
can
be
“foo
d in
sura
nce
sit
e” fo
r foo
d in
secu
re h
ouse
hol
ds
Tie
ridg
esC
ult
ivat
ed
lan
dsG
entl
e sl
opes
Loam
y so
ils w
ith
go
od w
ater
h
oldi
ng
capa
city
; n
ot g
ood
on
san
dy s
oils
; n
ot g
ood
on p
oor
infi
ltra
tion
so
ils
The
soil
itse
lf5-
10 m
alo
ng
the
furr
ow;
Goo
d fo
r row
cr
ops
betw
een
the
furr
ows;
can
be
use
d du
rin
g ox
en
plow
ing
Un
less
co
nto
ure
d ca
n b
e ea
sily
ov
erto
pped
. U
sed
on g
entl
e sl
opes
an
d fl
at
lan
ds o
nly

37
Figure 22 a, b, c. Examples of what to do on a slope: a cut-off drain (a); a grassed waterway (b); bench terraces (c) (photos: Bancy Mati)
4 Ecosystem management techniques
Introduction
Table 4 gives an overview of the different ecosystem management techniques important to the Tana Basin. Many of these techniques are applied but not widespread – and there is enormous scope to upscale their usage. Other techniques are time-tested in other parts of the world with similar conditions, yet unknown in the Tana Catchment.
In this chapter, the techniques are described in greater detail – including insights into the practicality of their application and an assessment of their costs and benefits. This is meant to contribute to the work of the Water Resource Users Associations and all others who work on ecosystem management in the Tana Basin.
The selection of techniques, of course, is very much based on the priority of those that live in the area: women (who are the main resource users), men and local organizations (formal and informal). The overview describes for each technique which of the different geographic parts of the Tana Basin – the Upper, Middle and Lower Catchment – it is suitable for. It also describes whether the technique has an important impact on reducing erosion and maintaining soil fertility; on the recharge, retention and reuse of water essentially to create healthy buffers; on micro-climate (including soil temperature) and on water quality. The techniques deal with both high potential uplands (reference is made to table 3 for instance that gives an overview of what to do on a slope) as well as the semi-arid and arid midlands and lowlands of the Tana catchment.
On several occasions, the point has been made that it is important to implement ecosystem management at scale. What is important is the entire transformation of landscapes: not piecemeal interventions that do not add up. If landscapes are transformed at scale, many processes change with it: the hydrology, the sedimentation processes, the micro-climates, the soil chemistry and nutrient cycle, and the regeneration of vegetation cover. Also by working at scale, side-effects can be better managed both locally and downstream. Most importantly, with scale comes the transformation of lives and economies.
Categories
The techniques in this chapter are divided into four categories. Firstly, a range of interventions is discussed that enhances soil moisture. They focus on techniques applied at the watershed level. Subsequently, measures to recharge shallow groundwater are discussed. Thirdly, a range of techniques is highlighted that help store surface water and make beneficial use of floods. The last part of this chapter is dedicated to a range of agronomic measures and improved forestry practices. Many of these measures have multiple benefits: they may improve moisture or water storage and, at the same time, help reduce land degradation or improve micro-climates.
At the beginning of each case, the main category as well as the geographical suitability are indicated by the symbols as shown in figure 23.
38

39
Figure 23. The symbols used in this book refer to the four categories and the geographical suitability
A Soil moisture storage
Shallow groundwater recharge
Surface water storage & Beneficial use of floods
Agronomic measures & improved forestry practicesD
C
B
U
M
L
Upper Tana
Middle Tana
Lower Tana
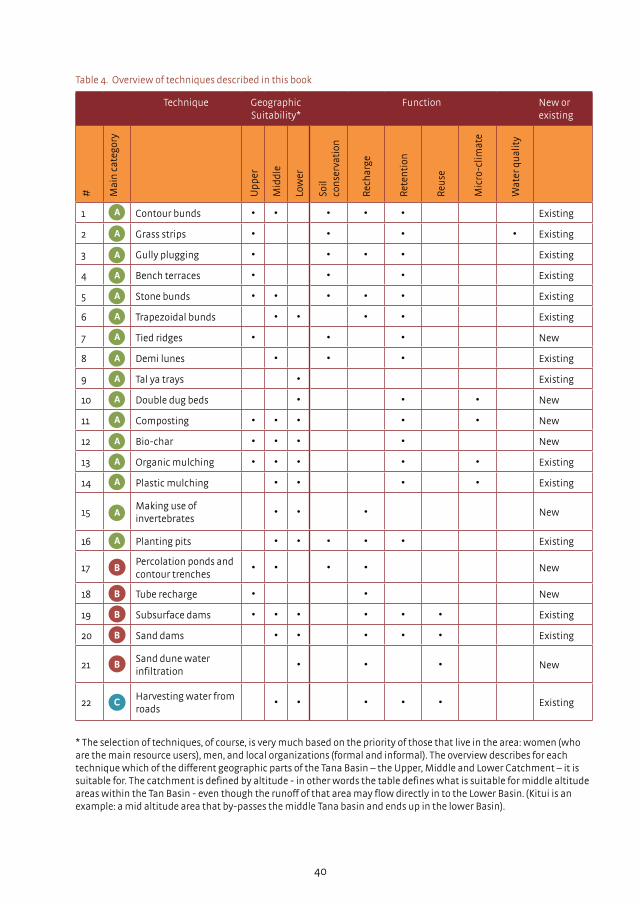
40
Technique Geographic Suitability*
Function New or existing
# Mai
n c
ateg
ory
Upp
er
Mid
dle
Low
er
Soil
con
serv
atio
n
Rec
har
ge
Ret
enti
on
Reu
se
Mic
ro-c
limat
e
Wat
er q
ual
ity
1 Contour bunds • • • • • Existing
2 Grass strips • • • • Existing
3 Gully plugging • • • • Existing
4 Bench terraces • • • Existing
5 Stone bunds • • • • • Existing
6 Trapezoidal bunds • • • • Existing
7 Tied ridges • • • New
8 Demi lunes • • • Existing
9 Tal ya trays • Existing
10 Double dug beds • • • New
11 Composting • • • • • New
12 Bio-char • • • • New
13 Organic mulching • • • • • Existing
14 Plastic mulching • • • • Existing
15Making use of invertebrates
• • • New
16 Planting pits • • • • • Existing
17Percolation ponds and contour trenches
• • • • New
18 Tube recharge • • New
19 Subsurface dams • • • • • • Existing
20 Sand dams • • • • • Existing
21Sand dune water infiltration
• • • New
22Harvesting water from roads
• • • • • Existing
A
A
A
A
A
A
A
A
A
A
A
A
A
A
A
A
C
B
B
B
B
B
Table 4. Overview of techniques described in this book
* The selection of techniques, of course, is very much based on the priority of those that live in the area: women (who are the main resource users), men, and local organizations (formal and informal). The overview describes for each technique which of the different geographic parts of the Tana Basin – the Upper, Middle and Lower Catchment – it is suitable for. The catchment is defined by altitude - in other words the table defines what is suitable for middle altitude areas within the Tan Basin - even though the runoff of that area may flow directly in to the Lower Basin. (Kitui is an example: a mid altitude area that by-passes the middle Tana basin and ends up in the lower Basin).
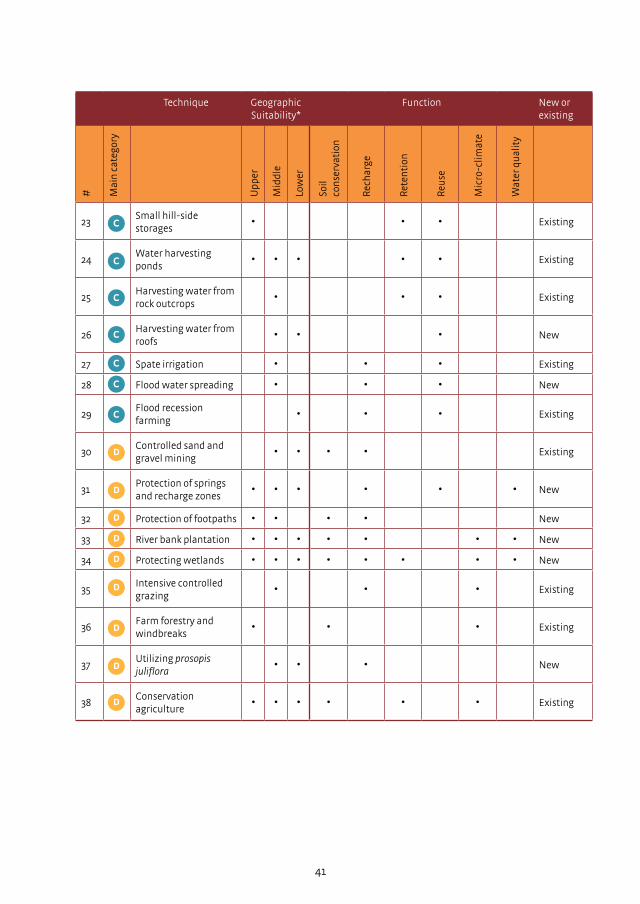
41
Technique Geographic Suitability*
Function New or existing
# Mai
n c
ateg
ory
Upp
er
Mid
dle
Low
er
Soil
con
serv
atio
n
Rec
har
ge
Ret
enti
on
Reu
se
Mic
ro-c
limat
e
Wat
er q
ual
ity
23Small hill-side storages
• • • Existing
24Water harvesting ponds
• • • • • Existing
25Harvesting water from rock outcrops
• • • Existing
26Harvesting water from roofs
• • • New
27 Spate irrigation • • • Existing
28 Flood water spreading • • • New
29Flood recession farming
• • • Existing
30Controlled sand and gravel mining
• • • • Existing
31Protection of springs and recharge zones
• • • • • • New
32 Protection of footpaths • • • • New
33 River bank plantation • • • • • • • New
34 Protecting wetlands • • • • • • • • New
35Intensive controlled grazing
• • • Existing
36Farm forestry and windbreaks
• • • Existing
37Utilizing prosopis juliflora
• • • New
38Conservation agriculture
• • • • • • Existing
C
C
C
C
C
C
C
D
D
D
D
D
D
D
D
D

42
4.1 Contour bunds
Introduction
Contour bunds are a physical measure to control erosion, enhance infiltration and increase yields. Bunds are constructed on hillsides along contours – dividing the slope into several smaller micro-catchments. By slowing down the speed of runoff, water is given time to infiltrate and soil moisture is augmented. Bunds exist in many different designs and have been globally used as a mean of water buffering and soil conservation. Soil bunds, stone bunds, tied ridges, and stone face bunds are some examples of how the basic principles of contour bunds can be applied in many different ways. This section describes some of those principles.
Ecosystem services
Contour bunds help to store water and prevent erosion (both regulating ecosystem services). They also help to maintain the contour lines and thus help preserve the shape of the mountain (cultural service).
Figure 24. Soil bund in red sorghum field (photo: MetaMeta)
A
Provisioning services Regulating services Cultural services
+ Increased crop production - Reduction of arable area
+ Recharge+ Retention+ Erosion control+ Water flow regulation
+ Maintaining the landscape - Obstructing grazing
animals
Supporting services
- May create water-logged soil
U M
Table 5. Ecosystem services of contour bunds

43
Construction
The most common type of contour bunds in Kenya are soil bunds called Fanya juu which literally means “throw it upwards’ in Kiswahili. Soil bunds are generally used on cultivated lands with slopes between 3% and 15% (Desta, Carucci, & Wendem-Agenehu, 2005). The design of the bund and its dimensions depend on climatic conditions and on the amount of water that will need to be intercepted by the bund. The following steps should be followed during the design phase:
• Dimensions of the bunds should be in line with the maximum possible rainfall. • Once the volume of incoming water is known the bund is designed to provide space for it to
spread. The water will be concentrated in the dug out ditch and also above it, against the bund wall.
• The volume of the ditch plus the volume of the section defined by the bund should be equal or bigger than the volume of the water to be stored – preferably with a safety margin for unusual years or intense rainfall events.
• The fact that the bund-ditch will be refilled more than once in one rainy spell has to be taken into account. The number of refills depends on the permeability of the soil.
• Dividing the field area by the length of the bunds gives the space to be maintained between the rows. Often a fixed vertical interval between bunds is followed as constant parameter. Consequently the horizontal distance varies with the slope. If the vertical interval is of 1 m, the horizontal distance will be 10 m and 100 m on slopes of 10% and 1% gradient respectively. (NREGA, 2006).
Dimensioning of bunds is often carried out using rules of thumb and the experience of practitioners. There is a degree of flexibility but during the design a number of point needs to be kept in mind.
• The slope should be measured at several points along the hillside and areas with slopes smaller than 10% should be marked. On steeper slopes the runoff speed increases which poses a risk to the structure. For this reason steeper areas must be treated with various techniques such as trenches.
• Always start constructing the bunds from the upper section of the slope and then work all the way down slope.
• Once the interval between lines is decided, draw a straight line from the top of the field to the bottom.
• Mark the line intervals of this line. • From each demarcation measure and mark the contour lines. • Remove grass from areas where the bunds are to be built. This permits better adhesion to the
ground. • Construct the bunds on the marked contour lines. • Reinforce the bunds and grow vegetation on it (NREGA, 2006).
Table 6. Do’s and don’ts when constructing soil bunds
Do’s Don’ts
Always provide a berm of 30 cm between ditch and bund
Do not start constructing the bunds from the bottom of the slope
Always oversize (say with 20%) to permit the bund soil to settle
On steeps slopes, do not construct bunds closer to each other than 30 m
Exits must be provided in rainy regions and/or impermeable soils
On gentle slopes do not construct bunds further apart than 60 m
On impermeable soils the cross section of the bund should be increased, or the inter-line distance should be decreased.
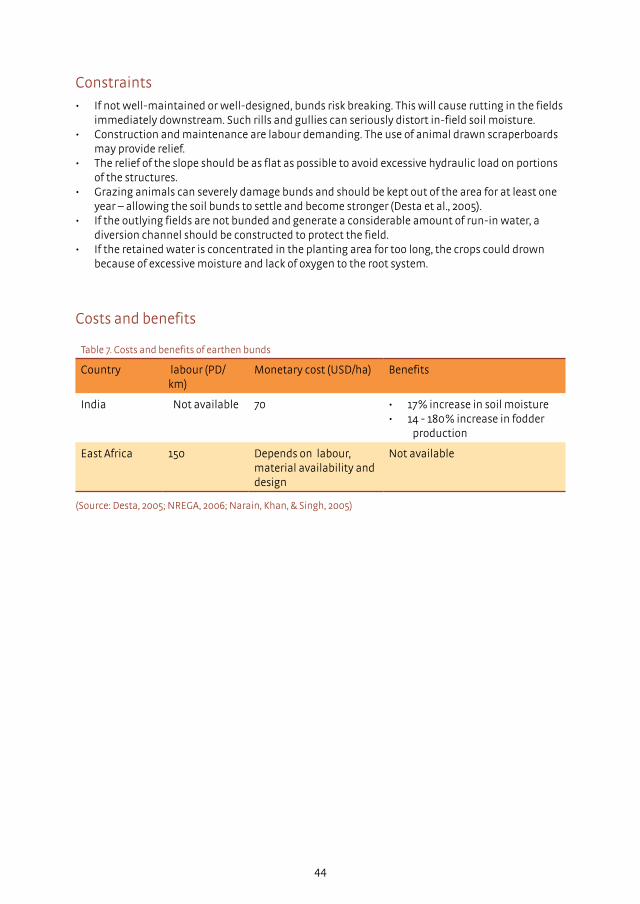
44
Constraints
• If not well-maintained or well-designed, bunds risk breaking. This will cause rutting in the fields immediately downstream. Such rills and gullies can seriously distort in-field soil moisture.
• Construction and maintenance are labour demanding. The use of animal drawn scraperboards may provide relief.
• The relief of the slope should be as flat as possible to avoid excessive hydraulic load on portions of the structures.
• Grazing animals can severely damage bunds and should be kept out of the area for at least one year – allowing the soil bunds to settle and become stronger (Desta et al., 2005).
• If the outlying fields are not bunded and generate a considerable amount of run-in water, a diversion channel should be constructed to protect the field.
• If the retained water is concentrated in the planting area for too long, the crops could drown because of excessive moisture and lack of oxygen to the root system.
Costs and benefits
Table 7. Costs and benefits of earthen bunds
Country labour (PD/km)
Monetary cost (USD/ha) Benefits
India Not available 70 • 17% increase in soil moisture• 14 - 180% increase in fodder
production
East Africa 150 Depends on labour, material availability and design
Not available
(Source: Desta, 2005; NREGA, 2006; Narain, Khan, & Singh, 2005)

45
4.2 Grass strips
Introduction
Grass strips are widely used as vegetative barriers to reduce soil loss and increase infiltration. Grass is grown in alternating strips following contour lines. Depending on the grass used, the strips may provide fodder for livestock as well. Compared to other interventions grass strips can be easily crossed by oxen and ploughs. Grass strips can filter sediment, evacuate excess runoff and can also withstand inundation. They may ultimately form into bench terraces.
Ecosystem services
Grass strips help to store water by increasing infiltration and prevent erosion by reducing soil loss, slowing runoff water and trapping sediment (both regulating ecosystem services). In the upper Tana catchment, grass is used on terrace embankments to provide fodder in zero-grazing areas. This generates income for farmers. In specific cases, grass strips may help reduce damage to crops from insects by providing more attractive feed.
Figure 25. Grass strips and contour furrows to enhance infiltration (photo: Mathias Gurtner, GIZ)
Table 8. Ecosystem services of grass strips
Provisioning services Regulating services Cultural services
+ Fodder production- Reduction of arable area
+ Retention+ Erosion control+ Water flow regulation
+ Facilitation of mixed farming systems
Supporting services
+ Soil formation
A U

Requirements
Grass strips work best in areas with a good amount of rainfall. The technique can be applied on gentle slopes as well as on steep slopes. Preparing grass strips involves relatively modest-labour inputs and basic equipment (e.g. hoes, wires and tree branches.) The grass type chosen should not be too aggressive: it should not expand into adjacent crop land.
Design
Over gentle slopes (below 5o), grass strips slow down the flow causing ponding above the barrier, which encourages infiltration. The maximum slope over which grass strips are still effective is not identified yet (Morgan, 2010), but there are several known examples of grass strips being effective on very steep slopes.
The width of grass strips ranges from 0.5 to 1.5 m (Desta et al, 2005). Permanent vegetation strips (used on steep slopes) range from 2 to 4 m (Morgan, 2010). The interval between the strips depends on the slope: 33 m is common over 3% slopes while a 7 m distance is used over 15% slopes. Since grass strips are usually laid along the contours, the distance between them is dictated by the slope of the land.
Preferably, perennial grasses are planted on the strips. Grass types should be persistent and be able to withstand drought and flood. Suitable species include Napier grass (Pennisetum purpureum), Guatemala grass (Tripsacum laxum), Makarikari grass (Panicum coloratum), Canary grass (Phalaris canariensis), Oat grass (Hyparrhenia spp.), Wheat grass (Agropyron spp.), and Lyme grass (Elymus spp.) (Morgan et al, 2010).
Seedbed preparation is necessary in the case of direct sowing. A depth of 0.5 to 1.5 cm is optimum for most species. The grass seeds should be covered with a thin layer of soil. (Desta, 2005). If grass splittings are used to establish the strips, they should be planted in a staggered way using double or triple rows.
Costs and benefits
Compared to most other erosion control techniques, grass strips require less labour input. Maintenance, however, is important as the grass requires trimming and gap-filling to keep them dense. Table 9 gives an overview of the costs and benefits of establishing them.
Ideally, the value of the grass strips should at least compensate for the loss of the land that would have been otherwise used for agriculture. For instance: vetiver grass (Vetiver zizanioides) is unpalatable and cannot be used for fodder. And yet it has many other advantages: (i) it develops quickly from splits; (ii) it does not compete with adjacent crops; (iii) it can adapt very well to different climatic conditions; and (iv) it is tolerant to heavy metals and saline toxicity (Morgan et al, 2010).
Constraints
• Grass strips are best used in small farms and are less suited to mechanized agriculture. • In dry areas, the capacity of grass strips to retain water is little. Therefore, it is less efficient and
may not grow at all. • Grass strips take up land, which cannot be used for other purposes.
46
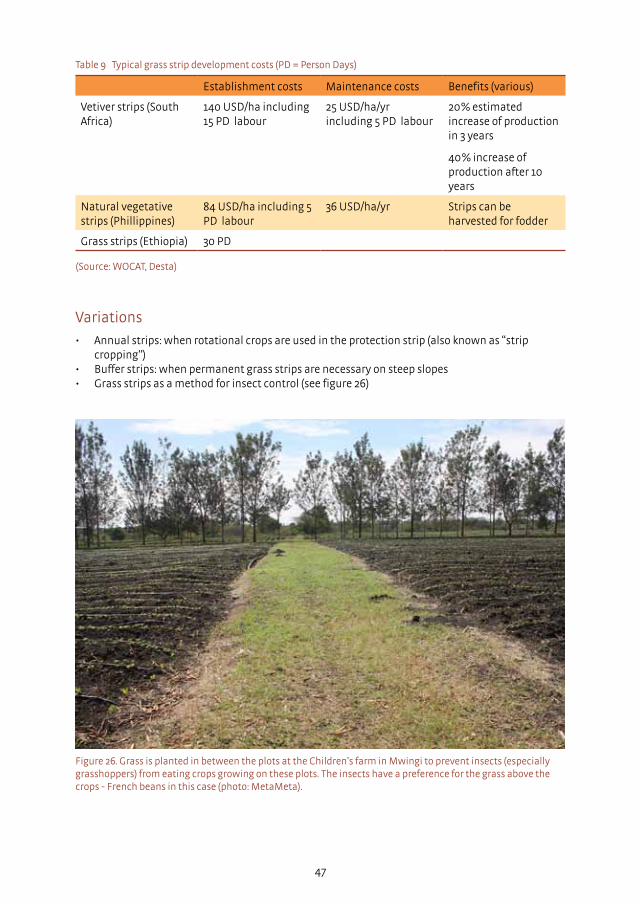
47
Variations
• Annual strips: when rotational crops are used in the protection strip (also known as “strip cropping”)
• Buffer strips: when permanent grass strips are necessary on steep slopes• Grassstripsasamethodforinsectcontrol(seefigure26)
Figure 26. Grass is planted in between the plots at the Children’s farm in Mwingi to prevent insects (especially grasshoppers) from eating crops growing on these plots. The insects have a preference for the grass above the crops - French beans in this case (photo: MetaMeta).
(Source: WOCAT, Desta)
Establishment costs Maintenance costs Benefits (various)
Vetiver strips (South Africa)
140 USD/ha including 15 PD labour
25 USD/ha/yr including 5 PD labour
20% estimated increase of production in 3 years
40% increase of production after 10 years
Natural vegetative strips (Phillippines)
84 USD/ha including 5 PD labour
36 USD/ha/yr Strips can be harvested for fodder
Grass strips (Ethiopia) 30 PD
Table 9 Typical grass strip development costs (PD = Person Days)
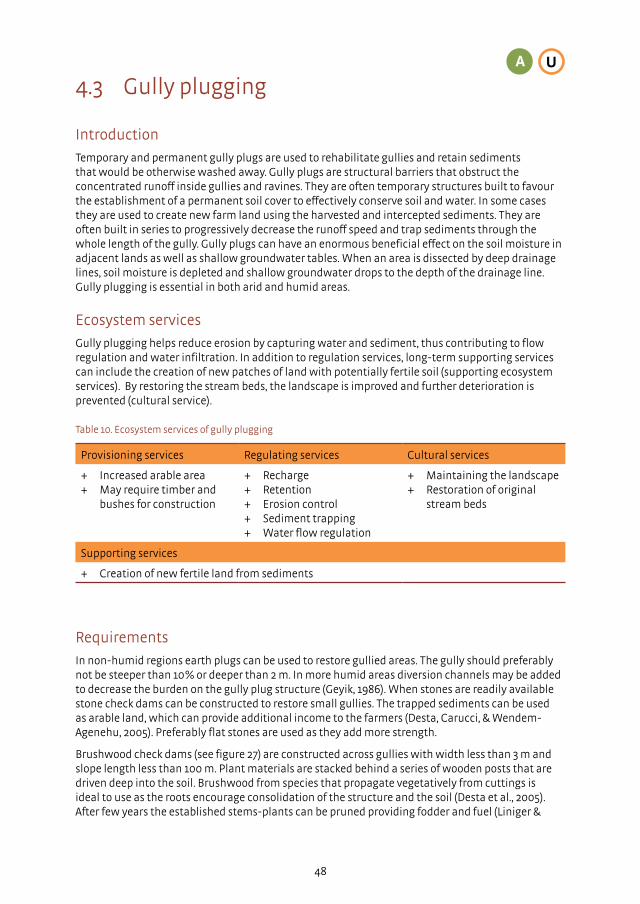
48
4.3 Gully plugging
Introduction
Temporary and permanent gully plugs are used to rehabilitate gullies and retain sediments that would be otherwise washed away. Gully plugs are structural barriers that obstruct the concentrated runoff inside gullies and ravines. They are often temporary structures built to favour the establishment of a permanent soil cover to effectively conserve soil and water. In some cases they are used to create new farm land using the harvested and intercepted sediments. They are often built in series to progressively decrease the runoff speed and trap sediments through the whole length of the gully. Gully plugs can have an enormous beneficial effect on the soil moisture in adjacent lands as well as shallow groundwater tables. When an area is dissected by deep drainage lines, soil moisture is depleted and shallow groundwater drops to the depth of the drainage line. Gully plugging is essential in both arid and humid areas.
Ecosystem services
Gully plugging helps reduce erosion by capturing water and sediment, thus contributing to flow regulation and water infiltration. In addition to regulation services, long-term supporting services can include the creation of new patches of land with potentially fertile soil (supporting ecosystem services). By restoring the stream beds, the landscape is improved and further deterioration is prevented (cultural service).
Provisioning services Regulating services Cultural services
+ Increased arable area+ May require timber and bushes for construction
+ Recharge+ Retention+ Erosion control+ Sediment trapping+ Water flow regulation
+ Maintaining the landscape+ Restoration of original stream beds
Supporting services
+ Creation of new fertile land from sediments
Table 10. Ecosystem services of gully plugging
Requirements
In non-humid regions earth plugs can be used to restore gullied areas. The gully should preferably not be steeper than 10% or deeper than 2 m. In more humid areas diversion channels may be added to decrease the burden on the gully plug structure (Geyik, 1986). When stones are readily available stone check dams can be constructed to restore small gullies. The trapped sediments can be used as arable land, which can provide additional income to the farmers (Desta, Carucci, & Wendem-Agenehu, 2005). Preferably flat stones are used as they add more strength.
Brushwood check dams (see figure 27) are constructed across gullies with width less than 3 m and slope length less than 100 m. Plant materials are stacked behind a series of wooden posts that are driven deep into the soil. Brushwood from species that propagate vegetatively from cuttings is ideal to use as the roots encourage consolidation of the structure and the soil (Desta et al., 2005). After few years the established stems-plants can be pruned providing fodder and fuel (Liniger &
A U

49
Figure 27. Gully plug (photo: MetaMeta)
Critchley, 2007). Once the check dam structure is in place, gully reshaping is required to ease plant establishment.
In case of big gullies a sediment storage and overflow dam can be used. (In China these are called ‘warping dams’). This is a stone-faced earthen dam that traps sediments and creates new farming land. It also acts as a rainwater collector, improving water availability for crops. It can potentially create new land and restore eroded landscapes (Desta et al., 2005).
Design
When constructing a brushwood dam, wooden poles should be planted across the gully at 50-60 cm intervals. The poles, should not rise more than 1 m from the ground level. The posts should have a slight upslope inclination so they can withstand more pressure. Finally, branches are inter-woven around the post-poles. On the sides, the branches should be driven 30-50 cm into the gully banks to improve the stability. Optionally some litter mixed with soil can be placed behind the barrier. The water should be able to slowly percolate through the barrier (Desta et al., 2005).
Stone check dams are constructed with local available stones. The structure should be keyed on the side and on the bottom. • A foundation should be dug 50 cm into the banks. • The dam should be provided with a spillway (Geyik, 1986) • The foundation should include the width of the spillway. • Flat stones are preferred as they add greater strength and are not easily dislocated. The bigger
stones must be used for the crest and the middle section of the dam. • Wing-walls should protect the wings of the dam. Wing-walls depart from the main dam wall

50
and are directed upslope at a 30-45% angle. • An apron should be constructed downstream to
protect the toe of the dam (Desta et al., 2005)
The distance between dams is a critical factor. The length and inclination of the slope between dams determine the runoff speed and its erosive power. The distance between dams also determines the extension of the catchment serving each structure.
For rock dams, it is suggested to place subsequent dams in a way that a hypothetical line drawn from the top of one dam to the foot of the dam immediately upslope has a back-slope angle as shown in figure 28. (Nyssen et al., 2004).
Costs
The amount of construction that can reasonably be done in one person day (PD) is given below:
Table 11. Construction costs gully plugs
Type Labour
Stone check dam 0.5 m³/PD
Brushwood check dam 3 m/PD
Earthen storage and overflow dams 0.75 m³/PD
(Source: Desta, 2005)
Figure 28. Suggested design for rock dams (Source: Nyssen et al., 2004)
Constraints
• The availability of construction material is one of the main constraints. The construction of brushwood dams is sometimes impossible as wooden material is scarce. The same applies to stones. It is always cheaper to prevent gully formation than to restore a gullied landscape.
• Before treating gullies it is mandatory that the catchment area feeding the gully is treated.
Variations
Various additional techniques can be used for reinforcing gully plugs, such as using gabions or wooden logs.
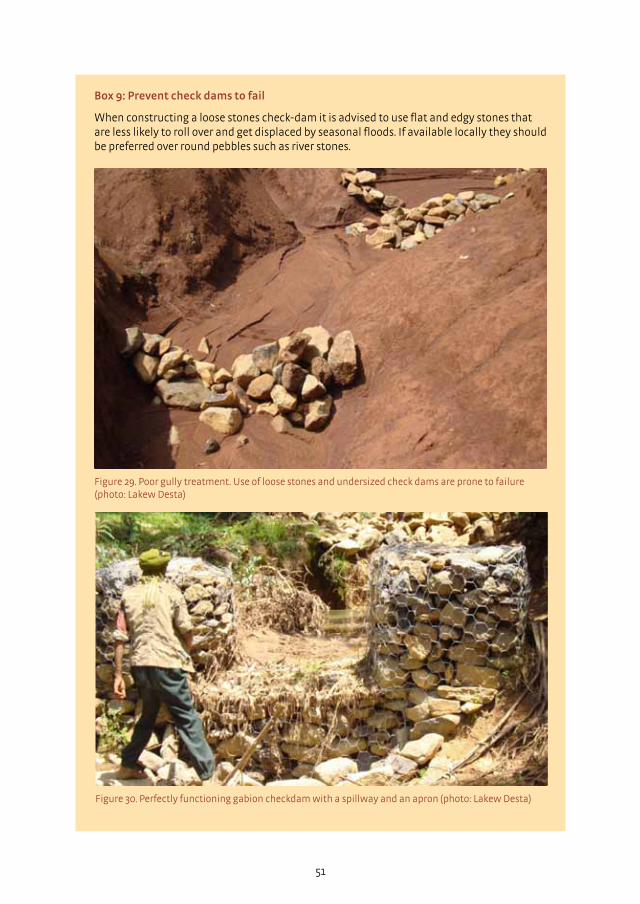
51
Box 9: Prevent check dams to fail
When constructing a loose stones check-dam it is advised to use flat and edgy stones that are less likely to roll over and get displaced by seasonal floods. If available locally they should be preferred over round pebbles such as river stones.
Figure 29. Poor gully treatment. Use of loose stones and undersized check dams are prone to failure (photo: Lakew Desta)
Figure 30. Perfectly functioning gabion checkdam with a spillway and an apron (photo: Lakew Desta)

4.4 Bench terraces
Introduction
Alternating series of ‘shelves’ and ‘risers’ characterize bench terraces (see figure 31). They are usually developed on relatively steep slopes (15-55%) with deep soils that allow this type of landscaping. The alternating flat surfaces are capable of stopping runoff and increasing water stored in the soil profile. In bench terraces the riser is often reinforced with stones and/or vegetation cover.
When the shelf is made slightly inward sloping, water storage increases and soil protection is improved. In arid areas, conservation bench terraces are preferred. In such cases, the distance between terraces is increased and a portion of the sloping land is left to act as catchment area. The runoff generated by the catchment area will nourish the plants placed immediately above the riser wall. This design increases the amount of water available for the plants and reduces erosion.
Ecosystem services
Bench terraces, like contour bunds, help to store water and, by reducing runoff and trapping sediment, prevent erosion (both regulating ecosystem services). They also contribute towards maintaining the contour lines and thus help preserve the shape of the mountain (cultural service).
Figure 31. Bench terraces with maize planted along the contour, banana and a variety of tree species can be seen growing alongside (photo: Mathias Gurtner, GIZ)
52
A U
Provisioning services Regulating services Cultural services
+ Increased crop production - Reduction of arable area
+ Recharge+ Retention+ Erosion control+ Sediment trapping
+ Maintaining the landscape - Obstructing grazing animals
Supporting services
+ Creation of new fertile land from sediments+ Soil formation
Table 12. Ecosystem services of bench terraces

53
Construction
The construction of bench terraces is labour or equipment intensive. The bench terraces have to be laid carefully on the contours – so that the hydraulic pressure is evenly spread. The design starts with a careful survey and pegging of the contour lines. This process can be carried out with an A-frame level or a water tube level. Consequently the cut and fill areas are defined and the excavation is performed. Care is taken to preserve the upper layer of the soil that holds most of the nutrients. The construction must start from the lower level of the field and then proceed upwards. Thereafter the newly created riser can be reinforced with locally available stones. When required, ditches and drains must be dug to dispose excess water.
Conservation bench terraces should be considered as water harvesting techniques, as they allow the generation of additional runoff. They should
Figure 32. Bench terraces for tree and crops cultivation.
Figure 33. Construction phases of bench terraces (source: Lakew Desta)
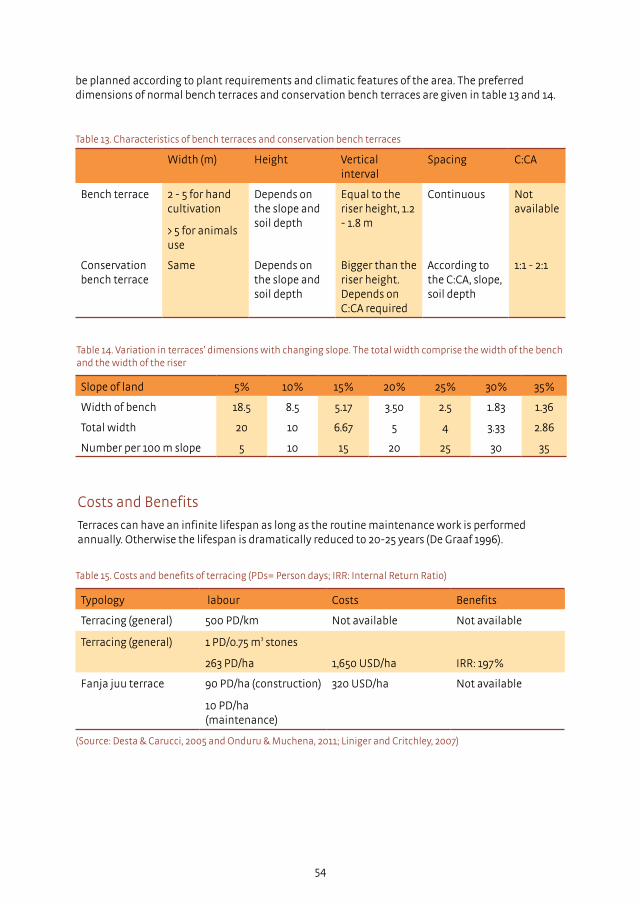
54
Typology labour Costs Benefits
Terracing (general) 500 PD/km Not available Not available
Terracing (general) 1 PD/0.75 m³ stones
263 PD/ha 1,650 USD/ha IRR: 197%
Fanja juu terrace 90 PD/ha (construction)
10 PD/ha (maintenance)
320 USD/ha Not available
(Source: Desta & Carucci, 2005 and Onduru & Muchena, 2011; Liniger and Critchley, 2007)
Table 15. Costs and benefits of terracing (PDs= Person days; IRR: Internal Return Ratio)
Slope of land 5% 10% 15% 20% 25% 30% 35%
Width of bench 18.5 8.5 5.17 3.50 2.5 1.83 1.36
Total width 20 10 6.67 5 4 3.33 2.86
Number per 100 m slope 5 10 15 20 25 30 35
Table 14. Variation in terraces’ dimensions with changing slope. The total width comprise the width of the bench and the width of the riser
Width (m) Height Vertical interval
Spacing C:CA
Bench terrace 2 - 5 for hand cultivation
> 5 for animals use
Depends on the slope and soil depth
Equal to the riser height, 1.2 - 1.8 m
Continuous Not available
Conservation bench terrace
Same Depends on the slope and soil depth
Bigger than the riser height. Depends on C:CA required
According to the C:CA, slope, soil depth
1:1 - 2:1
Table 13. Characteristics of bench terraces and conservation bench terraces
be planned according to plant requirements and climatic features of the area. The preferred dimensions of normal bench terraces and conservation bench terraces are given in table 13 and 14.
Costs and Benefits
Terraces can have an infinite lifespan as long as the routine maintenance work is performed annually. Otherwise the lifespan is dramatically reduced to 20-25 years (De Graaf 1996).

55
Constraints
• If not well stabilized, bench terraces need considerable maintenance work. • If a breach appears in the riser, it should be repaired as fast as possible. It can be exclusively
applied to areas with deep soils and good drainage • Cattle can damage the terraces and the risers, especially in the initial years when the terraces
are not fully stabilized.
Variations
Hillside terraces are used to rehabilitate eroded steep slopes (up to 50%) that lack deep soils. The individual terraces are narrow: between 1.5-2 m in width. Hillside terraces are usually planted with multipurpose trees. They are often combined with trenches that are dug alongside.
Box 10: Tube level
The tube level is a simple and economical tool to measure the gradient of a field. It is also used in watershed programs to layout precisely bunds, terraces and other structures that need to follow the contour lines. To build a tube level, one needs a transparent hose of
minimum 5 m length, two 1 m long wooden rulers and transparent tape. The plastic tube is fixed to the rulers with tape. Its openings should be aligned with the ends of the rulers with the 1-metre mark.
When ready, this tool needs two operators for its operation. If both ends of the tube level are kept at the same level in a flat area, the water mark should be at the same height on both rulers. Following this idea it is easy to demark contour lines. By placing the two rulers on the ground, a
set of consequent points can be found at which the water levels are equal. These points are form the sought contour line.
When the level ends are positioned at two different levels, the water tends to be higher in the lower end of the tube. This excess can be measured and used to estimate the slope of the area in between the ends of the tube level (see figure 34). (NREGA, 2006).
Figure 34. Tube level (Source: Cleveland, 1991)

4.5 Stone bunds
Introduction
Stone bunds are built across slopes to slow down runoff and favour infiltration in the soil. They are built in series running along the slope. The bunds are semi-permeable, allowing the water to flow to the lower fields. The flow is distributed evenly and it decreases the risk of gully formation. Additionally, the stone barrier blocks and settles down the sediments transported from the upper slopes.
Ecosystem services
Stone bunds are a particular type of contour bunds (see also 4.1) and, over time, may develop in terraces (figure 32). Like contour bunds, stone bunds help to store water and prevent erosion (both regulating ecosystem services). They contribute to maintaining the contour lines and restoring barren land. This helps preserve the shape of the mountain (cultural service). In addition, as stones are removed from the agricultural fields for use in constructing the bunds, this land becomes easier to cultivate.
56
A U M
Provisioning services Regulating services Cultural services
+ Increased crop production - Reduction of arable area
+ Recharge+ Retention+ Erosion control+ Sediment trapping+ Water flow regulation
+ Maintaining the landscape - Obstruction for grazing animals
Supporting services
+ Creation of new fertile land from sediments+ Soil formation
Table 16 Ecosystem services of stone bunds
Construction
On steep slopes, stone bunds are mainly used for soil conservation. They reduce the runoff speed and trap the sediments. In general, however, areas with a slope greater than 35% should be avoided (Desta, Carucci, & Wendem-Agenehu, 2005). On gentle slopes, stone bunds are also used for harvesting water for the crops in between the lines, apart from reducing erosion (HP Liniger, Studer, & Hauert, 2011). Stone bunds are suitable for arid and semi-arid areas, but when the soils are well drained they can also be applied in wetter zones. A range of values for bund spacing and (the ideal) corresponding bund heights are given in table 17.
Slope (%) Bund height (m) Distance between lines (m)
<5 0.25 15-30
5 0.5 20
15 0.75 12
25 1 8
(Source: Critchley 1992, Desta 2005)
Table 17. Sugggested height of stone bunds and suggested distance in between
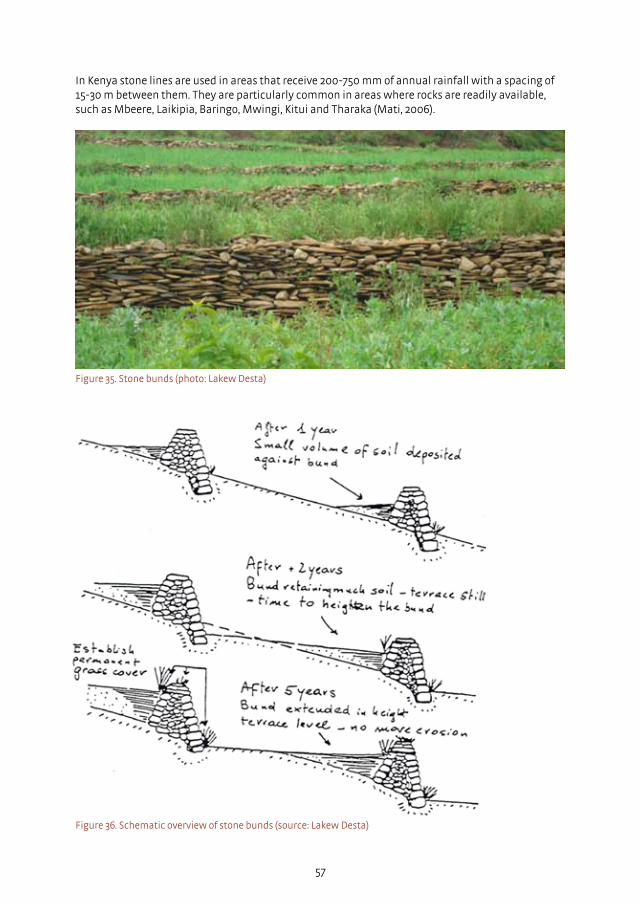
57
Figure 35. Stone bunds (photo: Lakew Desta)
Figure 36. Schematic overview of stone bunds (source: Lakew Desta)
In Kenya stone lines are used in areas that receive 200-750 mm of annual rainfall with a spacing of 15-30 m between them. They are particularly common in areas where rocks are readily available, such as Mbeere, Laikipia, Baringo, Mwingi, Kitui and Tharaka (Mati, 2006).
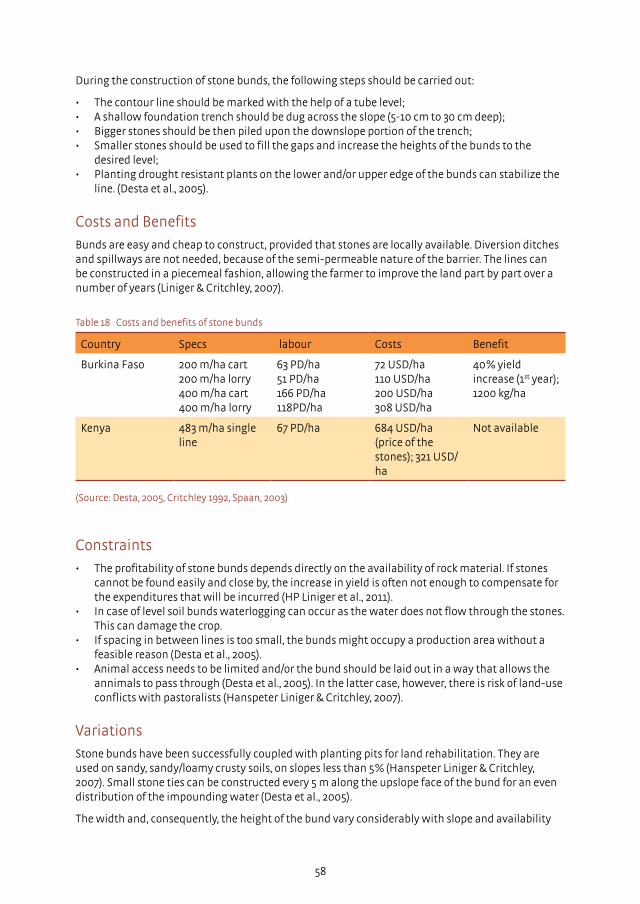
During the construction of stone bunds, the following steps should be carried out:
• The contour line should be marked with the help of a tube level; • A shallow foundation trench should be dug across the slope (5-10 cm to 30 cm deep); • Bigger stones should be then piled upon the downslope portion of the trench; • Smaller stones should be used to fill the gaps and increase the heights of the bunds to the
desired level; • Planting drought resistant plants on the lower and/or upper edge of the bunds can stabilize the
line. (Desta et al., 2005).
Costs and Benefits
Bunds are easy and cheap to construct, provided that stones are locally available. Diversion ditches and spillways are not needed, because of the semi-permeable nature of the barrier. The lines can be constructed in a piecemeal fashion, allowing the farmer to improve the land part by part over a number of years (Liniger & Critchley, 2007).
58
Country Specs labour Costs Benefit
Burkina Faso 200 m/ha cart 200 m/ha lorry400 m/ha cart400 m/ha lorry
63 PD/ha51 PD/ha166 PD/ha118PD/ha
72 USD/ha110 USD/ha200 USD/ha308 USD/ha
40% yield increase (1st year); 1200 kg/ha
Kenya 483 m/ha single line
67 PD/ha 684 USD/ha (price of the stones); 321 USD/ha
Not available
(Source: Desta, 2005, Critchley 1992, Spaan, 2003)
Table 18 Costs and benefits of stone bunds
Constraints
• The profitability of stone bunds depends directly on the availability of rock material. If stones cannot be found easily and close by, the increase in yield is often not enough to compensate for the expenditures that will be incurred (HP Liniger et al., 2011).
• In case of level soil bunds waterlogging can occur as the water does not flow through the stones. This can damage the crop.
• If spacing in between lines is too small, the bunds might occupy a production area without a feasible reason (Desta et al., 2005).
• Animal access needs to be limited and/or the bund should be laid out in a way that allows the annimals to pass through (Desta et al., 2005). In the latter case, however, there is risk of land-use conflicts with pastoralists (Hanspeter Liniger & Critchley, 2007).
Variations
Stone bunds have been successfully coupled with planting pits for land rehabilitation. They are used on sandy, sandy/loamy crusty soils, on slopes less than 5% (Hanspeter Liniger & Critchley, 2007). Small stone ties can be constructed every 5 m along the upslope face of the bund for an even distribution of the impounding water (Desta et al., 2005).
The width and, consequently, the height of the bund vary considerably with slope and availability
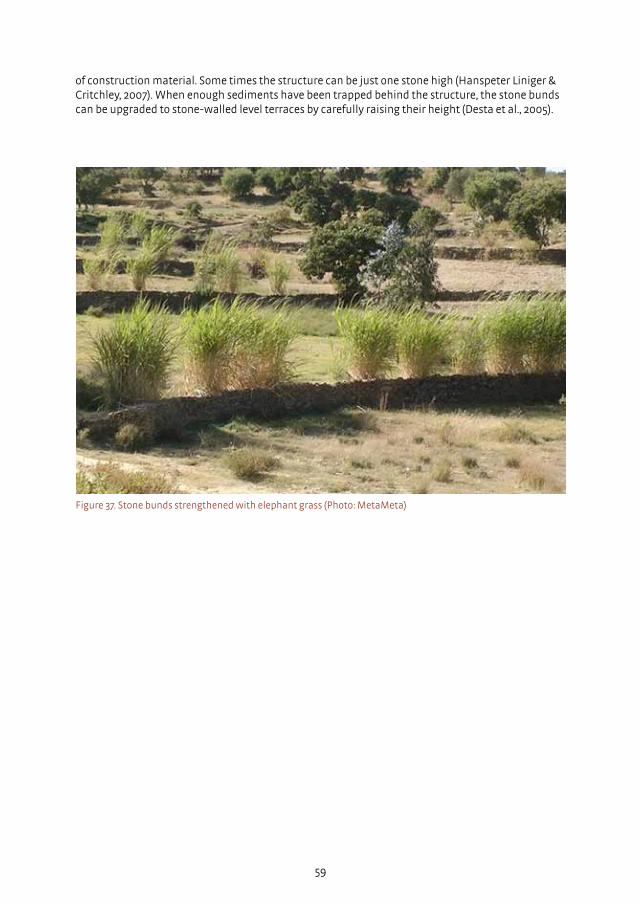
59
of construction material. Some times the structure can be just one stone high (Hanspeter Liniger & Critchley, 2007). When enough sediments have been trapped behind the structure, the stone bunds can be upgraded to stone-walled level terraces by carefully raising their height (Desta et al., 2005).
Figure 37. Stone bunds strengthened with elephant grass (Photo: MetaMeta)
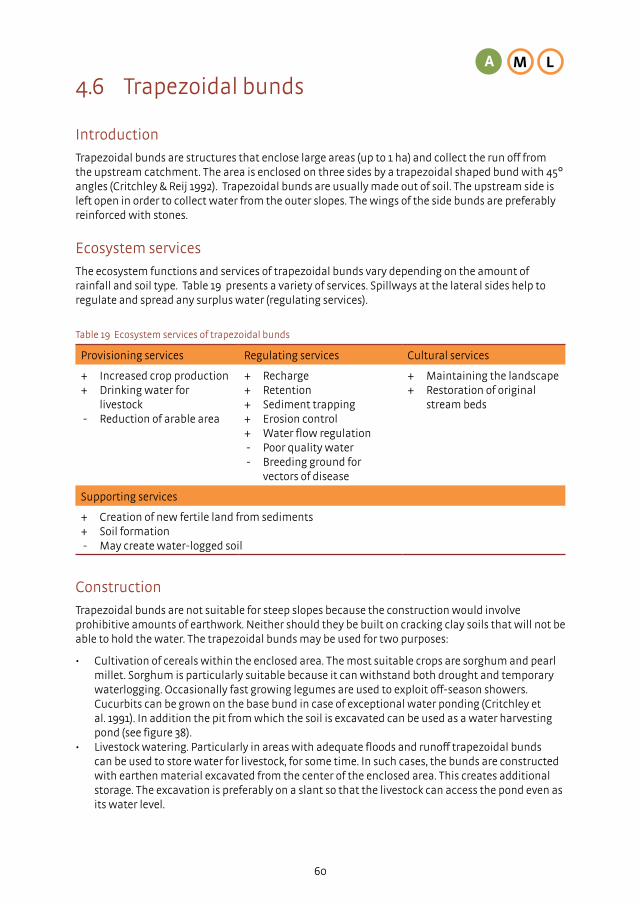
4.6 Trapezoidal bunds
Introduction
Trapezoidal bunds are structures that enclose large areas (up to 1 ha) and collect the run off from the upstream catchment. The area is enclosed on three sides by a trapezoidal shaped bund with 45° angles (Critchley & Reij 1992). Trapezoidal bunds are usually made out of soil. The upstream side is left open in order to collect water from the outer slopes. The wings of the side bunds are preferably reinforced with stones.
Ecosystem services
The ecosystem functions and services of trapezoidal bunds vary depending on the amount of rainfall and soil type. Table 19 presents a variety of services. Spillways at the lateral sides help to regulate and spread any surplus water (regulating services).
60
A M L
Provisioning services Regulating services Cultural services
+ Increased crop production+ Drinking water for livestock - Reduction of arable area
+ Recharge+ Retention+ Sediment trapping + Erosion control+ Water flow regulation - Poor quality water - Breeding ground for vectors of disease
+ Maintaining the landscape+ Restoration of original stream beds
Supporting services
+ Creation of new fertile land from sediments+ Soil formation - May create water-logged soil
Table 19 Ecosystem services of trapezoidal bunds
Construction
Trapezoidal bunds are not suitable for steep slopes because the construction would involve prohibitive amounts of earthwork. Neither should they be built on cracking clay soils that will not be able to hold the water. The trapezoidal bunds may be used for two purposes:
• Cultivation of cereals within the enclosed area. The most suitable crops are sorghum and pearl millet. Sorghum is particularly suitable because it can withstand both drought and temporary waterlogging. Occasionally fast growing legumes are used to exploit off-season showers. Cucurbits can be grown on the base bund in case of exceptional water ponding (Critchley et al. 1991). In addition the pit from which the soil is excavated can be used as a water harvesting pond (see figure 38).
• Livestock watering. Particularly in areas with adequate floods and runoff trapezoidal bunds can be used to store water for livestock, for some time. In such cases, the bunds are constructed with earthen material excavated from the center of the enclosed area. This creates additional storage. The excavation is preferably on a slant so that the livestock can access the pond even as its water level.

61
Figure 38. On the right sides of the picture, a part of a trapezoidal bund can be seen. The soil to construct the bund was excavated from the pit on the left side which is also functioning as water harvesting structure (photo: MetaMeta)
Trapezoidal bunds are constructed as single units or in series. Excess water is allowed to spill over the reinforced wing tips. When in series, the bunds are staggered in a way that they can intercept excess water from the bunds that are upstream to them. The typical distance between bunds on the same contour line is 20 m, while that between successive rows is 30 m (Awulachew et al. 2009). However, depending on the ratio between the catchment and the cultivated area, the spacing of these trapezoidal bunds can vary: in arid areas there is less water to go around and the spacing may be larger.
Starting from the upper section of the field, the positions of the wing tips are marked on the same contour level. The distance between them can be obtained from table 20. Thereafter, all the other dimensions are defined and marked on the ground. In some cases, the structures are oversized in order to reduce the need for frequent maintenance.
Slope (%) Length of base bund (m)
Length of wingwalls (m)
Bund Height (cm)
Distance between tips (m)
Cultivated area per bund (m)
0.5 40 114 20 - 60 200 9600
1.0 40 57 20 - 60 120 3200
1.5 40 38 20 - 60 94 1800
(Source: Critchley & Reij 1992)
Table 20. Design specifications for three different slope gradients. The amount of work increases and the dimensions decrease as the terrains become steeper

Trapazoidal bunds are constructed by laying two layers of excavated soil. Starting from the base bund, the first layer preferably has a thickness of 30 cm, which gradually tapers off to zero as it reaches the tips. The second layer - 30 cm thick at the base bund - has a thickness of 20 cm at the wings tip. The wing tips have to be reinforced with stones to avoid overflow erosion. Cutoff ditches and interception ditches can be dug above the trapezoidal bund when the catchment area is either too big or too small – either to divert water into or away from the trapezoidal bund (Critchley et al. 1991).
Costs
Presented below are some typical costs – based on the labour intensive work on trapezoidal bunds undertaken in Turkana. Obviously, costs change with the availability of earth moving equipment or, for instance, the use of animal drawn scraper boards (see box 11). Despite its large potential the use of this technique has declined due to the considerable amount of labour required (see table 21). If draught animal power or mechanized means are at hand, however, trapezoidal bunds can play a crucial role in augmenting cattle watering and food production and in securing drought prone areas in general (Mati 2006).
Figure 39. Scraper board (photo: MetaMeta)
Box 11: Animal scraper boards
Animal scraper boards (highlighted in the picture below) are traditionally used to make both large diversion bunds as well as small field bunds for instance in spate irrigation systems in Ethiopia. The board is made of wood and preferably slightly concave so it can carry the soil. There is a handle at the top of the board, which allows farmers to control the angle at which the board is operated. The scraper board is usually operated by a single ox.
62
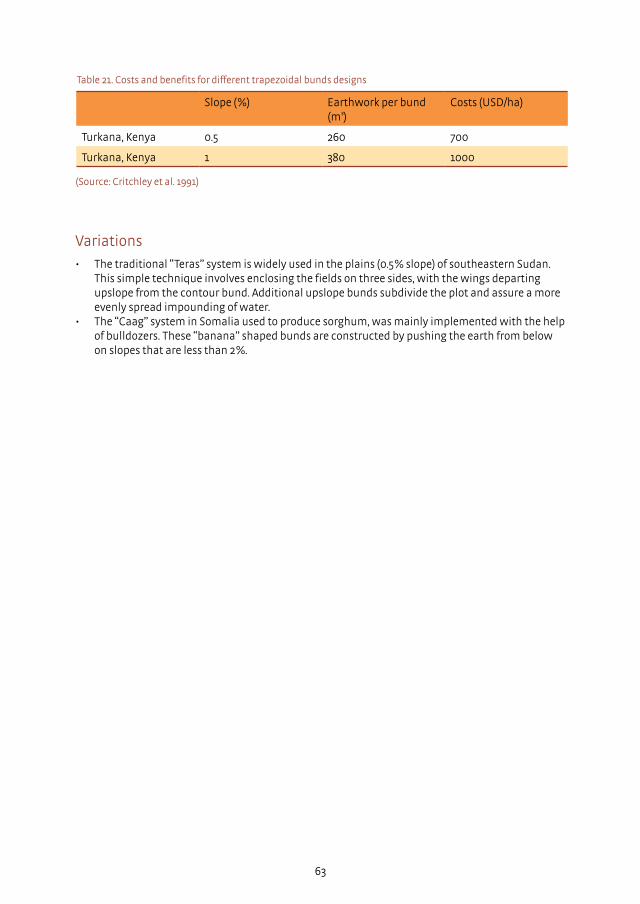
63
Variations
• The traditional “Teras” system is widely used in the plains (0.5% slope) of southeastern Sudan. This simple technique involves enclosing the fields on three sides, with the wings departing upslope from the contour bund. Additional upslope bunds subdivide the plot and assure a more evenly spread impounding of water.
• The “Caag” system in Somalia used to produce sorghum, was mainly implemented with the help of bulldozers. These “banana” shaped bunds are constructed by pushing the earth from below on slopes that are less than 2%.
(Source: Critchley et al. 1991)
Slope (%) Earthwork per bund (m³)
Costs (USD/ha)
Turkana, Kenya 0.5 260 700
Turkana, Kenya 1 380 1000
Table 21. Costs and benefits for different trapezoidal bunds designs
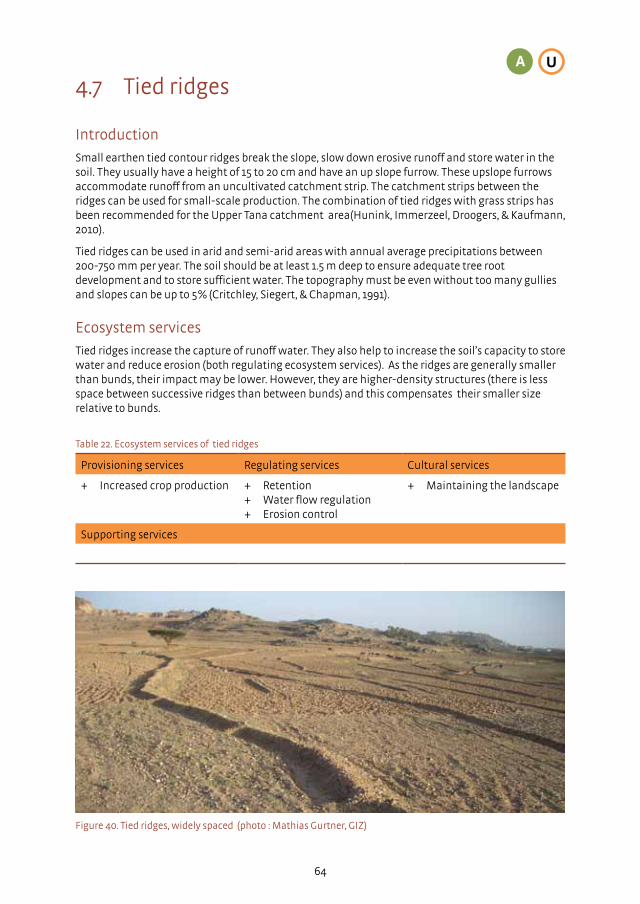
4.7 Tied ridges
Introduction
Small earthen tied contour ridges break the slope, slow down erosive runoff and store water in the soil. They usually have a height of 15 to 20 cm and have an up slope furrow. These upslope furrows accommodate runoff from an uncultivated catchment strip. The catchment strips between the ridges can be used for small-scale production. The combination of tied ridges with grass strips has been recommended for the Upper Tana catchment area(Hunink, Immerzeel, Droogers, & Kaufmann, 2010).
Tied ridges can be used in arid and semi-arid areas with annual average precipitations between 200-750 mm per year. The soil should be at least 1.5 m deep to ensure adequate tree root development and to store sufficient water. The topography must be even without too many gullies and slopes can be up to 5% (Critchley, Siegert, & Chapman, 1991).
Ecosystem services
Tied ridges increase the capture of runoff water. They also help to increase the soil’s capacity to store water and reduce erosion (both regulating ecosystem services). As the ridges are generally smaller than bunds, their impact may be lower. However, they are higher-density structures (there is less space between successive ridges than between bunds) and this compensates their smaller size relative to bunds.
64
Figure 40. Tied ridges, widely spaced (photo : Mathias Gurtner, GIZ)
A U
Provisioning services Regulating services Cultural services
+ Increased crop production + Retention+ Water flow regulation + Erosion control
+ Maintaining the landscape
Supporting services
Table 22. Ecosystem services of tied ridges
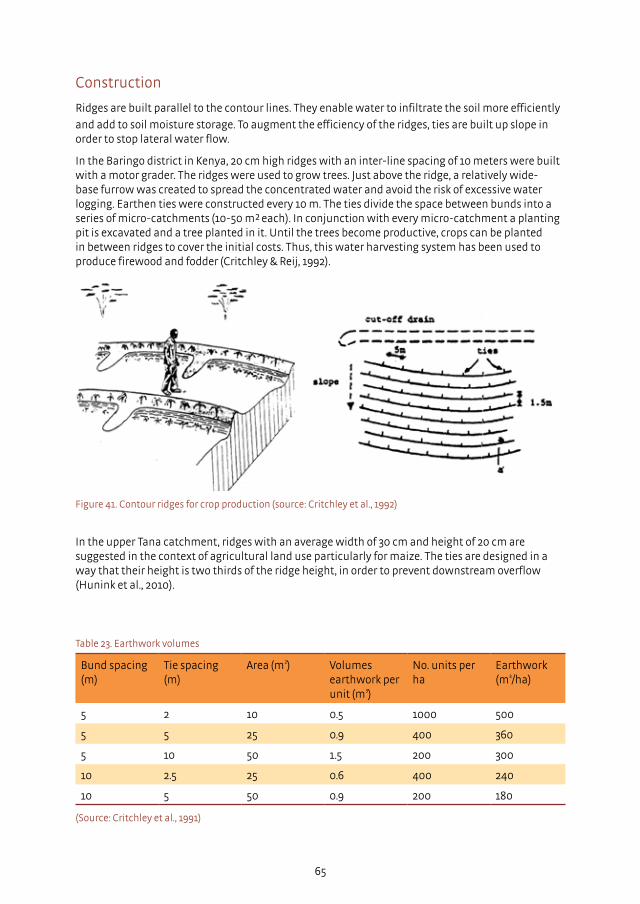
65
Construction
Ridges are built parallel to the contour lines. They enable water to infiltrate the soil more efficiently
and add to soil moisture storage. To augment the efficiency of the ridges, ties are built up slope in order to stop lateral water flow.
In the Baringo district in Kenya, 20 cm high ridges with an inter-line spacing of 10 meters were built with a motor grader. The ridges were used to grow trees. Just above the ridge, a relatively wide-base furrow was created to spread the concentrated water and avoid the risk of excessive water logging. Earthen ties were constructed every 10 m. The ties divide the space between bunds into a series of micro-catchments (10-50 m² each). In conjunction with every micro-catchment a planting pit is excavated and a tree planted in it. Until the trees become productive, crops can be planted in between ridges to cover the initial costs. Thus, this water harvesting system has been used to produce firewood and fodder (Critchley & Reij, 1992).
In the upper Tana catchment, ridges with an average width of 30 cm and height of 20 cm are suggested in the context of agricultural land use particularly for maize. The ties are designed in a way that their height is two thirds of the ridge height, in order to prevent downstream overflow (Hunink et al., 2010).
Figure 41. Contour ridges for crop production (source: Critchley et al., 1992)
Bund spacing (m)
Tie spacing (m)
Area (m²) Volumes earthwork per unit (m³)
No. units per ha
Earthwork (m³/ha)
5 2 10 0.5 1000 500
5 5 25 0.9 400 360
5 10 50 1.5 200 300
10 2.5 25 0.6 400 240
10 5 50 0.9 200 180
(Source: Critchley et al., 1991)
Table 23. Earthwork volumes
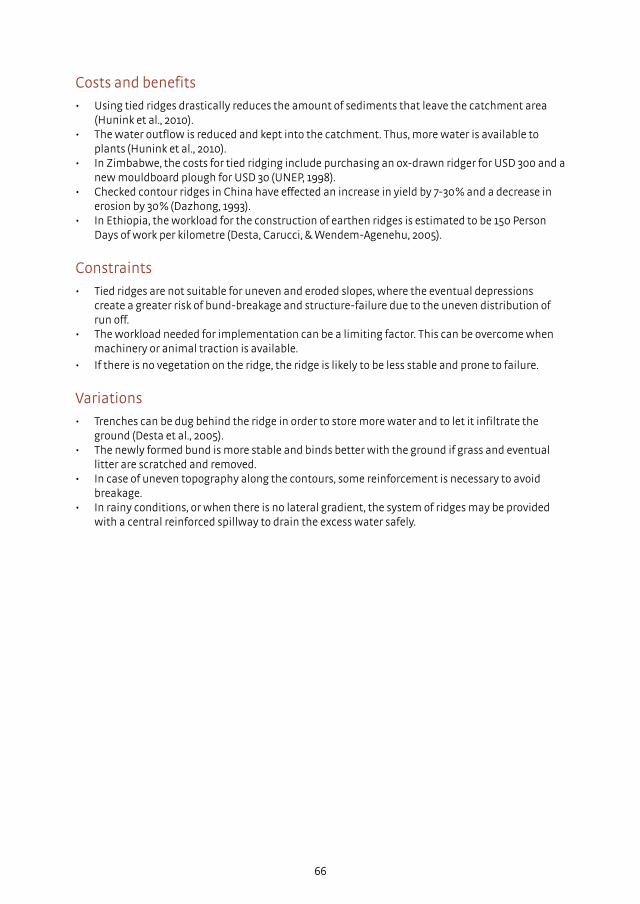
66
Costs and benefits
• Using tied ridges drastically reduces the amount of sediments that leave the catchment area (Hunink et al., 2010).
• The water outflow is reduced and kept into the catchment. Thus, more water is available to plants (Hunink et al., 2010).
• In Zimbabwe, the costs for tied ridging include purchasing an ox-drawn ridger for USD 300 and a new mouldboard plough for USD 30 (UNEP, 1998).
• Checked contour ridges in China have effected an increase in yield by 7-30% and a decrease in erosion by 30% (Dazhong, 1993).
• In Ethiopia, the workload for the construction of earthen ridges is estimated to be 150 Person Days of work per kilometre (Desta, Carucci, & Wendem-Agenehu, 2005).
Constraints
• Tied ridges are not suitable for uneven and eroded slopes, where the eventual depressions create a greater risk of bund-breakage and structure-failure due to the uneven distribution of run off.
• The workload needed for implementation can be a limiting factor. This can be overcome when machinery or animal traction is available.
• If there is no vegetation on the ridge, the ridge is likely to be less stable and prone to failure.
Variations
• Trenches can be dug behind the ridge in order to store more water and to let it infiltrate the ground (Desta et al., 2005).
• The newly formed bund is more stable and binds better with the ground if grass and eventual litter are scratched and removed.
• In case of uneven topography along the contours, some reinforcement is necessary to avoid breakage.
• In rainy conditions, or when there is no lateral gradient, the system of ridges may be provided with a central reinforced spillway to drain the excess water safely.
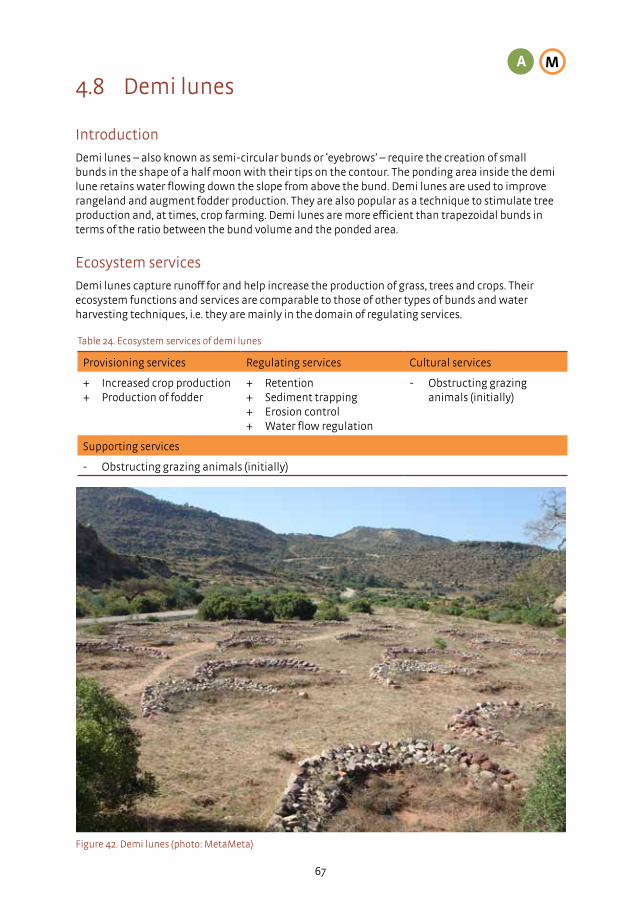
67
4.8 Demi lunes
Introduction
Demi lunes – also known as semi-circular bunds or ‘eyebrows’ – require the creation of small bunds in the shape of a half moon with their tips on the contour. The ponding area inside the demi lune retains water flowing down the slope from above the bund. Demi lunes are used to improve rangeland and augment fodder production. They are also popular as a technique to stimulate tree production and, at times, crop farming. Demi lunes are more efficient than trapezoidal bunds in terms of the ratio between the bund volume and the ponded area.
Ecosystem services
Demi lunes capture runoff for and help increase the production of grass, trees and crops. Their ecosystem functions and services are comparable to those of other types of bunds and water harvesting techniques, i.e. they are mainly in the domain of regulating services.
Figure 42. Demi lunes (photo: MetaMeta)
A M
Provisioning services Regulating services Cultural services
+ Increased crop production+ Production of fodder
+ Retention+ Sediment trapping + Erosion control+ Water flow regulation
- Obstructing grazing animals (initially)
Supporting services
- Obstructing grazing animals (initially)
Table 24. Ecosystem services of demi lunes

68
Design
The design varies according to topography and rainfall amount. In dry conditions, the bunds are bigger and equipped with spillways. In wetter conditions, more bunds of smaller radius are constructed per hectare. They are rarely used on slopes steeper than 5%. When used for rangeland improvement, local grasses can be grown, but the introduction of more productive trees and shrubs is recommended. Combining demi lunes with controlled grazing further helps the vegetation regenerate.
Earthen semi circular bunds are rarely wider than 30 cm. It is good practice to stabilize them with stolonifer grasses like star grass (Cynodon dactylon) (Imbira n.d.). When used to grow crops, drought resistant species such as sorghum, pearl millet and certain pulses must be chosen. Among trees, papaya is a good option as it requires relatively little water. Experiences from semi-arid areas in Tigray, Ethiopia suggest that the best place to plant tree seedlings is at the toe of stone bund – and not inside it – as there is more soil moisture (Benicke 2001).
The C:CA and the dimensions of semi-circular bunds must be chosen according to the plant requirements, the topography and the climatic conditions. In drier areas, for example, it is necessary that these structures enclose a relatively large catchment area (C). In order to satisfy the plant’s requirements, farmers tend to reduce the catchment area of the semi-circular bunds in order to increase the cultivable area.
(Source: Critchley, 1991; Critchley, 1992)
Country Rainfall (mm/year)
Slope (%) C:CA Bunds /ha Radius (m) Husbandry
Location not specified
250 - 700
< 1 1.4:1 70 - 75 6 Rangeland
< 2 3:1 4 20 Rangeland
< 4 3:1 16 10 Rangeland
Niger 250 - 300 1 - 2 4:1 300 2 Millet-Sorghum
Kenya (Turkana)
200 -450 0.5 - 2 > 6:1< 12:1
Not available
15 Grass Fodder
Kenya (Baringo)
650 Not available
3:1 40 - 50 6 Fodder
Kenya (Kitui)
800 Not available
Not available
Not available
Not available
Fodder
Table 25. Demi lunes characteristics
Construction
In constructing demi lunes, it is important to carry out the following steps:
• The wing tips should be located on the contour lines and the middle point should be pegged. • A semi-circle with the same radius as the bund can be traced, by swinging a rope attached to its
center. • The operation is repeated multiple times to mark rows along which to create multiple bunds.
The key principle is that a demi lune should be positioned in a way that it can capture the water overflowing the one right above.
• The bunds are constructed using the soil excavated from the area enclosed by the semi circles.

69
• The bunds are laid in consecutive layers of compacted soil of no more than 10-15 cm per layer. • When excess water is expected to overflow the bund, its tips must be reinforced. • Alternatively, demi lunes can be constructed with locally available stones.
Costs and benefits
Costs Benefits
Niger 150 USD/ha< 1 USD/m³ labour10 PD
600 - 800 kg/ha good year
Kenya, Turkana 0.85 USD/m³ labour Not available
Kenya, Baringo Not available 350 kg/ha sorghum increase
Ethiopia 150 PD/km Not available
(Source: Critchley, 1992; Imbira; Desta, 2005)
Table 26. Costs and benefits of demi lunes
Constraints
When the demi lunes are constructed using soil, the first rain season may form breaches in them as the soil needs some time to get consolidated. When used to grow fodder, the risk is lower because the plants create a thick cover and protection for the structure. All breaches should be repaired immediately. Grazing animals are another common cause of bund breaches. To lower the risk of breakage in general, diversion ditches can be carefully laid out to avoid excessive stress on the demi lunes (Critchley and Reij 1992).
Variations
• A variation used in Kitui (see table 25) consisted of smaller banana-shaped bunds. Even if the bund breaches some water is retained thanks to the excavation ditch dug in the inner micro-catchment.
• On very steep slopes demi lunes can be used to grow tree species. Each tree is planted inside a semi-circular or even circular stone riser. In the enclosed area there is a pit for the plant and a water collection ditch to augment retention (Desta et al. 2005).

4.9 Tal Ya trays
Introduction
Tal Ya trays combine the benefits of mulching with the collection of dew and runoff. Tal-ya, an Israeli based company, developed square, hard, concave plastic trays made of polypropylene. When the tray is placed around the stem at the base of the plant, a controlled microclimate is created underneath it. The temperature is more stable, soil evaporation is under control and weed growth is constrained. Hence, the trays have a similar effect as plastic mulching.
Moreover, the special shape of the trays concentrates atmospheric dew even in the more arid areas and conveys it directly to the roots of the plant. The aluminium composite in the tray responds to shifts in temperature between night and day and promotes dew formation. Additionally, when it rains, the trays convey the water straight to the root zone.
Ecosystem services
Due to the combination of mulching and the collection of dew and runoff, Tal Ya trays save water.
70
Provisioning services Regulating services Cultural services
+ Increased crop production - Plastic waste products
+ Retention+ Reduced evaporation
Supporting services
+ Nutrient cycling
Table 27. Ecosystem services of Tal Ya trays
Use
The trays ( 55 cm x72 cm) are put in place together with the plants. This technology can be employed on both annual plants and perennial species. In the former case, the trays have to be installed every year at the beginning of the growing season. When used with trees, they can be left in place for up to 10 years. Maintenance requirements are minimal and, when worn out, the trays can be safely disposed as they are made of recyclable plastic. Tal Ya trays can be coupled with a number of dry farming techniques such as brackish water irrigation and drip irrigation. Thanks to the reduced evaporation, salts present in brackish water do not surface because capillarity suction is heavily reduced. Furthermore, the localized dew conveyance helps wash down the salts.
Costs and benefits
One tray of 55 cm by 72 cm costs 3 USD. The technique is promising but new – so many of the benefits come to light from field tests. Water savings are maximized on account of multiple functions performed by the tray: soil evaporation is drastically reduced, competition with weeds is absent and extra water is gained from dew and concentrated rainfall. All together these functions lead to a 50 % saving on water needed to irrigate.
Due to the more concentrated application of water, less nutrients are washed away from the soil. This brings a saving of 50% on fertilizer cost. In addition, the favourable conditions in the root zone stimulate the development of the roots, symbiotic bacteria and fungi. This ensures a better nutrient
A L
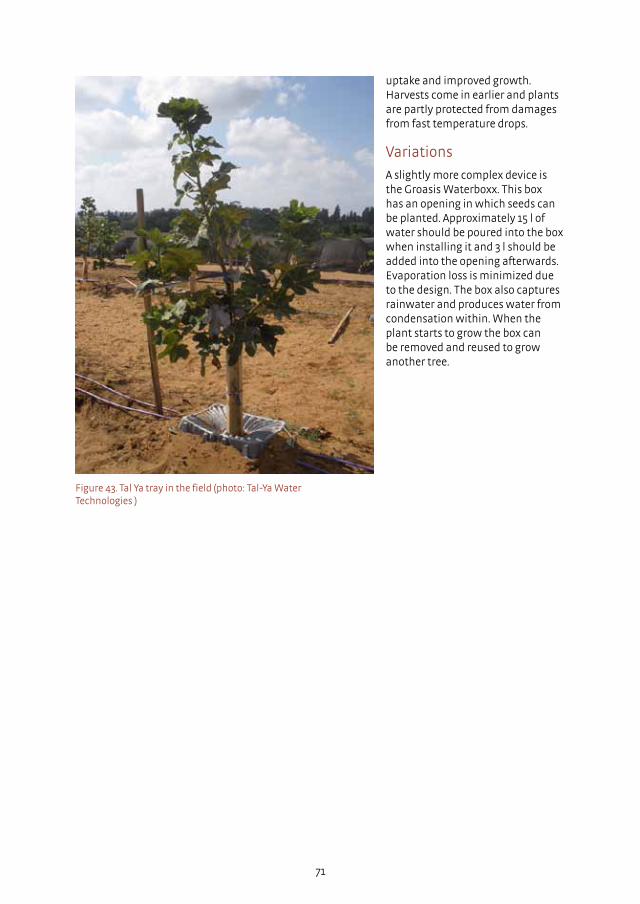
71
uptake and improved growth. Harvests come in earlier and plants are partly protected from damages from fast temperature drops.
Variations
A slightly more complex device is the Groasis Waterboxx. This box has an opening in which seeds can be planted. Approximately 15 l of water should be poured into the box when installing it and 3 l should be added into the opening afterwards. Evaporation loss is minimized due to the design. The box also captures rainwater and produces water from condensation within. When the plant starts to grow the box can be removed and reused to grow another tree.
Figure 43. Tal Ya tray in the field (photo: Tal-Ya Water Technologies )
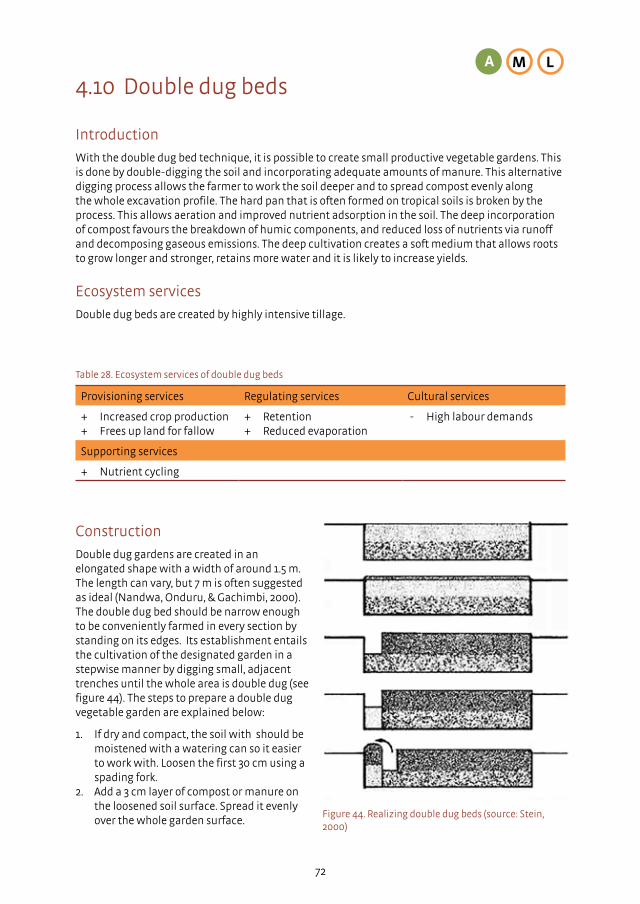
4.10 Double dug beds
Introduction
With the double dug bed technique, it is possible to create small productive vegetable gardens. This is done by double-digging the soil and incorporating adequate amounts of manure. This alternative digging process allows the farmer to work the soil deeper and to spread compost evenly along the whole excavation profile. The hard pan that is often formed on tropical soils is broken by the process. This allows aeration and improved nutrient adsorption in the soil. The deep incorporation of compost favours the breakdown of humic components, and reduced loss of nutrients via runoff and decomposing gaseous emissions. The deep cultivation creates a soft medium that allows roots to grow longer and stronger, retains more water and it is likely to increase yields.
Ecosystem services
Double dug beds are created by highly intensive tillage.
72
Figure 44. Realizing double dug beds (source: Stein, 2000)
A LM
Provisioning services Regulating services Cultural services
+ Increased crop production+ Frees up land for fallow
+ Retention+ Reduced evaporation
- High labour demands
Supporting services
+ Nutrient cycling
Table 28. Ecosystem services of double dug beds
Construction
Double dug gardens are created in an elongated shape with a width of around 1.5 m. The length can vary, but 7 m is often suggested as ideal (Nandwa, Onduru, & Gachimbi, 2000). The double dug bed should be narrow enough to be conveniently farmed in every section by standing on its edges. Its establishment entails the cultivation of the designated garden in a stepwise manner by digging small, adjacent trenches until the whole area is double dug (see figure 44). The steps to prepare a double dug vegetable garden are explained below:
1. If dry and compact, the soil with should be moistened with a watering can so it easier to work with. Loosen the first 30 cm using a spading fork.
2. Add a 3 cm layer of compost or manure on the loosened soil surface. Spread it evenly over the whole garden surface.
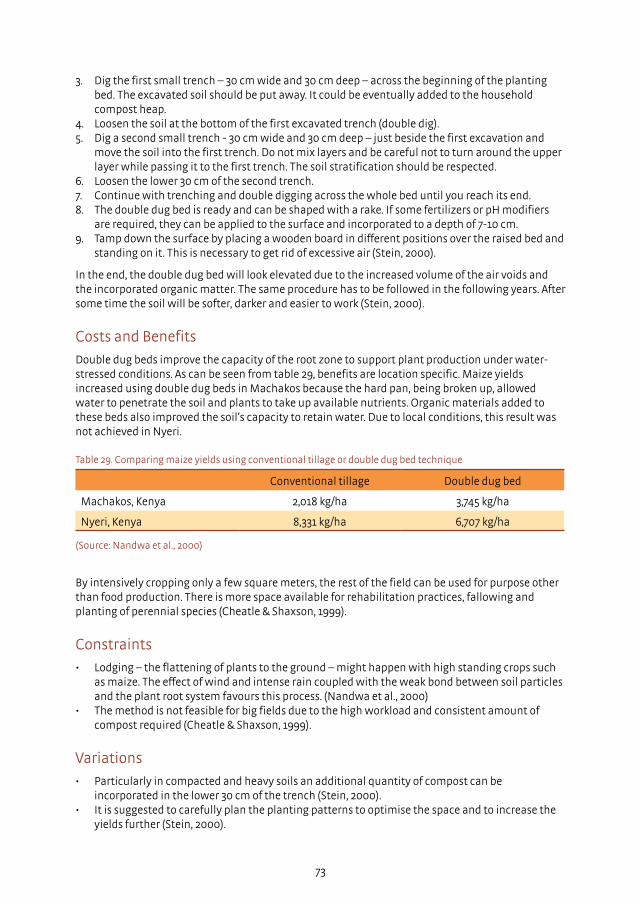
73
3. Dig the first small trench – 30 cm wide and 30 cm deep – across the beginning of the planting bed. The excavated soil should be put away. It could be eventually added to the household compost heap.
4. Loosen the soil at the bottom of the first excavated trench (double dig).5. Dig a second small trench - 30 cm wide and 30 cm deep – just beside the first excavation and
move the soil into the first trench. Do not mix layers and be careful not to turn around the upper layer while passing it to the first trench. The soil stratification should be respected.
6. Loosen the lower 30 cm of the second trench.7. Continue with trenching and double digging across the whole bed until you reach its end.8. The double dug bed is ready and can be shaped with a rake. If some fertilizers or pH modifiers
are required, they can be applied to the surface and incorporated to a depth of 7-10 cm.9. Tamp down the surface by placing a wooden board in different positions over the raised bed and
standing on it. This is necessary to get rid of excessive air (Stein, 2000).
In the end, the double dug bed will look elevated due to the increased volume of the air voids and the incorporated organic matter. The same procedure has to be followed in the following years. After some time the soil will be softer, darker and easier to work (Stein, 2000).
Costs and Benefits
Double dug beds improve the capacity of the root zone to support plant production under water-stressed conditions. As can be seen from table 29, benefits are location specific. Maize yields increased using double dug beds in Machakos because the hard pan, being broken up, allowed water to penetrate the soil and plants to take up available nutrients. Organic materials added to these beds also improved the soil’s capacity to retain water. Due to local conditions, this result was not achieved in Nyeri.
By intensively cropping only a few square meters, the rest of the field can be used for purpose other than food production. There is more space available for rehabilitation practices, fallowing and planting of perennial species (Cheatle & Shaxson, 1999).
Constraints
• Lodging – the flattening of plants to the ground – might happen with high standing crops such as maize. The effect of wind and intense rain coupled with the weak bond between soil particles and the plant root system favours this process. (Nandwa et al., 2000)
• The method is not feasible for big fields due to the high workload and consistent amount of compost required (Cheatle & Shaxson, 1999).
Variations
• Particularly in compacted and heavy soils an additional quantity of compost can be incorporated in the lower 30 cm of the trench (Stein, 2000).
• It is suggested to carefully plan the planting patterns to optimise the space and to increase the yields further (Stein, 2000).
Conventional tillage Double dug bed
Machakos, Kenya 2,018 kg/ha 3,745 kg/ha
Nyeri, Kenya 8,331 kg/ha 6,707 kg/ha
(Source: Nandwa et al., 2000)
Table 29. Comparing maize yields using conventional tillage or double dug bed technique
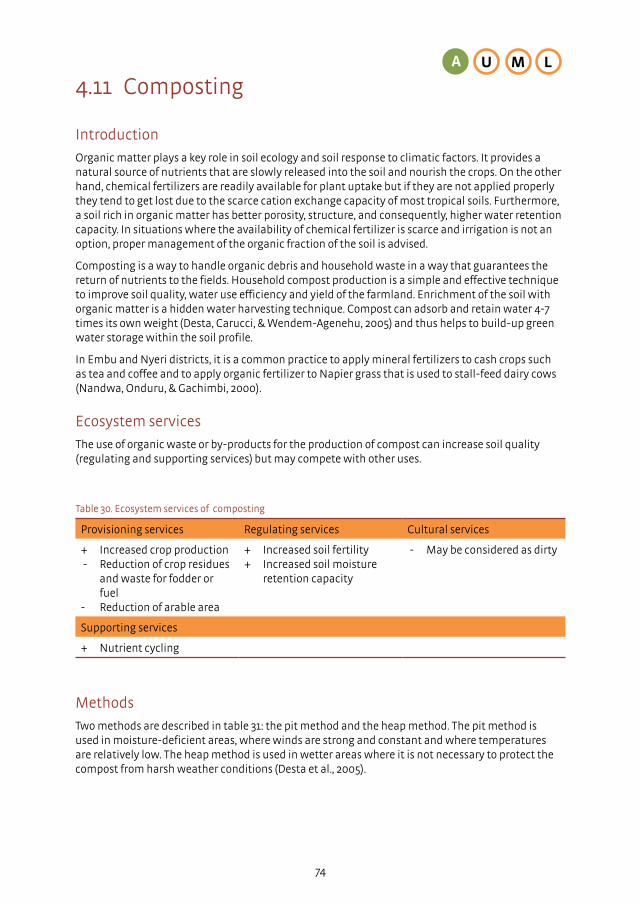
4.11 Composting
Introduction
Organic matter plays a key role in soil ecology and soil response to climatic factors. It provides a natural source of nutrients that are slowly released into the soil and nourish the crops. On the other hand, chemical fertilizers are readily available for plant uptake but if they are not applied properly they tend to get lost due to the scarce cation exchange capacity of most tropical soils. Furthermore, a soil rich in organic matter has better porosity, structure, and consequently, higher water retention capacity. In situations where the availability of chemical fertilizer is scarce and irrigation is not an option, proper management of the organic fraction of the soil is advised.
Composting is a way to handle organic debris and household waste in a way that guarantees the return of nutrients to the fields. Household compost production is a simple and effective technique to improve soil quality, water use efficiency and yield of the farmland. Enrichment of the soil with organic matter is a hidden water harvesting technique. Compost can adsorb and retain water 4-7 times its own weight (Desta, Carucci, & Wendem-Agenehu, 2005) and thus helps to build-up green water storage within the soil profile.
In Embu and Nyeri districts, it is a common practice to apply mineral fertilizers to cash crops such as tea and coffee and to apply organic fertilizer to Napier grass that is used to stall-feed dairy cows (Nandwa, Onduru, & Gachimbi, 2000).
Ecosystem services
The use of organic waste or by-products for the production of compost can increase soil quality (regulating and supporting services) but may compete with other uses.
74
A LMU
Methods
Two methods are described in table 31: the pit method and the heap method. The pit method is used in moisture-deficient areas, where winds are strong and constant and where temperatures are relatively low. The heap method is used in wetter areas where it is not necessary to protect the compost from harsh weather conditions (Desta et al., 2005).
Provisioning services Regulating services Cultural services
+ Increased crop production - Reduction of crop residues and waste for fodder or fuel- Reduction of arable area
+ Increased soil fertility+ Increased soil moisture retention capacity
- May be considered as dirty
Supporting services
+ Nutrient cycling
Table 30. Ecosystem services of composting

75
Figure 45. Compost pit (photo: MetaMeta)
Pit method Heap method
• Select a protected location (e.g. under trees) • Collect organic waste, manure, ashes • Dig 2 pits of no t bigger than 2 x 4 m (W x L)
and 1.2 - 1.5 m deep • Stack the residues in the first pit to form
layers - Crop residues - Sprinkle with ash (0.5 km/m²) - Manure (3 - 5 spades/m²) - Thin layer of soil (1 - 2 cm)
• Repeat the sequence until the pit s full • Sticks can be placed vertically to help
aearation (every 2 m) • The pit is covered with straw • Let the pit work for one month adding
water to keep it moist (once/week) • After one month turn the compost in the
second hip • After 3 - 5 months the compost is ready
• Select a protected location (e.g. under trees) • Collect organic waste, manure, ashes • Dig a shallow foundation ditch (15 - 30 cm
deep, 2 m wide) • Stack the residues in prepared area to form
layers - Crop residues - Sprinkle with ash ( 0.5 kg/m²) - Manure (3 - 5 spades /m²) - Thin layer of soil (1 - 2 cm)
• Repeat the sequence until the heap is formed
• A stick can be placed vertically to help aeration
• Let the heap work for 22 days and cover it. • Turn the compost after 22 days and leave it
for another 22 days. • After 44 days the compost is ready • The heap should not be wider than 2 m and
taller than 1.5 m • The sides of the heap can be plastered to
keep the system warm and sheltered from the wind
(Source: Desta, 2005)
Table 31. Comparison of composting methods

76
Costs and benefits
The beneficial effects of compost vary with climatic and soil conditions. Compost can outperform mineral fertilizer when the soil’s physical characteristics are the main constraints to increase in yield. In the soil of Machakos (sandy and prone to forming a hard pan) the positive effects of compost application were more evident than on the clay rich soils of upper districts as Nyeri (see table 32). In the latter situation, crops can use the higher nutrient content of the manure+DAP mixture more efficiently than in Machakos.
While developing composting pits involves only waste material, it also demands time and effort.
Costs (USD) Costs (PD)
Establishment 12 2
Recurrent input 30 30
(Source: Liniger & Critchley, 2007)
Table 33. Costs of compost method
Manure + DAP Compost
Machakos 2,018 kg/ha 2,449 kg/ha
Nyeri 8,331 kg/ha 5,071 kg/ha
Table 32. Yields of maize in different districts (Nyeri and Machakos, Kenya) with different nutrient management procedures
Constraints
• The compost pit or heap needs to be located close to the material source (i.e. animal closure, fields) as well as to the homestead in order for the routine work to be carried out (Desta et al., 2005).
• Water is required to keep the compost humid (Nandwa et al., 2000) • Not all the nutrients from the crops are returned to the soil. For this reason extra material has to
be gathered from outside the property. Alternatively, a small quantity of chemical fertilizer can be added (Liniger & Critchley, 2007).
• In some areas farm manure and crop residues are a rare resource and might have other uses conflicting with composting.
Variations
• Composting can create business opportunities on different levels. Landless people can become composters, making a profit selling their product to local farmers (Desta et al., 2005).
• Promoting the use of urban organic waste to produce high quality compost would connect the city to the countryside, returning a substantial amount of nutrients from cities back to rural areas (Ali, 2004).
• Vermiculture is another viable alternative to produce high quality compost (Liniger & Critchley, 2007).
• Alternatively, organic material can be accumulated in a pit without following a precise layering scheme. This would, however, bring down the compost quality (Desta et al., 2005).
• Used together with fertilizers, compost helps in releasing the nutrients. The organic matter contained in compost binds to the mineral particles in the soil. This enhances its capacity to

77
retain nutrients and reduces leaching losses of nutrient cations. • It can be used jointly with terraced land to create a zone of improved water retention. By
applying the compost in the first few meters above the riser - where humidity is higher - an ideal area to grow cash crops can be created. This selective application should be performed every year starting with the risers near the top of the slope and then going down in order to distribute the nutrients throughout the whole bench (Desta et al., 2005).
• A combination of composting with double dug bed farming has been successfully tested in Machakos, Nyeri and Embu districts (Nandwa et al., 2000).

4.12 Bio-char
Introduction
Bio-char is the product left over after the burning of organic wastes for energy or heat production. Mixing bio-char with soil (and manure) enhances the capacity to retain moisture. Adding 20 gram bio-char per kg soil raises its water retention potential by 15%. Bio-char also enhances soil fertility through the stimulation of microbial activity, which ensure better nutrient fixation. The use of charcoal (and other organic remains) has also caused the development of the famously fertile ‘terra preta’ soils of the Andes.
Bio-char is produced after pyrolysis of biomass at temperatures ranging from 300-800 °C. At lower temperatures, a higher percentage of the biomass is converted to bio-char; while at higher temperatures a bigger part of the biomass is converted to energy and products. In rural areas, bio-char is most commonly available as the end product of burnt charcoal - or any other organic fuel - commonly used to cook on stoves. The stove design determines ratio of energy, heat and bio-char production and can be optimized to maximize these.
Ecosystem services
The use of the remains of organic material, burnt for heat or energy generation, to enhance soil quality (supporting and regulating ecosystem services).
Figure 46. Making biochar (photo: Sai Bhaskar Reddy)
78
A LMU
Provisioning services Regulating services Cultural services
+ Increased crop production + Increased soil fertility
Supporting services
+ Nutrient cycling
Table 34. Ecosystem services of bio-char

79
Costs and Benefits
Benefits are several: (I) crop yield increase; (II) soil improvement and soil conservation; (III) income from sales of biochar; (IV) carbon offset payments for use of biochar; (V) carbon offset payments for ‘clean’ cook stoves; (VI) cleaner cook stoves and improved air; (VII) wages from production or processing of biochar; (VIII); improved sanitation using biochar; (IX) bio-char-based water filtration systems; and (X) saving labour and money spent on acquiring fuel wood (IBI, 2011: slide 21).
• Adding 20 grams of bio-char per kg of soil raises soil water retention potential by 15% (Laird, D. 2009: in Barinkick et al.).
• In farm trials in USA, bio-char has been known to increase corn yield with 20% (Hawkins, R. et al. 2008).
• Bio-char is known to have increased the yield of sweet corn by 10%; and of tomatoes by 22% (Morse, R. and Stevens, P. 2006, in Hawkins, R. et al. 2007).
• Bio-char (10 t/ha) is known to have doubled soybean and tripled wheat yield (Van Zwieten et al. 2008).
• Fertilizer requirement can be reduced by 10%-30% on account of the improved efficiency in use (Gaunt and Lehmann, 2008; Baranick, M. et al. 2011).

4.13 Organic mulching
Introduction
Mulch is applied to soil as a protective layer to manage the microclimate. Mulch can be organic material (wood, hay, leaves, needles, shells) or artificial (plastic, geotextile, see 4.14). Different mulch types serve different purposes at different locations. In general, mulch is used to reduce water loss through evapotranspiration, reduce weed growth, protect against heat and cold, and to add soil nutrients. Organic mulch in particular creates ideal conditions for beneficial insects (earth worms for instance) that improve soil quality, while discouraging other insects such as slugs. Mulch can be applied in all types of climate as long as an appropriate material is chosen.
‘Soil mulching’ is a specific type of mulching. In this technique, the soil pores are closed by ‘planking’. A flat plank is moved either by tractor or animal traction over the soil to close soil pores and store the soil moisture inside (see box 12).
Ecosystem services
The application of organic material to create an isolating layer on the soil reduces evaporation and helps reduce pests (both regulating ecosystem services). However, this may compete with other uses of the material.
80
Provisioning services Regulating services Cultural services
+ Increased crop production - Reduction of crop residues and waste for fodder, fuel or construction material
+ Retention+ Reduced growth of weeds+ Increased soil fertility
Supporting services
+ Nutrient cycling
Table 35. Ecosystem services of organic mulching
Requirements
There is a wide variety of material that can be used for mulching purposes: wood chips, bark, cork, sawdust, cover crops, leaves, hay, straw, pine needles, cottonseed hulls, peanut hulls, eucalyptus, compost, paper (news paper), plastic, rubber, geotextile, stones.
Design
Organic mulch is applied as a layer on the soil. The thickness of the mulch depends on the material and the local conditions. In general, this varies between 1 and 12 cm: the finer the mulching material the thinner is the layer. It is important to use material that does not compress or smother the soil as plant roots need to breathe. Mulch should not come in direct contact with plant stems. Old mulch should be removed and a shift of mulch type over the years is desirable. It is also part of the techniques used in conservation agriculture that are discussed separately in 4.36.
A LMU
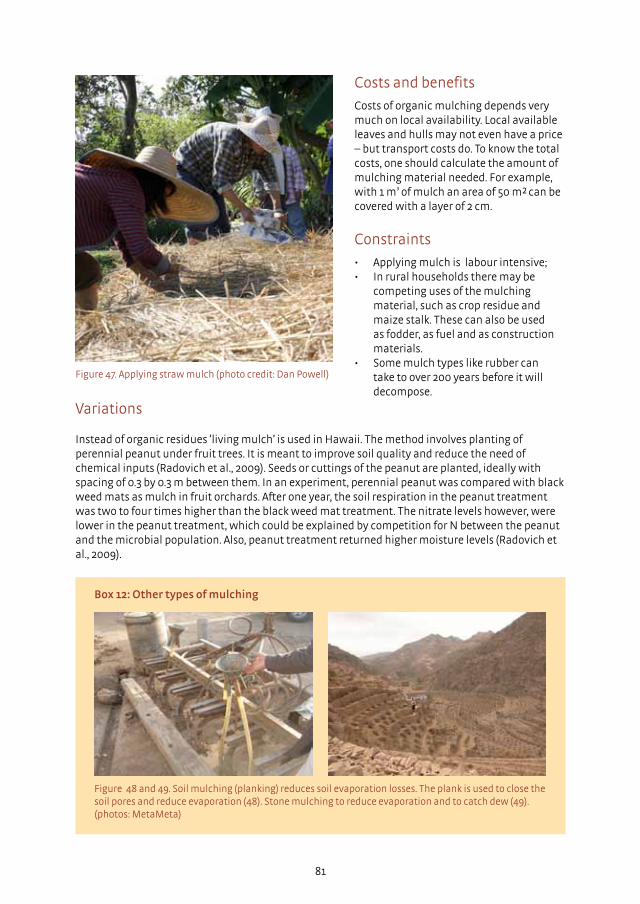
81
Figure 47. Applying straw mulch (photo credit: Dan Powell)
Costs and benefits
Costs of organic mulching depends very much on local availability. Local available leaves and hulls may not even have a price – but transport costs do. To know the total costs, one should calculate the amount of mulching material needed. For example, with 1 m³ of mulch an area of 50 m² can be covered with a layer of 2 cm.
Constraints
• Applying mulch is labour intensive; • In rural households there may be
competing uses of the mulching material, such as crop residue and maize stalk. These can also be used as fodder, as fuel and as construction materials.
• Some mulch types like rubber can take to over 200 years before it will decompose.
Box 12: Other types of mulching
Figure 48 and 49. Soil mulching (planking) reduces soil evaporation losses. The plank is used to close the soil pores and reduce evaporation (48). Stone mulching to reduce evaporation and to catch dew (49). (photos: MetaMeta)
Variations
Instead of organic residues ‘living mulch’ is used in Hawaii. The method involves planting of perennial peanut under fruit trees. It is meant to improve soil quality and reduce the need of chemical inputs (Radovich et al., 2009). Seeds or cuttings of the peanut are planted, ideally with spacing of 0.3 by 0.3 m between them. In an experiment, perennial peanut was compared with black weed mats as mulch in fruit orchards. After one year, the soil respiration in the peanut treatment was two to four times higher than the black weed mat treatment. The nitrate levels however, were lower in the peanut treatment, which could be explained by competition for N between the peanut and the microbial population. Also, peanut treatment returned higher moisture levels (Radovich et al., 2009).
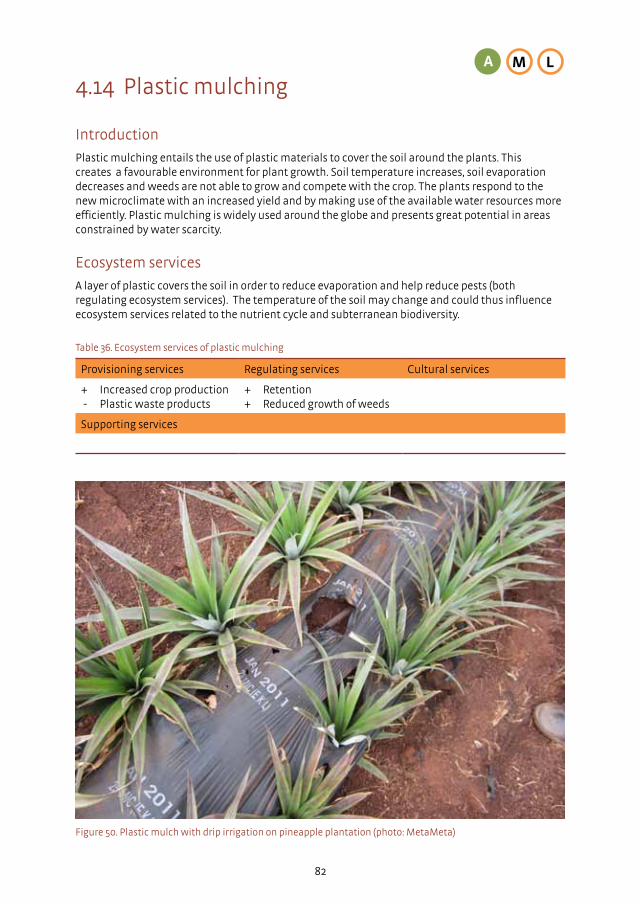
4.14 Plastic mulching
Introduction
Plastic mulching entails the use of plastic materials to cover the soil around the plants. This creates a favourable environment for plant growth. Soil temperature increases, soil evaporation decreases and weeds are not able to grow and compete with the crop. The plants respond to the new microclimate with an increased yield and by making use of the available water resources more efficiently. Plastic mulching is widely used around the globe and presents great potential in areas constrained by water scarcity.
Ecosystem services
A layer of plastic covers the soil in order to reduce evaporation and help reduce pests (both regulating ecosystem services). The temperature of the soil may change and could thus influence ecosystem services related to the nutrient cycle and subterranean biodiversity.
Figure 50. Plastic mulch with drip irrigation on pineapple plantation (photo: MetaMeta)
82
A LM
Provisioning services Regulating services Cultural services
+ Increased crop production - Plastic waste products
+ Retention+ Reduced growth of weeds
Supporting services
Table 36. Ecosystem services of plastic mulching

83
Specifications and requirements
A variety of materials and colours are available in the market, each best-suited to particular environments and cultivations. In hot climates light-coloured materials that deflect part of the heat are often preferred as they and rise or decrease the soil temperature only slightly (Millard, 1974; Tarara, 2000). On the other hand, using dark mulches in such climates can potentially raise the soil temperature to a level that is detrimental to the plant development. Clear plastic mulch deflects part of the radiation and augments its availability to the crops (Tarara, 2000). Also, different crops respond to different mulches differently.
Crop Where Color plastic mulch Yield increase
White yam Nigeria White 34%
Cassava Nigeria White 90%
Black 38.5%
Cocoyam Nigeria Black 72%
Sugar cane South Africa Clear > 25 +/- 4 t/ha
Groundnut Vietnam Clear 83%
Okra Sudan Black 84.9%
(Source: Osiru, 1994; Mbagwu, 1991; Millard, 1974; Anikwe, Mbah, Ezeaku, & Onyia, 2007; Ramakrishna, Tam, Wani, &Long, 2006; Abu-Goukh, 2003)
Table 37. Influence of plastic mulching on yields of various crop species
Crop Where Costs Benefits
Maize/wheat India Not available 203.7 Euro/ha NMR
0.62 B:C
Not available USA 700 USD/ha 50% increase in crop production
(Source: Sharma, P., Abrol, & R. K. Sharma, 2011)
Table 38. Costs and benefits of plastic mulch (NMR= Net Monetary Return)
Costs and benefits
The costs and labour requirements for plastic mulching vary according to the availability of materials in the local market and the amount of labour available to the farm. Even though a fairly large number of work days are necessary in the preparatory phase of the growing season, the amount of labour needed decreases significantly during later stages. Once placed on the soil, the amount of labour needed for weeding is drastically decreased.
As compared to organic mulches, plastic and rubber materials do not adsorb water and let more water (rain-irrigation) reach the ground. Moreover, the reduced evaporation from the soil and decreased transpiration from weeds make this technique an efficient water-saving solution.

Constraints
• The disposal of used plastic mulch is troublesome. The plastic used (usually low density polyethylene) is a recyclable material only if relatively clean and not severely deteriorated (Worldbank, 2002).
• High investment costs as compared to organic mulches. Consequently market mechanisms may be utilized to finance the investment.
• Scarcity of local manufacturers may affect the availability and cost of the material. • It is possible for plastic mulches to harbour rats, insects and snakes under it. This has been true
for plastic-lined ponds in Ethiopia.
Variations
• Organic mulches are often a more viable options when plastic mulching is constrained by material availability, labour requirements, and input expenses.
• Stone mulching could be applied in areas where a source of rock ballast, gravel and small rock fragments are abundant.
• In developing countries an urban-rural synergy can be built to provide farmers with recycled plastic materials that can be reinvented as improvised mulch (i.e. Plastic bags, nylon linings, etc.)
84

85
4.15 Making use of invertebrates
Introduction
Many useful invertebrate species live under our feet and pass unnoticed until the soil is exposed and they are brought to the surface. Termites, earthworms and sowbugs are some of the best known examples. What is less known is the positive effect that they have on the soil and the capacity to store moisture. This beneficial effect comes from loosening up and mixing of the soil structure – creating more aeration and stimulating plant root development. Many invertebrates, also through their constant burrowing activities, improve and maintain the infiltration capacity of the soil and ensure that runoff continues to be absorbed and that the soil is not ‘clogged’.
Ecosystem services
The ecosystem services provided by earthworms used for enhancing the composting process, are comparable to those of compost (see 4. 11). The use of termite mounds as fertilizer is comparable but different, as it may influence insect biodiversity.
Figure 51. Compost in a wooden worm-box gives nutrient rich vermi-compost (photo: MetaMeta)
A LM
Provisioning services Regulating services Cultural services
+ Increased crop production- Reduction of crop residues and waste for fodder or fuel
+ Retention+ Increased soil fertility - Changes in insect biodiversity
- May be considered as dirty
Supporting services
+ Nutrient cycling
Table 39. Ecosystem services of making use of invertebrates
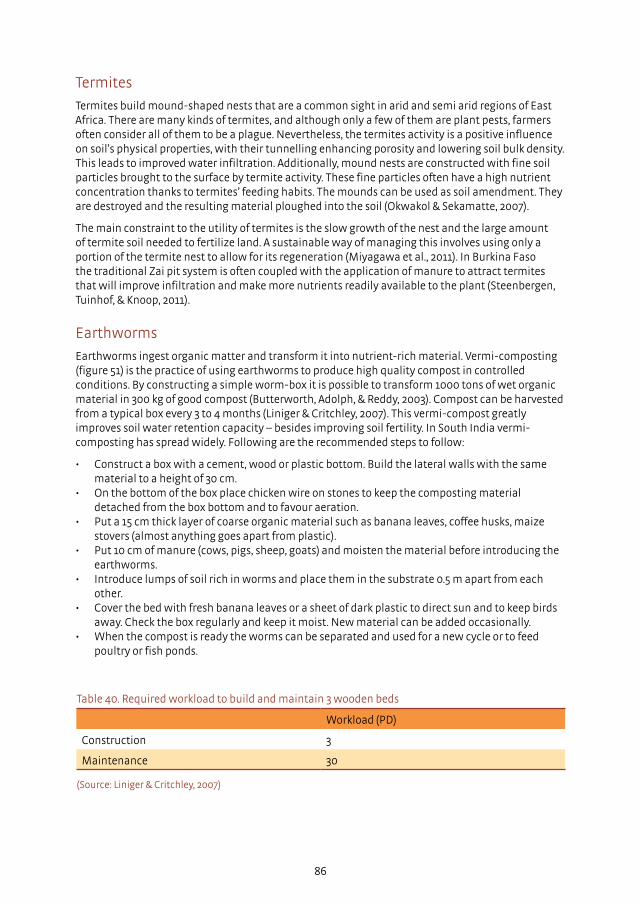
Termites
Termites build mound-shaped nests that are a common sight in arid and semi arid regions of East Africa. There are many kinds of termites, and although only a few of them are plant pests, farmers often consider all of them to be a plague. Nevertheless, the termites activity is a positive influence on soil’s physical properties, with their tunnelling enhancing porosity and lowering soil bulk density. This leads to improved water infiltration. Additionally, mound nests are constructed with fine soil particles brought to the surface by termite activity. These fine particles often have a high nutrient concentration thanks to termites’ feeding habits. The mounds can be used as soil amendment. They are destroyed and the resulting material ploughed into the soil (Okwakol & Sekamatte, 2007).
The main constraint to the utility of termites is the slow growth of the nest and the large amount of termite soil needed to fertilize land. A sustainable way of managing this involves using only a portion of the termite nest to allow for its regeneration (Miyagawa et al., 2011). In Burkina Faso the traditional Zai pit system is often coupled with the application of manure to attract termites that will improve infiltration and make more nutrients readily available to the plant (Steenbergen, Tuinhof, & Knoop, 2011).
Earthworms
Earthworms ingest organic matter and transform it into nutrient-rich material. Vermi-composting (figure 51) is the practice of using earthworms to produce high quality compost in controlled conditions. By constructing a simple worm-box it is possible to transform 1000 tons of wet organic material in 300 kg of good compost (Butterworth, Adolph, & Reddy, 2003). Compost can be harvested from a typical box every 3 to 4 months (Liniger & Critchley, 2007). This vermi-compost greatly improves soil water retention capacity – besides improving soil fertility. In South India vermi-composting has spread widely. Following are the recommended steps to follow:
• Construct a box with a cement, wood or plastic bottom. Build the lateral walls with the same material to a height of 30 cm.
• On the bottom of the box place chicken wire on stones to keep the composting material detached from the box bottom and to favour aeration.
• Put a 15 cm thick layer of coarse organic material such as banana leaves, coffee husks, maize stovers (almost anything goes apart from plastic).
• Put 10 cm of manure (cows, pigs, sheep, goats) and moisten the material before introducing the earthworms.
• Introduce lumps of soil rich in worms and place them in the substrate 0.5 m apart from each other.
• Cover the bed with fresh banana leaves or a sheet of dark plastic to direct sun and to keep birds away. Check the box regularly and keep it moist. New material can be added occasionally.
• When the compost is ready the worms can be separated and used for a new cycle or to feed poultry or fish ponds.
86
Workload (PD)
Construction 3
Maintenance 30
(Source: Liniger & Critchley, 2007)
Table 40. Required workload to build and maintain 3 wooden beds

87
Costs and benefits
• Vermi-composting is more efficient and faster than traditional composting techniques. Besides, it minimizes nutrient losses.
• Suitable earthworms can be found in every ecosystem and the best species are available from special retailers. Earthworms have a wide environmental range and can adapt to different types of food. Furthermore - in the wooden box - the required environmental conditions can be easily controlled.
• It provides a cheap source of good organic fertilizer that poor farmers can also afford. • The vermi-compost nutrients are in a form that is readily available to plants.
Constraints
• Earthworms need a moist environment, and that might be hard to achieve in dry conditions. • The production of compost requires patience and a continuous care of the worm boxes. • Termite mounds are not sustainable to use as fertilizer unless they are given sufficient time to
regenerate. • Some termites can act as pests. They could feed on crops when there are no alternatives
available.

4.16 Planting pits
Introduction
Planting pits collect rainfall and concentrate soil moisture for food and fodder production. Plants are grown inside pits; benefitting from the higher moisture content. Often manure and/or compost is added. This adds nutrients and also attracts termites that loosen up the soil around the planting pits, thus increasing the capacity of the soil to absorb runoff water.
Planting pits were used to grow trees. Their use in crop production is more recent (Mati, 2006). Planting pits vary in dimensions, shape and husbandry system. The best-known system is the western African “zai” (figure 52).
Ecosystem services
Planting pits share many aspects with demi lunes (see 4.8). They both capture runoff, rainwater and soil moisture for increased production of trees or crops. Their ecosystem functions and services are somewhat different though, as compost or manure is routinely added to the pits, resulting in additional impacts on the soil (regulating and supporting ecosystem services).
88
Figure 52. Planting pits (photo: Paul Mathaiya Kahiga)
Provisioning services Regulating services Cultural services
+ Increased crop production + Recharge+ Retention
- High labour demands
Supporting services
+ Nutrient cycling
Table 41. Ecosystem services of planting pits
A LM
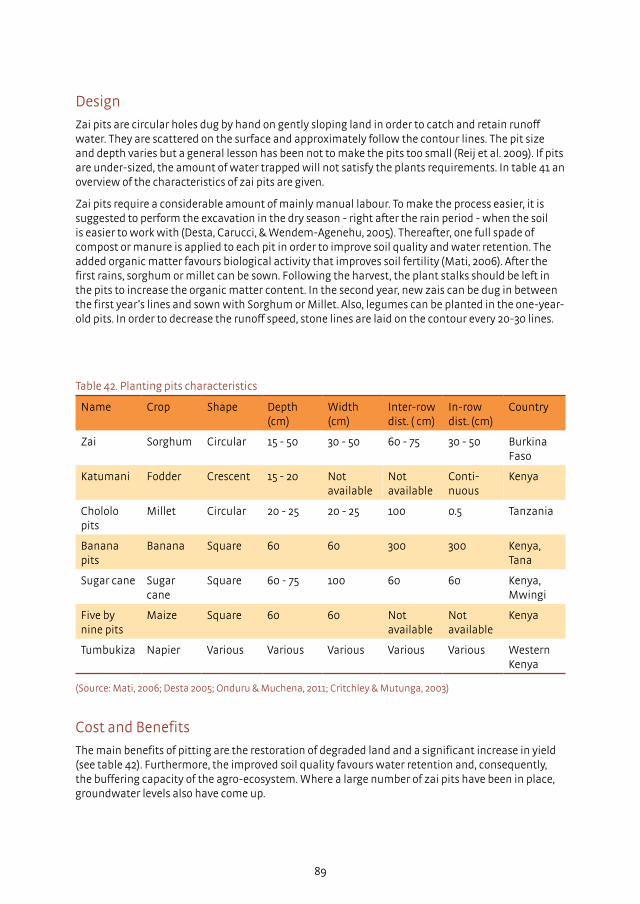
89
Design
Zai pits are circular holes dug by hand on gently sloping land in order to catch and retain runoff water. They are scattered on the surface and approximately follow the contour lines. The pit size and depth varies but a general lesson has been not to make the pits too small (Reij et al. 2009). If pits are under-sized, the amount of water trapped will not satisfy the plants requirements. In table 41 an overview of the characteristics of zai pits are given.
Zai pits require a considerable amount of mainly manual labour. To make the process easier, it is suggested to perform the excavation in the dry season - right after the rain period - when the soil is easier to work with (Desta, Carucci, & Wendem-Agenehu, 2005). Thereafter, one full spade of compost or manure is applied to each pit in order to improve soil quality and water retention. The added organic matter favours biological activity that improves soil fertility (Mati, 2006). After the first rains, sorghum or millet can be sown. Following the harvest, the plant stalks should be left in the pits to increase the organic matter content. In the second year, new zais can be dug in between the first year’s lines and sown with Sorghum or Millet. Also, legumes can be planted in the one-year-old pits. In order to decrease the runoff speed, stone lines are laid on the contour every 20-30 lines.
Name Crop Shape Depth (cm)
Width (cm)
Inter-row dist. ( cm)
In-row dist. (cm)
Country
Zai Sorghum Circular 15 - 50 30 - 50 60 - 75 30 - 50 Burkina Faso
Katumani Fodder Crescent 15 - 20 Not available
Not available
Conti-nuous
Kenya
Chololo pits
Millet Circular 20 - 25 20 - 25 100 0.5 Tanzania
Banana pits
Banana Square 60 60 300 300 Kenya, Tana
Sugar cane Sugar cane
Square 60 - 75 100 60 60 Kenya, Mwingi
Five by nine pits
Maize Square 60 60 Not available
Not available
Kenya
Tumbukiza Napier Various Various Various Various Various Western Kenya
(Source: Mati, 2006; Desta 2005; Onduru & Muchena, 2011; Critchley & Mutunga, 2003)
Table 42. Planting pits characteristics
Cost and Benefits
The main benefits of pitting are the restoration of degraded land and a significant increase in yield (see table 42). Furthermore, the improved soil quality favours water retention and, consequently, the buffering capacity of the agro-ecosystem. Where a large number of zai pits have been in place, groundwater levels also have come up.
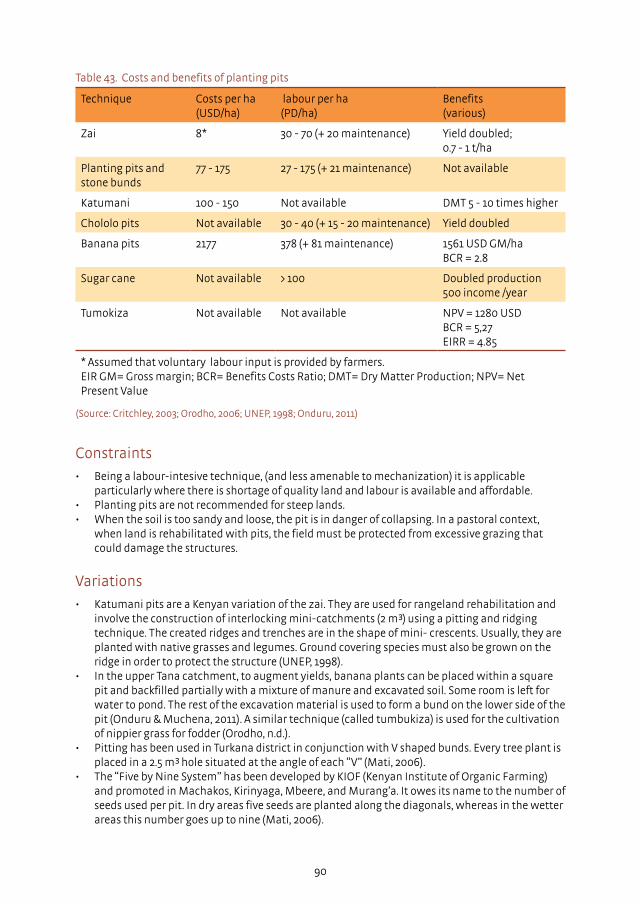
Constraints
• Being a labour-intesive technique, (and less amenable to mechanization) it is applicable particularly where there is shortage of quality land and labour is available and affordable.
• Planting pits are not recommended for steep lands. • When the soil is too sandy and loose, the pit is in danger of collapsing. In a pastoral context,
when land is rehabilitated with pits, the field must be protected from excessive grazing that could damage the structures.
Variations
• Katumani pits are a Kenyan variation of the zai. They are used for rangeland rehabilitation and involve the construction of interlocking mini-catchments (2 m³) using a pitting and ridging technique. The created ridges and trenches are in the shape of mini- crescents. Usually, they are planted with native grasses and legumes. Ground covering species must also be grown on the ridge in order to protect the structure (UNEP, 1998).
• In the upper Tana catchment, to augment yields, banana plants can be placed within a square pit and backfilled partially with a mixture of manure and excavated soil. Some room is left for water to pond. The rest of the excavation material is used to form a bund on the lower side of the pit (Onduru & Muchena, 2011). A similar technique (called tumbukiza) is used for the cultivation of nippier grass for fodder (Orodho, n.d.).
• Pitting has been used in Turkana district in conjunction with V shaped bunds. Every tree plant is placed in a 2.5 m³ hole situated at the angle of each “V” (Mati, 2006).
• The “Five by Nine System” has been developed by KIOF (Kenyan Institute of Organic Farming) and promoted in Machakos, Kirinyaga, Mbeere, and Murang’a. It owes its name to the number of seeds used per pit. In dry areas five seeds are planted along the diagonals, whereas in the wetter areas this number goes up to nine (Mati, 2006).
90
Technique Costs per ha (USD/ha)
labour per ha (PD/ha)
Benefits (various)
Zai 8* 30 - 70 (+ 20 maintenance) Yield doubled; 0.7 - 1 t/ha
Planting pits and stone bunds
77 - 175 27 - 175 (+ 21 maintenance) Not available
Katumani 100 - 150 Not available DMT 5 - 10 times higher
Chololo pits Not available 30 - 40 (+ 15 - 20 maintenance) Yield doubled
Banana pits 2177 378 (+ 81 maintenance) 1561 USD GM/haBCR = 2.8
Sugar cane Not available > 100 Doubled production 500 income /year
Tumokiza Not available Not available NPV = 1280 USDBCR = 5,27EIRR = 4.85
* Assumed that voluntary labour input is provided by farmers.EIR GM= Gross margin; BCR= Benefits Costs Ratio; DMT= Dry Matter Production; NPV= Net Present Value
(Source: Critchley, 2003; Orodho, 2006; UNEP, 1998; Onduru, 2011)
Table 43. Costs and benefits of planting pits
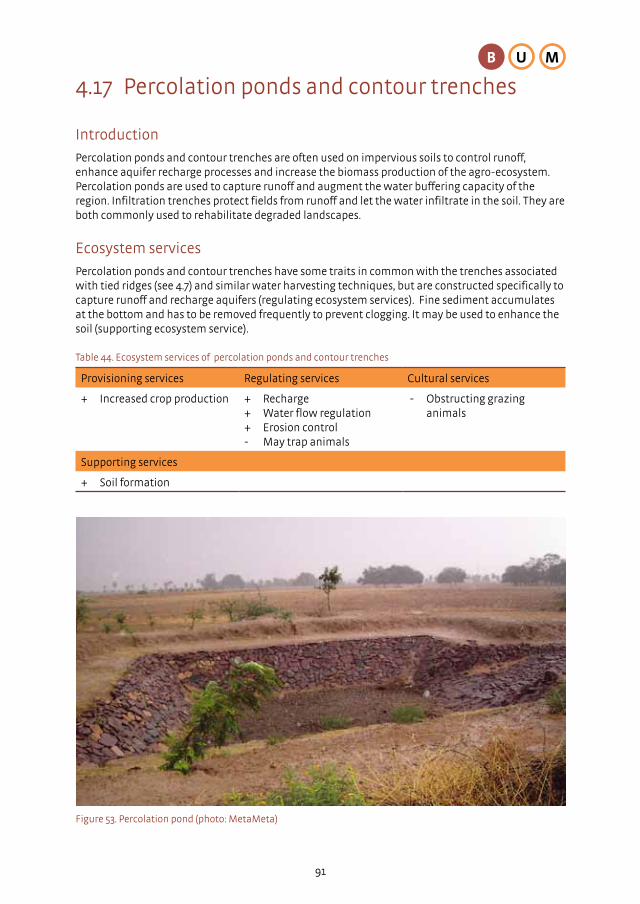
91
4.17 Percolation ponds and contour trenches
Introduction
Percolation ponds and contour trenches are often used on impervious soils to control runoff, enhance aquifer recharge processes and increase the biomass production of the agro-ecosystem. Percolation ponds are used to capture runoff and augment the water buffering capacity of the region. Infiltration trenches protect fields from runoff and let the water infiltrate in the soil. They are both commonly used to rehabilitate degraded landscapes.
Ecosystem services
Percolation ponds and contour trenches have some traits in common with the trenches associated with tied ridges (see 4.7) and similar water harvesting techniques, but are constructed specifically to capture runoff and recharge aquifers (regulating ecosystem services). Fine sediment accumulates at the bottom and has to be removed frequently to prevent clogging. It may be used to enhance the soil (supporting ecosystem service).
Figure 53. Percolation pond (photo: MetaMeta)
Provisioning services Regulating services Cultural services
+ Increased crop production + Recharge+ Water flow regulation + Erosion control- May trap animals
- Obstructing grazing animals
Supporting services
+ Soil formation
Table 44. Ecosystem services of percolation ponds and contour trenches
MB U

Specifications and requirements
Percolation ponds
Ponds can be dug in every kind of landscape in which topography guarantees enough runoff. They need to be built on pervious deep soils to guarantee the recharge of the underlying aquifer. They can be constructed alone or in series, in different shapes. It is important to remove silt accumulated at the bottom 3-4 times per rainy season in order to guarantee proper infiltration. Where the soil is erodible, it is suggested to reinforce the lateral walls to prevent erosion (Desta, Carucci, & Wendem-Agenehu, 2005).
Contour trenches
Trenches are built along the contour lines without a lateral sloping angle. The water which runs off from upslope falls into the trench eventually infiltrates into the soil. Trenches are an effective means to break long slopes and thus to reduce runoff. On slopes higher than 10% they are preferred over contour bunds as they are less likely to be breached by excessive runoff. Due to the increased green water in the soil profile, water-demanding trees, such as banana, can be planted. They need careful maintenance, as there is a high risk of gullying (Roose, 1996). A common design involves digging discontinuous and staggered trenches on the contour of lengths up to 4 m and with gaps of 4 m. The trench has to be 50 cm wide and 50 cm deep. The excavated soil must be carefully spread on the downward slope and grasses should be planted to stabilize it. The horizontal interval between lines depends on the slope, the soil permeability and the amount of runoff to be stored. In general, trenches should never be more than 30 m apart or closer than 10 m (NREGA, 2006).
92
Figure 54. Contour trenches (photo: MetaMeta)

93
Labour establishment
Labour maintenance
NPV
(USD)
Total costs
(USD)
BCR IRR (%)
Contour trenches with maize and beans
Not available Not available 17,094 13,560 1.3 194
Contour trenches
300 PD/ha 20 - 50 PD/ha Not available
Not available
Not available
Not available
Percolation pond
0.5 - 1 PD/m³ Not available Not available
Not available
Not available
Not available
NPV=Net Present Value; BCR = Benefit Cost Ratio; IRR = Internal Rate of Return. The infiltration ditches with maize and beans.
(Source: Onduru & Muchena, 2011; Roose, 1996; Desta et al., 2005)
Costs and benefits
Table 45. Costs and benefits of contour trenches and percolation pond
Constraints
• Do not make trenches on slopes steeper than 25%. Use vegetative measures instead. • Do not make trenches on slopes less than 10%. Make contour bunds instead. • Do not excavate trenches where there already is dense vegetation. • Do not excavate trenches across drainage ditches and streams. • Do not cut roots in the trenches. • Always start constructing trenches from the higher section of the field to be treated. • Trenches can obstruct the movement of livestock and wildlife. Continuous trenches are
especially disliked by pastoralist communities.
94
4.18 Tube recharge
Introduction
Many hand-dug wells dry up by the end of the dry season due to limited rainwater infiltration in the ground. Reasons for this include change in rain patterns, erosion, loss of vegetation, and compact topsoil layers.
One way to increase the water volume in the aquifer is by using the so-called “tube recharge”. This is a low-cost option combining a manually drilled hole with a drainage tube, a filter, and a storage tank or pond.
Part of the rainwater, that would otherwise run off to rivers or would be lost to evaporation, can infiltrate into the soil and reach the first aquifer. To notice the effect of tube recharge it is advised to install the system near a well that dries up during the dry season. Depending on flow patterns of the groundwater, part of the recharged water will stay around the well and can be pumped up in the dry season.
Pilots in Ghana, Zimbabwe, and Zambia indicate that families using tube recharge now have water in their wells throughout the year while they would earlier be dry during 2 to 4 months. However, tube recharge is only useful in areas where all or part of the rainwater runs off to rivers. The volume of the storage tank or the pond depends on the local context. For instance, in areas with low infiltration and few but intensive rain events, a large storage is needed.
Ecosystem services
The technique of tube recharge mainly benefits wells for domestic use, thus providing a different provisioning ecosystem services. Regulating services however, are comparable to those of other techniques that enhance infiltration and underground water storage, such as percolation ponds and contour trenches (see 4.17).
B U
Provisioning services Regulating services Cultural services
+ Increased water supply + Water flow regulation+ Water infiltration and underground storage+ Erosion control
Supporting services
- May create water-logged soil
Table 46. Ecosystem services of tube recharge
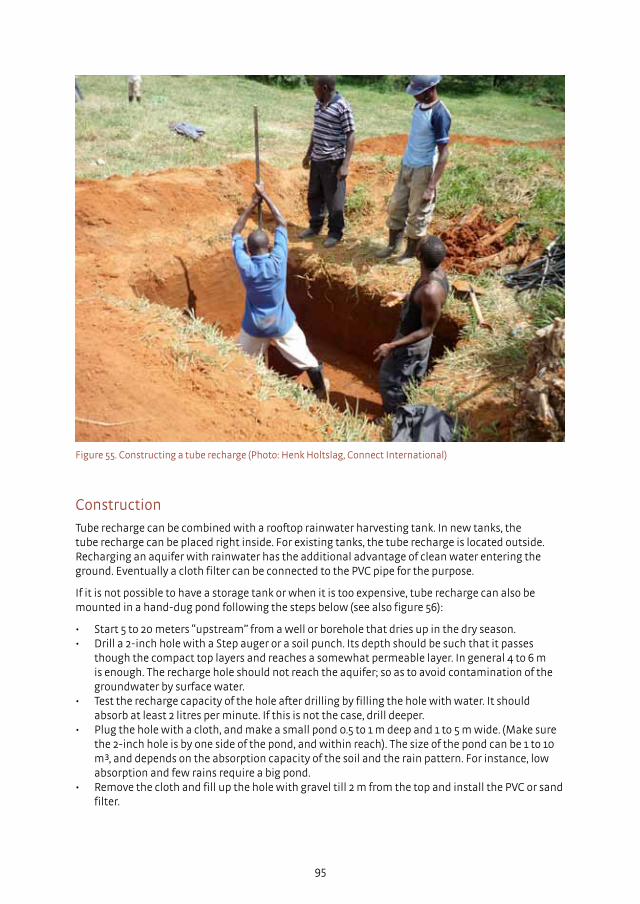
95
Construction
Tube recharge can be combined with a rooftop rainwater harvesting tank. In new tanks, the tube recharge can be placed right inside. For existing tanks, the tube recharge is located outside. Recharging an aquifer with rainwater has the additional advantage of clean water entering the ground. Eventually a cloth filter can be connected to the PVC pipe for the purpose.
If it is not possible to have a storage tank or when it is too expensive, tube recharge can also be mounted in a hand-dug pond following the steps below (see also figure 56):
• Start 5 to 20 meters “upstream” from a well or borehole that dries up in the dry season. • Drill a 2-inch hole with a Step auger or a soil punch. Its depth should be such that it passes
though the compact top layers and reaches a somewhat permeable layer. In general 4 to 6 m is enough. The recharge hole should not reach the aquifer; so as to avoid contamination of the groundwater by surface water.
• Test the recharge capacity of the hole after drilling by filling the hole with water. It should absorb at least 2 litres per minute. If this is not the case, drill deeper.
• Plug the hole with a cloth, and make a small pond 0.5 to 1 m deep and 1 to 5 m wide. (Make sure the 2-inch hole is by one side of the pond, and within reach). The size of the pond can be 1 to 10 m³, and depends on the absorption capacity of the soil and the rain pattern. For instance, low absorption and few rains require a big pond.
• Remove the cloth and fill up the hole with gravel till 2 m from the top and install the PVC or sand filter.
Figure 55. Constructing a tube recharge (Photo: Henk Holtslag, Connect International)
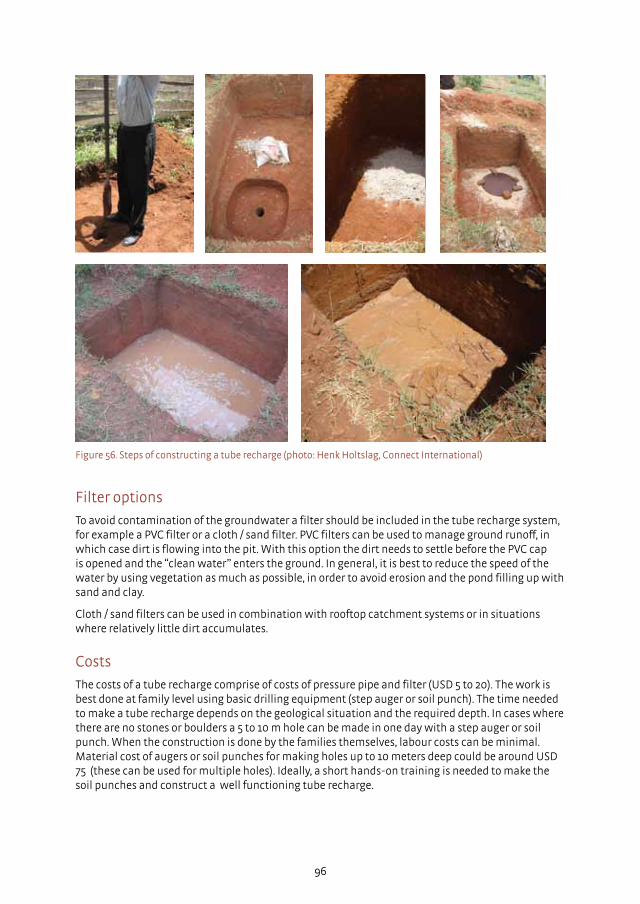
Filter options
To avoid contamination of the groundwater a filter should be included in the tube recharge system, for example a PVC filter or a cloth / sand filter. PVC filters can be used to manage ground runoff, in which case dirt is flowing into the pit. With this option the dirt needs to settle before the PVC cap is opened and the “clean water” enters the ground. In general, it is best to reduce the speed of the water by using vegetation as much as possible, in order to avoid erosion and the pond filling up with sand and clay.
Cloth / sand filters can be used in combination with rooftop catchment systems or in situations where relatively little dirt accumulates.
Costs
The costs of a tube recharge comprise of costs of pressure pipe and filter (USD 5 to 20). The work is best done at family level using basic drilling equipment (step auger or soil punch). The time needed to make a tube recharge depends on the geological situation and the required depth. In cases where there are no stones or boulders a 5 to 10 m hole can be made in one day with a step auger or soil punch. When the construction is done by the families themselves, labour costs can be minimal. Material cost of augers or soil punches for making holes up to 10 meters deep could be around USD 75 (these can be used for multiple holes). Ideally, a short hands-on training is needed to make the soil punches and construct a well functioning tube recharge.
96
Figure 56. Steps of constructing a tube recharge (photo: Henk Holtslag, Connect International)

97
4.19 Subsurface dams
Introduction
Seasonal streams often create sand deposits that can contain great volumes of water even when the streams are running dry. These coarse sand deposits can be a viable source of fresh water during the dry season. Water holes made through these deposits in river beds are traditionally hand-dug (see figure 57). The amount of water drawn from a dry stream can be increased by using a barrier (sub-surface dam) to stop the underground flow of water (below the riverbed) and to raise the level of water trapped in the alluvial deposit.
Ecosystem services
As substantial construction works are required for subsurface dams, the impact on ecosystem services can be quite significant. During the construction phase, the stream and its immediate surroundings (and with that, many ecosystem services) will be substantially disturbed as heavy machinery is often required. The table below lists the potential ecosystem services once the subsurface dam is functional, mainly in the domain of regulating services.
Figure 57. Traditionally, water is manually scooped out of a dry riverbed. Subsurface dams play an important role to increase the available amount of water and sand (photo: MetaMeta).
B U LM
Provisioning services Regulating services Cultural services
+ Increased water supply + Recharge+ Retention + Reuse+ Water flow regulation+ Erosion control
+ Maintenance of river functions
Supporting services
+ Stabilization of river bed
Table 47. Ecosystem services of subsurface dams

Requirements
Readily available and cheap materials are preferred for the construction of sub-surface dams. Clay, masonry walls, bricks, concrete, tarred felt, plastic sheets and corrugated metal sheets are most commonly used. (Hanson & Nilsson, 1986; Onder & Yilmaz, 2005).
Design
The basic know-how necessary to build a sub-surface earthen dam refers to the traditional practice of seeking water in “water holes” along dried-out streambeds. Indigenous knowledge about local plant species is crucial. In fact, different trees have different root lengths, that can therefore point out where to find the shallowest source of water (Nissen-Petersen DANIDA, 2006).
The structure can be easily constructed with compacted clay obtained from riverbanks. This material needs to have a low permeability in order to form an effective barrier against the water flow. Of vital importance is the location of the dam. The ideal point is a narrow passage with the riverbed bottom close to the surface.
Before constructing the dam, a thorough inspection must be carried out. The depth of the sand deposit and the depth of the water deposit should be measured; this can be done by hammering graduated iron rods into the riverbed.
It is important to pay attention to the sediment grain size during the construction. The finer the particles of the deposit, the harder it is to extract a substantial amount of water (see table 48). A general rule can be used: rocky, steep catchments tend to produce coarser sediments, while flat farmlands tend to produce finer particles. The extractable capacity of the sand can be easily measured in the field by saturating 20 l of sand and by measuring the water that naturally drains out of it. The clay used as building material has to be the most impermeable found around the stream.
98
Figure 58. Subsurface dam scheme in dry riverbed (source: Hanson & Nilsson, 1986)
Sand Silt
Coarse Medium Fine Silt
Volume of water 35% 25% 19% 5%
(Source: Nissen-Petersen)
Table 48. Volume of extractable water (% on total volume) from different soil texture classes
The most important construction criteria are summarized below.
• To build the dam, a strip of sand is cleared across the riverbed until the bedrock is reached. A 60 cm deep ditch is excavated in the impermeable floor to ensure a solid and watertight foundation.
• The ditch is filled with consecutive layers of clay. Each layer is moistened and compacted (Hanson & Nilsson, 1986).
• Once the foundation is complete, the dam structure is erected until it reaches a height of 30 cm under the riverbed to allow overflow.
• The downstream wall and the upstream sides of the dam wall are cut and smoothened to an angle of 45 degrees (Nissen-Petersen, 2006).
• When dealing with saline waters, it is suggested to keep the embankments 80-100 cm below the sand level (Onder & Yilmaz,
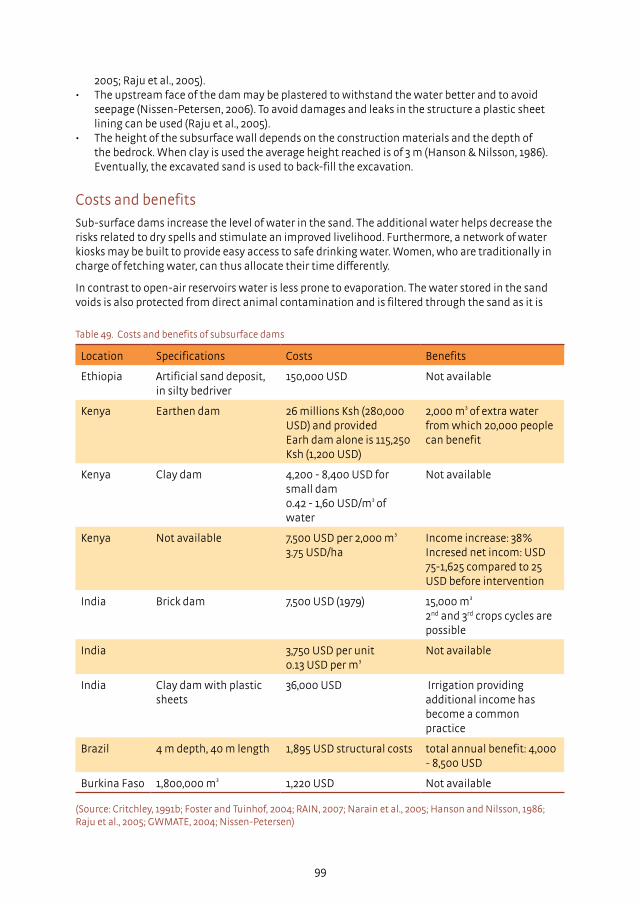
99
2005; Raju et al., 2005). • The upstream face of the dam may be plastered to withstand the water better and to avoid
seepage (Nissen-Petersen, 2006). To avoid damages and leaks in the structure a plastic sheet lining can be used (Raju et al., 2005).
• The height of the subsurface wall depends on the construction materials and the depth of the bedrock. When clay is used the average height reached is of 3 m (Hanson & Nilsson, 1986). Eventually, the excavated sand is used to back-fill the excavation.
Costs and benefits
Sub-surface dams increase the level of water in the sand. The additional water helps decrease the risks related to dry spells and stimulate an improved livelihood. Furthermore, a network of water kiosks may be built to provide easy access to safe drinking water. Women, who are traditionally in charge of fetching water, can thus allocate their time differently.
In contrast to open-air reservoirs water is less prone to evaporation. The water stored in the sand voids is also protected from direct animal contamination and is filtered through the sand as it is
Location Specifications Costs Benefits
Ethiopia Artificial sand deposit, in silty bedriver
150,000 USD Not available
Kenya Earthen dam 26 millions Ksh (280,000 USD) and providedEarh dam alone is 115,250 Ksh (1,200 USD)
2,000 m³ of extra water from which 20,000 people can benefit
Kenya Clay dam 4,200 - 8,400 USD for small dam0.42 - 1,60 USD/m³ of water
Not available
Kenya Not available 7,500 USD per 2,000 m³
3.75 USD/haIncome increase: 38%Incresed net incom: USD 75-1,625 compared to 25 USD before intervention
India Brick dam 7,500 USD (1979) 15,000 m³
2nd and 3rd crops cycles are possible
India 3,750 USD per unit0.13 USD per m³
Not available
India Clay dam with plastic sheets
36,000 USD Irrigation providing additional income has become a common practice
Brazil 4 m depth, 40 m length 1,895 USD structural costs total annual benefit: 4,000 - 8,500 USD
Burkina Faso 1,800,000 m³ 1,220 USD Not available
(Source: Critchley, 1991b; Foster and Tuinhof, 2004; RAIN, 2007; Narain et al., 2005; Hanson and Nilsson, 1986; Raju et al., 2005; GWMATE, 2004; Nissen-Petersen)
Table 49. Costs and benefits of subsurface dams

100
extracted.
Furthermore, open water is often a good breeding place for mosquitoes that can carry malaria and other harmful pathogens. Sub-surface dams provides a reservoir free of pathogens and venomous snakes. Such confined aquifers have been used to avoid salty water intrusion in coastal areas (Onder & Yilmaz, 2005).
Constraints
The main causes of non-functional sub surface dams include (Foster and Tuinhof, 2004):
• Errors in site selection resulting in insufficient storage potential; • Insufficient depth before one reaches relatively impermeable bedrock; • Location in a soil type with very low infiltration capacity; • Location in a soil type that could lead to severe groundwater salinization; • Poorlyconstructed,low-yieldingabstractionwells;• Constraintsrelatedtolandownership.

101
4.20 Sand dams
Introduction
Sand dams build up new sand deposits in riverbeds. A considerable amount of water can be stored in such sand deposits during the rainy season. With their high water conductivity, such deposits act like sponges that will retain water that can be used during drier periods. Sand dams also have a considerable effect on increasing water storage in the riverbanks immediately adjacent to the new stand storage.
By constructing a barrier in a dry riverbed, the coarser sediments transported by the water flow can be forced to settle and accumulate. Season by season, the alluvium increases and can be used as an excellent water recipient (Hanson & Nilsson, 1986). The location of the structure should be carefully chosen and the different parameters should be considered. The sediments should be as coarse as possible and the riverbank should be high, in order to allocate the sediment yielded from the dam.
Figure 59. Sand dam (photo: Paul van Koppen)
B LM
Ecosystem services
Similar to subsurface dams (see 4.19), ecosystem services provided by sand dams may be severely impacted during the construction phase. But once in place, regulating services are expected to increase.
Table 50. Ecosystem services of sand dams
Provisioning services Regulating services Cultural services
+ Increased water supply + Recharge+ Retention+ Reuse+ Sediment trapping + Erosion control - Obstruction for migrating species
+ Maintenance of river functions
Supporting services
+ Stabilization and regeneration of river bed

Construction
The dam is preferably constructed in stages with 30 cm to be added to the dam crest every year. The idea is that with a low crest height only coarse sediment, especially sand, is trapped behind the dam. Through its gradual process, a considerable sand storage can be created over a number of years (Nissen-Petersen, 2006).
Furthermore, the maximum height of the dam should be calculated according to the maximum flood level. It should never be higher than the riverbanks (RAIN, 2009), usually reaching 1-4 m (Onder & Yilmaz, 2005). Once the optimal construction site is identified, the construction starts by digging a trench until the impermeable bedrock is reached. Consequently, the foundation is constructed by laying a 60 cm key anchored in the rock. Thereafter, the first 30 cm concrete step can be raised.
Once the reservoir behind the structure is filled with sand, the dam crest can be further heightened by 30 cm. This procedure goes on until the design height is reached (Nissen-Petersen, 2006). In order to prevent damages caused by the overflow on the downstream foundation and on the wings, the toe of the dam should be reinforced with a stilling basin of boulders and concrete (Onder & Yilmaz, 2005; RAIN, 2009).
Experience shows that in many cases building a sand dam in many small stages over the years does not work. An alternative design involves the construction of a weir with a central notch spillway. This notch is subsequently closed in little steps as the sand storage builds up. Even in this case the structure is raised in stages as the sediments accumulate (Hanson & Nilsson, 1986). Alternatively, a series of low sand dams is built rather than single a high dam.
Sand dams should be not wider than 25 m, in order to avoid excessive expenditures due to the required extra reinforcement (Nissen-Petersen, 2006).
To abstract water, wells may be developed on the riverbank in such a way that the sand storage is not disturbed and damage from floods is prevented. Alternatively or in conjunction, a downstream tap can be connected to a drainpipe placed behind the wall and protected by a gravel filter (RAIN, 2009).
If the slope of a river is too steep and the water velocity too high, the retaining walls and downstream apron of the sand dam should be enlarged.
Costs and benefits
Sand dams bring multiple benefits to local communities. Water availability is improved in quality and quantity. Women and children, who often spend many hours to seek and fetch water, can save time and engage in other activities. Consequently – as indirect benefits - school attendance increases and household economy improves. In Kitui, after the construction of sand dams, the time spent to look for water went down from 140 minutes to 90 minutes, with the average walking distance decreased from 3 km to 1 km. Additionally, the average annual household income increased from USD 230 to USD 350 (van Steenbergen and Tuinhof, 2009). In table 51 various figures related to costs and benefits are presented.
Constraints
When constructing a sand dam it is important to keep in mind the main causes that have led to past failures. The main causes of non-functionality include (Foster and Tuinhof, 2004):
• Errors in site selection resulting in insufficient storage potential; • Impossibility of reaching relatively impermeable bedrock; • Location in a soil type with very low infiltration capacity; • Location in a soil type that could lead to severe groundwater salinization; • Too short a stilling basin causing the dam to unsettle or topple over;
102

103
Source: Yitbarek et al., 2010; RAIN, 2007; Batchelor et al., 2011; RAIN, 2007; Hanson and Nillson, 1986; Nissen-Petersen
Table 51. Costs and benefits of various sand dams in Ethiopia and Kenya
Figure 60. When several sand dams are placed behind each other a larger area will be regenerated as is the case in Nyumbani, Kenya (photo: MetaMeta)
Location Costs Benefits
Ethiopia • 15,000 USD (Concrete block dam in 1981)
It reaches 500 people
• 6,842 USD for materials (2007) Not available
Kenya • 4,0888 USD (2006)• 1,750 USD of labour from
community• 18,000• 10 - 25 USD/m3
• 3,645 USD• 1. 82 USD/m3
• 10,000 - 15,000 USD infrastructure develoment (including 3 to 4 wells) and 1,000 - 1,500 USD/yr maintenance
Not available
Income raised from 155 - 250 USD (2008)
• Disturbance of the sand storage (holes excavated for accessing water or for mining sand tend to fill up with clay and fine sediment), leading to a reduction in its storage capacity.
Variations
• Sand dams can also be used to harvest sand for use as building material. It is important in this case to remove an entire top layer of sand so that the riverbed is replenished with sands and gravels in subsequent floods.
• Low causeways (or Irish bridges) also double up as sand dams. The cross-drainage function on the low causeway may be carefully controlled so as to optimise storage while at the same time increasing upstream water levels.
4.21 Sand dune and desert water infiltration
Introduction
Sand dunes are a good medium to store water due to their high water conductivity and high porosity. The water stored in ponds in the sand dunes will eventually infiltrate and, as it is abstracted, will be purified by sand layers. Sand dunes can form substantial underground water reservoirs and provide safe drinking water to urban settlements. Moreover, they can also act as a barrier against saline water intrusion. Atlantis, a South African town of 100,000 inhabitants, treats its own municipal wastewater and recharges its aquifer using a series of sand dune infiltration ponds (van Steenbergen & Tuinhof, 2010). Similarly, in the Dan region (Israel), wastewater is spread on sand dune ponds to recharge a shallow sandstone aquifer (Columbus, 1973).
Ecosystem services
The impacts of water storage and infiltration in sand dunes on ecosystem services depend on whether the dunes are natural or created artificially. Once the system is in place, there is usually open water storage, infiltration and sedimentation (all regulating services). However, the ecosystem services of the pond itself may not reach the population if the area is enclosed. Sediments cleaned from the bottom of the pond to prevent formation of an impervious layer, can be used elsewhere to improve the soil quality.
104
Provisioning services Regulating services Cultural services
+ Increased water supply - Reduction of arable area
+ Recharge+ Reuse+ Sediment trapping + Water flow regulation+ Water purification+ Increase of freshwater biodiversity - Breeding ground for vectors of disease
- Obstructing grazing animals + Visually attractive
Supporting services
+ Soil formation
Table 52. Ecosystem services of sand dune water infiltration
Construction
To build a sand dune infiltration system two elements are needed: a storage medium, and a source of water. A highly permeable and deep sand deposit on top of a shallow aquifer is often used both as storage and filter. The right location to retain water can either be found as a natural depression or can created by dikes. The high permeability of the dune area explains the low runoff generated and calls for an alternative source of water. Storm water can be diverted from the town drainage system into the infiltration ponds. Treated domestic wastewater can also be fed into the system (van Steenbergen & Tuinhof, 2010). In The Dan scheme, the pond system is fed by the municipal wastewater that has been treated in oxidation ponds.
The percolation ponds are flushed periodically to prevent the soil from forming an impermeable crust that would slow down infiltration (Columbus, 1973). There are some other measures that can also be adopted to serve the purpose. For instance, a coarse sand layer of 0.5 m can be spread on the pond floor to delay the effect of siltation. Alternatively, the ponds can be dried and the pond floor
B L

105
treated from time to time (Gale & Recharge, 2005).
Constraints
• A relatively clean source of water is needed; • Not suitable on fill sites or slopes; • Risk of groundwater contamination if the medium is too coarse or too shallow; • Storage of open water may increase the incidence of water related diseases; • A sound management is needed to prevent siltation in the pond; • The ponds need a relatively large surface area;
• The area must be enclosed and protected from contamination.
Variations
Similarly, sandy patches in deserts can be used to infiltrate flood water from temporary rivers. This is for instance done in Kassala in Sudan. ‘Hout’ infiltration ponds are used to recharge local aquifers and wells that serve small desert towns. The recharging water comes from the local spate irrigation system. Part of its discharge is diverted on a priority basis to the infiltration ponds (figure 62).
Figure 62. Hout infiltration pond with wells seen at the centre (photo: Abraham Mehari Haile)
Figure 61. Trench collecting seepage water from dune in relatively high rainfall area (Hai Duong, Central Vietnam). The water is used for irrigation purposes (photo: MetaMeta).

4.22 Harvesting water from roads
Introduction
Rainwater runoff from roads during rainy seasons is often considered undesirable as it can damage the road by creating gullies. However, this runoff can be harvested and utilized.
During a 30 mm rain shower, a 1 km-long, 4 m-wide road catches 96,000 l of water. Depending on the road surface (less water is lost on tarmac roads with lined drains than dirt roads) a substantial amount of this rainwater can be harvested. Once the rainwater has been harvested properly, road drainage can be used for storage and recharge. Water harvesting from roads can be carried out under a range of circumstances, but is especially suitable in arid and semi-arid regions. The average seasonal rainfall in such areas is around 600 mm, which represents much potential for utilizing this particular mode of water harvesting
Figure 63. Aerial view of road runoff stored in a hill side dam and used for domestic and livestock water source (photo : Nissen-Petersen)
106
LM
Ecosystem services
Similar to other water harvesting techniques, this method involves storing water and allowing it to infiltrate. The resultant ecosystem services and disservices depend on the type of road, feeder canal, and storage facilities.
C

107
Requirements
Water can be harvested off feeder roads through a wide variety of techniques, e.g. earth dams, tanks, underground cisterns, subsurface dams, water ponds, runoff farming, etc. The tools and materials needed depend on the chosen technique. The most common requirements include: sand, cement, stones, bricks, PVC pipes, water, lime, barbed wire, chicken mesh, transport and labour.
Provisioning services Regulating services Cultural services
+ Increased water supply - Reduction of arable area
+ Recharge+ Retention+ Reuse+ Water flow regulation+ Erosion control - Concentration of polluted water - Breeding ground for vectors of disease
+ Protection of roads from water damage
Supporting services
Table 53. Ecosystem services of water harvesting from roads
Technique Country Costs
Road runoff harvesting Kenya • 100 PD/ha (construction)• 10 PD/ha (maintenance)
Road catchment USA • 300 USD/acre (construction)
Runoff collection from paved and unpaved roads
Brazil, Argentina, Kenya • 100 PD/ha (construction)
(Source: Mati, 2005; UNEP 1998; Richardson et al., 2004; Stanton, 2005)
Table 54. Construction requirements
Design
In Kenya, ‘murram’ pits are situated next to roads as the murram (excavated soil) is used in the road construction. Using murram pits (also known as borrow pits) is the most common technique to harvest runoff water from roads in the region. This only involves excavation and transport of soil, which can be easily done - manually or with oxen. By digging two trenches water can be easily diverted from the road to the pits. The slope of the trench should ideally have a gradient of 3 cm for every 100 cm, in order to prevent sedimentation in the pits. A spillway – protected by stones - can divert the surplus water to its original course. The best way to determine the optimum height for the spillways is to build them in stages.
In China, over 50,000 rainwater harvesting tanks were constructed for irrigation purposes during dry periods. The underground tanks have been built along roads and use drainage water. The tanks are cylindrical, with a volume of 30 m³, are 25 cm thick and have a small opening on the top. The materials used include limestone rocks, bricks and sand. The tanks have two pipes: a smaller one for
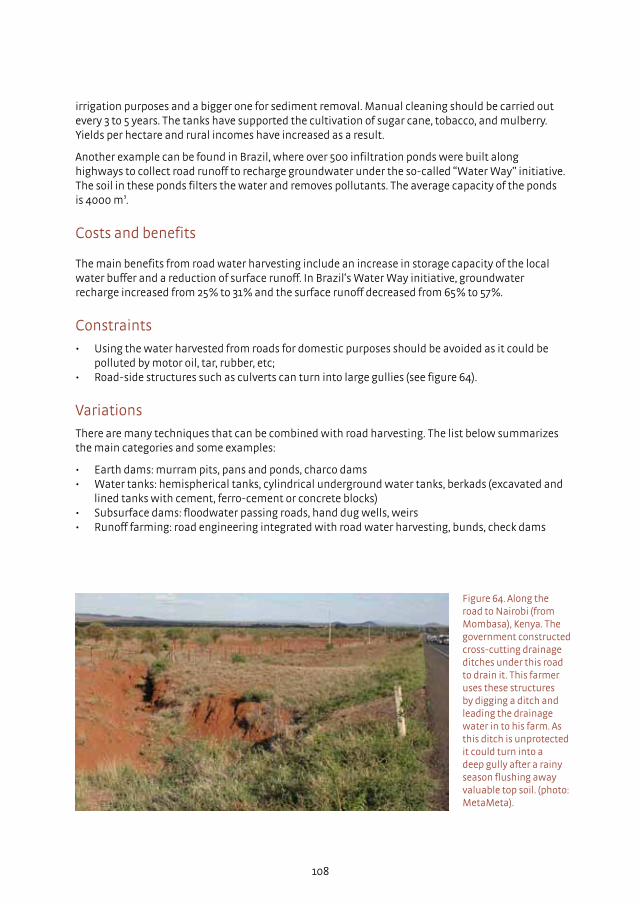
irrigation purposes and a bigger one for sediment removal. Manual cleaning should be carried out every 3 to 5 years. The tanks have supported the cultivation of sugar cane, tobacco, and mulberry. Yields per hectare and rural incomes have increased as a result.
Another example can be found in Brazil, where over 500 infiltration ponds were built along highways to collect road runoff to recharge groundwater under the so-called “Water Way” initiative. The soil in these ponds filters the water and removes pollutants. The average capacity of the ponds is 4000 m³.
Costs and benefits
The main benefits from road water harvesting include an increase in storage capacity of the local water buffer and a reduction of surface runoff. In Brazil‘s Water Way initiative, groundwater recharge increased from 25% to 31% and the surface runoff decreased from 65% to 57%.
Constraints
• Using the water harvested from roads for domestic purposes should be avoided as it could be polluted by motor oil, tar, rubber, etc;
• Road-side structures such as culverts can turn into large gullies (see figure 64).
Variations
There are many techniques that can be combined with road harvesting. The list below summarizes the main categories and some examples:
• Earth dams: murram pits, pans and ponds, charco dams • Water tanks: hemispherical tanks, cylindrical underground water tanks, berkads (excavated and
lined tanks with cement, ferro-cement or concrete blocks) • Subsurface dams: floodwater passing roads, hand dug wells, weirs • Runoff farming: road engineering integrated with road water harvesting, bunds, check dams
Figure 64. Along the road to Nairobi (from Mombasa), Kenya. The government constructed cross-cutting drainage ditches under this road to drain it. This farmer uses these structures by digging a ditch and leading the drainage water in to his farm. As this ditch is unprotected it could turn into a deep gully after a rainy season flushing away valuable top soil. (photo: MetaMeta).
108

109
4.23 Small hill-side storages
Introduction
Hill-side storage ponds (also referred to as dams) can be used to harvest and store rainfall or runoff water. Water is stored during periods of high rainfall, while it can be released (for agricultural purposes or domestic use) during dryer periods. Hill-side dams are built in the highlands on sloping land and are easy and cheap to construct and maintain. They can be built in a large variety of sizes using different methods.
Ecosystem services
Hill-side dams are basically used to store water. A large volume is stored in the pond behind the dam and allowed to infiltrate.
Figure 65. Small dam in a slopy area (photo: Mathias Gurtner, GIZ)
Provisioning services Regulating services Cultural services
+ Increased water supply - Reduction of arable area
+ Retention+ Reuse+ Water flow regulation+ Erosion control - Breeding ground for vectors of disease - Poor quality water
+ Stone or cement dam can be used for water based activities (e.g. laundry)
Supporting services
Table 55. Ecosystem services of small hill-side storages
UC

Requirements
Soils with high clay content are most suitable to construct hill-side dams. The dams can be built on almost all kinds of sloping land with rainwater runoff. Attention must be paid to potential sources of pollution such as latrines.
Design
Hill-side dams are semi-circular. The dam wall, constructed of earth, is highest in the middle and lower on either side (see figure 66). The lower sides function as a spillway and should therefore be horizontal and of the same height. The dam wall should be at least 100 cm higher in the middle than the two ends. To reinforce the spillways, a combination of large stones and deep-rooted grass can be placed upon them.
Excavation works begin after an outline is drawn on the ground. They can be carried out manually or using oxen or a tractor. Hill-side dams can be enlarged over a number of years by raising their height and deepening the reservoir (up to 4 m).
Costs and benefits
The main costs of storage ponds are incurred during construction. Benefits should be calculated over the life of the dam (at least 10 years). Economic benefits should be estimated in terms of the value of saved time and labour, that would otherwise be spent on fetching water. Other benefits include the improved condition of livestock, income from sale of irrigated produce, and improved nutritional levels in the labour force. These benefits can be compared with the costs of construction to estimate the feasibility of storage ponds (see table 56 and 57).
Constraints
Storage ponds can have negative impacts such as land loss, increased incidence of water borne diseases, and the risk of dam wall collapse. Various preventive measures can be taken to address these constraints (see table 58). When risks are too high, alternative dam sites should be identified.
Figure 66. Illustration of a hill-side dam (source: RELMA, 2005)
110

111
(Source: Nissen-Petersen, 2006)
Reservoir type Construction costs
Hill-side dames: manual excavation per m³ (Kenya) 100 Ksh
Hill-side dams: tractor per m³ (Kenya) 80 Ksh
Hill-side dams: oxen per m³ (Kenya) 60 Ksh
Table 56. Construction costs of hill-side dams and ponds
Examples of annual savings Value (Ksh)
Labour saved on fetching water (3 months x 5,000Ksh 15,000
Labour saved on watering livestock (3 months x 5,000 Ksh) 15,000
Income from sale of tomatoes and kale from one quarter irrigated acre 12,000
Savings from household consumption of tomatoes and kale 500
Total income from a 1,000 m³ water reservoir after a rainy season 42,500
(Source: RELMA, 2005)
Table 57. Estimated annual value of benefits from a reservoir in Kenya of 1000 m³
Constraint Preventive measures
Risk of increased cases of malaria, bilharzia, cholera, dysentery and typhoid
• Fencing the reservoir and using hand dug wells or draw-off pipes to fetch water
• Using sand filters and hand pumps to treat water at household level and pump water from the reservoir
High evaporation rate - particularly in low lying areas
• Deepening ponds (trapezoidal or bowl-shaped) - in general 3 m is a recommended depth, balancing ease of access and construction, and reduced evaporation losses
• Roofs (on small ponds), possibly with useful creepers like passion fruit
• Planting of windbreak to reduce evaporation by wind
Sedimentation/siltation • Vegetative sediment traps
Contamination by livestock • Trenches or fences to prevent livestock from entering the pond
• Employing guards
Seepage • Lining with polyethylene or geotextile • Plastering with clay • Using seepage constructively by constructing hand-
dug well
(Source: Nawaz and Van Steenbergen, 2010)
Table 58. Constraints and preventive measures of ponds
Variations
• Valley dams, to block part of the hill-side dam to capture seasonal water (Nissen-Petersen, 2006).

4.24 Water harvesting ponds
Introduction
Construction of ponds can make water available during dry spells in the rainy season, and for a few months after the rains cease. There are many different designs with varying shapes, materials and dimensions. The water concentrated in the ponds originates from the surrounding naturally sloping surfaces, or conveyed from paved surfaces (roads, paths) and channels (cutoff drains). The water is used to irrigate high value cash crops and fruit trees,, to water the livestock, and for domestic use. They are often established near homesteads were they can be easily reached.
Ecosystem services
As water harvesting ponds can be designed in many different ways, their impacts may also vary. When they are successful in collecting rain and runoff water, the ponds have many favourable water regulating services. Most ponds however, have open water. Especially when the sides have a gentle slope, habitat for mosquitoes may be created. The ponds may become convenient sources of water for domestic purposes, but when the water is stored for several weeks or more, the quality may deteriorate and become insufficient for bathing and watering animals, let alone for drinking water.
Figure 67. Small lined harvesting pond (photo: Bancy Mati)
112
Table 59. Ecosystem services of water harvesting ponds
U LMC
Provisioning services Regulating services Cultural services
+ Increased water supply - Reduction of arable area
+ Recharge+ Water flow regulation+ Erosion control - Breeding ground for vectors of disease - Poor quality water
- Animals and people may fall in and drown
Supporting services
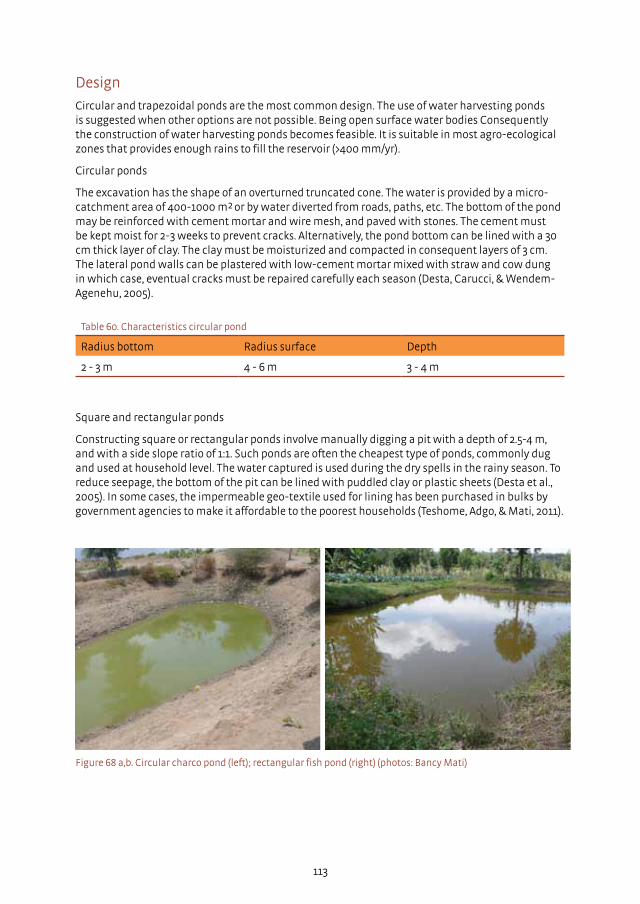
113
Design
Circular and trapezoidal ponds are the most common design. The use of water harvesting ponds is suggested when other options are not possible. Being open surface water bodies Consequently the construction of water harvesting ponds becomes feasible. It is suitable in most agro-ecological zones that provides enough rains to fill the reservoir (>400 mm/yr).
Circular ponds
The excavation has the shape of an overturned truncated cone. The water is provided by a micro-catchment area of 400-1000 m² or by water diverted from roads, paths, etc. The bottom of the pond may be reinforced with cement mortar and wire mesh, and paved with stones. The cement must be kept moist for 2-3 weeks to prevent cracks. Alternatively, the pond bottom can be lined with a 30 cm thick layer of clay. The clay must be moisturized and compacted in consequent layers of 3 cm. The lateral pond walls can be plastered with low-cement mortar mixed with straw and cow dung in which case, eventual cracks must be repaired carefully each season (Desta, Carucci, & Wendem-Agenehu, 2005).
Table 60. Characteristics circular pond
Radius bottom Radius surface Depth
2 - 3 m 4 - 6 m 3 - 4 m
Square and rectangular ponds
Constructing square or rectangular ponds involve manually digging a pit with a depth of 2.5-4 m, and with a side slope ratio of 1:1. Such ponds are often the cheapest type of ponds, commonly dug and used at household level. The water captured is used during the dry spells in the rainy season. To reduce seepage, the bottom of the pit can be lined with puddled clay or plastic sheets (Desta et al., 2005). In some cases, the impermeable geo-textile used for lining has been purchased in bulks by government agencies to make it affordable to the poorest households (Teshome, Adgo, & Mati, 2011).
Figure 68 a,b. Circular charco pond (left); rectangular fish pond (right) (photos: Bancy Mati)

Costs and benefits
114
Where Investment costs Cost per m³ (USD) Maintenance costs
Kenya 132 USD/100m³ 1.3 0.27 USD/m³
Ethiopia 154 USD for 1 plastic lined pond of 100m³,, 1 PD/m³
1.5 0.47 USD/m³
Pakistan Not available
0.4 - 1.2 (excavation costs for a pond of 3500 - 4500
m³)
Not available
(Source: Teshome 2011; SIDA, 2005; Nawaz and van Steenbergen )
Constraints
• Similar constraints and solutions as in the case of hill-side storage (described in 4.23) apply to ponds.
• Water can be lost to seepage. The soil can be lined or compressed to prevent this. Lined ponds, however, can be easily torn and require high maintenance.
• The micro-ponds need to be shaded in order to avoid malaria outbreaks. A simple cover can be made from straw, and sustained by a central pole that is fixed to the bottom of the pit (Desta et al., 2005).
• Not suitable on unstable soils.
Variations
• The ponds can be provided with an upstream silt trap in order to prevent clogging of the reservoir;
• Steps can be carved on one side of the pond to make it easy to fetch water; • If there is a constant supply of water, the pond can be used for fish farming.
For small household-level ponds in high-temperature, low-lying areas, using a roof to reduce evaporation has been recommended. The addition of solar stills to these roofs has been recommended as a means to improve the quality of drinking water, in which case the roof is made slanted. Water evaporating from the pond condenses against the roof and is then collected in a gutter from where it is collected – purified – and used for drinking water (Sardella, 2012).
Table 61. Costs and benefits of ponds

115
4.25 Harvesting water from rock outcrops
Introduction
Harvesting water from rock outcrops is widely used in the drylands of Kenya. A wide variety of techniques is currently in practice, ranging from harvesting from natural depressions such as rock pools and gorges to harvesting from complete rock catchments with dam walls. The largest rock catchment in Kenya can store up to 8 million litres of water (Nissen-Petersen, 2010). The amount of water generated by rock catchments is significant: a rock surface of 1 ha can harvest 1 million l of water from 100 mm rain (Nissen-Petersen, 2006).
Ecosystem services
These reservoirs are comparable to hill-side dams (see 4.23), but are typically situated on bare rock. Some of them are natural rock pools and maintaining them will only strengthen ongoing ecosystem services. In the case of dams, the impacts are somewhat different, and mainly in the domain of water regulating services. Besides, since the catchment is largely rock, there is less pollution of the stored water.
Figure 69. Rockdam with cattle trough (photo: MetaMeta)
Provisioning services Regulating services Cultural services
+ Increased water supply (for people, livestock and wildlife)
+ Retention+ Reuse+ Increase of freshwater biodiversity+ Water flow regulation - Breeding ground for vectors of disease
+ Maintaining the landscape
Supporting services
Table 62. Ecosystem services of water harvesting from rock outcrops
MC
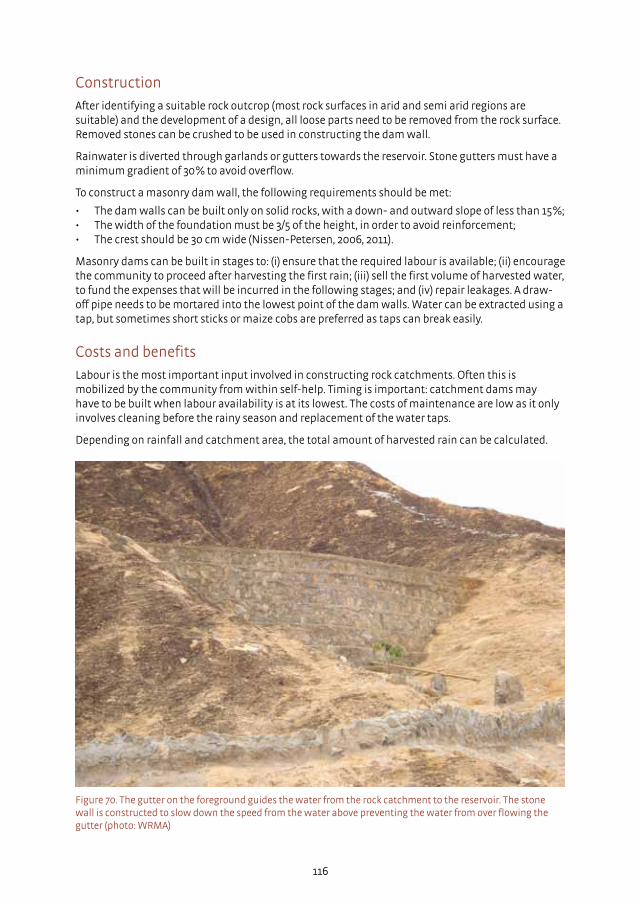
Construction
After identifying a suitable rock outcrop (most rock surfaces in arid and semi arid regions are suitable) and the development of a design, all loose parts need to be removed from the rock surface. Removed stones can be crushed to be used in constructing the dam wall.
Rainwater is diverted through garlands or gutters towards the reservoir. Stone gutters must have a minimum gradient of 30% to avoid overflow.
To construct a masonry dam wall, the following requirements should be met:
• The dam walls can be built only on solid rocks, with a down- and outward slope of less than 15%; • The width of the foundation must be 3/5 of the height, in order to avoid reinforcement; • The crest should be 30 cm wide (Nissen-Petersen, 2006, 2011).
Masonry dams can be built in stages to: (i) ensure that the required labour is available; (ii) encourage the community to proceed after harvesting the first rain; (iii) sell the first volume of harvested water, to fund the expenses that will be incurred in the following stages; and (iv) repair leakages. A draw-off pipe needs to be mortared into the lowest point of the dam walls. Water can be extracted using a tap, but sometimes short sticks or maize cobs are preferred as taps can break easily.
Costs and benefits
Labour is the most important input involved in constructing rock catchments. Often this is mobilized by the community from within self-help. Timing is important: catchment dams may have to be built when labour availability is at its lowest. The costs of maintenance are low as it only involves cleaning before the rainy season and replacement of the water taps.
Depending on rainfall and catchment area, the total amount of harvested rain can be calculated.
116
Figure 70. The gutter on the foreground guides the water from the rock catchment to the reservoir. The stone wall is constructed to slow down the speed from the water above preventing the water from over flowing the gutter (photo: WRMA)

117
As mentioned in the introduction, 1 ha can be used to harvest 1 million l of water from 100 mm of rain. For an area having two annual rainy seasons of 300 mm each, a rock catchment of 4049 m² (1 acre) can produce 2.4 million l of water. Assuming that a family uses 100 l of water per day, this rock catchment could serve 66 households. It must be noted though that some water is also lost to evaporation (losses depend on the availability of a roof and weather conditions.)
In 2011, people were paying 3 Kenyan shillings (0.03 USD) for 20 l of water harvested from rock catchments. The catchment mentioned in the example above could provide a turnover of USD 3370 per year (including a 10% loss to evaporation). The construction costs of a masonry catchment dam are given in table 63.
Figure 71. Rock catchment with water tanks (photo: WRMA)
(Source: Nissen-Petersen, 2006)
Item Quantity Costs (USD)
Cement 200 kg 32
Sand 0.7 ton coarse river sand 1
Water 200 l 3
Rubble stones 2.1 ton sizes over 60 cm 2
Skilled labour 2 man days 12
Unskilled labour 4 man days 12
Total 62
Table 63. Construction requirements and costs to build 1 m3 of masonry dam wall
118
Constraints
Water quality issues can arise when the catchment reservoirs are not cleaned. In addition, open reservoirs can serve as breeding ground for mosquitoes. This can be prevented by raising Tilapia Nilotica in the reservoirs; these fish feed on mosquito larvae. Evaporation losses can be high when reservoirs are not covered. To overcome this, it is recommended to roof the reservoir with ferro-cement.
Variations
• Earth dams can be built where rainwater runs off a rock catchment. These earth dams need wide spillways on both ends to be able to store the large volumes of runoff.
• Water tanks (figure 71) store a fixed volume of water. They are used widely, as the technique is easily understood by local constructors. However, the costs are relatively high and the tanks can dry up as the storage is limited. On the other hand water tanks have no losses due to seepage or evaporation.
• Depending on the type and shape of the rock catchment, different shapes of masonry walls can be used, e.g.: single/multi-arch dams, v-shaped dams, winged dams, etc (Nissen-Petersen, 2006)
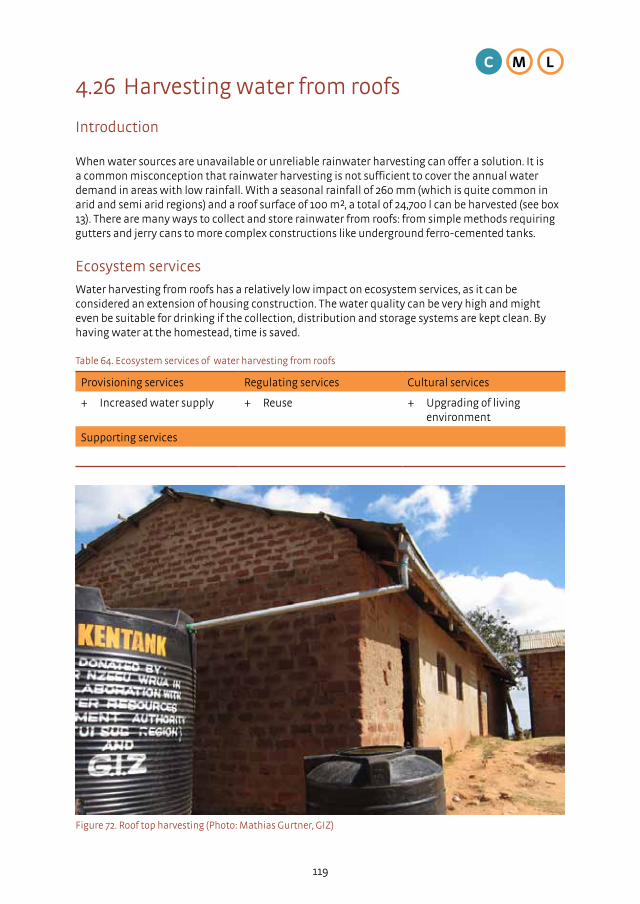
119
4.26 Harvesting water from roofs
Introduction
When water sources are unavailable or unreliable rainwater harvesting can offer a solution. It is a common misconception that rainwater harvesting is not sufficient to cover the annual water demand in areas with low rainfall. With a seasonal rainfall of 260 mm (which is quite common in arid and semi arid regions) and a roof surface of 100 m², a total of 24,700 l can be harvested (see box 13). There are many ways to collect and store rainwater from roofs: from simple methods requiring gutters and jerry cans to more complex constructions like underground ferro-cemented tanks.
Ecosystem services
Water harvesting from roofs has a relatively low impact on ecosystem services, as it can be considered an extension of housing construction. The water quality can be very high and might even be suitable for drinking if the collection, distribution and storage systems are kept clean. By having water at the homestead, time is saved.
Figure 72. Roof top harvesting (Photo: Mathias Gurtner, GIZ)
Provisioning services Regulating services Cultural services
+ Increased water supply + Reuse + Upgrading of living environment
Supporting services
Table 64. Ecosystem services of water harvesting from roofs
C LM
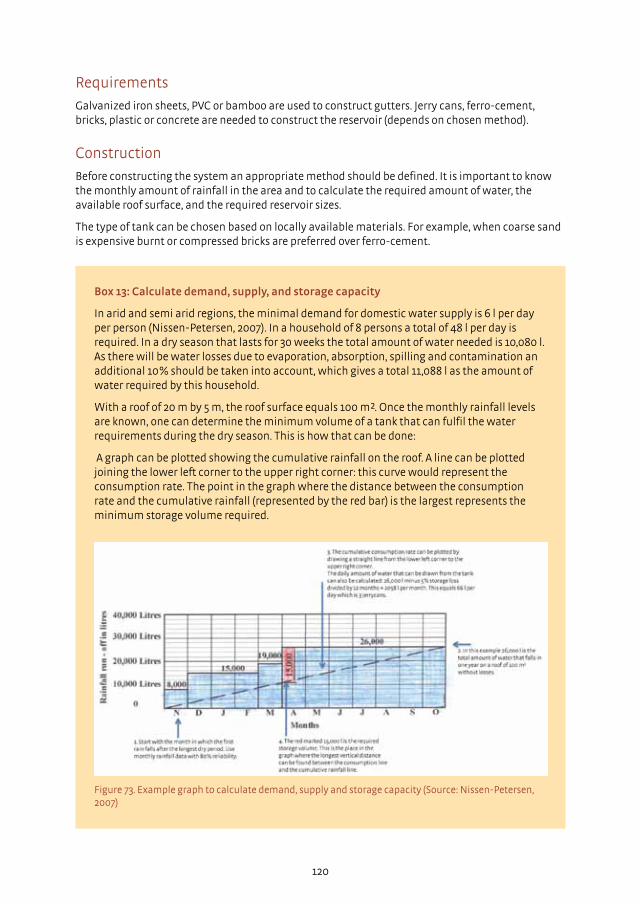
Requirements
Galvanized iron sheets, PVC or bamboo are used to construct gutters. Jerry cans, ferro-cement, bricks, plastic or concrete are needed to construct the reservoir (depends on chosen method).
Construction
Before constructing the system an appropriate method should be defined. It is important to know the monthly amount of rainfall in the area and to calculate the required amount of water, the available roof surface, and the required reservoir sizes.
The type of tank can be chosen based on locally available materials. For example, when coarse sand is expensive burnt or compressed bricks are preferred over ferro-cement.
Box 13: Calculate demand, supply, and storage capacity
In arid and semi arid regions, the minimal demand for domestic water supply is 6 l per day per person (Nissen-Petersen, 2007). In a household of 8 persons a total of 48 l per day is required. In a dry season that lasts for 30 weeks the total amount of water needed is 10,080 l. As there will be water losses due to evaporation, absorption, spilling and contamination an additional 10% should be taken into account, which gives a total 11,088 l as the amount of water required by this household.
With a roof of 20 m by 5 m, the roof surface equals 100 m². Once the monthly rainfall levels are known, one can determine the minimum volume of a tank that can fulfil the water requirements during the dry season. This is how that can be done:
A graph can be plotted showing the cumulative rainfall on the roof. A line can be plotted joining the lower left corner to the upper right corner: this curve would represent the consumption rate. The point in the graph where the distance between the consumption rate and the cumulative rainfall (represented by the red bar) is the largest represents the minimum storage volume required.
Figure 73. Example graph to calculate demand, supply and storage capacity (Source: Nissen-Petersen, 2007)
120

The following parts should be included in the construction of a rooftop water harvesting system: • All methods need gutters to transport the water from the roof to the tank. The importance of
gutters is often underestimated. Gutters can be constructed from different materials (PVC, galvanized iron, bamboo) – it is important that they have a gradient of 1:100 (Nissen-Petersen, 2007). Most commonly used are semi-circular gutters (with a splash guard if necessary).
• Foundation of the water tank; • Draw-off pipes to extract water; • Walls for the water tank (concrete, bricks or ferro-cement); • Roofs on the water tanks to prevent evaporation.
Cost and benefits
An example from Senegal shows that with a USD 600 investment and a water tank with an average lifespan of 15 to 20 years, the annual costs of the structure would be around USD 40.
At relatively low costs, (see table 65) people can have access to safe water. The water can be managed at the household level and the heavy burden of fetching water daily can be eased considerably. Depending on the roof surface area and the number of family members, the volume of roof harvested water can be sufficient to cover requirements during the dry period.
121
Constraints
Obviously, this method is rain dependent. During dry periods the tanks will be emptied, but there will be no refilling. It is important to know how much water is available in the tank and how much can be drawn from it on a daily basis. Moreover, monthly rainfall data is required for calculations which is not available everywhere.
Variations
• Plastic water tanks • Oil drums as water tanks
Type of tank Costs (USD)
Concrete in situ tank of 5 m³ 650
Burnt brick tank of 10 m³ 1065
Soil compressed blocks tank of 15 m³ 1210
Rubble stone tank of 12 m³ 1045
Ferro-cement tank of 3 m³ 360
Ferro-cement tank of 11 m³ 830
Ferro-cement tank of 23 m³ 1220
Ferro-cement tank of 46 m³ 1695
Ferro-cement ground tank o90 m³ 2555
(Adapted from: Nissen-Petersen, 2007)
Table 65. Construction costs water tank

4.27 Spate irrigation
Introduction
Spate irrigation is a form of water management that has been practiced in a variety of semi-arid environments across the world. During floods, water from mountain catchments is diverted from normally dry riverbeds and spread over large areas for irrigation, improvement of grazing areas, filling drinking water ponds, groundwater recharge, or a combination of all these functions. The unpredictable seasonal floods – that could last from a few hours to a few days – are routed to adjacent land through free intakes or diversion structures. They are guided gently over the command area in order to avoid erosion of the land.
Sediment loads in spate flows can be very high – up to 10% in weight. As sediment is transported from upstream catchments it brings along nutrients that help maintain soil fertility and build up land. On the other hand, sediment loads can also block intakes and channels and cause land to rise beyond what can be commanded. Within spate irrigation systems, the management of sediment is as important as the management of floodwater. A useful important strategy is to not divert floods that are too large as these carry large amounts of sediments and are often unmanageable, running the risk of rutting and degradation of the farm land.
Spate irrigation structures vary from place to place, in terms of using materials used and methods employed. Spate irrigation systems can be broadly classified into different groups: (i) small schemes under farmer management with traditional relatively simple earthen structures; (ii) medium to large-scale schemes under farmer management that use traditional simple structures as gabions; (iii) large and technically complex systems including permanent structures that require high investment costs.
Figure 74. Constructing bunds for spate irrigation (Photo credit: MetaMeta)
C M
122
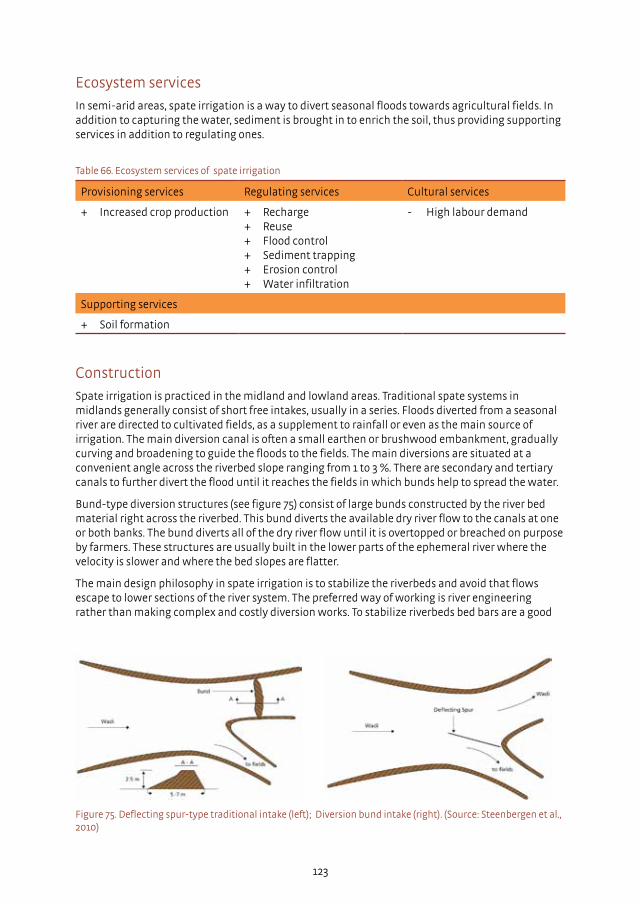
Ecosystem services
In semi-arid areas, spate irrigation is a way to divert seasonal floods towards agricultural fields. In addition to capturing the water, sediment is brought in to enrich the soil, thus providing supporting services in addition to regulating ones.
123
Figure 75. Deflecting spur-type traditional intake (left); Diversion bund intake (right). (Source: Steenbergen et al., 2010)
Provisioning services Regulating services Cultural services
+ Increased crop production + Recharge+ Reuse+ Flood control+ Sediment trapping + Erosion control+ Water infiltration
- High labour demand
Supporting services
+ Soil formation
Table 66. Ecosystem services of spate irrigation
Construction
Spate irrigation is practiced in the midland and lowland areas. Traditional spate systems in midlands generally consist of short free intakes, usually in a series. Floods diverted from a seasonal river are directed to cultivated fields, as a supplement to rainfall or even as the main source of irrigation. The main diversion canal is often a small earthen or brushwood embankment, gradually curving and broadening to guide the floods to the fields. The main diversions are situated at a convenient angle across the riverbed slope ranging from 1 to 3 %. There are secondary and tertiary canals to further divert the flood until it reaches the fields in which bunds help to spread the water.
Bund-type diversion structures (see figure 75) consist of large bunds constructed by the river bed material right across the riverbed. This bund diverts the available dry river flow to the canals at one or both banks. The bund diverts all of the dry river flow until it is overtopped or breached on purpose by farmers. These structures are usually built in the lower parts of the ephemeral river where the velocity is slower and where the bed slopes are flatter.
The main design philosophy in spate irrigation is to stabilize the riverbeds and avoid that flows escape to lower sections of the river system. The preferred way of working is river engineering rather than making complex and costly diversion works. To stabilize riverbeds bed bars are a good

option. These maintain the riverbed level and make sure the riverbed is not gullied and difficult to control. Another important techniques is to close of flows to lower parts of the river systems so as to maintain command. On top of these stabilized structures farmers can relatively easily build free intakes or diversion bunds. These farmer-built structures have an in-built safety device as they breach during high floods, making sure these potentially destructive high floods do not affect the command area.
Costs and benefits
The costs of spate irrigation projects vary from place to place. In remote areas, local labour costs might be low and locally available material can be used. However, machinery costs can make projects expensive. In less remote areas, the presence of bulldozer or heavy tractors makes the construction of diversion systems easier. Around the design philosophy described above – stabilized riverbeds and farmer built structures – relatively low cost options often work better. The scale of the project also plays an important role in determining the costs. An overview is given in table 67.
In Dodota, Ethiopia, yield increases for the irrigated area were substantial. Wheat yield increased from 4 to 13 ton per ha, barley from 7 to 26 ton per ha, teff from 3 to 6 ton per ha, haricot beans from 6 to 15 ton per ha and maize from 8 to 32 ton per ha (Spate irrigation network, 2010).
In Eritrea, it is expected that the increased soil moisture conservation in spate irrigation areas will lead to about 30-40% increase in yields (Spate irrigation network, 2010).
124
Technique Country Costs
Construction of non permanent headworks, soil bunds and gabion structures
Ethiopia 170 - 220 USD per hectare
Construction of permanent headworks, soil bunds, gabion structures and diversion canals for small systems
Ethiopia Up to 450 Usd per hectare
Construction of permanent headwork for large systems, including diversion weirs, breaching bunds and siphons
Ethiopia 330 to 450 USD per hectare
Construction of relatively small systems Eritrea 500 to 1,500 USD per hectare
(Source: Spate Irrigation Network, 2010)
Table 67. Construction costs spate structures

125
4.28 Flood water spreading1
Introduction
Whereas in spate irrigation water is strategically diverted to targeted areas, flood water spreading involves distributing water and sediments over a large area. In Iran, for instance, flood water spreading is common in the desert areas, for sustaining rangelands and eucalyptus plantations. A series of techniques is applied in particular combinations of conveyance spreading canals and level-silled channels (LSCs). The simplest version of a floodwater spreading system is a single, level-silled channel that receives floodwater from one or more sources and allows the water and sediment to spread gently over the debris cone and alluvial fan. The LSCs are actually long stilling basins, closed at both ends, with the down slope edge exactly on the contour. The channel converts small, concentrated flows into sheet flows. The control section of the LSC is a level sill adjacent to its down slope edge, which allows the silt-laden water to spread gently before the sediment settles down. They are not intended to impound – only to briefly capture and spread both water and sediment. More complex water spreading systems in Iran include diversion weirs and guide bunds.
In Niger, Burkina Faso, and Chad, flood water spreading is practiced in a different fashion. Water-spreading weirs are developed for the large-scale rehabilitation of wide and shallow dry valleys that have been seriously degraded and in which severe gully erosion prevents the regular flooding that would normally happen there. The annual, recurrent small and medium-size floods that normally cause temporary inundation of the valleys and deposition of fertile sediments no longer occur but instead disappear in the ruts and gullies, that become even deeper as they channel the entire flood flows. Due to the rapid runoff, there is also less infiltration in the valley and the groundwater tables drop. This, in turn, harms the natural vegetation and limits agricultural use. Fertile valleys are transformed into desert-like landscapes.
1 This section draws very heavily on GIZ/ KfW (2012), Water-spreading weirs for the development of degraded dry river valleys. Experience from the Sahel
Figure 76. Water spreading weir (photo: GIZ)
C M

Ecosystem services
Compared to spate irrigation (see 4.27), with flood water spreading the natural flood plain is supplied with water, after slowing down the flow and distributing it laterally with water-spreading weirs.
Figure 77. Flood area at risk of erosion (Source: Denny et al., 2006))
126
Provisioning services Regulating services Cultural services
+ Increased crop production and grazing
+ Recharge+ Reuse+ Flood control+ Sediment trapping+ Erosion control
+ Enhancing functions of the floodplain
Supporting services
+ Soil formation+ May create water-logged soil
Table 68. Ecosystem services of flood water spreading
Construction
Water-spreading weirs span the entire width of the valley. They are low retention walls designed to reduce runoff and erosion. They consist of a spillway in the actual riverbed and lateral abutments and wings. As the floodwaters rise, the various structural elements overflow one after another. (i) At first, when there is little runoff, all of the water is conducted over the spillway and remains in the riverbed. Then, (ii) with increasing runoff first the lower, outer wing walls overflow, and (iii) finally the higher wing walls overflow as runoff increases even further. Floodwaters are spread over the adjacent land area above the structure, where they eventually overflow the lateral wings and then slowly flow back towards the riverbed below the structure.
As a result, the land area below the water- spreading weir is flooded. The lateral spreading of the water causes the land area above and below the structure to be inundated and supplies it with sediment. Water infiltrates, gullies in the valley are filled and the riverbed is raised. Thanks to the infiltration, the groundwater table also rises in a few years. Water spreading weirs do not create reservoirs for later use but store water in the soil profile and shallow aquifers – apart from restoring eroded valley bottoms.
127
In constructing water spreading weirs, the first step is to identify suitable valleys in a region and engage intensely with the villages, communities and technical services available there, about the possibilities and prerequisites of rehabilitation. It is important to agree on certain preferences such as the duration and depth for which water will be ponded up and the distance between the structures, depending on the intended land use: whether it is to cultivate rice, coarse cereals or to use it for pastoralist purposes.
Cost and benefits
Water spreading weirs have brought considerable benefits into agriculture, forage production and ecology. For example, 4,731 farms in a valley system in Niger (which were direct beneficiaries of such rehabilitation measures) each had 0.6 ha of arable valley land prior to the rehabilitation. Thanks to the water-retaining weirs, this increased to 2.2 ha. Millet and sorghum yields increased on average by 85–90% and 25–30%, respectively.
The more frequent flooding of the soils results in increased infiltration, and the groundwater level rises substantially in most of the valleys. In 15 rehabilitated valleys in Niger, for example, the average depth of the water table level from the surface was 12.5 metres prior to the rehabilitation. A few years after the stabilisation measures, the average depth of the water table in the valleys was 3.5 metres below the surface.
In most of the valleys, prior to the rehabilitation it was only possible to grow a rainfed crop and perhaps an irrigated crop on some small areas of land. After the rehabilitation, in addition to the rainfed crop grown on larger areas of land, it became possible to grow a post-rainy season crop (culture de décrue) and, once the water table had risen, an irrigated crop (culture de contre saison) as well.
Prior to the rehabilitation, it was not possible to grow a crop during the dry season in 8 out of 15 valleys in Burkina Faso, whereas in others it was only possible to grow an irrigated crop to a limited extent on small fields in direct proximity to the river.
Thanks to the rising water tables, the natural vegetation of the valleys and the availability of fodder for livestock improved. Water for drinking and for watering livestock is more readily available, which eases the workload on women considerably.
As maintenance, it is important to clean the sediments deposited on the riverbed regularly.
Variations
The weir can double up as a low cause way for local traffic. The spreading weirs can be built in a series Since the water flows back to the lower riverbed after it overflows the wings, the soil in the zone of return flow below the weir is especially susceptible to erosion. To prevent this, water-spreading weirs are preferably constructed in series, thus reducing the flow gradient. The areas between the weirs are also stabilized.

4.29 Flood recession farming
Introduction
Flood recession agriculture is practiced in the area around Witu in the Tana Delta. A system is in place whereby rice is watered through receding floods. Before the floods arrive, plots are prepared with hand tools. Rice seedlings are cultivated on other plots near homesteads. When floods recede, the seedlings are planted along the receding line. In this case, no additional irrigation is needed as the ocean pushes the river up twice a month – forcing water into the fields and channels planned strategically to receive it. As salt water intrudes the system, the cultivation shifts to fields further away. On higher areas, dikes are used to prevent salt water from entering the fields.
Ecosystem services
Compared to the previous sections on spate irrigation (4.27) and flood water spreading (4.26), flood recession (or retention) farming is practiced largely around lakes with varying water tables, in addition to river flood plains. The water flow is less violent and leaves behind a well-moisturized soil, sometimes several times a year. Depending on the coverage of the network of canals, drains and dikes, this type of farming could be highly labour-intensive. When combined with fish ponds, it can bring high quality nutrition to the households.
Figure 78. Flood recession area around Witu, Kenya (Photo: MetaMeta)
128
Provisioning services Regulating services Cultural services
+ Increased crop production and grazing+ Fish production
+ Recharge+ Reuse+ Sediment trapping+ Water flow regulation
Supporting services
+ Soil formation
Table 69. Ecosystem services of flood recession farming
C L

129
Improvements
Flood recession culture is not unique to the Tana Delta. It is practiced with varying degrees of sophistication in various parts of the world. Drawing from global experiences, there are several ways to improve the productivity of this farming system.
Better water control
The productivity of flood recession farming is largely a function of the degree to which the receding and rising water can be controlled. This can be done by using dikes and bunds to guide, spread, and retain the water in certain areas while protecting other areas from unwanted intrusion and overflows. In addition, small inundation canals – fed at certain high water levels – and drains to evacuate excess water greatly enhance the productivity of these systems. Small gates or earthen bunds in drains and canals may add to their flexibility .
Use shallow groundwater by tubewells
Most flood plains have ample shallow groundwater resources. As they are continuously recharged from either the floods and the river flow, they constitute a highly dependable resource that is relatively easy to exploit. It requires the use of shallow tubewells – that can be sealed during the flood season – rather than dugwells that will inevitably damaged when inundated and will take a long time to rebuilt. There are several low cost techniques that can be used to develop such shallow tubewells manually (see table 70).
Diversification to fishery
Flood based farming system provide the basis for diversified livelihood systems. They support not only farming, but also fishery and livestock. Also the wetlands in and around flood based systems often offer opportunities for non-timber, medicinals and other products.
Flood based farming systems support finger ponds (figure 79) that can be used to set up fisheries. Finger ponds are excavated at the fringe of the inundation areas. They fill with water and fish stock
Figure 79. A diagrammatic sequence in the construction of fingerponds. (a) The land/swamp interface at the height of the dry season when water tables are at their lowest. (b) The digging of the ponds and preparation of the agricultural area when water levels are still low. (c) The fingerpond system becomes flooded during the next rains and fish migrate into the floodplain. (d) On retreat of the floodwaters the fish get trapped in the ponds and are cultured whilst the land in between is cultivated. (Source: Denny et al., 2006).

Table 70. Low cost techniques that can be used to develop such shallow tubewells manually
Technique Description Advantages/disadvantages
Hand auger Consist of extendable steel rods, rotated by a handle. A number of different steel augers (drill bits) can be attached at the end of the drill rods. The augers are rotated into the ground until they are filled, then lifted out of the borehole to be emptied. Specialized augers can be used for different formations (soil types). Above the water table, the borehole generally stays open without the need for support. Below the water table a temporary casing may be used to prevent the borehole from collapsing. Drilling continues inside the temporary casing using a bailer until the desired depth is reached. The permanent well casing is then installed and the temporary casing must be removed. Augers can be used up to a depth of about 15-25 meters, depending on the geology
Advantage: easy to use above groundwater table; cheap equipment.
Disadvantage: it may be difficult to remove the temporary casing.
Geological application: Sand, silt & soft clay.
Sludging Uses water circulation to bring the drilled soil up to the surface. The drill pipes are moved up and down. On the down stroke, the impact of the drill bit loosens the soil and on the up stroke, the top of the pipe is closed by hand (or valve), drawing up the water through the pipe and transporting the cuttings to the surface. On the next down stroke, the hand (valve) opens the top of the pipe and the water squirts into a pit, in front of the well. In this pit, the cuttings separate from the water and settle out, while the water overflows from the pit back into the well. The borehole stays open due to water pressure. Thickeners (additives) can be added to the water to prevent the hole from collapsing and to reduce the loss of working water (drill fluid). Water mixed with cow dung is a often used for this purpose. Sludging can be used up to depths of about 35 meters
Advantage: easy to use and temporary casing is not needed.
Disadvantage: working water has to be maintained during the drilling process. The level of the water table is not known during drilling.
Geological application: Sand, silt, clay, stiff clay and softer- consolidated rock formations (weathered laterite)
Jetting Is based on water circulation and water pressure. As opposed to sludging, water is pumped down the drilling pipes. The large volume of water has an erosive effect at the bottom and the ‘slurry’ (water and cuttings) are transported up between the drill pipe and the borehole wall. A motor pump is used to achieve an adequate water flow. The drill pipe may simply have an open end, or a drill bit can be added and partial or full rotation of the drill pipe can be used.
Thickeners (additives) can be added to the water in order to prevent the hole from collapsing and to reduce the loss of working water (drill fluid). Jetting (with rotation) is generally used up to depths of 35- 45 meters
Advantage: very quick in sand.
Disadvantage: a lot of working is needed at once. The level of the water table is not known during drilling.
Geological application: limited to sand and thin layers of soft clay
130

during high water. Their nutrient levels can be further enriched by using kitchen waste and for instance cow and chicken manure. An advantage of fingerpond systems is that they preserve the functioning of wetlands; neither do they affect their hydrology nor impede natural flooding régimes.
Three key characteristics of fingerponds are: (i) their water levels are unregulated, (ii) no artificial fish-feeds are used (too expensive for poor people), and (iii) the ponds are stocked with fish naturally from the surrounding wetlands and rivers (Denny et al, 2006). Fingerponds make use of the high natural productivity of the swamp/lake/ river inter-face zone and they trap fish in depressions as floodwaters retreat over floodplains. They must be located where seasonal flooding is relatively reliable, self-stocking can occur, and the land and the soil are suitable - excessive turbidity of pond-waters hinders algal development.
131

4.30 Controlling sand and gravel mining
Introduction
Sand and gravel are precious finite resources that are regarded as fundamental by building industries. Sand is a necessary component of concrete production and it yields good prices on the market. As a consequence illegal sand and gravel mining is a wide spread activity and the high request of this commodity make its regulation an arduous task. The material is often obtained from riverine deposits that are often exploited until the bedrock or the impermeable clay deposits under the river are reached. The depletion of river sand causes the failure of the river system to be resilient to floods and droughts. The sandy river deposits play a crucial role in storing excess water and making it an asset for the ecosystem and the local communities. In fact sand is a good storage of water that in riverine beds feeds the surrounding wells and behave as a buffer sponge during drier seasons (van Steenbergen & Tuinhof, 2010). “Hungry waters” is a term that refers to watercourses that had their sediments deposits depleted and that becomes prone to erosion of beds and banks, causing major channel incisions and damages (Kondolf, 1997). Sand mining is an important activity in the seasonal tributaries of Tana and Athi rivers, especially in Kitui, Machakos, and Kajiado districts (Terer & Ndiritu, 2004).
Every watershed can be hypothetically divided into segments according to the sediment processes that are taking place. In the upper slopes, the majority of the sediments are produced and only the coarser fractions are deposited in the riverbed. A balance between production and deposition without net gain or loss characterizes the middle slopes. The lowlands have a positive net sediment
132
Figure 80. Sand mining (photo: MetaMeta)
D LM

133
yield. This trend is distorted where a river course and its sediment flow is fragmented by the presence of dams. Conventionally, high quality aggregates materials are either obtained through in-stream gravel mining or floodplain pit mining. In-stream grave mining implies the extraction of coarse materials by digging trenches and pits directly from the riverbed. This practice is likely to produce a form of in-stream erosion and deterioration of the main channel. The dug trench will attract sediments and generate sediment-free hungry water that is likely to erode the riverbed and the banks. Additionally, the alluvial aquifer has its capacity decreased. Pit mining in the flood plains takes place in the alluvial deposits in proximity to the river course. They are hydrologically connected to the main river body and only a thin strip of un-mined land divides them. Pit capture - the creation of a continuum between the pit and the river - occurs when lateral erosion breaches this thin strip of land. When it happens the pit becomes “in-channel pit” and is likely to create riverbed and bank erosion (Kondolf, 1997). In general as the riverbed is lowered, irrigation inlets might not reach the water level, bridges foundation might be undermined. The consequent decreased base-flow causes the depletion of aquifers and the possible intrusion of salty water in areas close to the ocean (van Steenbergen & Tuinhof, 2010).
Ecosystem services
Sand and gravel mining can enhance provisioning and regulation services, but only if it is well regulated, so that it takes place at the right place, for the right type of sediment, at the right time of year. Course sand mining behind dams and in reservoirs will enhance their capacity. On the contrary, extensive mining in stream beds may have very negative impacts on the water flow and increase erosion of the banks.
Provisioning services Regulating services Cultural services
+ Sustainable availability of sand and gravel for construction
+ Recharge+ Erosion control+ Sediment trapping+ Water flow regulation
+ Maintaining the landscape
Supporting services
Table 71. Ecosystem services of sand and gravel mining
Costs and benefits
Alluvial deposits produce the best quality aggregates and are extracted at a cheap monetary cost without needing thoroughly washing and sorting. The consequences of mining are overlooked and externalized. Other sectors are paying the consequences. The incorporation of the externalities in the final product prices would boost the use of alternative sources. Is thus important to establish a sediment budget to acknowledge the importance of the bed-load and to be able to quantify resources and damages (Kondolf, 1997).
The amount of money involved in sand and gravel training is substantial and has the potential to sustain better water buffer management. There are different typologies of sands with different uses and market values. The table below illustrates different sands prices on the international market (van Steenbergen & Tuinhof, 2010).

Countermeasures and alternatives
• Sand and gravel mining should be regulated by issuing licenses. • For small scale composites material harvesting local committees can help in restricting the
allowed mining area. It is important to define the erosion, transport and sedimentation areas. • Sand dams might be a renewable source of materials if just a thin layer of sand is scratched
from the surface yearly. Otherwise, if pits are dug they will attract finer sediments leading to the siltation of the structure.
• Sand pits can be used as recharge basin and used for a positive recharge of the local aquifer. (Van Steenbergen & Tuinhof, 2010)
• Sand mining should be particularly forbidden below dams, because the water spilled by the reservoir is sediment free and will not create a new sediment deposit (Kondolf, 1997).
The composite materials market should be regulated stimulating the use of alluvial gravel and sand only when a high quality construction material is needed. Furthermore alternative sources can be identified. Quarry ballast and residues - once sorted and washed - can be used in the construction business. Another source that has huge potential, but it is often overseen is artificial reservoir mining. In fact, dams naturally create alluvial deposits that in some cases can be exploited. When possible the water level can be lowered and the coarser sediments removed (Kondolf, 1997). In some experimental studies also the finer particles have been used as rich agricultural soil or as fertilizer. It is important to perform thorough analyses to validate quality, quantity and modality of sediments use and extraction (Fonseca & Barriga, 2003). Other possible alternatives are: dry terrace mining, dredger tailings, and reservoir deltas (Kondolf, 1997).
134
Figure 81. Guidelines on Sand Harvesting developed by NEMA, Kenya
Mineral sand Mineral content (%)
Industrial use Global production (metric tons)
Price (€/ton)
Silica 95 Glass production 126,000,000 22
Zircon 1 - 50 Abrasives and insulations
1,240,000 635
Ilmenite 10 - 60 Titanium production
4,800,000 58
Rutile 5 - 25 Titanium production
360,000 385
(Source: van Steenbergen & Tuinhof, 2010)
Table 72. Different sand prices on the international market
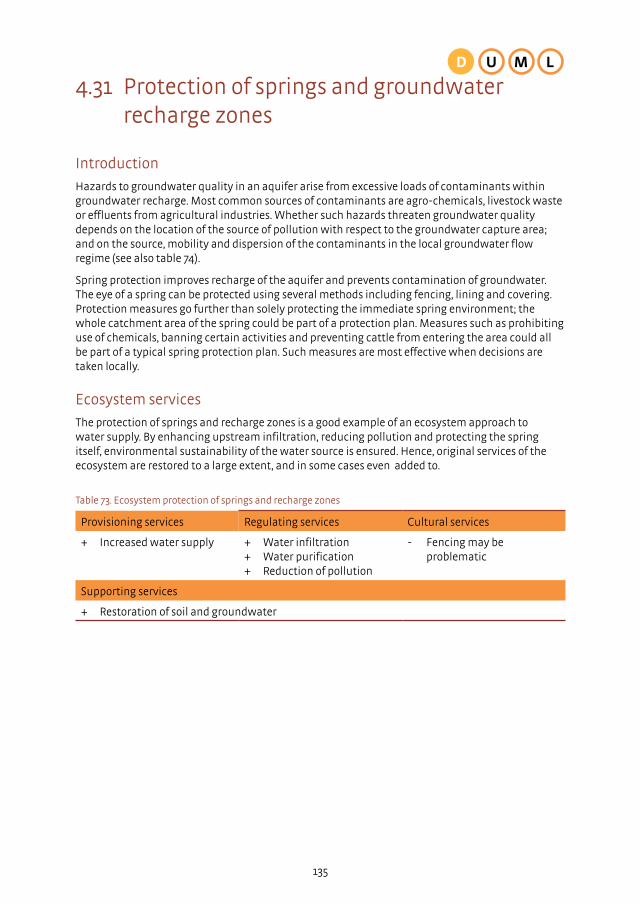
135
4.31 Protection of springs and groundwater recharge zones
Introduction
Hazards to groundwater quality in an aquifer arise from excessive loads of contaminants within groundwater recharge. Most common sources of contaminants are agro-chemicals, livestock waste or effluents from agricultural industries. Whether such hazards threaten groundwater quality depends on the location of the source of pollution with respect to the groundwater capture area; and on the source, mobility and dispersion of the contaminants in the local groundwater flow regime (see also table 74).
Spring protection improves recharge of the aquifer and prevents contamination of groundwater. The eye of a spring can be protected using several methods including fencing, lining and covering. Protection measures go further than solely protecting the immediate spring environment; the whole catchment area of the spring could be part of a protection plan. Measures such as prohibiting use of chemicals, banning certain activities and preventing cattle from entering the area could all be part of a typical spring protection plan. Such measures are most effective when decisions are taken locally.
Ecosystem services
The protection of springs and recharge zones is a good example of an ecosystem approach to water supply. By enhancing upstream infiltration, reducing pollution and protecting the spring itself, environmental sustainability of the water source is ensured. Hence, original services of the ecosystem are restored to a large extent, and in some cases even added to.
Provisioning services Regulating services Cultural services
+ Increased water supply + Water infiltration+ Water purification+ Reduction of pollution
- Fencing may be problematic
Supporting services
+ Restoration of soil and groundwater
Table 73. Ecosystem protection of springs and recharge zones
U LMD

Design
One can either aim at protecting the aquifer as a whole or only the area around a specific source (boreholes, wells, and springs). A sensible balance needs to be struck between the two options. Whether emphasis is placed on one or the other will depend on the resource development situation and on prevailing hydrogeological conditions.
Source Oriented-Strategy
The Source-Oriented Strategy can be applied where potable use comprises only a minor part of total groundwater resource availability. The approach is best suited to more uniform, unconsolidated, aquifers exploited only by a small fixed number of high-yielding municipal water-supply boreholes with stable pumping regimes, especially in areas where populations are not densely. Source protection involves (i)the delineation of the groundwater capture areas around a water-supply source, and (ii) an assessment of aquifer pollution vulnerability and subsurface contaminant load only in the delineated capture areas.
136
Figure 82. Spring protection (photo: MetaMeta)
Table 74. Various potential causes of quality degradation in groundwater aquifer
Pollution source Type of contaminant
Agricultural Activity Nitrates, ammonium, pesticides, fecal organisms
In-situ Sanitation Nitrates, halogenated hydrocarbons, microorganisms
Petrol Filling Stations & Garages Aromatic hydrocarbon, benzene, phenols, halogenated hydrocarbons
Solid Waste Disposal Ammonium, salinity, halogenated hydrocarbons, heavy metals
Metal Industries Trichloroethylene, tetrachloroethylene, halogenated hydrocarbons, phenols, heavy metals, cyanide
Painting & Enamel Works Alkyl benzene, halogenated hydrocarbons, metals, aromatic hydrocarbons, tetrachloroethylene
Timber Industry Pentachlorophenol, aromatic hydrocarbons, halogenated hydrocarbons
Dry Cleaning Trichloroethylene, tetrachloroethylene
Pesticide Manufacture Halogenated hydrocarbons, phenols, arsenic
Sewage Sludge Disposal Nitrates, halogenated hydrocarbons, lead, zinc
Leather Tanneries Chromium, halogenated hydrocarbons, phenols
Oil &Gas Exploration/Extraction Salinity (sodium chloride), aromatic hydrocarbons
Metalliferous & Coal Mining Acidity, various heavy metals, iron, sulphates
(Source: GW mate, 2010)

137
Within the immediate environment of the spring, several checks should be carried out: • No latrines should be present 30 m upstream; • The area around the spring tank should be fenced; • The spring tank should not be built on swampy soils, or on soil that are susceptible to erosion or
floods. • The area within a 50 m radius around the spring should be fenced with barbed wire. No human
activities should be allowed within (IRC, 2002).
Aquifer-Oriented Strategy
An Aquifer-Oriented Strategy is appropriate when the entire groundwater resource is protected. It starts with aquifer pollution vulnerability mapping over extensive areas, followed by an inventory of subsurface contaminant load at more local scale (at least in the more vulnerable areas). The delineation of groundwater source capture areas (recharge zones) is abandoned in situations of large numbers of individual abstractions rendering the establishment of fixed source protection zones impractical.
Source Protection Areas (SPAs)
Source protection areas (SPAs) provide special vigilance against pollution for water sources destined for public (mains) water supply. Consideration must also be given to sources developed for other potentially sensitive uses, such as bottled natural mineral waters not receiving any form of disinfection.
In SPAs (see figure 83) activities are restricted that can affect groundwater quality negatively. They do protect against both contaminants that decay with time (where subsurface residence time is
the best measure of protection – the longer the contaminant stays the less the contamination will be) and non-degradable contaminants (where dilution dependent on the groundwater flow paths will reduce the risk). Both are necessary for comprehensive groundwater source protection. Within the aquifer, contaminant dilution associated with groundwater flow is usually the most important reduction process, but degradation (breakdown) is also likely to occur for some contaminants (and various other processes such as adsorption and precipitation for others).
In order to fully eliminate the risk of unacceptable pollution of a groundwater supply source, ideally all potentially polluting activities would have to be prohibited (or fully controlled) within its entire recharge capture area. This will often not be feasible. Thus, some division of the recharge capture zone is required, so that the more stringent restrictions are only applied close to the source. The subdivision of the SPA is generally based on a combination of (horizontal) flow time and flow distance criteria and an understanding of how the aquifer works.
The Total Source Capture Area: this is the area within which all aquifer recharge (whether derived from precipitation or surface watercourses) will be captured in the groundwater supply under
Figure 83. Source protection areas (Source GW mate, 2010)

consideration. The total capture zone is determined in an area by water balance considerations and by groundwater flow paths. Knowing the recharge zone is important for quality protection but also in resource management terms as this is the area from where the source is fed – and activities that negatively affect recharge (paving, planting of water demanding crops, construction of barriers to the recharge areas) should be discouraged. It should be noted that (a) in extended drought, the actual capture area will be larger and (b) in areas where the aquifer is confined beneath impermeable strata, the capture area will be located at a distance from the actual site of groundwater abstraction.
The Microbiological Protection Area: this is an inner protection area based on the distance equivalent to a specified average horizontal flow time (usually 50 days) in the saturated aquifer. This distance has been widely adopted to protect against activities potentially discharging pathogenic viruses, bacteria, and parasites. This protection perimeter is perhaps the most important of all in terms of public health, and since it is usually small in size, implementation and enforcement are more readily achieved. Experience has shown that in fissure-flow aquifers (which are often very heterogeneous in hydraulic properties), it may be prudent to establish a limiting criterion of 50m radius.
The Wellhead Operational & Sanitary Inspection Areas : this is a small area of land around the supply source itself, which is preferably under ownership and control of the water supply providers. In this zone no activities should be permitted that are not related to water abstraction itself, and even these activities need to be carefully assessed to make sure no pollutants reach the source. All parts of the zone used for waterwell maintenance for instance should have a concrete floor to prevent infiltration of oils and chemicals used in pumps and fencing is also standard practice to prevent invasion by animals and vandalism. Whilst the wellhead operational area is usually no more than 20 m radius, detailed inspections of sanitary integrity should be conducted over a larger area of 200 m radius.
The exact delineation of SPAs can be undertaken using a wide variety of methods, ranging from over-simplistic to extremely e labourate. Arbitrary circular zones and simple elliptical shapes have been used in some areas, but due to the lack of a sound scientific foundation are not ideal. In reality there are two principal methodological options: (a) scientifically-based, simple analytical formula and (b) more systematic aquifer numerical modelling.
The circular or elliptical shape of a SPA will need to be modified if:
• There is a major influent (losing) surface water course, that feeds the aquifer, so possible contaminants are carried by the water from a much larger area.
• The aquifer is ‘confined’ – meaning that the top layer is not permeable and so the recharge is not locally but from an area at some distance (see figure 83b).
• There is a spring: because of the velocity of flow from a spring the recharge zone is usually in one direction only (see figure 83c).
Constraints
• In order to carry out successful spring protection plans it is important to involve communities. When individual owned land should be given up for communal interest conflicts might rise.
• The need to have access to safe water and the idea of conserving the environment around the spring should be supported by the community. Community mobilization through participatory rural appraisal could enhance ownership, future cooperation and maintenance.
• The implementation of several protection measures can take a large amount of time when changes in land management practices need to be carried out.
138

139
4.32 Protection of footpaths
Introduction
In fragile hilly landscapes, footpaths – taken by humans and cattle - are one of the main triggers of land degradation. Foothpaths may cause uncontrolled erosion and the resulting gullies may deplete the soil moisture all around.
The rate of degradation depends on the habitat. Vulnerability of habitats to trampling can be determined by how much passes by individual walkers plant cover can withstand before it is reduced from 100 to 50 per cent (Morgan, 2010). Sand dune pasture for instance is able to withstand between 1100 and 1800 passes while alpine plant communities can handle 60 passes only.
Ecosystem services
The very aim of protecting footpaths is to prevent erosion and maintain access to remote areas. Various techniques are available, some of which deliver additional produce such as fodder or fuel.
Provisioning services Regulating services Cultural services
+ Production of fodder, fibre or other products
+ Recharge+ Erosion control
+ Maintaining access to remote areas- Collective action may be hard to mobilize
Supporting services
Table 75. Ecosystem services of protection of footpaths
Figure 84 a,b. Footpaths become gullies (left). Footpath side plantings with Euphorbia tirucalli G. Oda (right)(photos: Lakew Desta)
U MD

Design
Depending on the situation, a variety of measures can be taken:
• revegetation with erosion-resistant plants; • partly exclusion of people and cattle; • drainage of excess water; • artificial strengthening or reinforcement of foothpaths (e.g. with stones).
Figure 84 shows a footpath strengthened with plants (Euphorbia tirucalli G. Oda) on both sides. Other examples include planting prickly pears or constructing stone check dams in footpath gullies. When check dams are constructed it is important to stabilize the gully head to prevent further erosion. Usually, building suitable check dams in front of them can do this. Check dams will accumulate soil as an additional benefit. Another, more simple, method includes covering the path with wood chips.
Constraints
As footpaths are often collectively owned it is sometimes difficult to restore and manage the maintenance. In general it is better to prevent footpath erosion than to take measures afterwards.
140

141
Figure 85. Vegetation along riverbank (Photo credit: MetaMeta)
4.33 River bank plantation
Introduction
Vegetation along riverbanks serves several functions. Along perennial rivers in the uplands riverbank plantation protects embankments and reduces riverbank erosion and the sedimentation that results from it. Tree stands along the river also filter out runoff and intercept sediment before it reaches the river stream. They are also economic assets in themselves: they can provide timber (transmission poles), fuel, and a range of non-timber products. Along non-perennial rivers vegetation is immensely important for the same reasons but here it also stabilize riverbeds and reduces the risk of the river taking a different course.
Ecosystem services
Many studies have shown the beneficial effect of maintaining or increasing riverine vegetation. Trees and bushes help stabilize the banks and thus keep the river to its course. The vegetation itself may yield useful products and may serve as habitat to useful insects and corridors for wildlife. If malaria mosquitoes breed in margins and pools in the riverbed, vegetation may provide the shade that makes these habitats less suitable to these Anopheles mosquitoes.
U LMD
Provisioning services Regulating services Cultural services
+ Production of fruit, timber, fuel or other products
+ Recharge+ Erosion control+ Biodiversity+ Pest regulation
+ Maintaining river functions
Supporting services
+ Stabilization and regeneration of river bed
Table 76. Ecosystem services of river bank plantation
Construction
Riverbanks provide an ideal habitat for trees to grow. In several areas stands are natural and should be protected through local bans on tree cutting or charcoal production – limiting at least the exploitation of such vital tree stands for commercial use. Access by livestock may be regulated too as this may affect the regeneration of trees.
In other areas tree stands may be promoted by planting seedlings in the wet soils along the riverbanks – protecting the young stands from browsing animals and others. It is important to plant the trees in such a way that high flows will not take away the saplings and chose safe locations. In some cases it may be required to reinforce them and have combined stands of trees and stone pitching. This can be even done in a spur like fashion.
Costs and benefits
Cost and benefits differ and are a variation of the type of trees grown and the intensity with which they are managed. On the one hand of the range there is the protection of natural tree stands – including gallery forests - and on the other hand there are reinforced embankments combined with tree stands adding substantially to the cost. With respect to benefits: in addition to the tree products themselves river plantations are also important as they harbor considerable animal life.
Constraints
• Mismanagement of the trees. It is important to maintain diversity in habitat. If trees overshadow other vegetation the river can undercut the root system, which eventually can lead to fallen trees and riverbank erosion.
• Invasive species. Species such as prosopis juliflora can invade riverbeds and suffocate the stream. The same is the case with the tamarix in dry area. If not well managed tamarix will pioneer in the dry sandy river beds, obstruct the flow and causing ephemeral rivers to change course.
Variations
• Combined with grass strips. River bank plantation combined with grass strips will improve water quality. In intensely grazed areas for instance they prevent bacteria from animal manure reaching the water bodies. Research in humid climate in the US has indicated that 99% of such bacteria may be intercepted.
142
4.34 Protecting wetlands
Introduction
Wetlands are areas that are permanently, seasonally or occasionally water logged with fresh, saline, brackish, or marine waters. These include both natural and man-made areas that support a characteristic biota. Globally, wetlands occupy about 6% of the earth’s surface.
Wetlands occupy about 3% to 4% of Kenya (which is approximately 14,000 km2 of land surface) a figure that goes up to 6% in the rainy seasons. The flood regime in the Tana delta, is bimodal, with a major flood in April-June, following rains over the catchments in March-May, and a minor flood in November to December (R.H Hughes et al., 1992).
Wetlands are ecosystems that can be identified by variables such as:
• Topography: Generally wetlands are located within topographic features that are lower in elevation than the surrounding landscape. These could be depressions, valleys and flat areas. Topography plays an important role in determining the size and shape of a wetland by controlling where the water goes and how long it stays there.
• Hydrophytic vegetation: Only hydrophytes (also just called wetland plants), specifically adapted to soils lacking free oxygen, can survive in wetlands.
• Hydrology: Generally, the hydrology of the wetland is such that the area is inundated permanently or seasonally. Field indicators of wetland hydrology include in addition to standing or flowing water, less obvious indicators such as water marks on trees, debris lodged in trees, thin layers of sediment on leaves and drift lines providing evidence of periodic flooding or soil saturation.
Wetlands provide a wide range of ecosystem services that contribute to livelihoods and human well-being, such as fish and fibre, water supply, maintenance of water quality, climate regulation, flood regulation, coastal protection, and recreational and tourism opportunities (MA, 2005). Wetlands are also critical for the conservation of biological diversity. In particular wetlands are vitally important for providing the regulating and supporting ecosystem services that underpin water resources management, and can thus be considered as essential components of overall water infrastructure (Emerton & Bos, 2004).
Water resources strategies can be matched and implemented along with land use strategies in order to support the maintenance of healthy, functional wetlands that provide a full range of services to people, including water supply (hbk-9). At the base of it all, a local enabling environment in the form of capacities and resources, approaches and tools, agreements and policies, must be strategically put in place and gradually strengthened. This will help bolster any viable form of river basin management wishing to integrate water and land use practices in wetlands.
River basins or river catchments and coastal and marine systems influenced by catchment discharges, are important geographical units –though not the only ones- for planning the protection, management and wise1 use of wetlands and water resources. Wetlands play critical roles in river basins and, conversely, land and water-related human activities within river basins can
1 Wise use of wetlands as defined by the Ramsar Convention: “The maintenance of their ecological character, achieved through the implementation of ecosystem approaches, within the context of sustainable development.”
143
U LMD

have very significant influences on the ecological character2 of wetlands in those basins (idem).
(Ramsar site) Management plans should be integrated into public development planning system at local, regional or national level. The integration of site management plans into spatial and economic planning at the appropriate level will ensure implementation, public participation and local ownership. Furthermore, integration will enhance the possibility of local as well as external funding (hbk-18, pp.17).
Ecosystem services
Wetlands are among the most productive ecosystems in the world, providing a wealth of provisioning and regulating services. However, wetlands are threatened by encroaching agriculture, pollution, and upstream water withdrawals, all of which increase with population pressure. Wise and sustainable management of wetlands takes the dependent livelihoods into account by balancing various functions that support ecosystem services. When successful, the wetlands can thrive again and provide the surrounding communities with many benefits.
Requirements
First, identify the management concerns, objectives or issues to be addressed and the questions to be answered.
Second, a first step would be an in depth “guided” literature review on the ecological character of the wetland of interest would be advised as the first step, including maps and available satellite images if possible.
Then, bring together those who use and know the wetland to share their knowledge and to put together a qualitative description of the site: its values and meaning for different people; the main pressures and drivers of change, including social, economic, government policy and climatic trends. Enquire these stakeholders about wetland management priorities: how they would like to see the wetland in 10 to 20 years.
This should be followed by expert consultation and field data collection to fill in the existing information gaps. A variety of methodologies as well as sampling and analysis kits are available
2 Ecological character is the combination of the ecosystem components, processes and benefits/services that characterize the wetland at a given point in time. A change in ecological character: “is the human- induced adverse alteration of any ecosystem component, process, and / or ecosystem benefit/service” (hbk- 18).
144
Provisioning services Regulating services Cultural services
+ Production of fish, aquatic plants, tree products
+ Water storage and infiltration + Water flow regulation+ Water purification+ Biodiversity+ Pest regulation
+ Aesthetical+ Enhancing livelihoods
Supporting services
+ Nutrient cycling
Table 77. Ecosystem services of protecting wetlands

145
depending on the specific data to be collected, the resources available, but most of all, on the main management concerns identified.
When protecting wetlands is the chosen management option, stakeholders must be aware that most quantitative data should be collected in situ by an appropriately trained team preferably under the guidance and coordination of an advisory board. Training must be at the base of data collection and analysis to secure precise fieldwork and efficient resources use. Besides, existing and new data collected should be strategically aimed at feeding a protection and wise use program, leading to put together what is known as a wetland Management Plan (MP).
The MP itself should be a technical document, though it may be appropriate for it to be supported by legislation and in some circumstances to be adopted as a legal document. It is part of a dynamic and continuing management process and shall be kept under review and adjusted to take into account the monitoring process, changing priorities and emerging issues (hbk-18). This flexible approach is known as “the adaptable management process” –see figure 86 “The adaptable management cycle” below. The protection of a (part of a) wetland must be considered a management response.
An MP and the management planning process, should only be as large or complex as the site requires. Thus for small uncomplicated sites, brief, concise plans will suffice (hbk-18). Notice that the main goal of the management planning process is to work as a mechanism to achieve an overall agreement between the various managers, owners, occupiers and other stakeholders to protect the site, meaning: to maintain the wetlands’ biological diversity and productivity and to permit the wise use of their resources.
Figure 86. Adaptable Management Cycle (RAMSAR hbk-18)
Design
Once available data and information have been collected and gaps and priorities identified, start with a qualitative description of the wetland site in order to describe its ecological character (including quantitative data if available). As mentioned above, local wetland dwellers and users, but also experts and NGOs, may be reliable sources of knowledge on the wetland characteristics and values. For protection (and management) purposes, the description -that would feed a map (and database)- shall include depending on management priorities and as circumstances require:

Biophysical features such as:
• Location (projection system, map coordinates, map centroid, elevation) • Geomorphic setting (where it occurs within the landscape, linkage with other aquatic habitat,
biogeographical region) • Climate zone and major features • Soil (structure and color) • Water regime (periodicity, extent of flooding and depth, source of surface water and links with
groundwater) • Biota (vegetation zones and structure, animal populations and distribution, special features
including rare/endangered species)
Management features such as:
• Land use local and in the river basin and or coastal zone; • Pressures on the wetland within the wetland and in the river basin and/or coastal zone; • Land tenure and administrative authority for the wetland, and for critical parts of the river basin
and/or coastal zone, • Conservation and management status of the wetland including legal instruments and social or
cultural traditions that influence the management of the wetland • Ecosystem values and benefits (goods and services) derived from the wetland including
products, functions and attributes and where possible their services to human well being • Management plans and monitoring programs in place and planned within the wetland and in
the river basin and/or coastal zone,
The wetland description should also focus on including information on any particular local features or characteristics of the site, especially its values and functions for people that may be helpful in establishing priorities and setting management objectives. These are essentially functions that are directly (flora and fauna) or indirectly (goods and services provided by the ecosystems) derived from the wetland.
Since most of these functions are of great socio-economic importance, involving the relevant stakeholders and their inputs in this characterization is essential (hbk-18). Besides, it could lead to their further participation in wetland protection and management decision-making. The following are examples of features and functions that shall be considered, as circumstances require:
• Production functions: i.e. timber and firewood production, fish and shellfish productivity, supply of water for drinking, irrigation and industry, etc.;
• Carrying functions suitability for: i.e. Constructions, indigenous settlement, rural settlement, infrastructure, shipping/navigation, leisure and tourism activities, processing and regulation functions, coastal protection against floods, water filtering, dilution of pollutants, groundwater recharge capacity, prevention of saline groundwater intrusion, carbon sequestration, etc.;
• Cultural features shall also be included in the description: i.e. Paleontological and archaeological records, cultural landscapes, traditional production and agro-ecosystems, e.g. rice fields, salinas, exploited estuaries; collective water and land management practices, self-management practices, including customary rights and tenure, religious aspects, beliefs and mythology, etc.
The variables outlined above as constituents of a wetland description are aimed at setting the “base-line” to understand –through monitoring - wetlands’ dynamics and responses under pressure. On this base, understanding changes in water regime, water quality, physical modification, exploitation of biological products and introduction of exotic species, leads us to be able to assess some of the major causes of change in a wetland’s ecological character as a result of any kind of development activities. It would also lead us to design -based on available resources, local knowledge and fresh data- the most adequate management responses, including wetland protection and/or restoration in some cases.
146
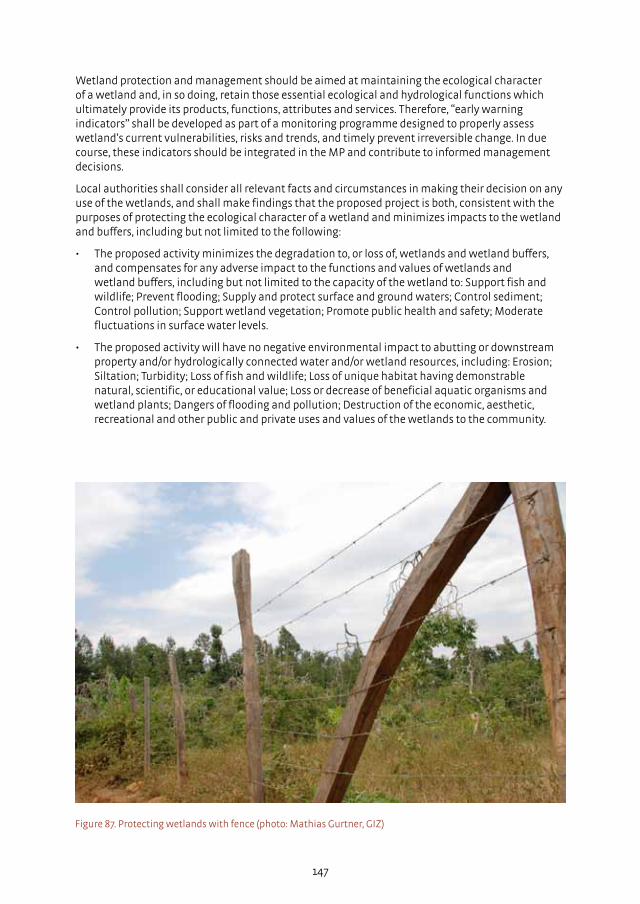
Wetland protection and management should be aimed at maintaining the ecological character of a wetland and, in so doing, retain those essential ecological and hydrological functions which ultimately provide its products, functions, attributes and services. Therefore, “early warning indicators” shall be developed as part of a monitoring programme designed to properly assess wetland’s current vulnerabilities, risks and trends, and timely prevent irreversible change. In due course, these indicators should be integrated in the MP and contribute to informed management decisions.
Local authorities shall consider all relevant facts and circumstances in making their decision on any use of the wetlands, and shall make findings that the proposed project is both, consistent with the purposes of protecting the ecological character of a wetland and minimizes impacts to the wetland and buffers, including but not limited to the following:
• The proposed activity minimizes the degradation to, or loss of, wetlands and wetland buffers, and compensates for any adverse impact to the functions and values of wetlands and wetland buffers, including but not limited to the capacity of the wetland to: Support fish and wildlife; Prevent flooding; Supply and protect surface and ground waters; Control sediment; Control pollution; Support wetland vegetation; Promote public health and safety; Moderate fluctuations in surface water levels.
• The proposed activity will have no negative environmental impact to abutting or downstream property and/or hydrologically connected water and/or wetland resources, including: Erosion; Siltation; Turbidity; Loss of fish and wildlife; Loss of unique habitat having demonstrable natural, scientific, or educational value; Loss or decrease of beneficial aquatic organisms and wetland plants; Dangers of flooding and pollution; Destruction of the economic, aesthetic, recreational and other public and private uses and values of the wetlands to the community.
147
Figure 87. Protecting wetlands with fence (photo: Mathias Gurtner, GIZ)

Cost and Benefits
Wetland management costs may greatly vary from country to country and depends upon the management process followed and the set of management options chosen. Wetland description shall not be costly, if recent scientific literature is abundant. Despite that, data collection and analysis (chemical, biophysical); satellite images and remote sensing (land cover - land use monitoring); mapping and database assembling, tend to be expensive, again depending on what is already available among government institutions, NGOs and research centers.
The benefits of wetland protection and management might be already clear from what has been stated earlier: maintaining the ecological character of a wetland and, in so doing, retain those essential ecological and hydrological functions which ultimately provide its products and services. For an economical estimate of wetlands’ goods and services values, please refer to Emerton & Bos, 2004 cited above.
Constraints
All management initiatives –including protection- should respond to local needs in terms of maintaining wetlands’ characteristics and ecosystems’ goods and services. They shall prioritize securing sustainable livelihoods for the most at need: water and food security and reducing their overall vulnerability in the face of global change.
Besides, there should be a minimum enabling environment in place to work on wetland protection: first, adequate willingness among key stakeholders and local authorities, if possible, expressed through signed agreements. Then, a minimum set of institutional capacities to clearly set responsibilities, management arrangements, (search for) funding and accountability. Last but not least, an environmental legal framework in favor of wetland management and wise use, biodiversity conservation, water resources and coastal management, land use planning, etc.
Variations
Wetland management responses vary greatly according to: the type of wetland of interest, local needs and environmental / wetland conservation priorities and policies worldwide. Effective wetland protection therefore requires, among others, some of the guidelines that can be found in the references.
148

149
4.35 Intensive controlled grazing
Introduction
In intensive controlled grazing (also called holistic planned grazing) the idea is that with intensive grazing for short period in small areas will improve the regeneration of all grasses and the capacity of the soil to absorb occasional rainfall. The recommendation is to have more cattle – not less – in the dry savannah areas. Instead planned grazing by bunched animals can restore grasslands and add to their productivity as well as biodiversity and capacity to sequester carbon.
When savannah terrain is grazed by large, tightly-bunched livestock herds, the trampling and hoof movement breaks the soil crust. This ensures that air can enter and more water infiltrates when it rains. The trampling also knocks down ungrazed leaves to provide soil-covering mulch, while compacting soil to provide good seed-to-soil contact. Dung and urine provide fertilizer to feed the new grass plants that establish in the improved microenvironment. Chewing the grass by animals stimulates plant and root growth. In controlled intensive grazing all grasses are browsed not only the most palatable ones. This prevents a dry undergrowth of less attractive grasses and shrubs.
In fact, although pastoralists may be seen as cattle farmers, it would be better to view them as grass-farmers working to harvest sunlight through green, growing plants that cover soil, feed animals and people, and, through well planned grazing also sequester water and carbon. The priority is to invest in developing animal-maintained grasslands in which perennials dominate. In Zimbabwe this approach is experimented by the Africa Center for Holistic Management. Planning of grazing activities is key for this approach – with herd using a limited area for a short period (few hours to a few weeks)
Figure 88. Grazing (photo: Savoury Institute)
MD
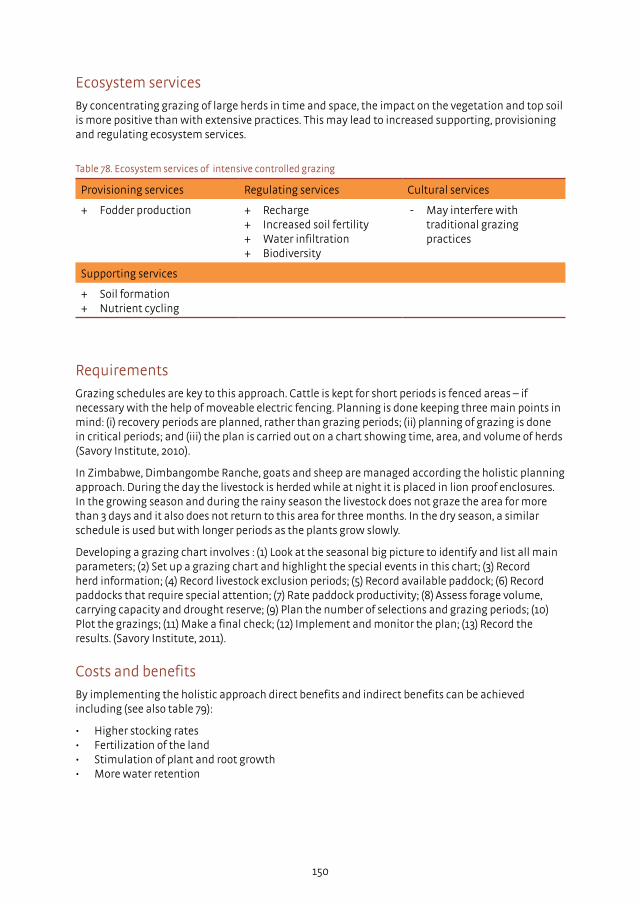
Ecosystem services
By concentrating grazing of large herds in time and space, the impact on the vegetation and top soil is more positive than with extensive practices. This may lead to increased supporting, provisioning and regulating ecosystem services.
150
Provisioning services Regulating services Cultural services
+ Fodder production + Recharge+ Increased soil fertility+ Water infiltration+ Biodiversity
- May interfere with traditional grazing practices
Supporting services
+ Soil formation+ Nutrient cycling
Table 78. Ecosystem services of intensive controlled grazing
Requirements
Grazing schedules are key to this approach. Cattle is kept for short periods is fenced areas – if necessary with the help of moveable electric fencing. Planning is done keeping three main points in mind: (i) recovery periods are planned, rather than grazing periods; (ii) planning of grazing is done in critical periods; and (iii) the plan is carried out on a chart showing time, area, and volume of herds (Savory Institute, 2010).
In Zimbabwe, Dimbangombe Ranche, goats and sheep are managed according the holistic planning approach. During the day the livestock is herded while at night it is placed in lion proof enclosures. In the growing season and during the rainy season the livestock does not graze the area for more than 3 days and it also does not return to this area for three months. In the dry season, a similar schedule is used but with longer periods as the plants grow slowly.
Developing a grazing chart involves : (1) Look at the seasonal big picture to identify and list all main parameters; (2) Set up a grazing chart and highlight the special events in this chart; (3) Record herd information; (4) Record livestock exclusion periods; (5) Record available paddock; (6) Record paddocks that require special attention; (7) Rate paddock productivity; (8) Assess forage volume, carrying capacity and drought reserve; (9) Plan the number of selections and grazing periods; (10) Plot the grazings; (11) Make a final check; (12) Implement and monitor the plan; (13) Record the results. (Savory Institute, 2011).
Costs and benefits
By implementing the holistic approach direct benefits and indirect benefits can be achieved including (see also table 79):
• Higher stocking rates • Fertilization of the land • Stimulation of plant and root growth • More water retention
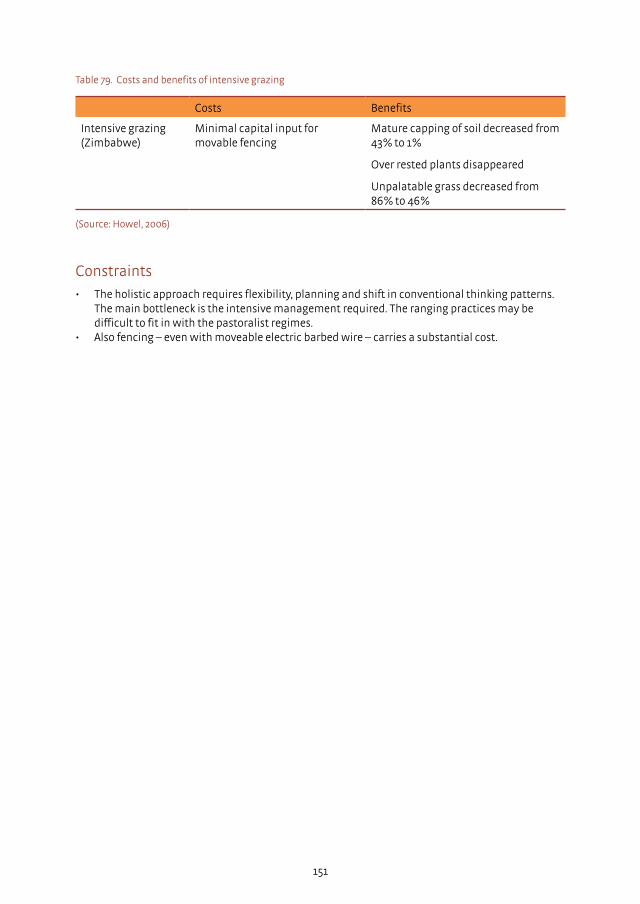
151
Costs Benefits
Intensive grazing (Zimbabwe)
Minimal capital input for movable fencing
Mature capping of soil decreased from 43% to 1%
Over rested plants disappeared
Unpalatable grass decreased from 86% to 46%
(Source: Howel, 2006)
Table 79. Costs and benefits of intensive grazing
Constraints
• The holistic approach requires flexibility, planning and shift in conventional thinking patterns. The main bottleneck is the intensive management required. The ranging practices may be difficult to fit in with the pastoralist regimes.
• Also fencing – even with moveable electric barbed wire – carries a substantial cost.

4.36 Farm forestry and windbreaks
Introduction
The coexistence of crops and trees on the farmland is nothing new. In Kenya in 1994, the woody biomass outside forests was already bigger than the production in plantations and national parks (Holmgren & Masakha, 1994). Beyond value of farm forestry to soil and water conservation, trees bring economic return and represent a long term investment. There is scope though in agroforestry to be more market-oriented and go for trees that bring adequate returns. At the same time, there is much need to develop market mechanisms and processing facilities. (Russell & Franzel, 2004). Farm forestry acts as a buffer during periods of hardship, provided tree ownership is clear and market opportunities are at hand (Russell & Franzel, 2004).
In the most productive areas of Kenya, there is not much space left for big plantations and forestation programs. However, different combinations of farm forestry and crop production are possible. Forestry programs should be focused on farm forestry so they can address the production of food and forest products at the same time (Holmgren & Masakha, 1994).
Ecosystem services
The introduction of trees on farms and at landscape level can bring in a wealth of benefits, especially when multipurpose trees are used. They help stabilize slopes and influence the microclimate, while their water requirements are relatively lower than crops in adjacent fields. Once established, indigenous trees usually do not need additional watering.
Figure 89. Young farm woodlot in southern Kenya (Photo: Drylands Natural Resources Center www.rootsofprosperity.com)
152
UD
Provisioning services Regulating services Cultural services
+ Production of fruit, timber and other tree products
+ Erosion control+ Biodiversity+ Wind protection
Supporting services
+ Carbon cycling
Table 80. Ecosystem services of windbreaks and farm forestry
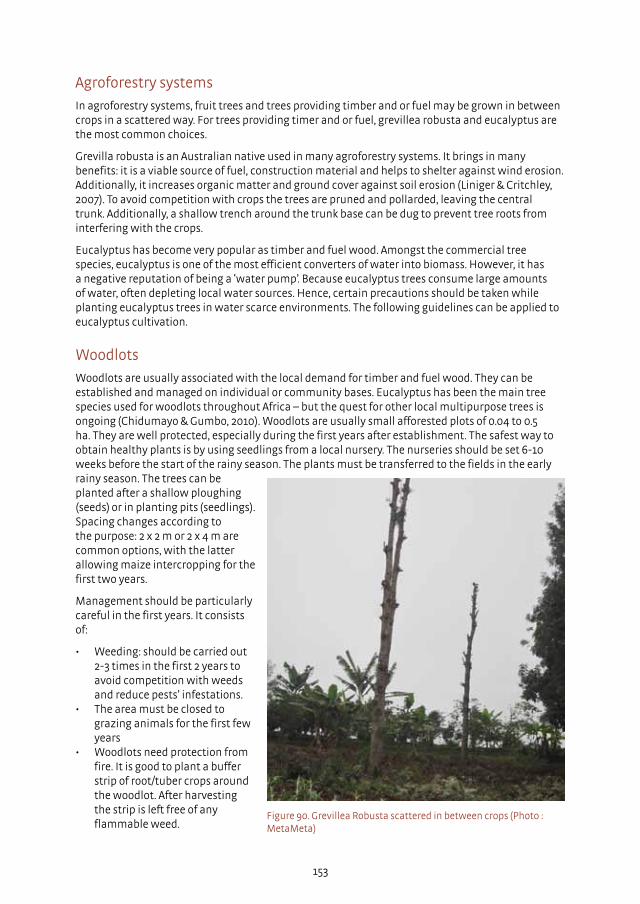
153
Agroforestry systems
In agroforestry systems, fruit trees and trees providing timber and or fuel may be grown in between crops in a scattered way. For trees providing timer and or fuel, grevillea robusta and eucalyptus are the most common choices.
Grevilla robusta is an Australian native used in many agroforestry systems. It brings in many benefits: it is a viable source of fuel, construction material and helps to shelter against wind erosion. Additionally, it increases organic matter and ground cover against soil erosion (Liniger & Critchley, 2007). To avoid competition with crops the trees are pruned and pollarded, leaving the central trunk. Additionally, a shallow trench around the trunk base can be dug to prevent tree roots from interfering with the crops.
Eucalyptus has become very popular as timber and fuel wood. Amongst the commercial tree species, eucalyptus is one of the most efficient converters of water into biomass. However, it has a negative reputation of being a ‘water pump’. Because eucalyptus trees consume large amounts of water, often depleting local water sources. Hence, certain precautions should be taken while planting eucalyptus trees in water scarce environments. The following guidelines can be applied to eucalyptus cultivation.
Woodlots
Woodlots are usually associated with the local demand for timber and fuel wood. They can be established and managed on individual or community bases. Eucalyptus has been the main tree species used for woodlots throughout Africa – but the quest for other local multipurpose trees is ongoing (Chidumayo & Gumbo, 2010). Woodlots are usually small afforested plots of 0.04 to 0.5 ha. They are well protected, especially during the first years after establishment. The safest way to obtain healthy plants is by using seedlings from a local nursery. The nurseries should be set 6-10 weeks before the start of the rainy season. The plants must be transferred to the fields in the early rainy season. The trees can be planted after a shallow ploughing (seeds) or in planting pits (seedlings). Spacing changes according to the purpose: 2 x 2 m or 2 x 4 m are common options, with the latter allowing maize intercropping for the first two years.
Management should be particularly careful in the first years. It consists of:
• Weeding: should be carried out 2-3 times in the first 2 years to avoid competition with weeds and reduce pests’ infestations.
• The area must be closed to grazing animals for the first few years
• Woodlots need protection from fire. It is good to plant a buffer strip of root/tuber crops around the woodlot. After harvesting the strip is left free of any flammable weed.
Figure 90. Grevillea Robusta scattered in between crops (Photo : MetaMeta)

Box 14: Windbreaks
Windbreaks are a particularly useful form of agro-forestry. Developing them entails planting of trees in lines perpendicular to the prevailing direction of the wind. As a result wind speed on the ground slows down and the wind force is diverted to a higher altitude. This has a number of beneficial effects: • Direct damage to crops is reduced • Plants in their flowering stage are particularly susceptible to wind damage. Windbreaks
help protecting them. Since fruits develop blossom, less damaged blossoms effectively mean an increase in production.
• Soil erosion due to wind is reduced as the force of wind blowing across the soil is decreased drastically.
• Soil evapotranspiration is decreased as exposure to desiccating winds is reduced. The microclimate is enhanced and favours optimal crop growing conditions.
• Windbreak reduces the loss of moisture as dew. Depending on the orientation of the sun (and wind direction) the morning shade of wind breaks delays the evaporation of morning dew.
Trees suited for use as windbreak have the ability to withstand strong winds, deep rooting for stability, are long and erect (to allow dense rows and not have excessive shade underneath them), and small crowns so that they suffer from less wind damage themselves. Windbreaks protect the fields for a distance of up to 10 times the height of the trees. For effective protection, it is important to create a homogenous barrier comprising of species of different height. Suitable species for windbreaks are: Neem, Cassia species, Sesbania, Leucaena, Albizia species and Grevillea Robusta.
Source: Trees for the future, 2008
Figure 91. Windbreak
154

The trees can be harvested after 3 years or more. The harvesting techniques can be selective, or the stand can be clear felled at once. Sequential felling is carried out in order to provide wood supply in the short, medium and long term. The age at which the trees are felled depends on the species and characteristics of the wood required (Liyunga, Matakala, Chintu, & Joao, 2011).
Costs and Benefits
• Grevillea agroforestry systems have an estimated establishment cost of USD 160 per hectare, and a management cost of USD 90 per hectare per year (Liniger & Critchley, 2007).
• Gliricidia woodlots can bring to the farmer/community 15 tons of wood per hectare (Liyunga et al., 2011).
• Sesbania Woodlot can bring to the farmer/community 20 tons of wood per hectare (Liyunga et al., 2011).
Constraints
• Labour is often a critical factor, especially because the timing of transplanting of young trees from the nursery to the field coincides with other agricultural activities (Liyunga et al., 2011).
• The young plants must be protected from livestock. • Both nurseries and young plants are susceptible to drought. It is essential to ensure the
availability of water. • Some trees withdraw water at a fast rate and might pose a threat to the water table (Rumley,
2006).
Variations
• To be more efficient grevillea rows should be combined with other soil water conservation techniques such as Fanyaa juus or grass strips.
• Managed regeneration of tree crops has been very popular in arid and semi arid areas in West Africa. The technique utilises tree stumps dormant in the soil. With rainfall and or effective water harvesting, they may sprout again. Less useful tree species are pruned whereas useful tree species are allowed to selectively regenerate.
• A constraint related to agroforestry is the long period for which farmers have to wait to reap the first benefits (up to five years) (Liyunga et al., 2011). In Uganda, some banks are providing loans to tree growers, collecting as repayment part of the yields when trees reach maturity and providing subsistence funds to the farmers.
• New growing and marketing systems for farm forestry systems are developing. Small farmers may be contracted as out-growers by the timber-pulp industry (Scherr, 2004). Small-holder tree farmers can also access finance through carbon credits, which they can earn through the Clean Development Mechanism (Roshetko, Lasco, & Angeles, 2006).
155

4.37 Utilizing prosopis juliflora
Introduction
Prosopis juliflora (also called mathinge or mesquite) is a fast-growing drought resistance leguminous tree that originated from Central America. It has now spread to all continents as a multipurpose tree. Its capacity to thrive in harsh (alkaline) conditions has made it an appealing option to use in rehabilitating degraded landscapes and fighting soil erosion and sand dune formation. Additionally, prosopis wood can also be used to produce timber and charcoal. Its pods make for good fodder and its flowers used as bee forage. On the other hand, this thorny bush poses a threat to livelihoods of entire communities in the arid areas of Kenya. Introduced in soil erosion programs, it turned to be aggressive and invasive. Its fast spread in community owned land – usually devoted to pastoralism – has caused the degradation and shrinking of pasturelands. Prosopis juliflora is hardy and difficult to uproot due to its capacity to regenerate vegetatively. Livestock that feed on its pods spread the seeds over large areas.
Prosopis was first introduced in Hola irrigation schemes in the late 1970s and subsequently in the Bura irrigation and settlement schemes in the late 1980’s (Choge, and Ngujiri, 2006). The Tana River Basin, and especially the vegetated belt near the river banks, is particularly infested. Around 52% of the area has been invaded by prosopis. Wenje district is particularly affected with 65% of the land currently threatened by the species (CSDI, 2012). In general, farmers and other communities in Kenya are not happy with the invasion of the plant (see box 15 for example). They often try to ban it, but that has seemed like an impossible job thus far.
Experiences from the past in Africa, Asia and South America show that efforts to completely eradicate prosopis juliflora often fail to reach the objective. The sturdy plant can spread even
Figure 92. Prosopis plants have been introduced by government to restore barren fields, but not adopted by communities yet. Goats like the plant but can lose their teeth on the sharp thorns. It is also used for fodder, fuel and as construction material in houses. (Photo credit: MetaMeta).
156
LMD
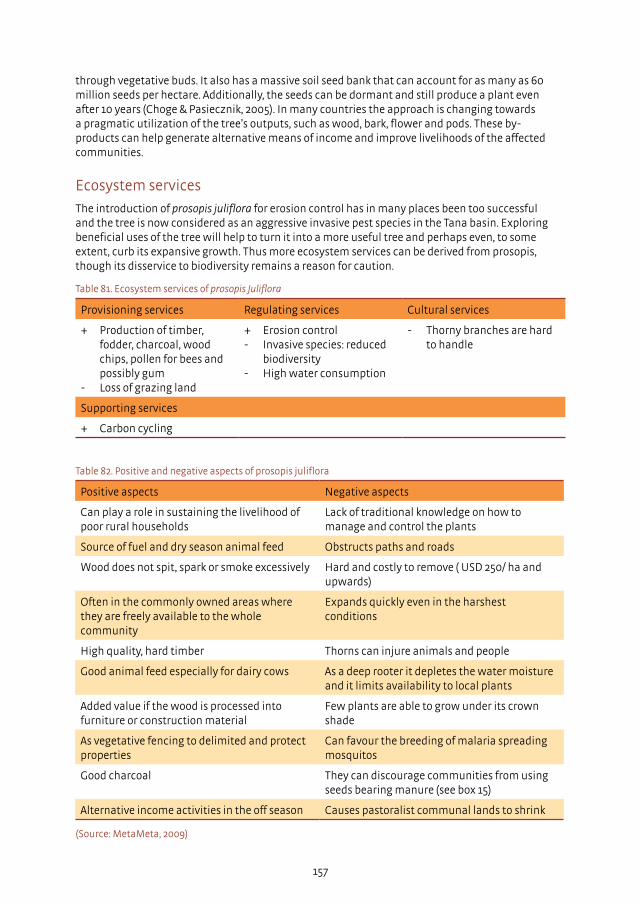
157
through vegetative buds. It also has a massive soil seed bank that can account for as many as 60 million seeds per hectare. Additionally, the seeds can be dormant and still produce a plant even after 10 years (Choge & Pasiecznik, 2005). In many countries the approach is changing towards a pragmatic utilization of the tree’s outputs, such as wood, bark, flower and pods. These by-products can help generate alternative means of income and improve livelihoods of the affected communities.
Ecosystem services
The introduction of prosopis juliflora for erosion control has in many places been too successful and the tree is now considered as an aggressive invasive pest species in the Tana basin. Exploring beneficial uses of the tree will help to turn it into a more useful tree and perhaps even, to some extent, curb its expansive growth. Thus more ecosystem services can be derived from prosopis, though its disservice to biodiversity remains a reason for caution.
Positive aspects Negative aspects
Can play a role in sustaining the livelihood of poor rural households
Lack of traditional knowledge on how to manage and control the plants
Source of fuel and dry season animal feed Obstructs paths and roads
Wood does not spit, spark or smoke excessively Hard and costly to remove ( USD 250/ ha and upwards)
Often in the commonly owned areas where they are freely available to the whole community
Expands quickly even in the harshest conditions
High quality, hard timber Thorns can injure animals and people
Good animal feed especially for dairy cows As a deep rooter it depletes the water moisture and it limits availability to local plants
Added value if the wood is processed into furniture or construction material
Few plants are able to grow under its crown shade
As vegetative fencing to delimited and protect properties
Can favour the breeding of malaria spreading mosquitos
Good charcoal They can discourage communities from using seeds bearing manure (see box 15)
Alternative income activities in the off season Causes pastoralist communal lands to shrink
(Source: MetaMeta, 2009)
Table 82. Positive and negative aspects of prosopis juliflora
Provisioning services Regulating services Cultural services
+ Production of timber, fodder, charcoal, wood chips, pollen for bees and possibly gum- Loss of grazing land
+ Erosion control- Invasive species: reduced biodiversity- High water consumption
- Thorny branches are hard to handle
Supporting services
+ Carbon cycling
Table 81. Ecosystem services of prosopis Juliflora
Making use of prosopis juliflora
Fuel and charcoal production
Prosopis wood is hard, burns slowly and has excellent heating properties. Also, the charcoal it can produce has good properties and can be easily traded on urban markets. The amount of prosopis biomass that is currently standing would be capable of satisfying all energy requirements of Garissa and all Tana river districts for 20 years (CSDI, 2012). Traditionally, earthen mound kilns are used to produce charcoal. The wood is sorted by diameter and heaped leaving as few voids as possible. The resultant pile is then covered with straws, grass and clay in order to create an environment without excessive oxygen to avoid the complete combustion of the wood. Traditional kilns are inefficient as compared to improved designs. The Casamance kiln - an alternative design - has additional ventilation inlets that improve its efficiency. It can convert 35% of the initial dry wood mass to charcoal, as compared to 10% that most traditional stoves can approximately achieve (CSDI, 2009a).
Timber
Prosopis wood is extremely hard and durable. It also has an appealing coloration that makes it ideal to make furniture with. It is also used as parquet flooring wood. However, the short and often crooked nature of the prosopis tree means that it is difficult to use the wood in the form of long logs (Pasiecznik, 2001).
Wood chips
Wooden residues from prosopis can be chipped off and used as mulch in gardens and little vegetable gardens (Pasiecznik, 2001). The mulch is effective in reducing evapotranspiration. Consequently, it also reduces the plant water consumption. The chips have also been successfully proceeded into wooden pulp, which is the primary raw material for paper production (Pasiecznik, 2001).
Fodder
Free ranging animals can eat prosopis pods directly from the tree. Alternatively, the pods can be collected and ground to produce course flour which can be included in the animals’ diet. The percentage of the flour in the mix should be kept below 50% in order to avoid digestion disorders among the livestock (Pasiecznik, 2001).
Land reclamation
By spreading charcoal and using it as bio-char, acidic degraded land can be rehabilitated and yields can be increased. Charcoal improves the physical, biological and chemical properties of the soil by releasing and storing nutrients, increasing the bulk density, improving the overall porosity and creating favourable conditions for micro-biological activity. It can be applied in conjunction with farmyard manure and/or soil microbes (MetaMeta, 2009).
Bio-fuel
Prosopis is an underestimated source of sugars that can be converted into ethanol. Trials in the USA have shown that up to 80% of the pods carbohydrates can be converted in the process (Pasiecznik, 2001). This process, however, is still in an experimental stage.
Honey and gums
Prosopis blossoms abundantly. It is known to produce high amount of pollen that can be transformed into high-quality honey. The only constraint in dry-lands is the lack of water sources for the bees. The gum that exudates from prosopis is comparable to gum Arabica and can be used in the food-cosmetic industry. Its use is constrained by the absence of toxicological tests necessary for it to enter the industrial market.
158

159
Costs and Benefits
• A pod collector in Peru can pick up to 150kg/day and earn 5 USD/day during the production season. In February, the pods sell in the market at USD 27/ton (1997) (Pasiecznik, 2001).
• In India prosopis wood is sold at INR. 80 per kg (USD 2) and charcoal is sold at Rs. 14 per kg (USD 0.33) (MetaMeta, 2009).
• Clearing of one acre of infested land can cost up to USD 250/ha) (MetaMeta, 2009). • The use of prosopis biochar plus manure is known to have brought about a 30-40% increase in
cotton yield (MetaMeta, 2009). • For a small scale charcoal producer it is possible to earn USD 1900/year (CSDI, 2009b).
Challenges
• A new body of regulations is required to facilitate the commercialization of prosopis juliflora products. Policies must promote the production of charcoal and poles for fencing and construction, which until now is discouraged.
• Combating and utilizing prosopis in communal lands should be supported. Ways must be found to empower communities to make joint efforts with governments and authorities. Communities should be encouraged to uproot prosopis seedlings when they are still easy to remove.
• In dry areas, prosopis trees remain craggy and small, which makes using them to make furniture or charcoal less attractive.
Box 15: Prosopis juliflora sprouts quickly
On the Maendeleo farm in Garissa, every mango tree has its own pit to maximize water efficiency. Fertilizer is applied in each pit as well. This mango farmer does not use natural manure as it could contain seeds from the Prosopis juliflora. These seeds are able to sprout in 24 hours, which is highly undesirable at the farm.
Figure 93. Using chemical fertilizer in planting pit (Photo: MetaMeta)

4.38 Conservation agriculture
Introduction
Conservation Agriculture is a farming approach that links three principles to mimick natural ecosystem processes: (i) minimum soil disturbance, maintained by planting crops in untilled soil by opening a narrow slot, trench or band of sufficient width and depth that is just sufficient to achieve proper seed coverage; (ii) permanent soil cover by mulch, crop residues or cover crops; and (iii) diversified crop rotation. Often conservation agriculture is also referred to as no-tillage or zero-tillage.
Conservation agriculture was first adopted by medium and large-scale farmers in Latin America. Ever since, it has been taken up by smaller farmers in eastern and southern Africa and Asia as well. In Kenya, conservation agriculture was initiated by the Kenya Conservation Tillage Initiative in 1998. Conservation agriculture presents many advantages such as a reduction in labour requirements, more stable yields, less erosion, increased aquifer recharge, soil moisture retention, and reduction in equipment costs.
Ecosystem services
The main characteristics of conservation agriculture, minimum tillage, soil cover and crop rotation, together provide a different set of ecosystem services than conventional agriculture. In particular, supporting and regulating ecosystem services are enhanced by this type of agriculture.
Figure 94. Inter cropping with maize and French beans (photo: MetaMeta)
160
U LMD

161
Provisioning services Regulating services Cultural services
+ Crop production + Retention+ Increased soil fertility+ Water infiltration+ Biodiversity+ Erosion control+ Pest control
Supporting services
+ Soil formation+ Nutrient cycling
Table 83. Ecosystem services of conservation agriculture
Strategy
Minimum soil disturbance
By minimizing soil disturbance the soil keeps its original structure and disadvantages of ploughing are prevented. Turning the soil often makes it harder for rainwater to infiltrate as natural drainage patterns are disturbed. Ploughing can also destroy organic matter in the soil and disturb organisms and root systems (Zimbabwe Conservation Agriculture Task Force, 2009).
In Kenya, a variety of tillage intensities are found, ranging from minimum tillage to no-tillage. In general, farmers first practice reduced tillage then move on to no-tillage. This is partly influenced by access to no-till seeders (Kaumbutho and Kienzle, 2007). However, the local conditions could be such that it might not be necessary to use heavy equipment. For a list of equipment commonly used under conservation agriculture, see table 84.
Soil cover
The practice of keeping the soil covered is the biggest difference between conventional agriculture and conservation agriculture. Crop residues, mulch or cover crops are commonly used for this purpose. Mulching reduces raindrop impact on the soil, enables water to seep into it, reduces evaporation, prevents weed growth, improves the content of organic matter in the soil, improves the environment for organisms, and moderates soil temperatures (Zimbabwe Conservation Agriculture Task Force, 2009).
Crop rotation
Crop rotation and intercropping can increase soil fertility when nitrogen-fixing legumes are planted. They also enable crops to use nutrients more efficiently as different crops have different nutrient needs. Rotation controls weed outbreaks as it breaks the life cycles of weeds (or diseases and pests) by introducing new crops.

162
Table 84. Equipment options for conservation agriculture
Tool Purpose Advantage Disadvantage
Land preparation
Chisels or rippers Minimum or reduced tillage
• Poor weed control • Clogging up • Needs proper soil moisture • Lifting stones/clods
Subsoiler Break hard or compacted layers
• Needs lot of power • No improvement in water
filtration when used incorrectly • Can be used in dry soils only
Cutting disc To open slots in the soil and to cut residues
• Requires knowledge of how to use
Double disc coulter
Furrow opener to place seeds
• Simple construction and maintenance free
• Improved action with different disc-diameters
• Needs high penetration forces • Intolerant to sub-optimal soil
conditions • Tendency to tuck residues into
the slot (hair pinning) • Concentration of seeds and
fertilizers
Hoe openers To open furrows • Low costs • Less affected by forward
speed • Good penetration • No hair pinning
• Problems with stones and obstacles
• Requires good cutting discs for long residues
• Considerable soil movement
Inverted T-opener
• No compaction of soil • Self closure of slot • Constant seeding depth • Excellent for grassland
• Considerable wear on sandy soils
• No proper furrow opening on loose soils
• Difficult residue handling
Weed and cover crop soil
Machete or knife Cut weed and cover crop
• Easy access to tools • Cheap
• Time consuming • Heavy labour • Regrowth of weed
Knife rollers To flatten and crush the weed or cover crop
• Simple and cheap • Needs proper management to avoid regrowth
(Source: FAO, 2009)
Motorized mowers
To cut weed and crops
• High work rate • Expensive • Requires petrol • Noisy
Chemicals Desiccate or kill undesired vegetation
• Easy and quick • Can be expensive • Health and environmental
risks • Needs user guidance
Seeding and planting
Broadcast or planting stick
Direct seeding of small grains or planting row crops
• Simple • Labour intensive
Hand jab planter Direct seeding • Quick • Cheap • Uses standing position
• Requires skills • Tip clogs up in clayey soil
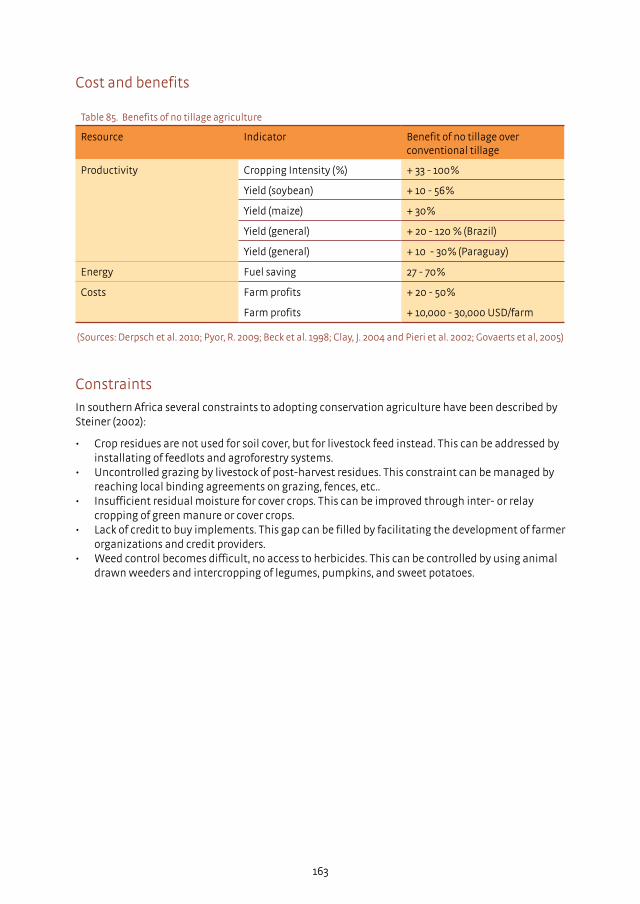
163
Cost and benefits
Table 85. Benefits of no tillage agriculture
Resource Indicator Benefit of no tillage over conventional tillage
Productivity Cropping Intensity (%) + 33 - 100%
Yield (soybean) + 10 - 56%
Yield (maize) + 30%
Yield (general) + 20 - 120 % (Brazil)
Yield (general) + 10 - 30% (Paraguay)
Energy Fuel saving 27 - 70%
Costs Farm profits + 20 - 50%
Farm profits + 10,000 - 30,000 USD/farm
(Sources: Derpsch et al. 2010; Pyor, R. 2009; Beck et al. 1998; Clay, J. 2004 and Pieri et al. 2002; Govaerts et al, 2005)
Constraints
In southern Africa several constraints to adopting conservation agriculture have been described by Steiner (2002):
• Crop residues are not used for soil cover, but for livestock feed instead. This can be addressed by installating of feedlots and agroforestry systems.
• Uncontrolled grazing by livestock of post-harvest residues. This constraint can be managed by reaching local binding agreements on grazing, fences, etc..
• Insufficient residual moisture for cover crops. This can be improved through inter- or relay cropping of green manure or cover crops.
• Lack of credit to buy implements. This gap can be filled by facilitating the development of farmer organizations and credit providers.
• Weed control becomes difficult, no access to herbicides. This can be controlled by using animal drawn weeders and intercropping of legumes, pumpkins, and sweet potatoes.

5 References and further reading
Abu-Goukh, A. (2003). Use of Plastic Mulch for Better Performance and Yield of Okra During Winter in Sudan. University of Khartoum Journal of ….
Ali, M. (2004). Sustainable composting. case studies and guidelines for developing countries (p. 124). WEDC, Loughborough University.
Anikwe, M. A. N., Mbah, C. N., Ezeaku, P. I., & Onyia, V. N. (2007). Tillage and plastic mulch effects on soil properties and growth and yield of cocoyam (Colocasia esculenta) on an ultisol in southeastern Nigeria. Soil and Tillage Research, 93(2), 264–272. doi:10.1016/j.still.2006.04.007
Awulachew, S.B., Lamperiere, P. & Tulu, T., 2009. Water harvesting and development for improving productivity. pp.1–50.
Badenhop, A. (n.d.). Managed Aquifer Recharge in Sydney Coastal Sand Aquifers. connectedwaters.unsw.edu.au.
Baranick, M.; McElwee, D. and Zazycki, M. (2011). Biochar Feasibility Study, Exploring the environmental, social and economic value of a biochar business in the Methow Valley [online] Available at: <http://www.biochar-international.org/sites/default/files/Biochar_ Final%20Paper_For%20Distribution%20v9.29.pdf> [Accessed on December 20, 2011]
Barbier, E.B, Acreman, M.C., and Knowler, D. 1997. Economic valuation of wetlands: A guide for policy makers and planners. Ramsar Convention Bureau, Gland Switzerland.
Batchelor, B., Fonseca, C., Smits, S., (2011), Life-cycle costs of rainwater harvesting systems, IRC (International Water and Sanitation Centre)
Beck D.L.; J.L. Miller and M.P. Hagny (1998). Successful No-Till on the Central and Northern Plains, Presented at the ASA conference Baltimore, MD, October1998
Benicke, C., 2001. Costs and Benefits of Adopting Runoff Irrigation Systems, Universität Bayreuth.
Best Energies (2008). Agrichar – Advances Carbon Soil Amendment [online] Available at: <http://pacificpyrolysis.com/images/Agrichar%20TM%20brochure%202009.pdf> [Accessed on December 20th 2011]
Boelee E, Chiramba T, Khaka E (eds) (2011) An ecosystem services approach to water and food security. Nairobi, Kenya: United Nations Environment Programme (UNEP); Colombo, Sri Lanka: International Water Management Institute (IWMI). 64p. http://www.iwmi.org/ecosystems
Butterworth, J., Adolph, B., & Reddy, B. S. (2003). How Farmers Manage Soil Fertility. A Guide to Support Innovation and Livelihoods (p. 80).
Cambell, S. 2001. Mulch it! A practical guide to using mulch in the garden and landscape.
Centre, U. I. E. T. (1998). Source Book of Alternative Technologies for Freshwater Augmentation in Africa.
Chatterjee, A., Phillips, B. & Stroud, D.A. 2008. Wetland Management Planning. A guide for site managers. WWF, IUCN, Wetlands International, Ramsar Convention. 76pp.
Cheatle, R. J., & Shaxson, T. F. (1999). Keynote: Conservation is for Business-Self-Help Groups in Kenya. In Sustaining the global farm (pp. 068–074).
Chevalking S., Knoop L., and F. van Steenbergen. 2008. Ideas for groundwater management.
164

Wageningen, The Netherlands: MetaMeta and IUCN
Chidumayo, E. N., & Gumbo, D. J. (2010). The dry forests and woodlands of Africa. managing for products and services (p. 288). Earthscan / James & James.
Choge, S. K., & Pasiecznik, N. M. (2005). The challenges of eradicating Prosopis in Kenya. HDRA - the organic organisation, 1–4.
Choge, S., & Ngujiri, F. (2006). Status and impact of Prosopis species in Kenya. In Problems posed by the introduction of prosopis spp. in selected countries (pp. 1–39). FAO.
Clay, J. (2004). World Agriculture & Environment -A Commodity-By-Commodity Guide To Impacts And Practices, Island Press, WWF Book extract titled: Better Management Practices: No-Till/Conservation Tillage [online] Available at: <http://wwf.panda.org/what_we_do/footprint/agriculture/soybeans/better_management_practices /no_till/> [Accessed April 6 2012]
Columbus, N. (1973). Dan region, Israel, sewage-reclamation and recharge project. IAHS Publ no Ill.
Conjunctive Use of Groundwater and Surface Water from spontaneous coping strategy to adaptive resource management 2010
Critchley, W. & Reij, C, 1992. Water harvesting for plant production. Volume II: Case studies and conclusions for Sub-Saharan Africa, World Bank Technical Paper.
Critchley, W. et al. (1991b) Water Harvesting. A manual for the design and construction of water harvesting schemes for plant production.
Critchley, W. R. S., & Mutunga, K. (2003). Local innovation in a global context: documenting farmer initiatives in land husbandry through WOCAT. Land Degradation & Development, 14(1), 143–162. doi:10.1002/ldr.537
Critchley, W., & Reij, C. (1992). Water harvesting for plant production. Volume II: Case studies and conclusions for Sub-Saharan Africa (p. 147). World Bank Technical Paper.
Critchley, W., Siegert, K. & Chapman, C., 1991. Water Harvesting. A manual for the design and construction of water harvesting schemes for plant production.
CSDI. (2009a). Prosopis charcoal manual, 1–20.
CSDI. (2009b). Working Paper on Prosopis: The case for local-level initiatives in prosopis management, 1–13.
CSDI. (n.d.). Prosopis mapping and biomass assessment: breaking new grounds
CSDI. Retrieved April 5, 2012, from http://www.csdikenya.org/ourworkonprosopis.htm
Dazhong, W. (1993). Soil erosion and conservation in China. World Soil Erosion and Conservation. Pimentel.
Derpsch et al. (2010). Current status of adoption of no-till farming in the world and some of its main benefits. International Journal of Agriculture & Biological Engineering, Volume 3, Number 1
Desta, L., Carucci, V. & Wendem-Agenehu, A., 2005. Community Based Participatory Watershed Development: A Guideline. Ministry of Agriculture and Rural Development, Addis Ababa, Ethiopia
Development Impact Consulting Ltd. (2009). Final Report on Impact Assessment Study for Mount Kenya East Pilot Project (MKEPP), 1–220.
Fonseca, R., & Barriga, F. (2003). Dam reservoir sediments as fertilizers and artificial soils. Case studies from Portugal and Brazil. In Proceedings. Presented at the Proceedings.
Foster, S.& Tuinhof, A. (2004). Brazil, Kenya: Subsurface Dams to Augment Groundwater Storage in
165
Basement Terrain for Human Subsistence: In. Sustainable Groundwater Management, World Bank case profile number 5.
Gale, I., & Recharge, I. A. O. H. C. O. M. A. (2005). Strategies for Managed Aquifer Recharge (MAR) in semi-arid areas; 2005, 1–33.
Gaunt, J.L. and Lehmann, J. (2008). Energy balance and emissions associated with biochar sequestration and pyrolysis bioenergy production. Environmental Scienctific Technology, Volume 42: pp. 4152-4158 [online] Available at: http://www.css.cornell.edu/faculty/ lehmann/publ/ES%26T%2042,%204152-4158,%202008%20Gaunt.pdf [Accessed on December 20th 2011]
Geyik, M. (1986). FAO watershed management field manual. Gully control. FAO Conservation Guide (FAO). Retrieved from http://www.fao.org/docrep/006/ad082e/AD082e00.htm#cont
Gitay, H., Finlayson, C.M. & Davidson, N.C. 2011. A Framework for assessing the vulnerability of wetlands to climate change. Ramsar Technical Report No. 5/CBD Technical Series No. 57. Ramsar Convention Secretariat, Gland, Switzerland & Secretariat of the Convention on Biological Diversity, Montreal, Canada. ISBN 92-9225-361-1 (print); 92-9225-362-X (web).
Graaff, J. de. (2008). The price of soil erosion : an economic evaluation of soil conservation and watershed development, 1–313.
GWMATE/World Bank (2004). Brazil, Kenya: Subsurface Dams to Augment Groundwater Storage in Basement Terrain for Human Subsistence GWMATE Case Profile series number 5 (www.worldbank.org/gwmate).
Hamerlynck, O., Nyunja, j., Luke, Q., Nyingi, D., Lebrun, D., and S. Duvail (2010). The communal forest, wetland, rangeland and agricultural landscape mosaics of the Lower Tana, Kenya, a socio‐ecological entity in peril. CBD Technical Series No. 52.
Hansen, J. et al. (2008). Target Atmospheric CO2: Where should humanity aim? [online] Available at: <http://www.columbia.edu/~jeh1/2008/TargetCO2_20080407.pdf> [Accessed on December 20th 2011]
Hanson, G., & Nilsson, A. (1986). Ground Water Dams for Rural Water Supplies in Developing Countries. Ground Water.
Hawkins, R. et al. (2008). [online] Available at <http://www.carbonchar.com /sites/default/files/UN%20SIDS%20CSD-15%20paper.pdf> [Accessed on December 20th 2011]
Holmgren, P., & Masakha, E. (1994). Not all African land is being degraded: a recent survey of trees on farms in Kenya reveals rapidly increasing forest resources. Ambio (Sweden).
Hunink, J.E., W.W. Immerzeel, P. Droogers, S. Kaufmann, 2010. Green Water Credits for the Upper Tana Basin, Kenya. Phase II - Pilot Operations: Biophysical assessment using SWAT. Green Water Credits Report 10 / ISRIC Report 2010/04, ISRIC World Soil Information, Wageningen
IBI (2011). World Bank Study of Biochar Projects in Developing Countries [online] Available at: <http://www.biochar-international.org/developingeconomies> [Accessed on December 20th 2011]
IBI (International Biochar Initiative) (2011). IBI Developing Country Biochar Systems Survey: Methodology and Results [online] Available at: <http://www.biochar-international.org/sites/default/files/IBI_Survey_5-11-11_online.pdf> [Accessed on Deccember 20th 2011]
Imbira, J., Runoff harvesting for crop production in semi-arid areas of Baringo. In Third Nationa Workshop 1986. Third Nationa Workshop 1986. Kabete, Nairobi.
K, C. S., & D, N. F. (2006). Status and impact of Prosopis species in Kenya. In Problems posed by the introduction of prosopis spp. in selected countries (pp. 1–39). FAO.
166
Kafkafi, U. (2009). Low root temperature influence on water uptake. The Robert H Smith Institute Of Plant Sciences And Genetics In Agriculture, 1–4.
Kang, B. T., & Akinnifesi, F. K. (2000). Agroforestry as alternative land-use production systems for the tropics. Natural Resources Forum, 24(2), 137–151. doi:10.1111/j.1477-8947.2000.tb00938.x
Kaumbutho Pascal, Kienzle Josef, eds. 2007. Conservation agriculture as practised in Kenya: two case studies. Nairobi. African Conservation Tillage Network, Centre de Coopération Internationale de Recherche Agronomique pour le Développement, Food and Agriculture Organization of the United Nations.
Kenya Wetlands Forum: http://www.kenyawetlandsforum.org/index.php?option=com_content&view=article&id=1:welcome-to-kenya-wetlands-forum
KFS, (2010). A Guide to On-Farm Eucalyptus Growing in Kenya
Kondolf, G. (1997). Hungry water: effects of dams and gravel mining on river channels. ENVIRONMENTAL MANAGEMENT-NEW YORK.
Laird, D.A. (2008). The charcoal vision: A win-win-win scenario for simultaneously producing bioenergy, permanently sequestering carbon, while improving soil and water quality. Agronomy Journal, Volume 100, Issue 1 [online] Available at: < http://www.carbonchar.com/sites/default/files/LAIRD.pdf> [Accessed on December 20th 2011]
Lehmann, J. (2007). Bio-energy in the black. Frontiers in Ecology and the environment, Volume 5, Issue 7: pp. 381-387 [online] Available at: <http://www.css.cornell.edu/ faculty/lehmann/publ/FrontiersEcolEnv%205,%20381-387,%202007%20Lehmann.pdf> [Accessed on December 20th 2011]
Liniger, H., & Critchley, W. (2007). Where the land is greener. case studies and analysis of soil and water conservation initiatives worldwide (p. 364).
Liniger, H., Studer, R., & Hauert, C. (2011). Sustainable land management in practice: guidelines and best practices for Sub-Saharan Africa.
Liyunga, K., Matakala, P., Chintu, R., & Joao, C. (2011). Agroforestry options manual: a trainers guide.
Mati, B. M. (2006). Overview of Water and Soil Nutrient Management under Smallholder Rain-fed Agriculture in East Africa (pp. 1–94). International Water Management Institute.
Mati, B.M., 2006. Overview of Water and Soil Nutrient Management under Smallholder Rain-fed Agriculture in East Africa, International Water Management Institute.
Mbagwu, J. (1991). Influence of different mulch materials on soil temperature, soil water content and yield of three cassava cultivars. Journal of the Science of Food and Agriculture.
MetaMeta. (2009). Prosopis Juliflora: A menace or a resource. MetaMeta, Experience from India, 1–24.
Millard, E. (1974). Plastic mulching of sugar cane. Proc S Afr Sugar Technol Assoc.
Miyagawa, S., Koyama, Y., Kokubo, M., Matsushita, Y., Adachi, Y., Sivilay, S., Kawakubo, N., et al. (2011). Indigenous utilization of termite mounds and their sustainability in a rice growing village of the central plain of Laos. Journal of Ethnobiology and Ethnomedicine, 7(1), 24. BioMed Central Ltd. doi:10.1186/1746-4269-7-24
Nandwa, S. M., Onduru, D. D., & Gachimbi, L. N. (2000). Soil fertility regeneration in Kenya. In T. Hilhorst & F. Muchena (Eds.), Nutrients on the move (pp. 1–28). London: International Institute for Environment and Development.
Narain, P., Khan, M. A., & Singh, G. (2005). Potential for water conservation and harvesting against drought in Rajasthan, India. official report, 448. IWMI.
167

Nel, M. (1995). People’s farming workbook (p. 250). Intermediate Technology.
Nissen-Petersen, E. (2006). Water from Rock Outcrops. Danida.
Nissen-Petersen, E. (2010). Harvesting from rock outcrops [online video] Available at: http://www.thewaterchannel.tv/index.php?option=com_hwdvideoshare&task=viewvideo&Itemid=4&video_id=639 [Accessed September 22]
Nissen-Petersen, E. 2006. Water from Roads. Danish International Development Assistance (Danida)
Nissen-Petersen, E. 2006. Water from small dams. Danish International Development Assistance (Danida)
Nissen-Petersen, E. 2011. Water from Roads. [online video] Available at: http://www.thewaterchannel.tv/index.php?option=com_hwdvideoshare&task=viewvideo&Itemid=4&video_id=631 [accessed October 10, 2011]
Nissen-Petersen, E., DANIDA. (2006). Water from dry riverbeds.
Nyssen, J., Veyret-Picot, M., Poesen, J., Moeyersons, J., Haile, M., Deckers, J., & Govers, G. (2004). The effectiveness of loose rock check dams for gully control in Tigray, northern Ethiopia. Soil Use and Management, 20(1), 55–64. doi:10.1079/SUM²003223
Okwakol, M. J. N., & Sekamatte, M. B. (2007). Soil macrofauna research in ecosystems in Uganda. Afr. J. Ecol., 1–7.
Onder, H., & Yilmaz, M. (2005). Underground Dams. European Water, (11/12), 35–45.
Onduru, D., & Muchena, F. (2011). Green Water Credits. Cost Benefit Analysis of Soil and Water Conservation Practices in the Upper Tana Catchment (Draft) (Draft. pp. 1–102). Wageningen.
Orendain, L.E. & Barrow, E.G.C., Soil conservation along the Lodwar-Kakuma road project. In Third national workshop. Third national workshop. Kabete.
Orodho, A. (n.d.). Tumbukiza technology: an alternative method of Napier grass production. betuco.be.
Osiru, D. (1994). Effects of mulching materials on the growth, development and yield of white yam. African Crop Science Journal.
Pace Project. Rock Catchment Rainwater Harvesting. Action Sheet 15. http://www.paceproject.net/UserFiles/File/Water/Rock%20catchment%20harvesting.pdf
Pasiecznik, N. M. (2001). The’Prosopis Juliflora’-“Prosopis Pallida”Complex: A Monograph. Coventry: HDRA.
Pieri et al. (2002). No-Till Farming for Sustainable Rural Development. Agriculture & Rural Development Working Paper
Pryor R. (2009). Switch to no-till with pivot irrigation can cut water costs $20 to $30 per acre. Study report by University of Nebraska [online] Available at: <http://www.agriculture.com/successful-farming/production/Switch-to-notill-with-pivot-irrigation-can-cut-water-costs-20-to-30-per-acre_122-ar5255> [Accessed at April 6 2012]
R.H. Hughes et al, 1992. A Directory of Africa Wetlands. IUCN, UNED, MCMC. Available at: http://ramsar.wetlands.org/ToolsforParties/WetlandDirectories/ADirectoryofAfricaWetlands/tabid/824/Default.aspx
Radovich, T., Cox, L.J., Sugano, J and T. Idol (2009). Benefits and costs of using perennial peanut as living mulch for fruit trees in Hawai ‘i. College of Tropical Agriculture and Human Resources. Soil and Crop Management.
168

RAIN, (2007). A practical guide to sand dam implementation. Water supply through local structures as adaptation to climate change.
RAIN. (2009). A practical guide to sand dam implementation (pp. 1–44). Rainwater Harvesting implementation Network.
Raju, N. J., Reddy, T. V. K., & Munirathnam, P. (2005). Subsurface dams to harvest rainwater— a case study of the Swarnamukhi River basin, Southern India. Hydrogeology Journal, 14(4), 526–531. doi:10.1007/s10040-005-0438-5
RAMAKRISHNA, A., TAM, H., WANI, S., & LONG, T. (2006). Effect of mulch on soil temperature, moisture, weed infestation and yield of groundnut in northern Vietnam. Field Crops Research, 95(2-3), 115–125. doi:10.1016/j.fcr.2005.01.030
Ramsar Convention Secretariat, 2010. Managing wetlands. Framework for managing wetlands of international importance and other wetland sites. Ramsar handbooks for the wise use of wetlands, 4th edition, vol. 18. Ramsar Convention Secretariat, Gland, Switzerland.
Ramsar Convention Secretariat, 2010. River basin management. Integrating wetland conservation and wise use into river basin management. Ramsar handbooks for the wise use of wetlands, 4th edition, vol. 9. Ramsar Convention Secretariat, Gland, Switzerland
Regional Land Management Unit (RELMA in ICRAF) / World Agroforestry Center. 2005. Water from ponds, pans and dams. A manual on planning, design, construction and maintenance. Technical handbook no. 32.
Reij, C., G. Tappan, and M. Smale. 2009. Agro-environmental transformation in the Sahel: Another kind of “Green Revolution.” IFPRI Discussion Paper. Washington, D.C.: International Food Policy Research Institute.
Reij, Chris, Mulder, P. & Begemann, L., 1991. Water harvesting for plant production, World Bank technical paper.
Richardson, L., P. Hairsine and T. Ellis (2004). Water farms: a review of physical aspects of water harvesting and runoff enhancement in rural landscapes. Technical report. Victoria, Australia. Cooperative Research Centre for Catchment Hydrology, 38 pp.
Roose, E. (1996). Land Husbandry–Components and Strategy. 70 Soils Bulletin.
Roshetko, J. M., Lasco, R. D., & Angeles, M. S. D. (2006). Smallholder Agroforestry Systems For Carbon Storage. Mitigation and Adaptation Strategies for Global Change, 12(2), 219–242. doi:10.1007/s11027-005-9010-9
Rumley, R. (2006). The right tree for a dry place. World Agroforestry Centre– ICRAF.
Russell, D., & Franzel, S. (2004). Trees of prosperity: agroforestry, markets and the African smallholder. Agroforestry systems.
Sardella, C. (2012), Evaluation of the solar still principle on run off reservoirs in Budunboto, Somalia MSc thesis. Amsterdam: Vrije Universiteit.
Savory Institute (2011). Increasing Forage & Animal Productivity: Holistic Planned Grazing.
Scherr, S. (2004). Building opportunities for small-farm agroforestry to supply domestic wood markets in developing countries. Agroforestry systems.
Sharma, P., Abrol, V., & Sharma, R. K. (2011). Impact of tillage and mulch management on economics, energy requirement and crop performance in maize. “wheat rotation in rain fed sub humid inceptisols, India. European Journal of Agronomy, 34(1), 46–51. Elsevier B.V. doi:10.1016/j.eja.2010.10.003
169

SIDA, R. (2005). Managing land. Technical Handbook No. 36.
Sivamohan, M., & Scott, C. (1993). Vetiver grass for soil and water conservation: prospects and problems. World Soil Erosion.
Smith, J., & Scherr, S.J. (2003). Capturing the Value of Forest Carbon for Local Livelihoods. World Development, 31(12), 2143–2160. doi:10.1016/j.worlddev.2003.06.011
Spate Irrigation Network (2011). Spate Irrigation in the Horn of Africa: Status and Potential. Overview Paper #2.
Spate Irrigation Network Pakistan (2010). Practical Notes #9. Drinking water ponds in spate irrigation areas.
Springate-Baginski, O., Allen, D. and Darwall, W.R.T. (eds.) 2009. An Integrated Wetland Assessment Toolkit: A guide to good practice. Gland, Switzerland: IUCN and Cambridge, UK: IUCN Species Programme. xv+144p.
Stanton, D. (2005). Roaded catchments to improve reliability of farm dams. Bulletin 4660. Government of Western Australia, Department of Agriculture, 24 pp.
Steenbergen, F. van., & Tuinhof, A. (2010). Managing the Water Buffer for Development and Climate Change Adaptation. Groundwater Recharge, Retention, Reuse and Rainwater Storage (pp. 1–98).
Steenbergen, F. van., Lawrence, P., Mehari Haile, A., Faures, J.M., and M. Salman (2011). Guidelines on spate irrigation. Rome:FAO.
Steenbergen, F. van., Tuinhof, A., & Knoop, L. (2011). Transforming landscapes, transforming lives. The business of sustainable water buffer management (pp. 1–56). Wageningen: 3R water secretariat.
Steenbergen, F. van, and A. Tuinhof. 2009. Managing the water buffer for development and climate change adaptation. Groundwater recharge, retention, reuse and rainwater storage. The Netherlands: 3R water Secretariat.
Stein, M. R. (2000). When technology fails. a manual for self-reliance & planetary survival (p. 405). Clear Light Pub.
Tal-Ya water technologies ltd. (2011). Advantages of the use of Tal Ya trays in the agricultural system.
Tarara, J. (2000). Microclimate modification with plastic mulch. HortScience.
Terer, T., & Ndiritu, G. (2004). Socio-economic values and traditional strategies of managing wetland resources in Lower Tana River, Kenya. Hydrobiologia.
Teshome, A., Adgo, E., & Mati, B. (2011). Impact of water harvesting ponds on household incomes and rural livelihoods in Minjar Shenkora district of Ethiopia. Ecohydrology and Hydrobiology, 10(2), 315–322. doi:10.2478/v10104-011-0016-5
Truong, P., & Van, T. (2008). Vetiver System Applications: A Technical Reference Manual. The Vetiver Network International.
UNEP. 2009a. Ecosystem Management Programme. A new approach to sustainability. Nairobi, United Nations Environment Program. 24 pp.
UNEP. 2009b. Water security and ecosystem services. The critical connection.A contribution to the United Nations World Water Assessment Programme. Nairobi, United Nations Environment Program. 56 pp.
UNFCCC Avoidance of methane production from biomass decay through controlled pyrolysis [online] Available at: <http://cdm.unfccc.int/filestorage/K/2/I/K2ILSQS6SP8RQ9LCE5EP3 I3PQSIEN/Draft%20for%20the%20new%20methdology.pdf?t=eHB8bHdoeWtyfDCKvyro42_mt6l836Pt1Mzy>
170
Accessed on December 20th 2011]
W, B. (2002). Protected cultivation in the Mediterranean area, 1–8.
Watershed works manual. (2006). Watershed works manual (pp. 1–320). Baba Amte Centre for People’s Empowerment Samaj Pragati Sahayog.
Whitford, B. (2008). Science: Smoking Grass. Plenty, The World In Green [online] Available at: <http://www.plenty mag.com/magazine/science_smoking_grass.php?page=2> [Accessed on December 20th 2011]
WOCAT database. [online database] Available on: http://www.fao.org/ag/agl/agll/wocat/wqtsum³.asp?questid=RSA35 [accessed on October 7, 2011]
WRMA (2009). Tana Water CATCHMENT AREA MANAGEMENT STRATEGY
Yitbarek, T., Belliethathan, S., & Fetene, M. (2010). A cost-benefit analysis of watershed rehabilitation: A case study in Farta Woreda, South Gondar, Ethiopia. Ecological Restoration.
171

172

173