Embed Size (px)
Citation preview
8/8/2019 Secunia Half Year Report 2010
http://slidepdf.com/reader/full/secunia-half-year-report-2010 1/19
Secunia Half Year Report 2010
8/8/2019 Secunia Half Year Report 2010
http://slidepdf.com/reader/full/secunia-half-year-report-2010 2/19
Letter from the CEO - An Alarming Trend for End-Users
I would like to welcome you to the rst release of the Secunia Half Year Report. In this report we look at
the evolution of the security threat posed by vulnerabilities over the last ve years, and provide an outlook
for 2010 based on the data of the rst six months of this year.
The overall conclusion is that despite considerable security investments, the software industry at large still
proves unable to produce software with substantially less vulnerabilities, highlighting the continued need
for Vulnerability Intelligence and Patch Management.
Further, the report shows an alarming development in 3rd party program vulnerabilities, representing
an increasing threat to both users and business, which, however, continues to be greatly ignored. This
trend is supported by the fact that users and businesses still perceive the operating system and Microsoft
products to be the primary attack vector, largely ignoring 3rd party programs, and nding the actions to
secure these too complex and time-consuming. Ultimately this leads to incomplete patch levels of the 3rd
party programs, representing rewarding and effective targets for criminals.
Key highlights of the Secunia Half Year Report 2010:
Since 2005, no signicant up-, or downward trend in the total number of vulnerabilities in the
more than 29,000 products covered by Secunia Vulnerability Intelligence was observed.
A group of ten vendors, including Microsoft, Apple, Oracle, IBM, Adobe, and Cisco, account on
average for 38 percent of all vulnerabilities disclosed per year.
In the two years from 2007 to 2009, the number of vulnerabilities affecting a typical end-user
PC almost doubled from 220 to 420, and based on the data of the rst six months of 2010, the
number is expected to almost double again in 2010 to 760.
During the rst six months of 2010, 380 vulnerabilities or 89% of the gures for all of 2009
has already been reached.
A typical end-user PC with 50 programs installed had 3.5 times more vulnerabilities in the 24
3rd party programs installed than in the 26 Microsoft programs installed. It is expected that
this ratio will increase to 4.4 in 2010.
In order to aid in the development of further protection mechanisms against the vulnerability threat,
Secunia is currently testing a technology, which can update a broad variety of programs from a number of
different vendors. This technology will be incorporated into the Secunia Personal Software Inspector (PSI)
2.0, which is currently undergoing a technology preview, and it is our intention that Secunia PSI with Auto
Updating will signicantly improve the security of home users’ PCs.
The Technology Preview and Beta stage is expected to take another 4-5 months, followed by the nal
release in late 2010. Vendors who are interested in securing end-users PCs are most welcome to contactSecunia for more information.
I hope you enjoying reading the report, and nd the observations and conclusions useful.
Patch and Stay Secure,
Niels Henrik Rasmussen
CEO and Founder
8/8/2019 Secunia Half Year Report 2010
http://slidepdf.com/reader/full/secunia-half-year-report-2010 3/19
Secunia Vulnerability Intelligence ................................................................................ 4
Secunia Advisories..................... ........................ ........................ ........................ ........................ ....................... .................. 4
Vulnerabilities ..................... ........................ ....................... ........................ ........................ ........................ ........................ . 5
Top-10 Vendors with the most Vulnerabilities ...................... ........................ ....................... ........................ .............. 5
Attack Vector ............................... ........................ ........................ ........................ ........................ ........................ ............. 6
Criticality ....................... ........................ ....................... ........................ ........................ ........................ ........................ ..... 7
Impact ..................... ........................ ........................ ........................ ........................ ........................ ........................ ........... 8
Security of End-User PCs............................................................................................. 9
Typical Software Portfolio & Operating System .......................................................................................................10
Contribution of 3rd Party Programs ...........................................................................................................................11
Why 3rd Party Programs? ..............................................................................................................................................12
How to reduce these Risks ...........................................................................................................................................15
Appendix ........................................................................................................................16
Vulnerability Criticality Classication ..........................................................................................................................16
Attack Vector Classication ...........................................................................................................................................17
Vulnerability Impact Classication ................................................................................................................................18
Table of Contents
8/8/2019 Secunia Half Year Report 2010
http://slidepdf.com/reader/full/secunia-half-year-report-2010 4/19
Secunia Half Year Report 2010 4
Secunia Vulnerability Intelligence
We rst provide insight into the last ve years of the security ecosystems’ development with respect
to vulnerabilities in software. Tracking vulnerabilities and the state of software security since 2002,
the Secunia Vulnerability Intelligence database contains information about more than 29,000 productsand 4,000 vendors; a valuable data-set to follow and assess the evolution of software security in an
increasingly networked environment. Secunia validates, veries, and tests the vulnerability information
gathered with consistent and standard processes, which we have continuously rened over the years.
Besides the number of vulnerabilities in a specic group of programs we also look at the evolution and
the distribution of important vulnerability aspects, such as the criticality, the impact, the attack vector,
and the availability of patches.
Vulnerability statistics covering all products are valuable to assess the state and the evolution of software,
and the security ecosystem as a whole. On the other hand, looking at a specic portfolio of products
provides insight into the risk exposure for users of the respective products. In the rst part of the report
we look at the global picture covering all vulnerabilities in all products, followed by the analysis of
vulnerabilities affecting the products and the operating system found on typical end-users PCs.
Secunia AdvisoriesWhenever a new vulnerability is reported, Secunia releases a Secunia Advisory after verifying the
information. A Secunia Advisory provides a number of details on the vulnerability, thereby providing the
information needed to make appropriate decisions about how to protect systems. The details include
a description of the vulnerability, risk rating, impact, attack vector, recommended mitigation, credits,
and references. After the rst publication, Secunia tracks the status of the vulnerability throughout
its lifecycle and updates the corresponding Secunia Advisory as new relevant information becomes
available. For example, when a vendor releases a patch for a vulnerable product, the status of the
Security Advisory is changed to “patched”. Generally, Secunia releases, or updates, a Secunia Advisory
when new information becomes available. This enables the administrator of the vulnerable software
to take appropriate action when needed. In case several vulnerabilities are released at the same time
(if these vulnerabilities affect the same product and result in one administrative action) these will be
reported in one Secunia Advisory. Likewise several Secunia Advisories are released for a vulnerability
affecting different products and requiring different administrative actions. Secunia generally does not
report vulnerabilities in beta-versions of programs.
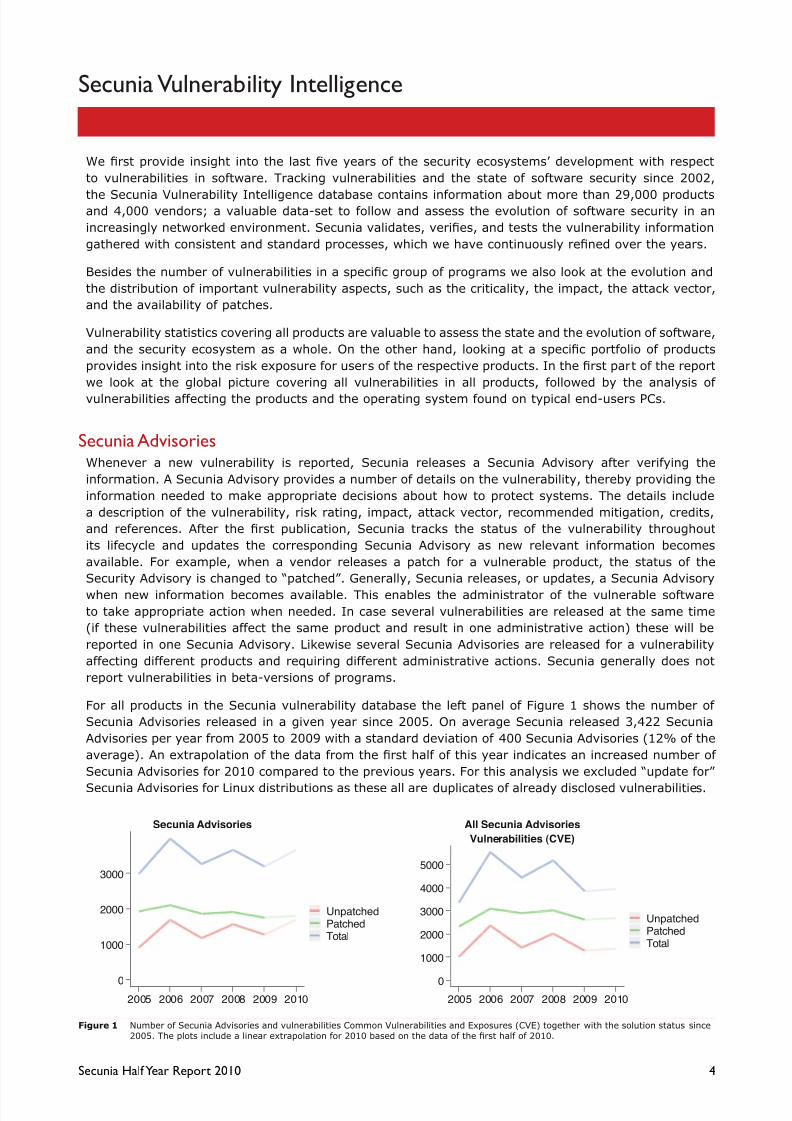
For all products in the Secunia vulnerability database the left panel of Figure 1 shows the number of
Secunia Advisories released in a given year since 2005. On average Secunia released 3,422 Secunia
Advisories per year from 2005 to 2009 with a standard deviation of 400 Secunia Advisories (12% of the
average). An extrapolation of the data from the rst half of this year indicates an increased number of
Secunia Advisories for 2010 compared to the previous years. For this analysis we excluded “update for”
Secunia Advisories for Linux distributions as these all are duplicates of already disclosed vulnerabilities.
Secunia Advisories
0
1000
2000
3000
2005 2006 2007 2008 2009 2010
UnpatchedPatchedTotal
All Secunia Advisories
Vulnerabilities (CVE)
0
1000
2000
3000
4000
5000
2005 2006 2007 2008 2009 2010
UnpatchedPatchedTotal
Number of Secunia Advisories and vulnerabilities Common Vulnerabilities and Exposures (CVE) together with the solution status since
2005. The plots include a linear extrapolation for 2010 based on the data of the rst half of 2010.
Figure 1

8/8/2019 Secunia Half Year Report 2010
http://slidepdf.com/reader/full/secunia-half-year-report-2010 5/19
Secunia Half Year Report 2010 5
VulnerabilitiesCommon Vulnerabilities and Exposures (CVE)1 is a de facto industry standard to uniquely identify
vulnerabilities which has achieved wide acceptance in the security industry. Using CVEs as vulnerability
identiers enables the correlation of information about vulnerabilities between different security products
and services. Secunia assigns CVE information in Secunia Advisories. If CVE information becomes
available after the release of a Secunia Advisory, it will be updated. The right panel of Figure 1 shows the
number of CVEs disclosed per year since 2005 with a break-down of the solution status (“unpatched”,
“patched”, “total”). On average Secunia reported 4,464
CVEs per year in the Secunia Advisories from 2005 to
2009 with a standard deviation of 904 CVEs (20% of the
average). We observe more volatility in the number of
CVEs than in the number of Secunia Advisories per year.
An extrapolation of the data of the rst half of 2010 lets us
expect 2010 to exceed the number of CVEs of 2009, but
not the average of the last ve years. It should be noted
that older vulnerabilities are more likely to have a patch
available than recently found vulnerabilities. Therefore,
the number (and the extrapolation) of unpatched CVEs
typically show an increase in the last year of the observation
period. This increase should not be mistaken as a general
trend towards decreased security, but as an artifact of the
recency of the data.
While the number of Secunia Advisories estimates vulnerability events (the number of administrative
actions needed to assess or maintain software), the number of CVEs can be used as an approximation for
the number of unique vulnerabilities affecting the products observed.
Over the last ve years the total number of CVEs and Secunia Advisories uctuates but shows no clear trend.
Thus, at a large scale the security ecosystem appears to be in a state of equilibrium, at the current rate
of CVEs, supporting that generally software vendors are still unable to release vulnerability free software.
There is therefore a continued need for effective vulnerability management, for users and administrators of
all types of software, and for software vendors in general to focus more on writing secure code.
Top-10 Vendors with the most VulnerabilitiesTo gain more insight into the security ecosystem we identify the group of the ten vendors with the most
vulnerabilities (in all their products) in any given year. Since 2005 these Top-10 vendors are responsible
for about 38% of the total vulnerabilities representing 16% of the Secunia Advisories per year. The
composition of the Top-10 group varied only slightly in this period; seven of the Top-10 vendors with the
highest vulnerability counts in 2005 are still in the Top-10 group in 2010.
The Secunia Advisory count is
a rst order approximation for thenumber of Vulnerability Events,which is the number of administra-
tive actions required to keep thespecic product secure throughouta given period of time.
Vulnerability/CVE counts area viable metric for the number of
distinct vulnerabilities found insoftware.
1 Common Vulnerabilities and Exposures (CVE), http://cve.mitre.org
Rank of Top−10 vendors with most vulnerabilities
r a n k
10
9
8
7
6
5
4
3
2
1
2005 2006 2007 2008 2009 2010
AppleOracleMicrosoftHPAdobe SystemsIBMVMwareCiscoGoogleMozilla Organization
Ranking of the Top-10 vendors with most vulnerabilities per year. Oracle includes also vulnerabilities from Sun Microsystems and BEA logic.Figure 2

8/8/2019 Secunia Half Year Report 2010
http://slidepdf.com/reader/full/secunia-half-year-report-2010 6/19
Secunia Half Year Report 2010 6
To visualize the dynamics in the Top-10 group we rst identify the ten vendors with the most vulnerabilities
in 2010 (up to June) and then plot the rank of each of these vendors for the previous ve years. The result
is visualized in Figure 2. The above graph is not an indication of the individual vendors’ security, as it is not
possible to compare the vendors based on number of vulnerabilities alone. To assess the “performance” of
vendors in terms of vulnerabilities one should rather look at the changes in the type of vulnerabilities, code
quality, handling of vulnerability reports, ability to update users, quality of patches, ability to communicate
to end users, number of products, complexity of product portfolio, and other factors which cannot be read
out of mere aggregate numbers.
Figure 2 visualizes the dynamics in the Top-10 group and indicates that popular vendors are also subject
to more scrutiny by the security community/researchers than less popular vendors; Oracle (including
Sun Microsystems and BEA Logic) ranked #1 in four out of ve years overtaken by Apple in the rst half
of 2010, with Apple consistently ranking higher than Microsoft. Despite increased investments into the
security of their products, none of the seven vendors who occupied the Top-10 group in 2005 as well as
in 2010 managed to decrease the number of vulnerabilities discovered in their products. On the contrary,
the vulnerability count of each of these seven vendors has increased to reach in 2009 between 136% and
440% of the 2005 count.
This analysis also supports the general perception that
a high market share correlates with a high number of
vulnerabilities. Apple (iTunes, Quicktime), Microsoft
(Windows, Internet Explorer), and Sun Microsystems (Java,
now part of Oracle) consistently occupy the top ranks during
the last ve years, with Adobe (Acrobat Reader, Flash)
joining the group in 2008. The ranking shown in Figure 2 does not indicate the actual security (or lack
thereof) in the different vendors products; it rather shows that vulnerabilities continue to be discovered
in signicant numbers in products from even the largest and most popular vendors including those who
spend signicant resources on improving the security of their products.
Attack VectorThe attack vector describes the way an attacker can trigger or reach the vulnerability in a product. Secunia
classies the attack vector as either “Local system”, “Local network”, or “From remote”. The classication
of the three attack vectors together with a description of how they are used in Secunia Advisories is listed
in the Appendix of this report. Figure 3 plots a breakdown by attack vector as a percentage of the total
number of Secunia Advisories by year. We observe that “From remote” is consistently and by far the most
prevalent attack vector (81% in average), compared to “Local system” with 9.8% and “Local network”
with 8.2% in average over the last ve years. Thus, most of the vulnerabilities expose the user of the
software to remote attacks. Based on the data available by mid 2010 we do not expect a change by the
end of the year.
On average, 10 vendors are re-sponsible for 38% of the vulner-abilities per year.
All Secunia Advisories
Attack Vector (% Advisories)
0
20
40
60
80
100
2005 2006 2007 2008 2009 2010
From remoteLocal networkLocal system
All Secunia Advisories
Attack Vector (% Advisories)
0
20
40
60
80
100
200520062007200820092010
From remoteLocal networkLocal system
Percentage of Secunia Advisories per year for each attack vector from 2005 to 2009, with a linear extrapolation for 2010.Figure 3

8/8/2019 Secunia Half Year Report 2010
http://slidepdf.com/reader/full/secunia-half-year-report-2010 7/19
Secunia Half Year Report 2010 7
CriticalitySecunia rates the criticality of vulnerabilities on a ve level criticality scale, ranging from “Not critical” to
“Extremely critical”. The criticality of a vulnerability is based on Secunia’s assessment of the vulnerability’s
potential impact on a system, the attack vector, mitigating factors, and if an exploit exists for the
vulnerability prior to release of a patch. In the Appendix of this report we list the criticality classication
together with a description of how they are used to rate the risk of a vulnerability. Figure 4 shows that
from 2005 to 2009 more than 50% of the vulnerabilities were rated highly or moderately critical, while
33% were rated less critical, and only very few as extremely critical (0.2%). The distribution of the risk
ratings has not changed substantially over the last years, and it clearly depends on the mix of products
being looked at. Figure 4 analyzes the criticality distribution over all products. The same methodology
can be applied to a specic group of products to provide an accurate picture of the risk prole due to
vulnerabilities in these products.
All Secunia Advisories
Criticality (% Advisories)
0
20
40
60
80
100
2005 2006 2007 2008 2009 2010
ExtremeHighModerateLowNot critical
All Secunia Advisories
Criticality (% Advisories)
0
20
40
60
80
100
2005 2006 2007 2008 2009 2010
ExtremeHighModerateLowNot critical
Risk classication as percentage of all vulnerabilities in all products per year from 2005 to 2009, with a linear extrapolation for 2010.Figure 4
8/8/2019 Secunia Half Year Report 2010
http://slidepdf.com/reader/full/secunia-half-year-report-2010 8/19
Secunia Half Year Report 2010 8
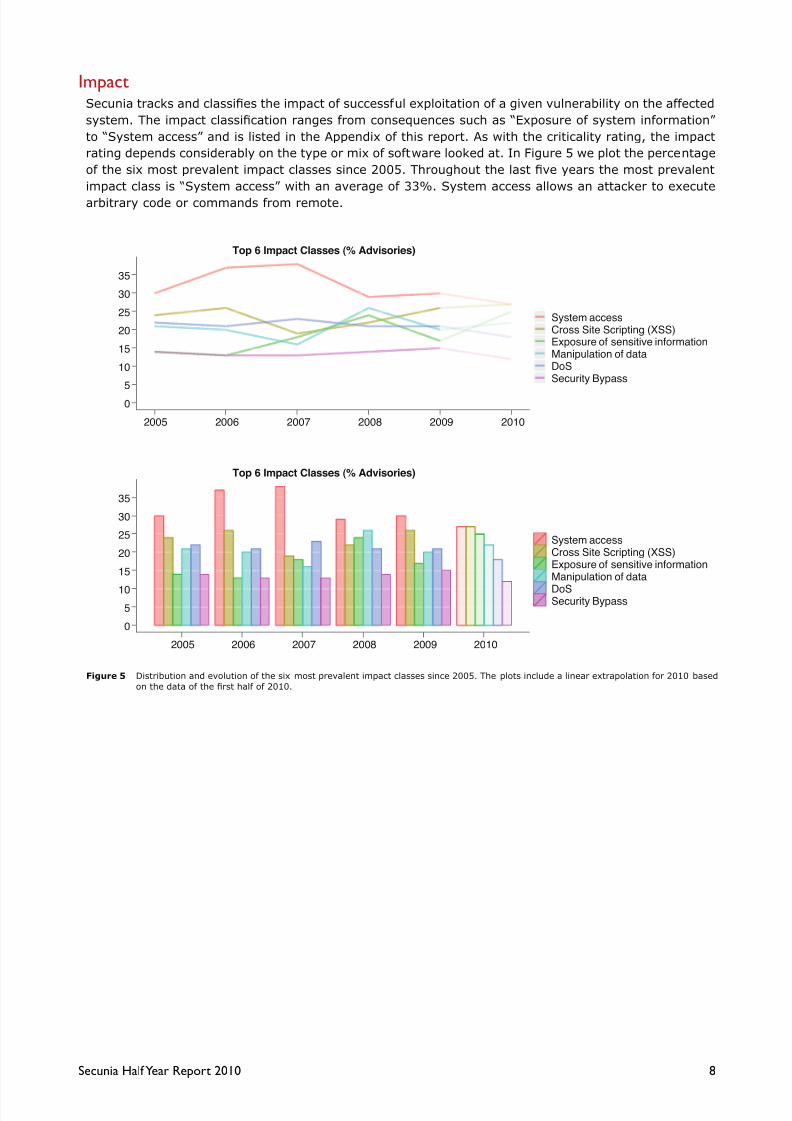
ImpactSecunia tracks and classies the impact of successful exploitation of a given vulnerability on the affected
system. The impact classication ranges from consequences such as “Exposure of system information”
to “System access” and is listed in the Appendix of this report. As with the criticality rating, the impact
rating depends considerably on the type or mix of software looked at. In Figure 5 we plot the percentage
of the six most prevalent impact classes since 2005. Throughout the last ve years the most prevalent
impact class is “System access” with an average of 33%. System access allows an attacker to execute
arbitrary code or commands from remote.
Distribution and evolution of the six most prevalent impact classes since 2005. The plots include a linear extrapolation for 2010 based
on the data of the rst half of 2010.
Figure 5
Top 6 Impact Classes (% Advisories)
0
5
10
15
20
25
30
35
2005 2006 2007 2008 2009 2010
System accessCross Site Scripting (XSS)Exposure of sensitive informationManipulation of dataDoSSecurity Bypass
Top 6 Impact Classes (% Advisories)
0
5
10
15
20
25
30
35
2005 2006 2007 2008 2009 2010
System accessCross Site Scripting (XSS)Exposure of sensitive informationManipulation of data
DoSSecurity Bypass

8/8/2019 Secunia Half Year Report 2010
http://slidepdf.com/reader/full/secunia-half-year-report-2010 9/19
Secunia Half Year Report 2010 9
Security of End-User PCs
In the previous section we looked at all vulnerabilities.
However, to get a better understanding of the risk that
most Internet users face, we now focus our analysis onproducts typically found on end-user PCs, and consider only
vulnerabilities found in these products.
The variety and prevalence of programs found on typical
end-user PCs, paired with the unpredictable usage patterns
of users, makes end-user PCs an attractive attack vector.
Vulnerabilities on end-user PCs are commonly exploited
when the user of the vulnerable computer visits a malicious
Web site (with content controlled or injected by an attacker),
or opens data, les, or documents, with one of the numerous
programs and plug-ins installed on his/her PC. Recent
research revealed that typically 50% of the users are found
to have more than 66 programs from more than 22 different
vendors installed2. To assess the associated risk we identify
the Top-50 most prevalent programs on typical end-user
PCs based on empirical data from users frequently scanning
their PCs with Secunia Personal Software Inspector (PSI)3.
Secunia PSI is a free program to check all programs found
on a system for missing security related patches, and old
versions (end-of-life programs). Secunia PSI works by
examining les on the user’s PC (primarily .exe, .dll, and
.ocx les). After examining all relevant les on local hard
drive(s), the collected data is matched against Secunia’sle signatures engine to determine the exact version of
the programs installed. Secunia PSI data provides accurate
information on the installation base of the users’ PC - that
is, the user’s software portfolio. We identied the group of
the Top-50 most prevalent programs by looking at all PSI
scans in May 2010. This group represents a typical users’
software portfolio and contains programs from 14 different
vendors, of which 26 programs are from Microsoft and 24
programs from 3rd party vendors. The user share of the
most prevalent program in this Top-50 group is equal to 100% (Microsoft Internet Explorer), whereas
the share of the least prevalent program in this group is 24% (PowerDVD from Cyberlink). Thus,
the Top-50 group only contains programs with a market share of at least a 24% across all PSI users
supporting the relevance of the choice of the Top-50 programs.
Secunia PSI is a free security
tool designed to detect vulner-able and out-dated programs andplug-ins which expose your PC to
attacks. Since 2007 more than 2.5million users installed SecuniaPSI to help protect their PCs
The Top-50 Software Portfolio
comprises the 50 most prevalentprograms found on typical end-user systems. It consists of 26
Microsoft and 24 non-Microsoft(3rd party) programs from a totalof 14 different vendors (including
Microsoft).
Typically, 50% of the users
are found to have more than 66programs from more than 22 dif-ferent vendors installed.
2 Secunia Paper: “The Security Exposure of Software Portfolios”
http://secunia.com/gfx/pdf/Secunia_RSA_Software_Portfolio_Security_Exposure.pdf
3 Secunia PSI, http://secunia.com/vulnerability_scanning/personal
8/8/2019 Secunia Half Year Report 2010
http://slidepdf.com/reader/full/secunia-half-year-report-2010 10/19
Secunia Half Year Report 2010 10
Typical Software Portfolio & Operating SystemWe rst examine the number of vulnerabilities of this Top-50 software portfolio together with the
operating system, namely Windows XP and Windows Vista. Windows 7, released in October 2009, is
excluded as we have no full year of data yet. In Figure 6 we plot the combined number of vulnerabilities
of the Top-50 portfolio including the vulnerabilities of the operating system Windows XP. Accordingly,
Figure 7 shows the Top-50 portfolio together with Windows Vista.
Since 2007 the combined number of vulnerabilities (Top-50 portfolio and operating system) increased
progressively from about 220 and almost doubled to 420 by 2009. During the rst 6 months of 2010
we already reached 380 vulnerabilities, or 89% of the gures for the entire 2009. If we extrapolate the
number of vulnerabilities discovered in the 1st half of 2010 for the 2nd half we will reach approximately
760 vulnerabilities for the whole of 2010.
Looking at a typical end-users Top-50 software portfolio we
nd that the choice of operating system only has a marginal
affect on the total number of vulnerabilities the user is
exposed to (a difference of less than 2% since 2008).
Despite the small difference in the aggregate number of
vulnerabilities for the software portfolio due to the operating
system, it is important to remember that Windows Vista
and Windows 7 offer many security features not present
in Windows XP4. In Figure 8 we analyze the criticality of
the vulnerabilities of the Top-50 portfolio together with the
respective operating system. We nd that on average 50%
of Secunia Advisories are rated as highly critical, and 7.6%are rated as extremely critical, whereas in Figure 4 (covering
all products) we only nd an average of 0.2% extremely
critical Secunia Advisories. This supports the trend towards
the increased security threat facing the typical users. The
observed continued increase in the number of vulnerabilities
of a typical user PC, paired with the high criticality rating of
most vulnerabilities, indicates a substantial increase of the
end-users risk since 2007.
Top-50 programs & OS
From 2007 to 2009 vulnerabilitiesin a typical end-user PC almost
doubled from about 220 to 420.
If we extrapolate the number of
vulnerabilities discovered in the1st half of 2010 for the 2nd half we will reach in the neighborhood
of 760 vulnerabilities in 2010.
During the rst 6 months of 2010
we already reached 380 vulner-abilities or 89% of the gures forthe entire 2009.
4 Secunia Paper: “DEP/ASLR Implementation Progress in Popular Third-party Windows Applications”
http://secunia.com/gfx/pdf/DEP_ASLR_2010_paper.pdf
Top−50 & Windows XP
Vulnerabilities (CVE)
0
100
200
300
400
500
600
700
2005 2006 2007 2008 2009 2010
UnpatchedPatchedTotal
Top−50 & Windows Vista
Vulnerabilities (CVE)
0
100
200
300
400
500
600
700
2005 2006 2007 2008 2009 2010
UnpatchedPatchedTotal
Vulnerabilities per year of Windows XP including the
Top-50 most prevalent programs.
Vulnerabilities per year of Windows Vista including the
Top-50 most prevalent programs. Before 2007 this plot
only shows Top-50 vulnerabilities as Windows Vista
was released in the end of 2006
Figure 6 Figure 7

8/8/2019 Secunia Half Year Report 2010
http://slidepdf.com/reader/full/secunia-half-year-report-2010 11/19
Secunia Half Year Report 2010 11
Software deployed requires constant attention due to the continued discovery of new vulnerabilities and
release of patches. Upon the disclosure of a vulnerability, or the release of a patch, the administrator
(or user) must assess the risk involved, and in the case of a patch plan and schedule its deployment.In order to estimate the attention needed to keep specic products up-to-date we use the number of
Secunia Advisories as an approximation for the number of vulnerability events in a given period of time.
Vulnerability events per year are provided in Table 1 (see Page 12).
Contribution of 3rd Party ProgramsInterestingly, since 2005 we nd a signicant rise in the number of vulnerabilities of the Top-50
software portfolio while no trend is identied in the global vulnerability data presented in Figure 1. To
better understand the dynamics in the Top-50 portfolio we plot a breakdown of the Top-50 portfolio by
vulnerability contributions from (A) the Operating System, (B) Microsoft programs, and (C) from 3rd
party (non-Microsoft) programs. In Figure 9 we show the result for Windows XP (left) and Windows Vista
(right). This analysis clearly identies vulnerabilities from 3rd party programs to be almost exclusivelyresponsible for the increasing trend observed since 2007. Data from the rst half of 2010 shows that
3rd party program vulnerabilities are the primary risk factor for typical end-user PCs.
Selected values from Figure 9 together with the number of vulnerability events are summarized in Table 1.
A detailed view is given in Table 2 with a breakdown by operating system and both Microsoft and 3rd party
programs of the Top-50 software portfolio.
Top−50 & Windows XP
Criticality (% Advisories)
0
20
40
60
80
100
2005 2006 2007 2008 2009 2010
ExtremeHigh
ModerateLowNot critical
Top−50 & Windows Vista
Criticality (% Advisories)
0
20
40
60
80
100
2005 2006 2007 2008 2009 2010
ExtremeHigh
ModerateLowNot critical
Criticality rating of the Top-50 portfolio with Windows XP (left) and Windows Vista (right)Figure 8
Top−50 3rd party vs. WinXP (CVE)
0
100
200
300
400
500
2005 2006 2007 2008 2009 2010
3rd party prog.Microsoft prog.
Windows XP
Top−50 3rd party vs. WinVista (CVE)
0
100
200
300
400
500
2005 2006 2007 2008 2009 2010
3rd party prog.Microsoft prog.
Windows Vista
Breakdown of the Top-50 portfolio vulnerabilities into Operating System, Microsoft-, and 3rd party (not from Microsoft) programs.Figure 9

8/8/2019 Secunia Half Year Report 2010
http://slidepdf.com/reader/full/secunia-half-year-report-2010 12/19
Secunia Half Year Report 2010 12
Why 3rd Party Programs?In recent years there has been an increased focus on 3rd party programs by vulnerability researchers
and by criminals. In our opinion this is a natural development; a decade ago the primary focus for
research and exploitation was in services, especially typical Internet facing services, this changed to
include services that ideally should not be exposed to the Internet, such as Windows le sharing.
However, as vendors started to take notice of the cyber risks, and administrators learned that rewalls
(personal as well as perimeter rewalls) were necessary to lter out the most obvious unwanted trafc,
we also saw a change in focus from both researchers and criminals towards the most popular products
from Microsoft, ranging from the operating system, to the browser, and ofce products. In response
to this, Microsoft has enabled most users and even businesses to update their PCs with patches in a
timely manner; pushing and enabling Windows Update and promoting Windows Service Update Services
(WSUS) to businesses for free. This has lead to a very small “window of opportunity” for criminals to
actively exploit vulnerabilities in Microsoft products, because many users are updated fairly rapidly.
Today we are facing a much more challenging and complicated problem that is likely to take years to
solve; patching of 3rd party software. Looking at the Top-50 programs installed by Secunia PSI users we
see that the programs come from 14 different vendors, it is also worth considering that all the programs
covered by Secunia PSI is spanning a total of 3,000 vendors. Only recently have we seen signicant
initiatives from Adobe, the most prevalent “3rd party” vendor due to Adobe Flash Player and Adobe
Reader, to start updating all their users in a more efcient and rapid manner than earlier. This seems to
be a response to the increased exploitation of Adobe Reader vulnerabilities in 2009.
Selected values from Figure 6 and Figure 7 together with the number of vulnerability events, including 2010 year-
to-date (YTD) value and the trend to end of the year
Number of vulnerabilities and vulnerability events from Table 1 including breakdown by operating system,
Microsoft and 3rd party programs.
Table 1
Table 2
Vulnerabilities (unique CVEs)
2007 2008 2009 YTD 2010 trend 2010
Top-50 & Windows XP 225 341 426 380 760
Top-50 & Windows Vista 213 339 413 373 746
Vulnerabilities - Breakdown
2007 2008 2009 YTD 2010 trend 2010
Windows XP 39 55 72 47 94
Windows Vista 25 49 58 39 78
Microsoft programs 79 89 85 62 1243rd party programs 120 207 286 275 550
Vulnerability Events - Breakdown
2007 2008 2009 YTD 2010 trend 2010
Windows XP 31 33 35 27 54
Windows Vista 18 30 28 19 38
Microsoft programs 40 35 27 18 36
3rd party programs 43 42 51 32 64
Vulnerability Events (Secunia Advisories)
2007 2008 2009 YTD 2010 trend 2010
Top-50 & Windows XP 106 107 110 75 150
Top-50 & Windows Vista 95 105 104 67 134

8/8/2019 Secunia Half Year Report 2010
http://slidepdf.com/reader/full/secunia-half-year-report-2010 13/19
Secunia Half Year Report 2010 13
The number of vendors who are deploying and promoting effective updating mechanisms is quite limited,
it includes Microsoft, Google, Mozilla Foundation, Adobe, and possibly a few more, but the overall picture
of all vendors, including most of the more popular vendors, is that updating of the programs on end-userPCs is largely neglected and left to the end-user.
It appears that most vendors do not take signicant steps to secure their users and customers before
active exploitation takes place on a larger scale where it starts to threaten the overall reputation of the
business. The lack of effective updating mechanisms expose end-users to signicant risks as vulnerable
software tends to “survive” for a long time before being updated for other reasons than security, thus
leaving the user exposed for prolonged periods of time and providing criminals ample time to exploit
the vulnerabilities.5
Further, the typical users are either unaware, or simply overwhelmed by the complexity and frequency
of the actions required to keep the dozens of 3rd party programs found on a typical end-user system
secure. To keep the Top-50 software portfolio fully patched the user can patch the operating system
and 26 Microsoft programs with one easy to use auto-update mechanism. To patch the remaining 243rd party programs from 13 different vendors typically requires managing another 13 or more different
update mechanisms.
In other words, the user has one auto-update mechanism to patch 48% of the programs that make up
35% of the vulnerabilities in 2009 and another 13 or more update mechanisms to patch 52% of the
programs that make up 65% of the vulnerabilities.
It is therefore a safe guess that users will hardly update all their 3rd party programs in a timely fashion,
supported by the overall reasons of:
User’s and businesses alike still perceive the operating system and Microsoft products to be the
primary attack vector, largely ignoring 3rd party programs.
Many 3rd party programs lack a noteworthy and easy to use update mechanism.
The frequency and complexity of managing a large number of different update mechanisms will
almost certainly lead to incomplete patch levels at large.
General lack of awareness among users and
professionals about the consequences of having
vulnerable programs installed.
From an attacker’s perspective, targeting 3rd party programs
proves to be a rewarding path, and will probably remain so for
an extended period of time. Few vendors like Microsoft have
the nancial resources and expertise to consistently makethe exploitation of their software harder, and to implement a
Typically, a user can patch 35% of the vulnerabilities with one
update mechanism (Microsoft’s),and needs to master another 13or more different update-mech-
anisms to patch 65% of the 3rd
party program vulnerabilities.
5 Paper: “Why Silent Updates Boost Security” http://www.techzoom.net/papers/browser_silent_updates_2009.pdf
Top−50 3rd party vs. WinOS (CVE)
0
100
200
300
400
500
2005 2006 2007 2008 2009 2010
3rd party prog.Microsoft prog.Windows XPWindows Vista
Breakdown of the Top-50 portfolio vulnerabilities into contributions from 3rd party (not from Microsoft) programs, Microsoft
programs and the operating system (Windows XP or Windows Vista).
Figure 10
8/8/2019 Secunia Half Year Report 2010
http://slidepdf.com/reader/full/secunia-half-year-report-2010 14/19
Secunia Half Year Report 2010 14
formidable “seamless” and easy to use auto-update mechanism to effectively relieve the users from the
complexities of keeping their software up-to-date. Further, as the number of vulnerability events and the
complexity of the task increase, cyber-criminals are provided a larger number of unpatched targets.
Therefore, focusing on 3rd party program exploitation will continue to provide attackers with a large
pool of commonly used software that is easier to exploit6, and much less likely to be found fully patched.
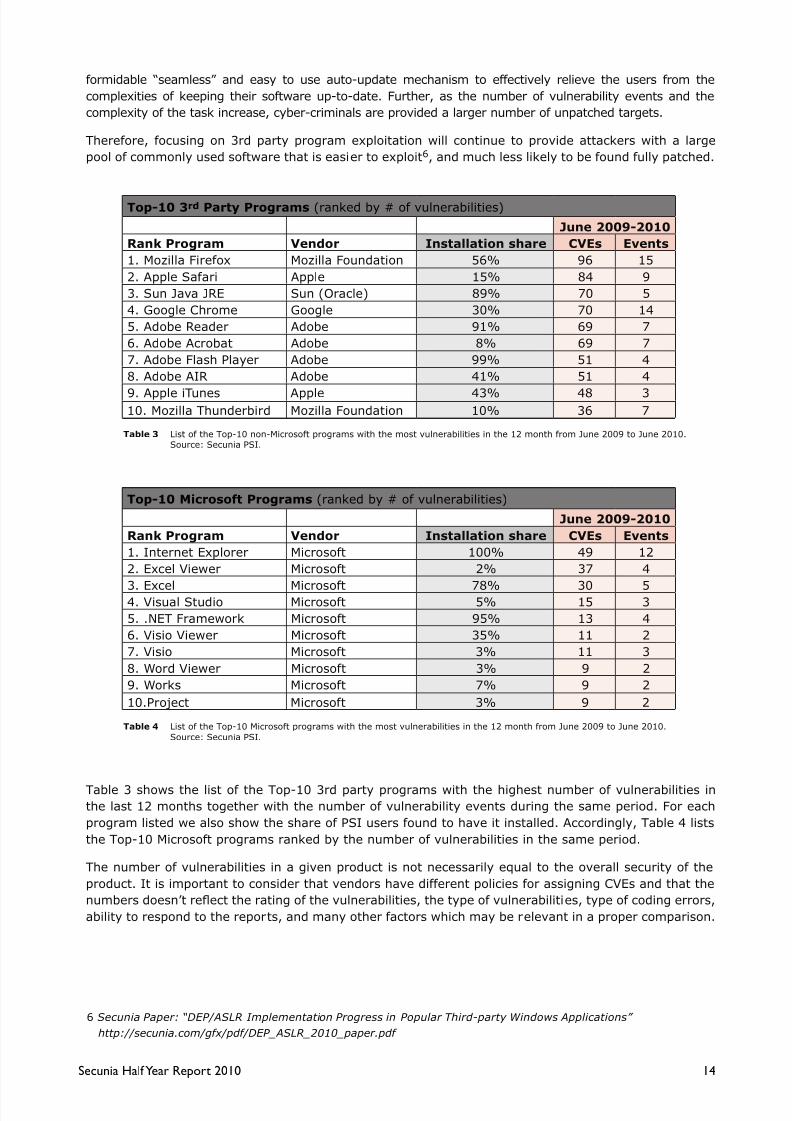
Table 3 shows the list of the Top-10 3rd party programs with the highest number of vulnerabilities in
the last 12 months together with the number of vulnerability events during the same period. For each
program listed we also show the share of PSI users found to have it installed. Accordingly, Table 4 lists
the Top-10 Microsoft programs ranked by the number of vulnerabilities in the same period.
The number of vulnerabilities in a given product is not necessarily equal to the overall security of the
product. It is important to consider that vendors have different policies for assigning CVEs and that the
numbers doesn’t reect the rating of the vulnerabilities, the type of vulnerabilities, type of coding errors,
ability to respond to the reports, and many other factors which may be relevant in a proper comparison.
6 Secunia Paper: “DEP/ASLR Implementation Progress in Popular Third-party Windows Applications”
http://secunia.com/gfx/pdf/DEP_ASLR_2010_paper.pdf
List of the Top-10 non-Microsoft programs with the most vulnerabilities in the 12 month from June 2009 to June 2010.
Source: Secunia PSI.
Table 3
List of the Top-10 Microsoft programs with the most vulnerabilities in the 12 month from June 2009 to June 2010.
Source: Secunia PSI.
Table 4
Top-10 3rd Party Programs (ranked by # of vulnerabilities)
June 2009-2010
Rank Program Vendor Installation share CVEs Events
1. Mozilla Firefox Mozilla Foundation 56% 96 15
2. Apple Safari Apple 15% 84 9
3. Sun Java JRE Sun (Oracle) 89% 70 5
4. Google Chrome Google 30% 70 14
5. Adobe Reader Adobe 91% 69 7
6. Adobe Acrobat Adobe 8% 69 7
7. Adobe Flash Player Adobe 99% 51 4
8. Adobe AIR Adobe 41% 51 4
9. Apple iTunes Apple 43% 48 310. Mozilla Thunderbird Mozilla Foundation 10% 36 7
Top-10 Microsoft Programs (ranked by # of vulnerabilities)
June 2009-2010
Rank Program Vendor Installation share CVEs Events
1. Internet Explorer Microsoft 100% 49 12
2. Excel Viewer Microsoft 2% 37 4
3. Excel Microsoft 78% 30 54. Visual Studio Microsoft 5% 15 3
5. .NET Framework Microsoft 95% 13 4
6. Visio Viewer Microsoft 35% 11 2
7. Visio Microsoft 3% 11 3
8. Word Viewer Microsoft 3% 9 2
9. Works Microsoft 7% 9 2
10.Project Microsoft 3% 9 2

8/8/2019 Secunia Half Year Report 2010
http://slidepdf.com/reader/full/secunia-half-year-report-2010 15/19
8/8/2019 Secunia Half Year Report 2010
http://slidepdf.com/reader/full/secunia-half-year-report-2010 16/19
Secunia Half Year Report 2010 16
Appendix
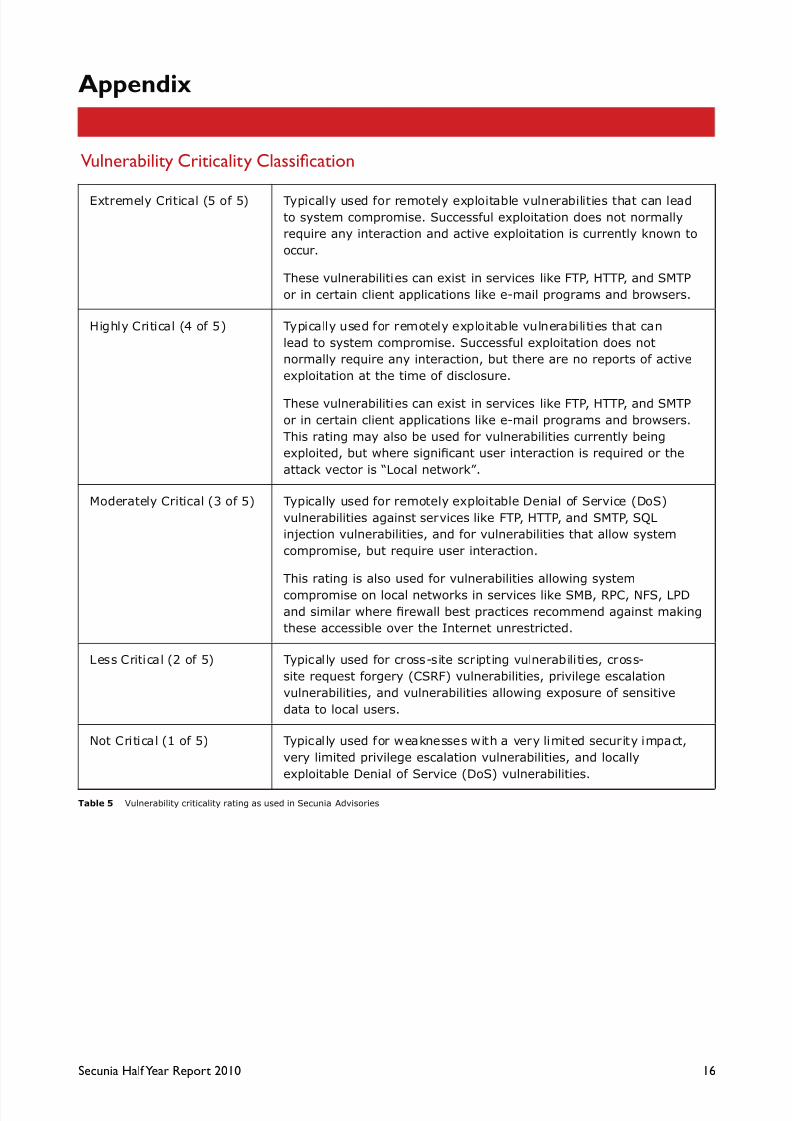
Vulnerability Criticality Classication
Extremely Critical (5 of 5) Typically used for remotely exploitable vulnerabilities that can lead
to system compromise. Successful exploitation does not normally
require any interaction and active exploitation is currently known to
occur.
These vulnerabilities can exist in services like FTP, HTTP, and SMTP
or in certain client applications like e-mail programs and browsers.
Highly Critical (4 of 5) Typically used for remotely exploitable vulnerabilities that can
lead to system compromise. Successful exploitation does not
normally require any interaction, but there are no reports of active
exploitation at the time of disclosure.
These vulnerabilities can exist in services like FTP, HTTP, and SMTP
or in certain client applications like e-mail programs and browsers.
This rating may also be used for vulnerabilities currently being
exploited, but where signicant user interaction is required or the
attack vector is “Local network”.
Moderately Critical (3 of 5) Typically used for remotely exploitable Denial of Service (DoS)
vulnerabilities against services like FTP, HTTP, and SMTP, SQL
injection vulnerabilities, and for vulnerabilities that allow system
compromise, but require user interaction.
This rating is also used for vulnerabilities allowing system
compromise on local networks in services like SMB, RPC, NFS, LPD
and similar where rewall best practices recommend against making
these accessible over the Internet unrestricted.
Less Critical (2 of 5) Typically used for cross-site scripting vulnerabilities, cross-
site request forgery (CSRF) vulnerabilities, privilege escalation
vulnerabilities, and vulnerabilities allowing exposure of sensitive
data to local users.
Not Critical (1 of 5) Typically used for weaknesses with a very limited security impact,
very limited privilege escalation vulnerabilities, and locally
exploitable Denial of Service (DoS) vulnerabilities.
Vulnerability criticality rating as used in Secunia AdvisoriesTable 5
8/8/2019 Secunia Half Year Report 2010
http://slidepdf.com/reader/full/secunia-half-year-report-2010 17/19
Secunia Half Year Report 2010 17
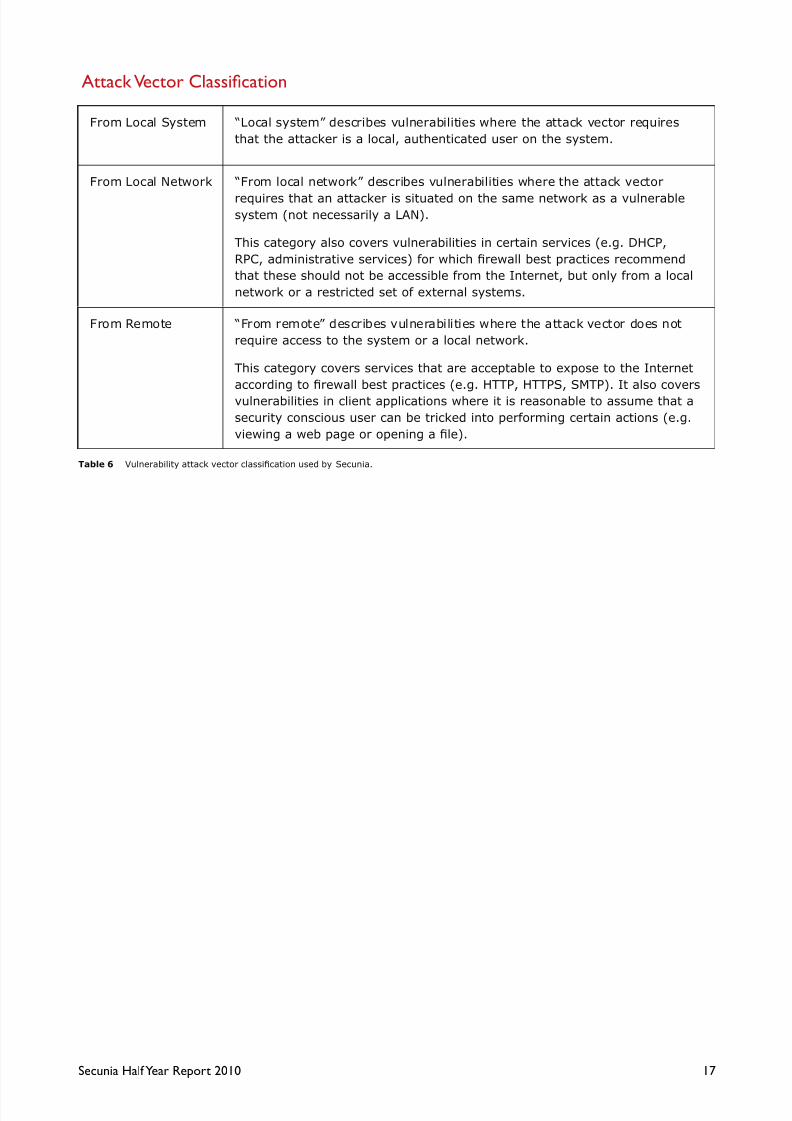
Attack Vector Classication
From Local System “Local system” describes vulnerabilities where the attack vector requires
that the attacker is a local, authenticated user on the system.
From Local Network “From local network” describes vulnerabilities where the attack vector
requires that an attacker is situated on the same network as a vulnerablesystem (not necessarily a LAN).
This category also covers vulnerabilities in certain services (e.g. DHCP,
RPC, administrative services) for which rewall best practices recommend
that these should not be accessible from the Internet, but only from a local
network or a restricted set of external systems.
From Remote “From remote” describes vulnerabilities where the attack vector does not
require access to the system or a local network.
This category covers services that are acceptable to expose to the Internet
according to rewall best practices (e.g. HTTP, HTTPS, SMTP). It also covers
vulnerabilities in client applications where it is reasonable to assume that a
security conscious user can be tricked into performing certain actions (e.g.
viewing a web page or opening a le).
Vulnerability attack vector classication used by Secunia.Table 6
8/8/2019 Secunia Half Year Report 2010
http://slidepdf.com/reader/full/secunia-half-year-report-2010 18/19
18
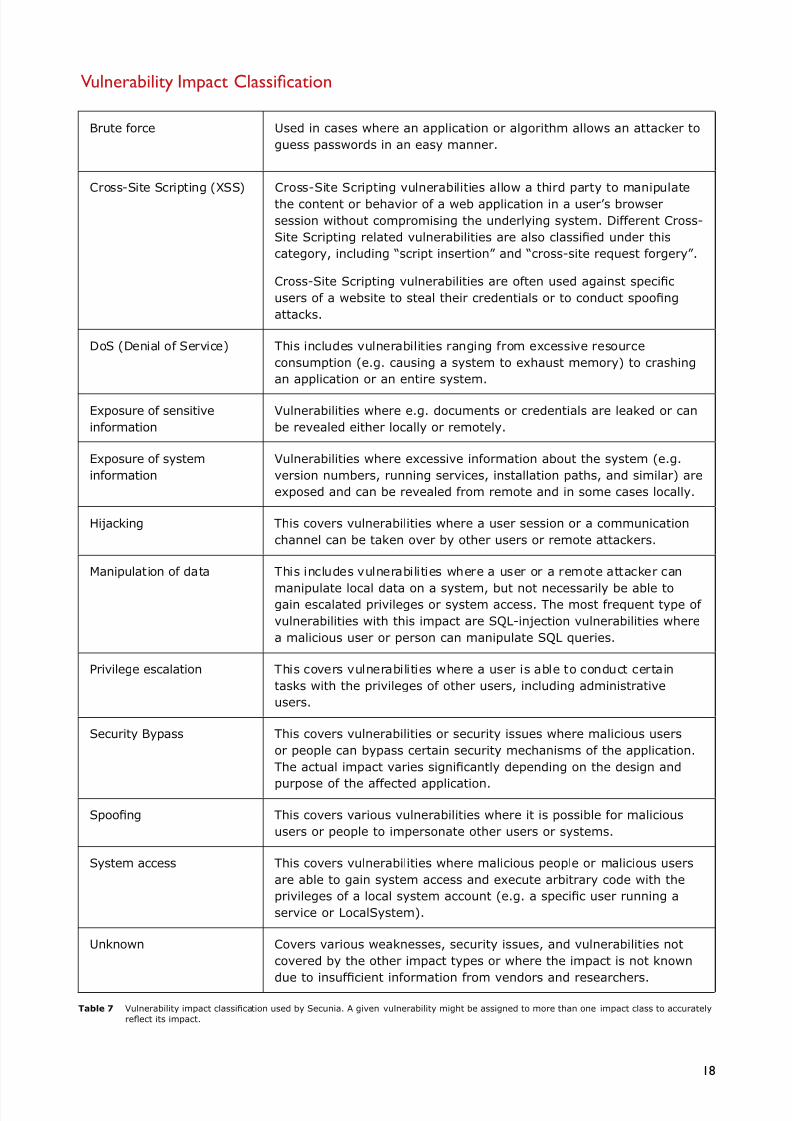
Vulnerability Impact Classication
Brute force Used in cases where an application or algorithm allows an attacker to
guess passwords in an easy manner.
Cross-Site Scripting (XSS) Cross-Site Scripting vulnerabilities allow a third party to manipulate
the content or behavior of a web application in a user’s browser
session without compromising the underlying system. Different Cross-
Site Scripting related vulnerabilities are also classied under this
category, including “script insertion” and “cross-site request forgery”.
Cross-Site Scripting vulnerabilities are often used against specic
users of a website to steal their credentials or to conduct spoong
attacks.
DoS (Denial of Service) This includes vulnerabilities ranging from excessive resource
consumption (e.g. causing a system to exhaust memory) to crashing
an application or an entire system.
Exposure of sensitive
information
Vulnerabilities where e.g. documents or credentials are leaked or can
be revealed either locally or remotely.
Exposure of system
information
Vulnerabilities where excessive information about the system (e.g.
version numbers, running services, installation paths, and similar) are
exposed and can be revealed from remote and in some cases locally.
Hijacking This covers vulnerabilities where a user session or a communication
channel can be taken over by other users or remote attackers.
Manipulation of data This includes vulnerabilities where a user or a remote attacker can
manipulate local data on a system, but not necessarily be able togain escalated privileges or system access. The most frequent type of
vulnerabilities with this impact are SQL-injection vulnerabilities where
a malicious user or person can manipulate SQL queries.
Privilege escalation This covers vulnerabilities where a user is able to conduct certain
tasks with the privileges of other users, including administrative
users.
Security Bypass This covers vulnerabilities or security issues where malicious users
or people can bypass certain security mechanisms of the application.
The actual impact varies signicantly depending on the design and
purpose of the affected application.
Spoong This covers various vulnerabilities where it is possible for malicious
users or people to impersonate other users or systems.
System access This covers vulnerabilities where malicious people or malicious users
are able to gain system access and execute arbitrary code with the
privileges of a local system account (e.g. a specic user running a
service or LocalSystem).
Unknown Covers various weaknesses, security issues, and vulnerabilities not
covered by the other impact types or where the impact is not known
due to insufcient information from vendors and researchers.
Vulnerability impact classication used by Secunia. A given vulnerability might be assigned to more than one impact class to accurately
reect its impact.
Table 7
8/8/2019 Secunia Half Year Report 2010
http://slidepdf.com/reader/full/secunia-half-year-report-2010 19/19