Embed Size (px)
Citation preview

SECTOR UPDATE 27 DEC 2017
FMCG Sector Review
HDFC securities Institutional Research is also available on Bloomberg HSLB <GO>& Thomson Reuters
Poised for mean reversion FMCG sector has posted its slowest revenue growth at 4% CAGR in the last two years as compared to 13% CAGR in the last decade. The rural market has already had its share of challenges i.e. deficient monsoon in FY15 and FY16, low wage growth etc. It was further bruised with unprecedented events like demonet and GST. This led consumption growth dropping to its lowest in the last decade.
Majority of the macro indicators (rural wage, agricultural growth, MSP rates, job creation and RBI’s Consumer Confidence Index) are still not
reflecting meaningful recovery. However, we believe that most indicators are at their inflexion point, and the govt. would shift its focus from stabilising the economy (controlling inflation, curbing black money, and stabilising currency) to accelerating GDP growth rate in the run-up to the 2019 elections.
FMCG companies across the board posted healthy revenue growth post GST implementation. We anticipate that the sector still has significant scope of mean reversion (link) towards its 10-year historical average revenue growth i.e. 13% vs. 4% in 1HFY18.
A majority of trade channels (including wholesale and CSD) have begun to normalise post the shock of GST implementation. Modern trade and E-commerce will continue to grab share from general trade, leading to better traction in the urban market.
Most companies are witnessing green shoots in the rural market, and expect that the govt.’s focus on improving rural income will help sustain healthy growth. Hence, companies with a higher exposure to rural markets will surprise growth rates on the upside.
Over the last 10 years, FMCG companies have expanded gross margins by ~350bps, while EBITDA margins expanded by ~450bps. Pricing power, supply chain efficiency and cost optimisation have resulted in EBITDA margin expansion for the sector during the last 10 years (link). We further anticipate improvement in EBITDA margins by ~150bps over FY17-20E, led by higher revenue growth, improving share of the premium segment, GST-driven process efficiencies and continued focus on cost optimisation.
We have grouped companies’ performance based on their respective categories to compare like-to-like performance. We also computed weighted average growth (based on revenue) for each category. We observed that even during turbulent market conditions (LTM) categories like F&B, QSR, Home Care, Cigarettes and Personal Care grew at 5-8%. Whereas laggards like Oral Care, Hair Care and OTC FMCG grew at 0-1% (link).
We believe that the sector is well poised for earnings acceleration, and that would sustain rich valuations.
Our Top Picks: Based on the return potential, our pecking order is - ITC, Marico, Dabur, Jubilant FoodWorks, HUL, Britannia and Emami.
Company MCap
(Rs bn) CMP (Rs)
Reco. TP
(Rs)
ITC 3,007 264 BUY 358
HUL 2,915 1,347 BUY 1,514
Dabur 622 353 BUY 406
Britannia 568 4,734 BUY 5,312
Marico 410 318 BUY 370
Colgate 294 1,082 NEU 1,118
Emami 298 1,294 BUY 1,445
Jub. Food 117 1,781 BUY 2,010
Naveen Trivedi [email protected] +91-22-6171-7324
Siddhant Chhabria [email protected] +91-22-6171-7336

FMCG SECTOR REVIEW
Page | 2
Investment Rationale
ITC (CMP Rs 264, TP Rs 358, BUY with an upside of 36%)
Investment Rationale: ITC is a market leader in Cigarettes (>80% value market share), notebooks, valued-added paperboards and a critical player in biscuits. At CMP, the implied EPS CAGR (FY17-FY20E) at 30x FY20 P/E (Ex-ITC Sector P/E is at 37x FY20) is 1% and reflecting higher discounting factored in the stock. ITC’s last 3 year and 5 year EPS CAGR (despite punitive taxes) is at 5% and 10% respectively. Even during the most challenging quarter i.e. 2QFY18, ITC posted 5.6% growth in APAT. Hence, we believe the stock has immense potential to perform well in the coming years. Govt. had stated that GST would be neutral for cigarettes; instead, they increased the cess on cigarettes in July resulting in higher taxes. Therefore, we anticipate high probability of neutral to mild increase in taxes in upcoming union budget.
Valuation & Recommendation: We expect Revenue/EBITDA/APAT CAGR of 9/10/10% respectively over FY17-20E. The company operates at EBITDA margin of 36%, along with core RoCE of ~40%. We maintain BUY rating with a TP of Rs 358, based on 32x Dec-19EPS.
HUL (CMP Rs 1,347, TP Rs 1,514, BUY with an upside of 12%)
Investment Rationale: HUL’s strategy to focus on market development, premiumisation, market share gain and cost optimisation has resulted into healthy 13% growth in EBITDA during the last 5 years. We expect HUL to be a key beneficiary of GST and can gain market share from unorganised players. Recovering rural demand (~40% of revenues) and healthy growth from premium segments can result into superior earnings in the coming years.
Valuation & Recommendation: We expect Revenue/EBITDA/APAT CAGR of 12/18/21% respectively over FY17-20E. Considering consistent market share gain, margin expansion and strong RoCE, HUL’s high valuation is justified. HUL is the pure play for the improving domestic story. We re-rate HUL to 43x P/E (42x earlier) on Dec-19EPS on the expectation of quicker recovery in rural demand. We arrive at TP of Rs 1,514, maintain BUY.
DABUR (CMP Rs 353, TP Rs 406, BUY with an upside of 15%)
Investment Rationale: Dabur has seen many challenges in its business during the last 2 years on account of slow rural demand (~45% of domestic), disruption through Patanjali, higher impact of demonet than others due to high wholesale dependence and weak international business. Therefore, Dabur’s consolidated revenue degrew by average ~2% during the last 8 quarters. Better revenue growth, stable inflation and a favourable product mix would expand the EBITDA margin by ~200bps over FY17-20E.
Valuation & Recommendation: We expect Revenue/EBITDA/APAT CAGR of 11/16/17% respectively over FY17-20E. With domestic and international recovery at inflexion point, we see further re-rating in the stock. We value Dabur based on P/E of 35x Dec-19EPS, and arrive at a TP of Rs 406. We maintain BUY.
BRITANNIA (CMP Rs 4,734, TP Rs 5,312, BUY with an upside of 12%)
Investment Rationale: BRIT’s focus areas are (1) Premiumisation through innovation, (2) Distribution expansion (largely in rural areas and increase in direct reach), (3) Growth acceleration in weak markets

FMCG SECTOR REVIEW
Page | 3
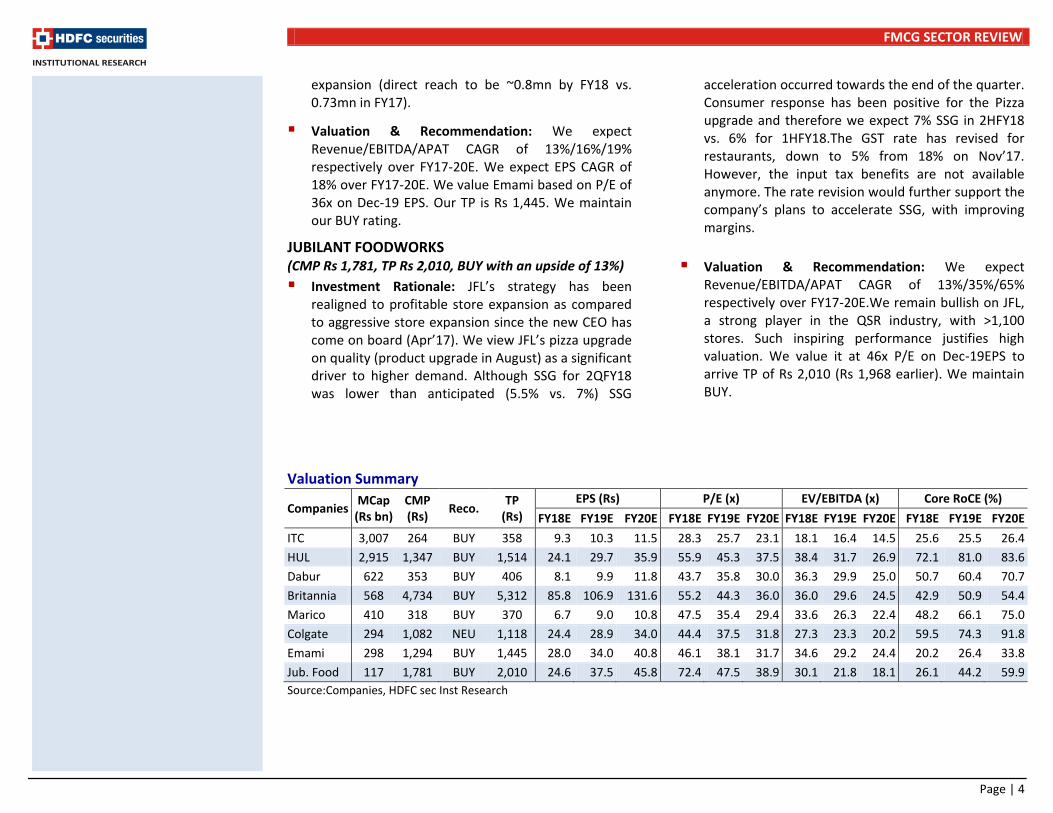
(Rajasthan, MP, UP, Gujarat and Chhattisgarh), (4) Entry in new segments (like croissants), (5) Cost optimization (saving of ~Rs 2.5bn in FY18E). The company is focusing on expanding the market through focusing on weaker areas like rural which contributes only 20% of revenues. The company aims to achieve 30-35% share from rural over the next 2-3 years. BRIT’s weak states, Gujarat, Rajasthan, UP, MP and Chhattisgarh combined comprise ~35% of India’s population. Further, gaining traction in these states would spur BRIT’s growth momentum. BRIT has already increased its direct reach to 1.7mn (~2.3x in last 4 years). BRIT has had an impressive run since FY10 with focus on EBITDA expansion by ~940bps (14.1% in FY17 vs. 4.7% in FY10) i.e. ~140bps annually. We still expect further margin expansion of ~150-200bps in the next 2 years driven by softening input prices, higher share of premium segment and cost rationalisation.
Valuation & Recommendation: We expect Revenue/EBITDA/APAT CAGR of 14%/20%/21% respectively over FY17-20E. With improving demand (especially in rural), benign RM and BRIT’s successful execution on various initiatives, we value BRIT based on P/E of 42x Dec-19EPS. Maintain BUY with a TP of Rs 5,312.
MARICO (CMP Rs 318, TP Rs 370, BUY with an upside of 17%)
Investment Rationale: We are encouraged by Marico’s market share gain (90-95% portfolio gained in 1HFY18) in a challenging period (demonet, GST). However, steep rise in copra prices (~65% YoY) impacted Marico performance during 1HFY18 (EBITDA contracted by 7% YoY). In the last 2 years, Marico gained 200bps, 800bps and 400bps market share in Coconut oil, Saffola and VAHO, respectively.
Valuation & Recommendation: We expect Revenue/EBITDA/APAT CAGR of 13%/16%/20% respectively over FY17-20E. We value Marico based on P/E of 35x Dec-19, and derived a TP of Rs 370. We are optimistic about Marico’s long-term story and success on new launches. We upgrade Marico to BUY from NEUTRAL.
COLGATE (CMP Rs 1,082, TP Rs 1,118, NEU with an upside of 3%)
Investment Rationale: Colgate continued to lose market share due to rising competition from Patanjali and Dabur. Its Toothpaste and Toothbrush market share stood at 54% (-170bps YoY) and 45.5% (-110bps YoY). Colgate was the only FMCG company in our coverage which reported volume decline (-1%) in 2QFY18, despite benefits of restocking owing to GST transition.
Valuation & Recommendation: We expect Revenue/EBITDA/APAT CAGR of 11%/13%/16% respectively over FY17-20E. With recovery in rural demand and normalizing trade channels, we are positive on the sector. However, Colgate, with a single-category presence, will find it difficult to capitalize on this vis-à-vis other companies. We valued Colgate based on P/E of 34x on Dec-19 EPS to arrive at a TP of 1,118. We maintain NEUTRAL.
EMAMI (CMP Rs 1,294, TP Rs 1,445, BUY with an upside of 12%)
Investment Rationale: Emami’s success of the company’s strategy (focus on low penetration and high-margin categories) is reflected by its revenue/EBITDA/APAT CAGR of 17/28/24% in the last 10 years. We like Emami on account of (1) Leadership in ~70% domestic portfolio and gaining market share gain, (2) Focus on low penetration and high-margin categories, (3) New launches, (4) Distribution
FMCG SECTOR REVIEW
Page | 4
expansion (direct reach to be ~0.8mn by FY18 vs. 0.73mn in FY17).
Valuation & Recommendation: We expect Revenue/EBITDA/APAT CAGR of 13%/16%/19% respectively over FY17-20E. We expect EPS CAGR of 18% over FY17-20E. We value Emami based on P/E of 36x on Dec-19 EPS. Our TP is Rs 1,445. We maintain our BUY rating.
JUBILANT FOODWORKS (CMP Rs 1,781, TP Rs 2,010, BUY with an upside of 13%)
Investment Rationale: JFL’s strategy has been realigned to profitable store expansion as compared to aggressive store expansion since the new CEO has come on board (Apr’17). We view JFL’s pizza upgrade on quality (product upgrade in August) as a significant driver to higher demand. Although SSG for 2QFY18 was lower than anticipated (5.5% vs. 7%) SSG
acceleration occurred towards the end of the quarter. Consumer response has been positive for the Pizza upgrade and therefore we expect 7% SSG in 2HFY18 vs. 6% for 1HFY18.The GST rate has revised for restaurants, down to 5% from 18% on Nov’17. However, the input tax benefits are not available anymore. The rate revision would further support the company’s plans to accelerate SSG, with improving margins.
Valuation & Recommendation: We expect Revenue/EBITDA/APAT CAGR of 13%/35%/65% respectively over FY17-20E.We remain bullish on JFL, a strong player in the QSR industry, with >1,100 stores. Such inspiring performance justifies high valuation. We value it at 46x P/E on Dec-19EPS to arrive TP of Rs 2,010 (Rs 1,968 earlier). We maintain BUY.
Valuation Summary
Companies MCap
(Rs bn) CMP (Rs)
Reco. TP
(Rs)
EPS (Rs) P/E (x) EV/EBITDA (x) Core RoCE (%)
FY18E FY19E FY20E FY18E FY19E FY20E FY18E FY19E FY20E FY18E FY19E FY20E
ITC 3,007 264 BUY 358 9.3 10.3 11.5 28.3 25.7 23.1 18.1 16.4 14.5 25.6 25.5 26.4
HUL 2,915 1,347 BUY 1,514 24.1 29.7 35.9 55.9 45.3 37.5 38.4 31.7 26.9 72.1 81.0 83.6
Dabur 622 353 BUY 406 8.1 9.9 11.8 43.7 35.8 30.0 36.3 29.9 25.0 50.7 60.4 70.7
Britannia 568 4,734 BUY 5,312 85.8 106.9 131.6 55.2 44.3 36.0 36.0 29.6 24.5 42.9 50.9 54.4
Marico 410 318 BUY 370 6.7 9.0 10.8 47.5 35.4 29.4 33.6 26.3 22.4 48.2 66.1 75.0
Colgate 294 1,082 NEU 1,118 24.4 28.9 34.0 44.4 37.5 31.8 27.3 23.3 20.2 59.5 74.3 91.8
Emami 298 1,294 BUY 1,445 28.0 34.0 40.8 46.1 38.1 31.7 34.6 29.2 24.4 20.2 26.4 33.8
Jub. Food 117 1,781 BUY 2,010 24.6 37.5 45.8 72.4 47.5 38.9 30.1 21.8 18.1 26.1 44.2 59.9
Source:Companies, HDFC sec Inst Research
FMCG SECTOR REVIEW
Page | 5
Contents Sector Review ................................................................................................................................................ 6
Sector Valuation and Premium to NIFTY 50 ..................................................................................................... 6 FMCG Companies P/E Bands ............................................................................................................................ 8 Sector Standing ............................................................................................................................................... 10 Sector’s Quarterly Performance .................................................................................................................... 11
Macro Review .............................................................................................................................................. 13 Performance Review .................................................................................................................................... 19
Last 10 Years’ Performance ............................................................................................................................ 19 1HFY18 Performance ...................................................................................................................................... 20 Trends of New Product Launches ................................................................................................................... 21
Domestic Performance ................................................................................................................................. 23 Domestic Volume Growth ............................................................................................................................... 23 Category Insights ............................................................................................................................................. 24
Cigarette Performance .............................................................................................................................. 25 F&B Performance ...................................................................................................................................... 27 Personal Care Performance ...................................................................................................................... 29 Home Care Performance .......................................................................................................................... 30 OTC FMCG Performance ........................................................................................................................... 32 Hair Care Performance ............................................................................................................................. 33 Oral Care Performance ............................................................................................................................. 34 QSR Performance ...................................................................................................................................... 35
Commodity Trend ........................................................................................................................................ 37 International Performance ........................................................................................................................... 38 Companies
ITC ................................................................................................................................................................... 40 HUL .................................................................................................................................................................. 44 Dabur ............................................................................................................................................................... 48 Britannia .......................................................................................................................................................... 52 Marico ............................................................................................................................................................. 56 Colgate-Palmolive ........................................................................................................................................... 60 Emami ............................................................................................................................................................. 64 Jubilant FoodWorks ........................................................................................................................................ 68
FMCG SECTOR REVIEW
Page | 6
Sector ReviewSector P/E (24-month Rolling Forward) Sector (Ex-ITC) P/E (24-month Rolling Forward)
Source: Companies, Bloomberg, HDFC sec Inst Research Source: Companies, Bloomberg, HDFC sec Inst Research
Sector Valuation Premium (24-month) Over Nifty 50 Sector (Ex-ITC) Valuation Premium (24-month) Over Nifty 50
Source: Companies, Bloomberg, HDFC sec Inst Research Source: Companies, Bloomberg, HDFC sec Inst Research
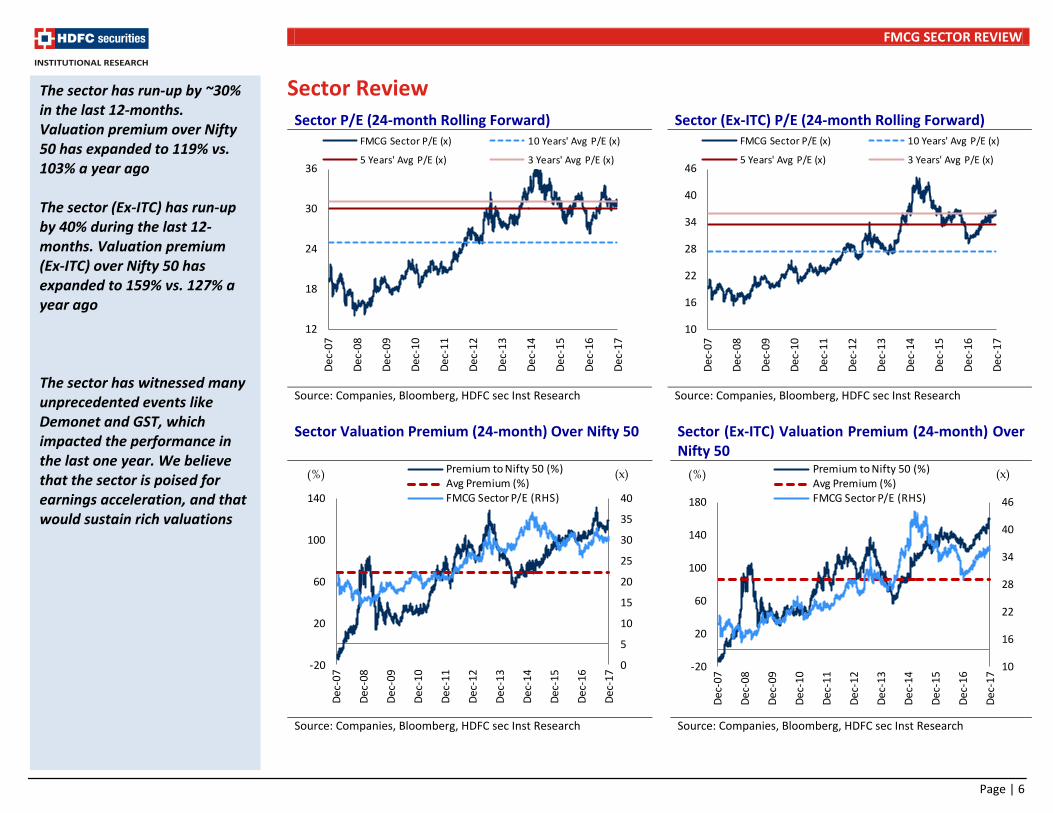
The sector has run-up by ~30% in the last 12-months. Valuation premium over Nifty 50 has expanded to 119% vs. 103% a year ago The sector (Ex-ITC) has run-up by 40% during the last 12-months. Valuation premium (Ex-ITC) over Nifty 50 has expanded to 159% vs. 127% a year ago The sector has witnessed many unprecedented events like Demonet and GST, which impacted the performance in the last one year. We believe that the sector is poised for earnings acceleration, and that would sustain rich valuations
0
5
10
15
20
25
30
35
40
-20
20
60
100
140
Dec
-07
Dec
-08
Dec
-09
Dec
-10
Dec
-11
Dec
-12
Dec
-13
Dec
-14
Dec
-15
Dec
-16
Dec
-17
Premium to Nifty 50 (%)Avg Premium (%)FMCG Sector P/E (RHS)
(x)(%)
10
16
22
28
34
40
46
-20
20
60
100
140
180
Dec
-07
Dec
-08
Dec
-09
Dec
-10
Dec
-11
Dec
-12
Dec
-13
Dec
-14
Dec
-15
Dec
-16
Dec
-17
Premium to Nifty 50 (%)Avg Premium (%)FMCG Sector P/E (RHS)
(x)(%)
12
18
24
30
36
Dec
-07
Dec
-08
Dec
-09
Dec
-10
Dec
-11
Dec
-12
Dec
-13
Dec
-14
Dec
-15
Dec
-16
Dec
-17
FMCG Sector P/E (x) 10 Years' Avg P/E (x)
5 Years' Avg P/E (x) 3 Years' Avg P/E (x)
10
16
22
28
34
40
46
Dec
-07
Dec
-08
Dec
-09
Dec
-10
Dec
-11
Dec
-12
Dec
-13
Dec
-14
Dec
-15
Dec
-16
Dec
-17
FMCG Sector P/E (x) 10 Years' Avg P/E (x)
5 Years' Avg P/E (x) 3 Years' Avg P/E (x)
FMCG SECTOR REVIEW
Page | 7
Company PEG (FY20E) Company P/E (FY20E)
Source: Companies, Bloomberg, HDFC sec Inst Research Source: Companies, Bloomberg, HDFC sec Inst Research
Stock Returns Companies 1M (%) 3M (%) 6M (%) 12M (%) 3Yr (%) 5Yr (%)
ITC 1.9 (2.0) (15.4) 15.6 5.9 38.2
HUL 6.1 8.8 22.8 71.3 76.0 155.8
Nestle 3.9 10.2 19.0 37.0 27.4 61.2
GCPL 3.5 7.9 (1.9) 37.4 101.9 165.6
Dabur 3.0 14.8 20.7 31.7 50.2 172.6
Britannia (0.9) 10.8 29.7 68.4 168.3 865.0
Colgate 5.3 (0.9) (1.9) 20.5 21.9 46.8
Marico 4.7 (1.4) 1.4 27.5 93.2 198.7
GSK 9.6 32.3 22.8 32.5 12.4 75.0
Emami 5.9 19.0 21.7 39.2 69.5 239.6
Jubilant 2.8 28.5 92.2 118.3 30.7 35.6
Jyothy 6.5 2.7 6.3 16.0 56.8 148.7
Bajaj Corp 9.6 25.0 32.8 36.7 46.5 115.0
Nifty FMCG 3.5 5.9 2.0 35.2 31.3 75.5 Nifty 50 0.9 4.8 9.0 30.8 26.3 78.5 Note: Green indicates out-performance to Nifty 50 during the respective period Red indicates under-performance to Nifty 50 during the respective period
2.2 2.1 2.0 2.0
1.7 1.7 1.7 1.6 1.6 1.5
1.4 1.2 1.0
-
0.5
1.0
1.5
2.0
2.5
GCP
L
GSK
Co
ns
Nes
tle
ITC
Dab
ur
HU
L
Co
lgat
e
Baj
aj C
orp
Bri
tan
nia
Emam
i
Jyo
thy
Lab
s
Mar
ico
Jub
ilan
t Fo
od
PEG Avg PEG
3429
43
23
30
38
32
21
3632
27 29
39
-5
10 15 20 25 30 35 40 45 50
GC
PL
GSK
Co
ns
Nes
tle
ITC
Dab
ur
HU
L
Co
lgat
e
Baj
aj C
orp
Bri
tan
nia
Emam
i
Jyo
thy
Lab
s
Mar
ico
Jubi
lant
Foo
d
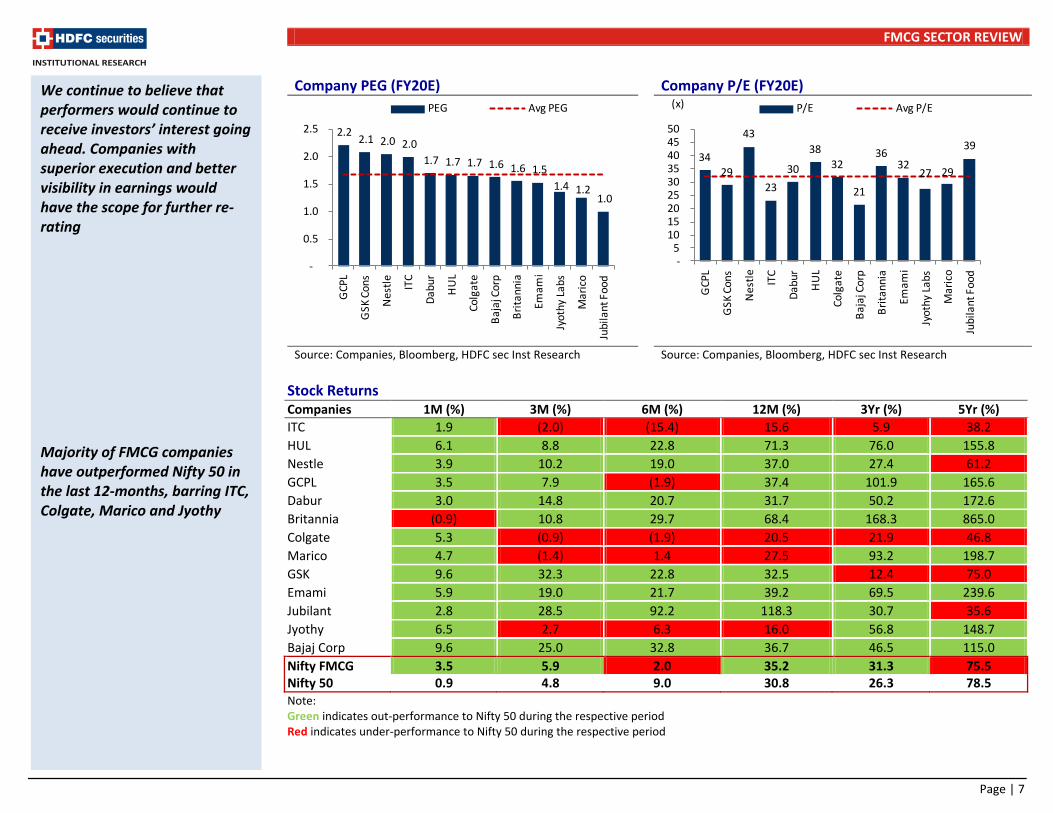
P/E Avg P/E(x)We continue to believe that performers would continue to receive investors’ interest going ahead. Companies with superior execution and better visibility in earnings would have the scope for further re-rating
Majority of FMCG companies have outperformed Nifty 50 in the last 12-months, barring ITC, Colgate, Marico and Jyothy
FMCG SECTOR REVIEW
Page | 8
FMCG Companies P/E Bands
ITC P/E (24-month Rolling Forward) HUL P/E (24-month Rolling Forward)
Source: Bloomberg, HDFC sec Inst Research Source: Bloomberg, HDFC sec Inst Research
Dabur P/E (24-month Rolling Forward) Britannia P/E (24-month Rolling Forward)
Source: Bloomberg, HDFC sec Inst Research Source: Bloomberg, HDFC sec Inst Research
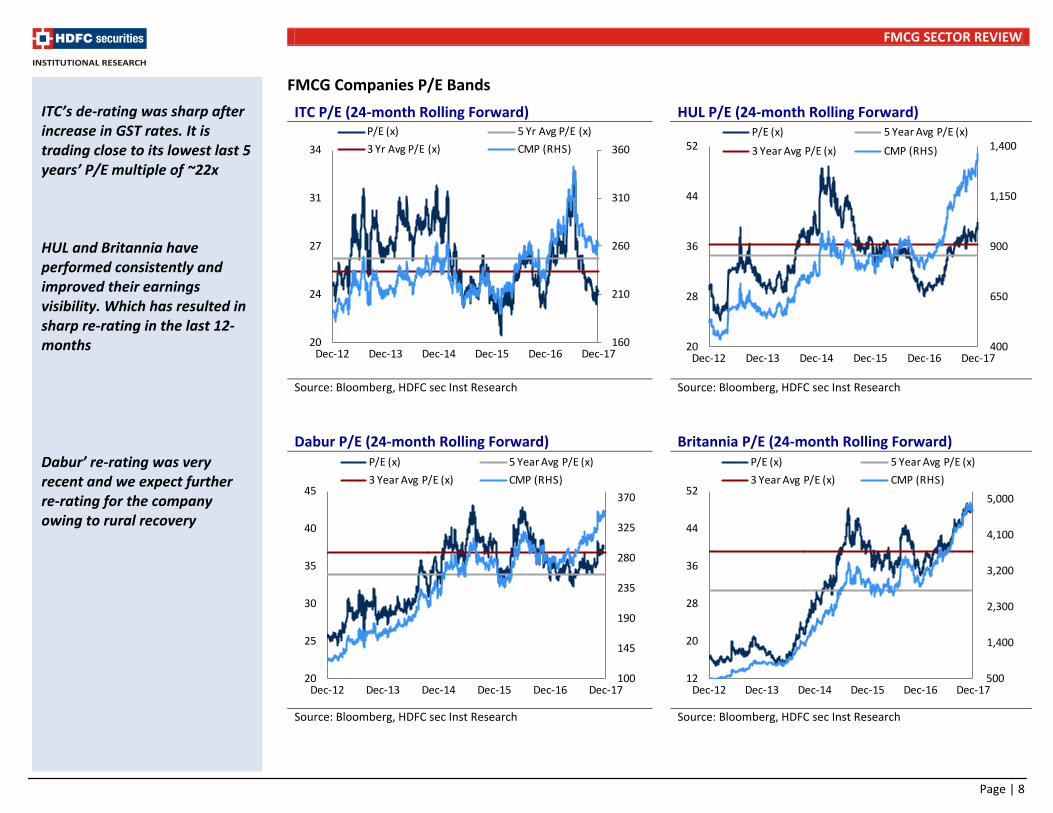
ITC’s de-rating was sharp after increase in GST rates. It is trading close to its lowest last 5 years’ P/E multiple of ~22x HUL and Britannia have performed consistently and improved their earnings visibility. Which has resulted in sharp re-rating in the last 12-months Dabur’ re-rating was very recent and we expect further re-rating for the company owing to rural recovery
400
650
900
1,150
1,400
20
28
36
44
52
Dec-12 Dec-13 Dec-14 Dec-15 Dec-16 Dec-17
P/E (x) 5 Year Avg P/E (x)
3 Year Avg P/E (x) CMP (RHS)
160
210
260
310
360
20
24
27
31
34
Dec-12 Dec-13 Dec-14 Dec-15 Dec-16 Dec-17
P/E (x) 5 Yr Avg P/E (x)
3 Yr Avg P/E (x) CMP (RHS)
500
1,400
2,300
3,200
4,100
5,000
12
20
28
36
44
52
Dec-12 Dec-13 Dec-14 Dec-15 Dec-16 Dec-17
P/E (x) 5 Year Avg P/E (x)
3 Year Avg P/E (x) CMP (RHS)
100
145
190
235
280
325
370
20
25
30
35
40
45
Dec-12 Dec-13 Dec-14 Dec-15 Dec-16 Dec-17
P/E (x) 5 Year Avg P/E (x)
3 Year Avg P/E (x) CMP (RHS)
FMCG SECTOR REVIEW
Page | 9
Marico P/E (24-month Rolling Forward) Colgate P/E (24-month Rolling Forward)
Source: Bloomberg, HDFC sec Inst Research Source: Bloomberg, HDFC sec Inst Research
Emami P/E (24-month Rolling Forward) Jubilant FoodWorks P/E (24-month Rolling Forward)
Source: Bloomberg, HDFC sec Inst Research Source: Bloomberg, HDFC sec Inst Research
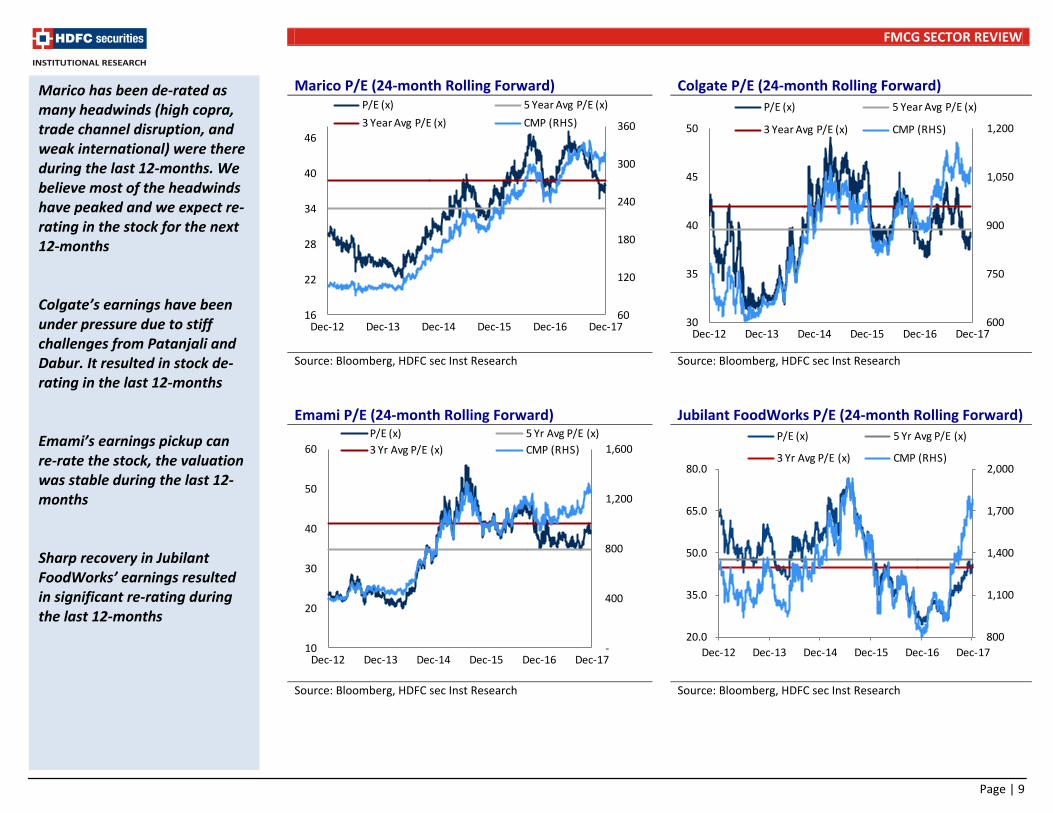
Marico has been de-rated as many headwinds (high copra, trade channel disruption, and weak international) were there during the last 12-months. We believe most of the headwinds have peaked and we expect re-rating in the stock for the next 12-months Colgate’s earnings have been under pressure due to stiff challenges from Patanjali and Dabur. It resulted in stock de-rating in the last 12-months Emami’s earnings pickup can re-rate the stock, the valuation was stable during the last 12-months Sharp recovery in Jubilant FoodWorks’ earnings resulted in significant re-rating during the last 12-months
60
120
180
240
300
360
16
22
28
34
40
46
Dec-12 Dec-13 Dec-14 Dec-15 Dec-16 Dec-17
P/E (x) 5 Year Avg P/E (x)
3 Year Avg P/E (x) CMP (RHS)
600
750
900
1,050
1,200
30
35
40
45
50
Dec-12 Dec-13 Dec-14 Dec-15 Dec-16 Dec-17
P/E (x) 5 Year Avg P/E (x)
3 Year Avg P/E (x) CMP (RHS)
-
400
800
1,200
1,600
10
20
30
40
50
60
Dec-12 Dec-13 Dec-14 Dec-15 Dec-16 Dec-17
P/E (x) 5 Yr Avg P/E (x)
3 Yr Avg P/E (x) CMP (RHS)
800
1,100
1,400
1,700
2,000
20.0
35.0
50.0
65.0
80.0
Dec-12 Dec-13 Dec-14 Dec-15 Dec-16 Dec-17
P/E (x) 5 Yr Avg P/E (x)
3 Yr Avg P/E (x) CMP (RHS)
FMCG SECTOR REVIEW
Page | 10
Sector Standing: “Sector Has Significant Scope Of Mean Reversion Towards its 10-year Historical Average
Revenue Growth” Sector’s Revenue Performance Sector’s EBITDA Performance
Source: Companies, Bloomberg, HDFC sec Inst Research Note: FY16 growth based on IGAAP
Source: Companies, Bloomberg, HDFC sec Inst Research Note: FY16 growth based on IGAAP
Sector’s EBITDA Margin Sector’s APAT Performance
Source: Companies, Bloomberg, HDFC sec Inst Research Note: FY16 growth based on IGAAP
Source: Companies, Bloomberg, HDFC sec Inst Research Note: FY16 growth based on IGAAP
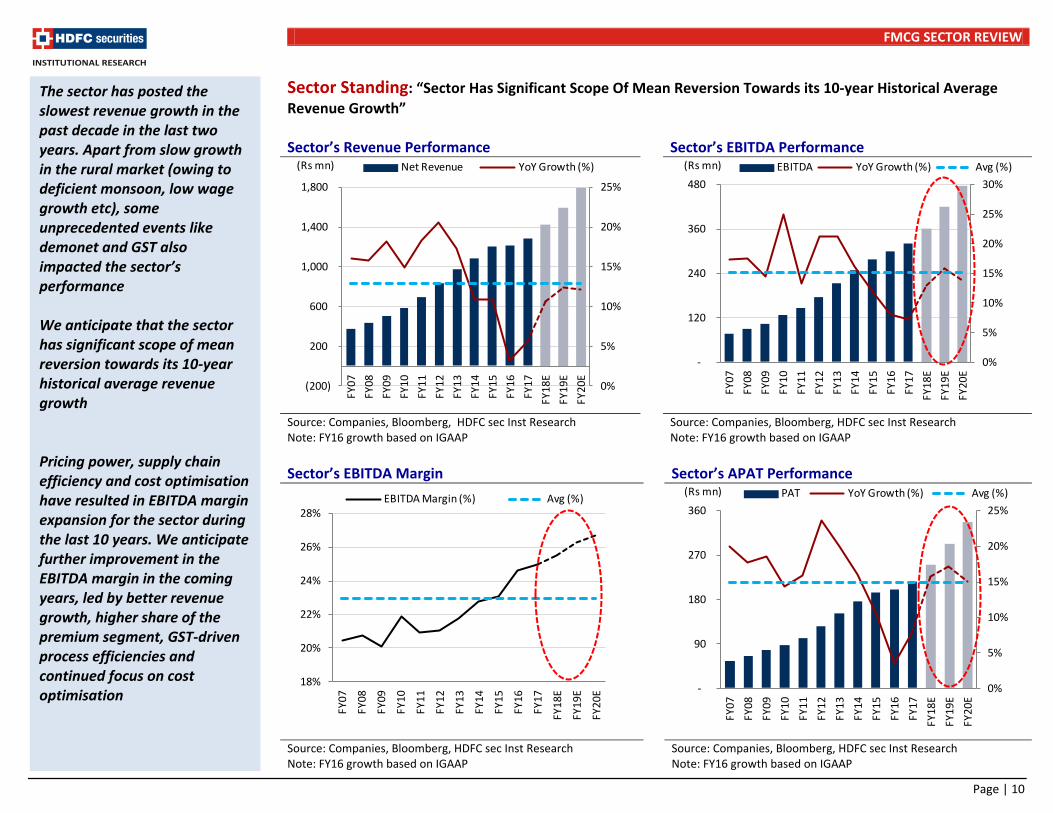
The sector has posted the slowest revenue growth in the past decade in the last two years. Apart from slow growth in the rural market (owing to deficient monsoon, low wage growth etc), some unprecedented events like demonet and GST also impacted the sector’s performance We anticipate that the sector has significant scope of mean reversion towards its 10-year historical average revenue growth Pricing power, supply chain efficiency and cost optimisation have resulted in EBITDA margin expansion for the sector during the last 10 years. We anticipate further improvement in the EBITDA margin in the coming years, led by better revenue growth, higher share of the premium segment, GST-driven process efficiencies and continued focus on cost optimisation
0%
5%
10%
15%
20%
25%
(200)
200
600
1,000
1,400
1,800
FY07
FY08
FY09
FY10
FY11
FY12
FY13
FY14
FY15
FY16
FY17
FY18
E
FY19
E
FY20
E
Net Revenue YoY Growth (%)(Rs mn)
0%
5%
10%
15%
20%
25%
30%
-
120
240
360
480
FY07
FY08
FY09
FY10
FY11
FY12
FY13
FY14
FY15
FY16
FY17
FY18
E
FY19
E
FY20
E
EBITDA YoY Growth (%) Avg (%)(Rs mn)
18%
20%
22%
24%
26%
28%
FY07
FY08
FY09
FY10
FY11
FY12
FY13
FY14
FY15
FY16
FY17
FY18
E
FY19
E
FY20
E
EBITDA Margin (%) Avg (%)
0%
5%
10%
15%
20%
25%
-
90
180
270
360
FY07
FY08
FY09
FY10
FY11
FY12
FY13
FY14
FY15
FY16
FY17
FY18
E
FY19
E
FY20
E
PAT YoY Growth (%) Avg (%)(Rs mn)

FMCG SECTOR REVIEW
Page | 11
Sector’s Quarterly Performance
Particulars (Rs bn) Quarterly Performance Quarterly Performance (Ex-ITC)
2QFY17 3QFY17 4QFY17 1QFY18 2QFY18 2QFY17 3QFY17 4QFY17 1QFY18 2QFY18
Net Revenues 309.4 300.0 325.8 315.6 331.0 212.8 207.6 214.5 216.1 230.5 YoY Chg. (%) 7.7% 2.3% 7.9% 0.8% 7.0% 6.7% 1.4% 4.9% 1.7% 8.3% EBITDA 76.1 74.8 82.0 78.7 83.7 39.8 39.3 43.2 41.3 46.1 YoY Chg. (%) 9.3% 1.2% 7.3% 3.2% 10.1% 11.3% 0.5% 7.1% 0.5% 15.9% APAT 53.4 51.0 56.5 53.7 58.7 28.6 26.1 29.8 28.1 32.3 YoY Chg. (%) 11.9% -7.9% 16.7% 2.7% 10.0% 13.4% -5.0% 10.0% 1.0% 13.0% Source: Companies, HDFC sec Inst Research Note: 1QFY16-4QFY16 growth is based on IGAAP. Revenue growth in 2QFY18 is based on comparable basis (adjusted to GST impact)
Sector’s Quarterly Revenue Performance Sector’s Quarterly Gross Profit Performance
Source: Companies, HDFC sec Inst Research Note: 1QFY16-4QFY16 growth is based on IGAAP. Revenue growth in 2QFY18 is based on comparable basis (adjusted for GST impact)
Source: Companies, HDFC sec Inst Research Note: 1QFY16-4QFY16 margin is based on IGAAP
0.0%
3.0%
6.0%
9.0%
12.0%
15.0%
18.0%
-
90
180
270
360 Q
1F
Y1
4Q
2F
Y1
4Q
3F
Y1
4Q
4F
Y1
4Q
1F
Y1
5Q
2F
Y1
5Q
3F
Y1
5Q
4F
Y1
5Q
1F
Y1
6Q
2F
Y1
6Q
3F
Y1
6Q
4F
Y1
6Q
1F
Y1
7Q
2F
Y1
7Q
3F
Y1
7Q
4F
Y1
7Q
1F
Y1
8Q
2F
Y1
8
Net Sales YoY Gr. (%) Avg (%)(Rs mn)
50%
52%
54%
56%
58%
-
50
100
150
200
Q1
FY1
4Q
2FY
14
Q3
FY1
4Q
4FY
14
Q1
FY1
5Q
2FY
15
Q3
FY1
5Q
4FY
15
Q1
FY1
6Q
2FY
16
Q3
FY1
6Q
4FY
16
Q1
FY1
7Q
2FY
17
Q3
FY1
7Q
4FY
17
Q1
FY1
8Q
2FY
18
Gross Profit Gross Margin (%) Avg (%)(Rs mn)
Impact of demonet
Partial recovery (post subdued performance in 1QFY18 owing to GST implementation) has been witnessed during 2QFY18 performance of the sector. We expect healthy growth in the coming quarters, on account of stability from GST, healthy underlying demand and favourable base in 2HFY18
GST led channel destocking impact
FMCG SECTOR REVIEW
Page | 12
Sector’s Quarterly EBITDA Performance Sector’s Quarterly PAT Performance
Source: Companies, HDFC sec Inst Research Note: 1QFY16-4QFY16 margin is based on IGAAP
Source: Companies, HDFC sec Inst Research Note: 1QFY16-4QFY16 margin is based on IGAAP
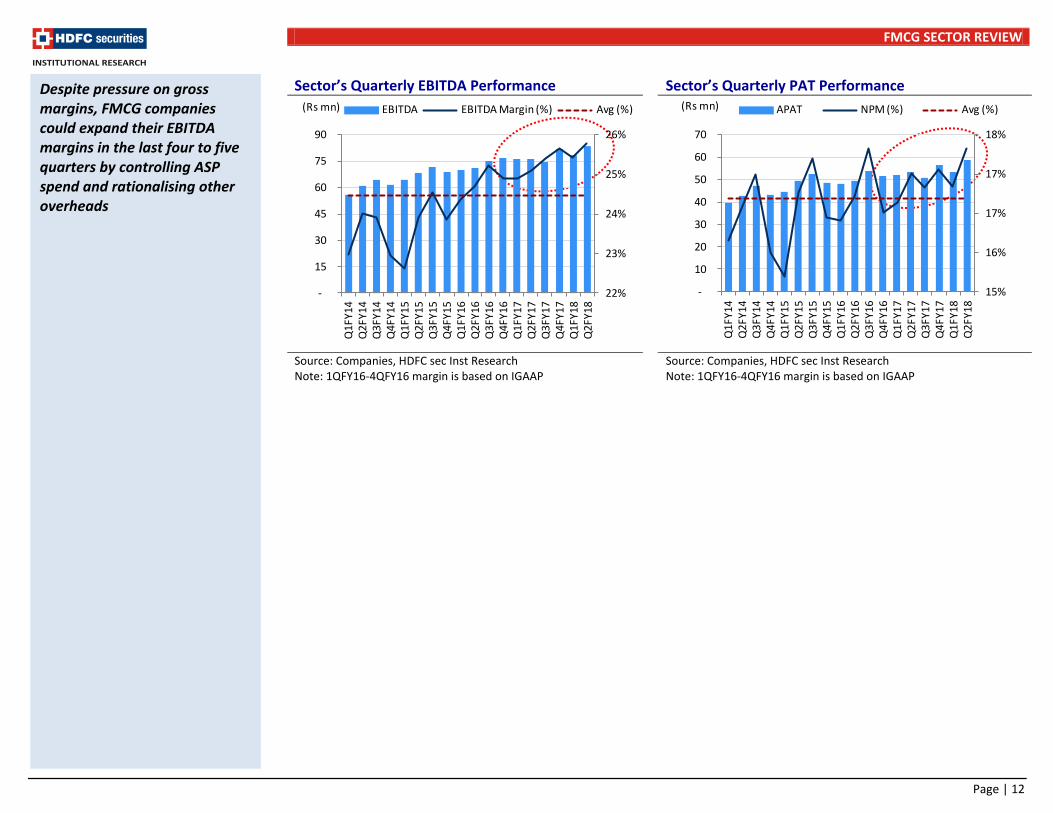
Despite pressure on gross margins, FMCG companies could expand their EBITDA margins in the last four to five quarters by controlling ASP spend and rationalising other overheads
22%
23%
24%
25%
26%
-
15
30
45
60
75
90
Q1F
Y14
Q2F
Y14
Q3F
Y14
Q4F
Y14
Q1F
Y15
Q2F
Y15
Q3F
Y15
Q4F
Y15
Q1F
Y16
Q2F
Y16
Q3F
Y16
Q4F
Y16
Q1F
Y17
Q2F
Y17
Q3F
Y17
Q4F
Y17
Q1F
Y18
Q2F
Y18
EBITDA EBITDA Margin (%) Avg (%)(Rs mn)
15%
16%
17%
17%
18%
-
10
20
30
40
50
60
70
Q1
FY1
4Q
2FY
14
Q3
FY1
4Q
4FY
14
Q1
FY1
5Q
2FY
15
Q3
FY1
5Q
4FY
15
Q1
FY1
6Q
2FY
16
Q3
FY1
6Q
4FY
16
Q1
FY1
7Q
2FY
17
Q3
FY1
7Q
4FY
17
Q1
FY1
8Q
2FY
18
APAT NPM (%) Avg (%)(Rs mn)
FMCG SECTOR REVIEW
Page | 13
Macro Review Agriculture Wages Non-agriculture Wages
Source: RBI, HDFC sec Inst Research Note: Computed agriculture wage by averaging wage for ploughing, sowing, harvesting and picking for series
Source: RBI, HDFC sec Inst Research Note: Computed non-agriculture wage by averaging wage for carpenter, mason, driver (LMV), sweeper
Rural CPI Urban CPI
Source: RBI, HDFC sec Inst Research Note: CPI base 2012 =100
Source: RBI, HDFC sec Inst Research Note: CPI base 2012 =100
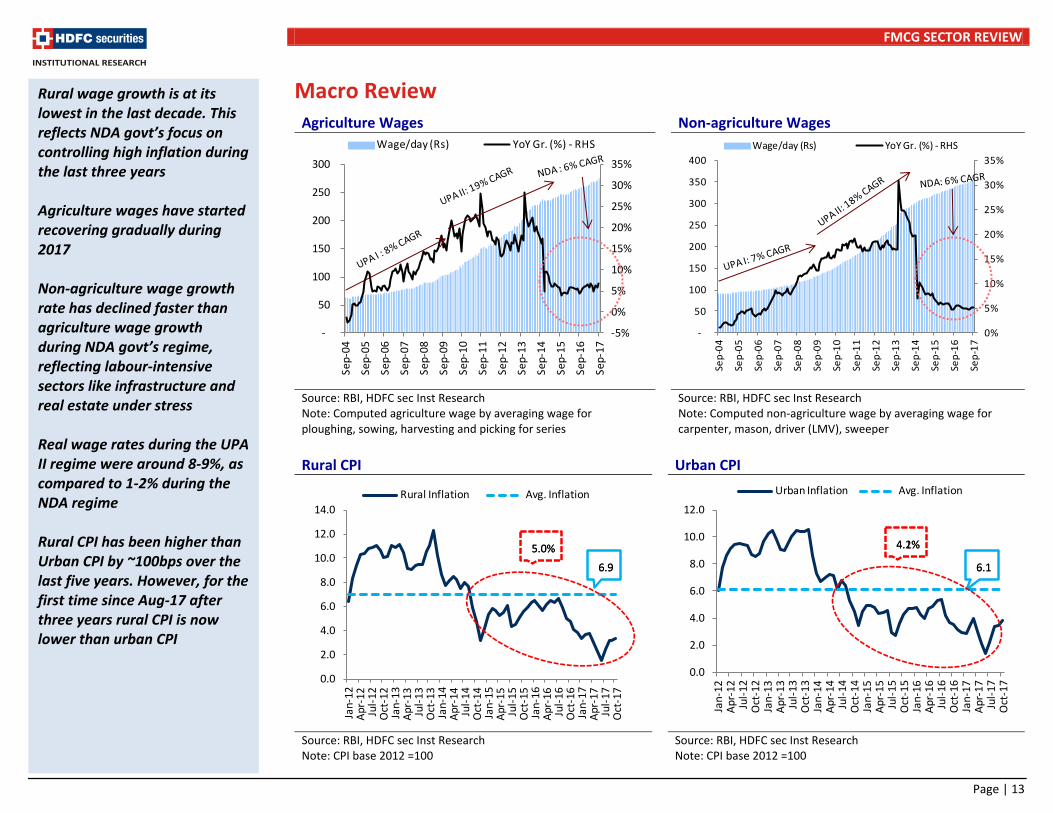
Rural wage growth is at its lowest in the last decade. This reflects NDA govt’s focus on controlling high inflation during the last three years Agriculture wages have started recovering gradually during 2017 Non-agriculture wage growth rate has declined faster than agriculture wage growth during NDA govt’s regime, reflecting labour-intensive sectors like infrastructure and real estate under stress Real wage rates during the UPA II regime were around 8-9%, as compared to 1-2% during the NDA regime Rural CPI has been higher than Urban CPI by ~100bps over the last five years. However, for the first time since Aug-17 after three years rural CPI is now lower than urban CPI
-5%
0%
5%
10%
15%
20%
25%
30%
35%
-
50
100
150
200
250
300
Sep
-04
Sep
-05
Sep
-06
Sep
-07
Sep
-08
Sep
-09
Sep-
10
Sep
-11
Sep
-12
Sep
-13
Sep
-14
Sep
-15
Sep
-16
Sep
-17
Wage/day (Rs) YoY Gr. (%) - RHS
0%
5%
10%
15%
20%
25%
30%
35%
-
50
100
150
200
250
300
350
400
Sep
-04
Sep
-05
Sep
-06
Sep
-07
Sep
-08
Sep
-09
Sep
-10
Sep
-11
Sep
-12
Sep
-13
Sep
-14
Sep
-15
Sep
-16
Sep
-17
Wage/day (Rs) YoY Gr. (%) - RHS
0.0
2.0
4.0
6.0
8.0
10.0
12.0
14.0
Jan
-12
Apr
-12
Jul-
12
Oct
-12
Jan
-13
Apr
-13
Jul-
13
Oct
-13
Jan
-14
Apr
-14
Jul-
14
Oct
-14
Jan
-15
Apr
-15
Jul-
15O
ct-1
5Ja
n-1
6A
pr-1
6Ju
l-1
6O
ct-1
6Ja
n-1
7A
pr-1
7Ju
l-1
7O
ct-1
7
Rural Inflation Avg. Inflation
6.9
5.0%
6.9
5.0%
0.0
2.0
4.0
6.0
8.0
10.0
12.0
Jan
-12
Ap
r-1
2Ju
l-12
Oct
-12
Jan
-13
Ap
r-1
3Ju
l-13
Oct
-13
Jan
-14
Ap
r-1
4Ju
l-14
Oct
-14
Jan
-15
Ap
r-1
5Ju
l-15
Oct
-15
Jan
-16
Ap
r-1
6Ju
l-16
Oct
-16
Jan
-17
Ap
r-1
7Ju
l-17
Oct
-17
Urban Inflation Avg. Inflation
6.1
4.1%
6.1
4.2%

FMCG SECTOR REVIEW
Page | 14
MSP Rates – Increased (Rs/quintal) 2017-18 YoY Gr% CAGR % 2004-14 CAGR % 2014-17
Kharif Crops
Paddy (Grade A) 1,590 5.3 9.6 4.3 Jowar (Hybrid) 1,700 4.6 12.6 3.5 Bajra 1,425 7.1 10.4 4.4 Maize 1,425 4.4 10.7 2.8 Ragi 1,900 10.1 12.6 6.9 Urad 5,400 8.0 13.2 7.4 Cotton (Long Staple) 4,320 3.8 8.2 2.2 Groundnut in shell 4,450 5.5 11.5 3.6 Sunflower seed 4,100 3.8 11.9 3.0 Soybean (Yellow) 3,050 9.9 11.0 5.9 Sesamum 5,300 6.0 13.0 4.8 Niger seed 4,050 5.9 12.8 4.0
Rabi Crops
Wheat 1,735 6.8 9.1 6.1 Barley 1,410 6.4 8.2 7.0 Gram 4,400 10.0 9.0 11.4 Masur (Lentil) 4,250 7.6 7.6 11.3 Rapeseed/Mustard 4,000 8.1 6.7 8.8 Safflower 4,100 10.8 7.6 10.3
Other Crops
Copra (Ball) - Calendar Year 6,785 8.7 4.3 7.2 Jute (CY) 1,760 10.0 11.1 13.3 Sugarcane (CY) 3,500 9.4 12.2 5.0 Source: RBI, HDFC sec Inst Research
Monsoon and FMCG Sector Correlation
Source: IMD, HDFC sec Inst Research
-9%
0%
9%
18%
27%
600
700
800
900
1,000
1,100
FY00
FY01
FY02
FY03
FY04
FY05
FY06
FY07
FY08
FY09
FY10
FY11
FY12
FY13
FY14
FY15
FY16
FY17
FY18
Rainfall (Jun-Sep) (mm) Long Period Average (LPA) - 887.5mm FMCG Sales Gr. (RHS)
Normal rainfall in the last 2 years will accelerate demand
MSP rates have increased by mid-single digits during the last three years (under NDA govt.) to control inflation. While during UPA govt. it grew in low double digits. However, the government has now increased MSP rates meaningfully for FY18 Historically, it takes more than one year of consecutive deficit monsoon to impact FMCG sector After two deficit years (FY14 and FY15) of rainfall, it was near normal during the last two years, which is expected to accelerate demand especially in rural markets
FMCG SECTOR REVIEW
Page | 15
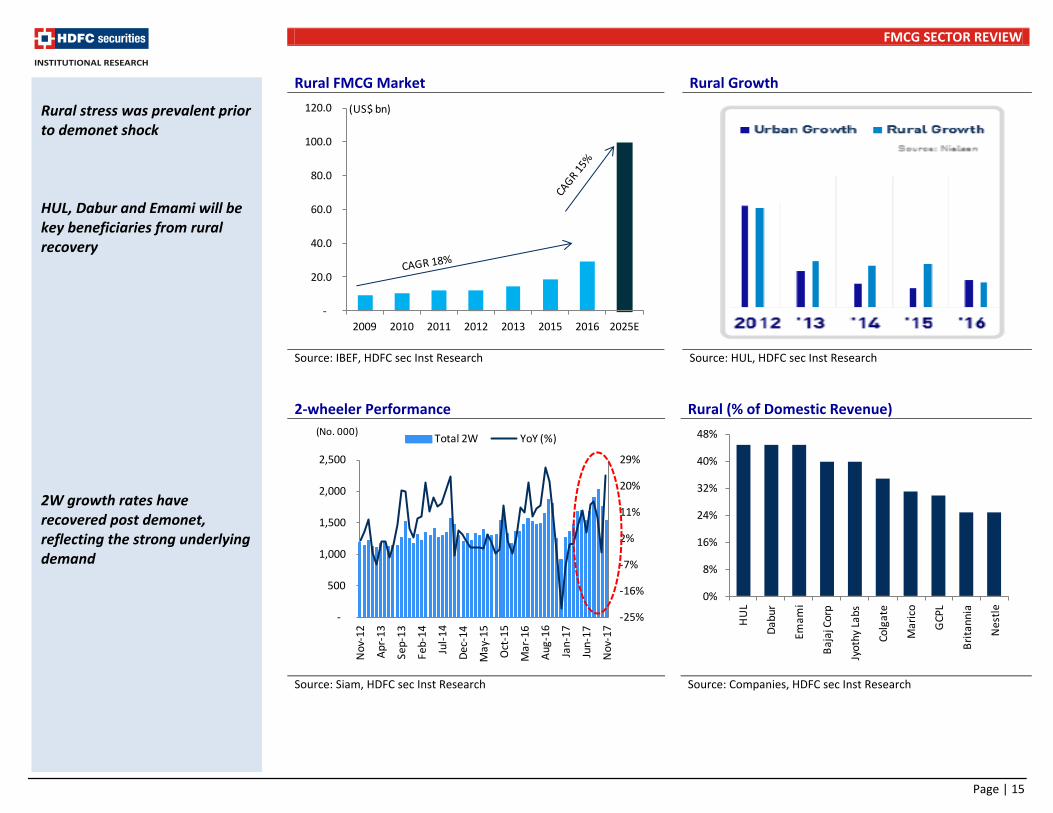
Rural FMCG Market Rural Growth
Source: IBEF, HDFC sec Inst Research
Source: HUL, HDFC sec Inst Research
2-wheeler Performance Rural (% of Domestic Revenue)
Source: Siam, HDFC sec Inst Research
Source: Companies, HDFC sec Inst Research
0%
8%
16%
24%
32%
40%
48%
HU
L
Dab
ur
Emam
i
Baj
aj C
orp
Jyo
thy
Lab
s
Co
lgat
e
Mar
ico
GC
PL
Bri
tan
nia
Nes
tle
Rural stress was prevalent prior to demonet shock HUL, Dabur and Emami will be key beneficiaries from rural recovery 2W growth rates have recovered post demonet, reflecting the strong underlying demand
-
20.0
40.0
60.0
80.0
100.0
120.0
2009 2010 2011 2012 2013 2015 2016 2025E
(US$ bn)
-25%
-16%
-7%
2%
11%
20%
29%
-
500
1,000
1,500
2,000
2,500
Nov
-12
Ap
r-13
Sep
-13
Feb
-14
Jul-
14
Dec
-14
May
-15
Oct
-15
Mar
-16
Au
g-1
6
Jan
-17
Jun
-17
Nov
-17
Total 2W YoY (%)(No. 000)
FMCG SECTOR REVIEW
Page | 16
Agriculture GVA vs. Total GVA
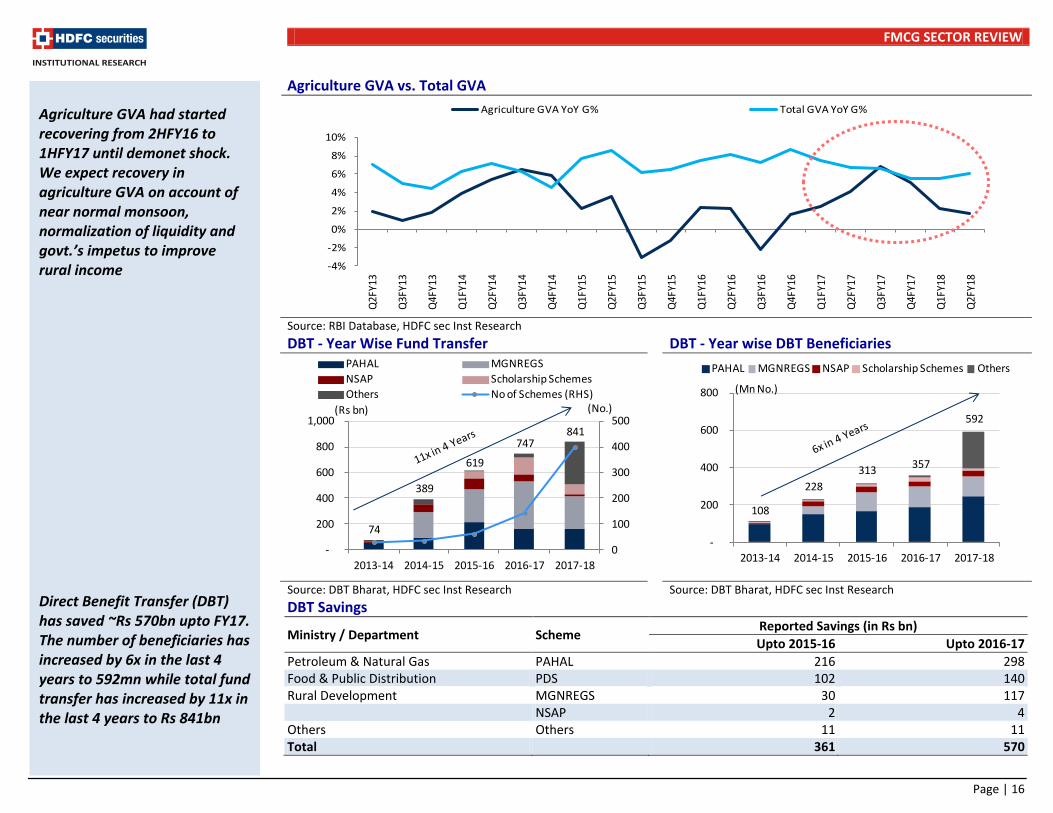
Source: RBI Database, HDFC sec Inst Research
DBT - Year Wise Fund Transfer DBT - Year wise DBT Beneficiaries
Source: DBT Bharat, HDFC sec Inst Research Source: DBT Bharat, HDFC sec Inst Research
DBT Savings
Ministry / Department Scheme Reported Savings (in Rs bn)
Upto 2015-16 Upto 2016-17
Petroleum & Natural Gas PAHAL 216 298 Food & Public Distribution PDS 102 140 Rural Development MGNREGS 30 117
NSAP 2 4
Others Others 11 11 Total
361 570
Agriculture GVA had started recovering from 2HFY16 to 1HFY17 until demonet shock. We expect recovery in agriculture GVA on account of near normal monsoon, normalization of liquidity and govt.’s impetus to improve rural income Direct Benefit Transfer (DBT) has saved ~Rs 570bn upto FY17. The number of beneficiaries has increased by 6x in the last 4 years to 592mn while total fund transfer has increased by 11x in the last 4 years to Rs 841bn
-4%
-2%
0%
2%
4%
6%
8%
10%
Q2F
Y13
Q3F
Y13
Q4F
Y13
Q1F
Y14
Q2F
Y14
Q3F
Y14
Q4F
Y14
Q1F
Y15
Q2F
Y15
Q3F
Y15
Q4F
Y15
Q1F
Y16
Q2F
Y16
Q3F
Y16
Q4F
Y16
Q1F
Y17
Q2F
Y17
Q3F
Y17
Q4F
Y17
Q1F
Y18
Q2F
Y18
Agriculture GVA YoY G% Total GVA YoY G%
74
389
619
747 841
0
100
200
300
400
500
-
200
400
600
800
1,000
2013-14 2014-15 2015-16 2016-17 2017-18
PAHAL MGNREGS
NSAP Scholarship Schemes
Others No of Schemes (RHS)
(Rs bn) (No.)
108
228
313357
592
-
200
400
600
800
2013-14 2014-15 2015-16 2016-17 2017-18
PAHAL MGNREGS NSAP Scholarship Schemes Others
(Mn No.)
FMCG SECTOR REVIEW
Page | 17
Consumer Confidence Index (RBI)
Source: RBI, HDFC sec Inst Research
Source: RBI, HDFC sec Inst Research
Premiumisation Increasing Urbanisation
Source: HUL, HDFC sec Inst Research
Source: HUL, HDFC sec Inst Research
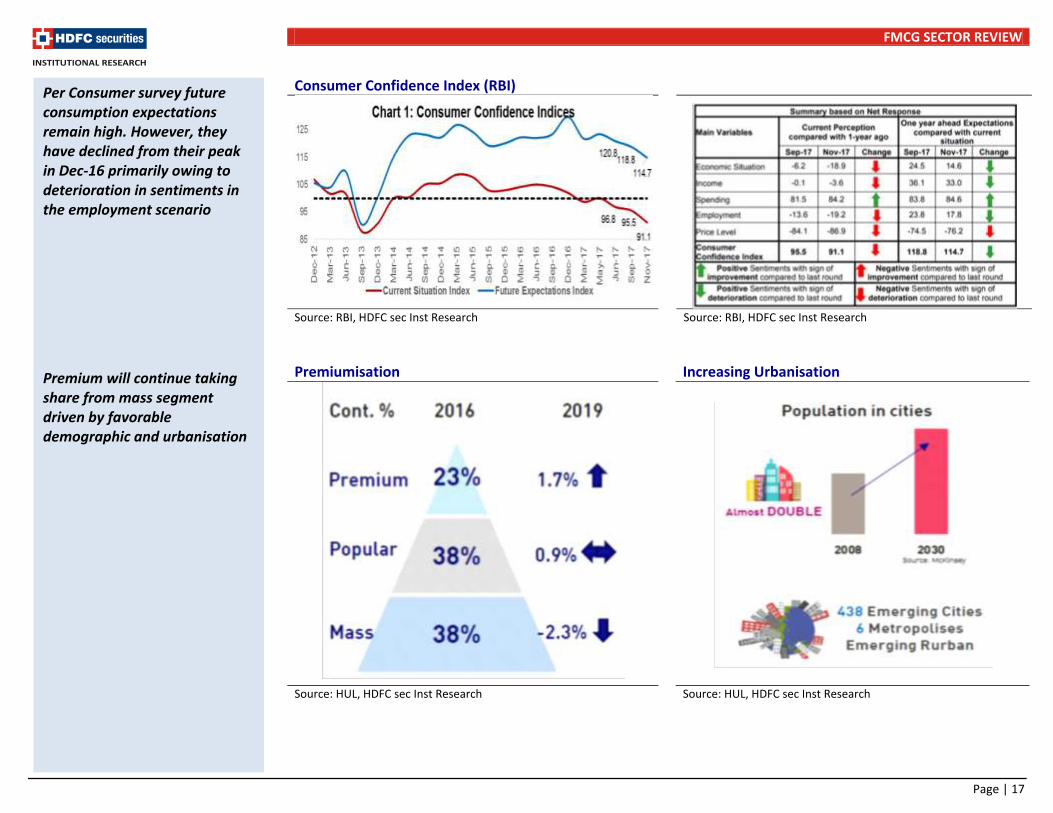
Per Consumer survey future consumption expectations remain high. However, they have declined from their peak in Dec-16 primarily owing to deterioration in sentiments in the employment scenario
Premium will continue taking share from mass segment driven by favorable demographic and urbanisation

FMCG SECTOR REVIEW
Page | 18
Favourable Mix for Urban Demand Favourable Mix for Urban Demand
Source: Emami, HDFC sec Inst Research
Source: World Bank, HDFC sec Inst Research
Migration to urban areas has been the trend since Independence, owing to better employment opportunities
Share of middle class is expected to expand to 46% from 25% in 2015 in the next decade, resulting in premiumisation of FMCG products
~50% of India’s population falls below the age of 25 years. This will support the migration to premium products over a sustainable basis
16.0
19.5
23.0
26.5
30.0
33.5
66.0
69.5
73.0
76.5
80.0
83.5
1960
1964
1968
1972
1976
1980
1984
1988
1992
1996
2000
2004
2008
2012
2016
Rural population (%) Urban population (%)- RHS
93%
74%
51%
6%
25%
46%
1% 1% 3%
0%
10%
20%
30%
40%
50%
60%
70%
80%
90%
100%
2005 2015 2025E
Deprived Middle Class
FMCG SECTOR REVIEW
Page | 19
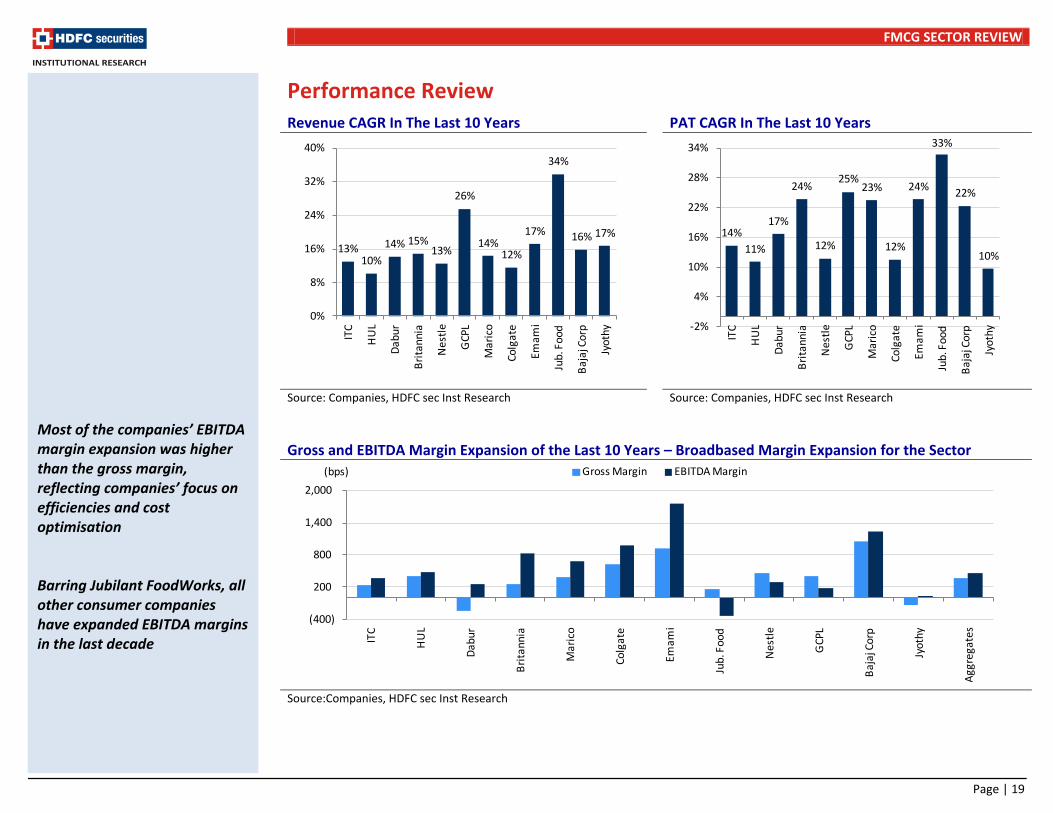
Performance Review Revenue CAGR In The Last 10 Years PAT CAGR In The Last 10 Years
Source: Companies, HDFC sec Inst Research
Source: Companies, HDFC sec Inst Research
Gross and EBITDA Margin Expansion of the Last 10 Years – Broadbased Margin Expansion for the Sector
Source:Companies, HDFC sec Inst Research
Most of the companies’ EBITDA margin expansion was higher than the gross margin, reflecting companies’ focus on efficiencies and cost optimisation Barring Jubilant FoodWorks, all other consumer companies have expanded EBITDA margins in the last decade
13%10%
14% 15%13%
26%
14%12%
17%
34%
16% 17%
0%
8%
16%
24%
32%
40%
ITC
HU
L
Dab
ur
Bri
tann
ia
Nes
tle
GCP
L
Mar
ico
Colg
ate
Emam
i
Jub.
Foo
d
Baj
aj C
orp
Jyot
hy
14%
11%
17%
24%
12%
25%23%
12%
24%
33%
22%
10%
-2%
4%
10%
16%
22%
28%
34%
ITC
HU
L
Dab
ur
Bri
tann
ia
Nes
tle
GCP
L
Mar
ico
Colg
ate
Emam
i
Jub.
Foo
d
Baj
aj C
orp
Jyot
hy
(400)
200
800
1,400
2,000
ITC
HU
L
Dab
ur
Bri
tann
ia
Ma
rico
Co
lga
te
Em
am
i
Jub.
Foo
d
Ne
stle
GCP
L
Baj
aj C
orp
Jyot
hy
Agg
rega
tes
Gross Margin EBITDA Margin (bps)

FMCG SECTOR REVIEW
Page | 20
Revenue Contribution By Leading Brands
Market Leadership Revenue Contribution (Domestic)
Colgate Oral Care ~90% HUL Detergent, Soaps, Skin Care, Tea, Coffee ~85% Marico Coconut Oils, Saffola, Hair Oils, Livon and Silk & Shine, Hair Creams/Gels ~84% Britannia Biscuits ~83% Emami Navratna Oil, Boroplus, Balm, F&H ~82% Dabur Honey, Chywanprash, Air Fresheners, Skin Bleach, Juice, Mosquito Repellent Cream ~60% ITC Cigarettes, Paper, Atta ~60%
1HFY18 Performance Particulars (Rs bn) 2QFY18 2QFY17 YoY (%) 1HFY18 1HFY17 YoY (%)
Revenue
ITC 97.6 96.6 4.0 200.0 197.1 1.5 HUL 82.0 77.0 10.0 168.7 156.8 7.5 Dabur 19.6 19.8 8.0 39.3 39.3 (0.1) Britannia 25.5 23.9 6.6 48.1 45.3 6.2 Marico 15.4 14.4 6.5 32.2 32.0 0.7 Colgate 10.8 10.6 2.7 20.6 20.7 (0.3) Emami 6.3 5.7 14.0 11.9 12.2 (2.0) Jubilant Food 7.3 6.7 9.2 14.1 12.7 10.3
EBITDA
ITC 37.6 36.3 3.6 75.1 71.6 4.9
HUL 16.8 14.0 19.7 35.5 30.4 16.7
Dabur 4.2 4.1 2.7 7.3 7.6 (3.8)
Britannia 3.8 3.4 11.4 7.1 6.6 7.8
Marico 2.6 2.5 2.4 5.8 6.3 (7.0) Colgate 3.0 2.7 9.4 5.2 4.9 7.5 Emami 2.0 1.8 14.9 2.8 3.2 (13.0)
Jubilant Food 1.0 0.6 59.0 1.8 1.2 49.0
APAT
ITC 26.4 25.0 5.6 52.0 48.8 6.5 HUL 12.5 10.8 15.5 25.4 22.1 15.2 Dabur 3.6 3.6 1.5 6.3 6.5 (3.6) Britannia 2.6 2.3 11.5 4.8 4.5 5.3 Marico 1.9 1.8 2.4 4.2 4.5 (6.2) Colgate 1.8 1.8 (2.1) 3.1 3.1 2.3 Emami 1.5 1.2 26.9 2.0 2.2 (12.5) Jubilant Food 0.4 0.2 105.5 0.7 0.4 82.6 Source:Companies, HDFC sec Inst Research
Despite FMCG companies with diversified product portfolios, managements have been able to attain leadership even in the newer categories 1HFY18 performance was impacted by GST led channel destocking and fall in CSD budget Jubilant FoodWorks’ 1HFY18 EBITDA improvement was far superior to others, as well as its own past performance HUL has executed GST implementation smoothly, and registered strong EBITDA growth for both 1QFY18 and 2QFY18. 1HFY18 EBITDA growth of 17% was encouraging, particularly in the channel disturbance

FMCG SECTOR REVIEW
Page | 21
Trends of New Product Launches
Sector - Product Launches and Re-launches
Source:Companies AR, HDFC sec Inst Research
ITC HUL Dabur
Source: ITC AR, HDFC sec Inst Research
Source: HUL AR, HDFC sec Inst Research
Source: Dabur AR, HDFC sec Inst Research
0
35
70
105
140
175
FY05 FY06 FY07 FY08 FY09 FY10 FY11 FY12 FY13 FY14 FY15 FY16 FY17
Launches Re-launches
The pace of new launches and re-launches of the sector had picked up during 1HFY17 on account of visible green shoots in the economy. However, the pace of launches had slowed down during 2HFY17 and 1HFY18 due to demonet and GST implementation impact. We expect the pace of launches to pick up significantly in the coming years HUL has significantly reduced the new launches in FY17
0
10
20
30
40
50
FY05
FY06
FY0
7
FY0
8
FY09
FY1
0
FY1
1
FY12
FY13
FY1
4
FY1
5
FY16
FY1
7
Launches Re-launches
0
10
20
30
40
50
FY0
5
FY0
6
FY0
7
FY0
8
FY0
9
FY10
FY11
FY12
FY13
FY14
FY15
FY16
FY1
7
Launches Re-launches
0
5
10
15
20
25
30
FY0
5
FY0
6
FY0
7
FY08
FY09
FY10
FY11
FY12
FY13
FY14
FY15
FY1
6
FY1
7
Launches Re-launches

FMCG SECTOR REVIEW
Page | 22
Marico Emami Britannia
Source: Marico AR, HDFC sec Inst Research
Source: Emami AR, HDFC sec Inst Research
Source: Britannia AR, HDFC sec Inst Research
Colgate Nestle Jyothy
Source: Colgate AR, HDFC sec Inst Research
Source: Nestle AR, HDFC sec Inst Research
Source: Jyothy AR, HDFC sec Inst Research
0
5
10
15
20
25
CY0
4
CY0
5
CY0
6
CY0
7
CY0
8
CY09
CY10
CY11
CY12
CY13
CY14
CY15
CY1
6
Launches Re-launches
0
2
4
6
8
10
12
14
FY0
5
FY0
6
FY0
7
FY0
8
FY0
9
FY1
0
FY1
1
FY1
2
FY1
3
FY1
4
FY15
FY16
FY17
Launches Re-launches
0
1
2
3
4
5
6
7
8
FY05
FY06
FY07
FY08
FY09
FY10
FY1
1
FY1
2
FY1
3
FY1
4
FY1
5
FY1
6
FY1
7
Launches Re-launches
Marico plans for further acceleration in the new launches and aims to achieve new launches contribution to 7-8% of total domestic revenues in the coming years as compared to 3-4% now Colgate on account of sudden shift towards the Ayurvedic/natural toothpaste has controlled product launches in FY17. The company has launched few products in the Ayurvedic space in the last 12-months
0
2
4
6
8
10
12
14
16
FY0
5
FY0
6
FY0
7
FY0
8
FY0
9
FY10
FY11
FY12
FY13
FY14
FY15
FY16
FY1
7
Launches Re-launches
0
2
4
6
8
10
12
14
FY05
FY06
FY0
7
FY0
8
FY0
9
FY1
0
FY1
1
FY1
2
FY1
3
FY1
4
FY15
FY16
FY17
Launches Re-launches
0
2
4
6
8
10
12
14
FY0
5
FY0
6
FY0
7
FY08
FY09
FY10
FY11
FY12
FY13
FY14
FY15
FY1
6
FY1
7
Launches Re-launches
FMCG SECTOR REVIEW
Page | 23
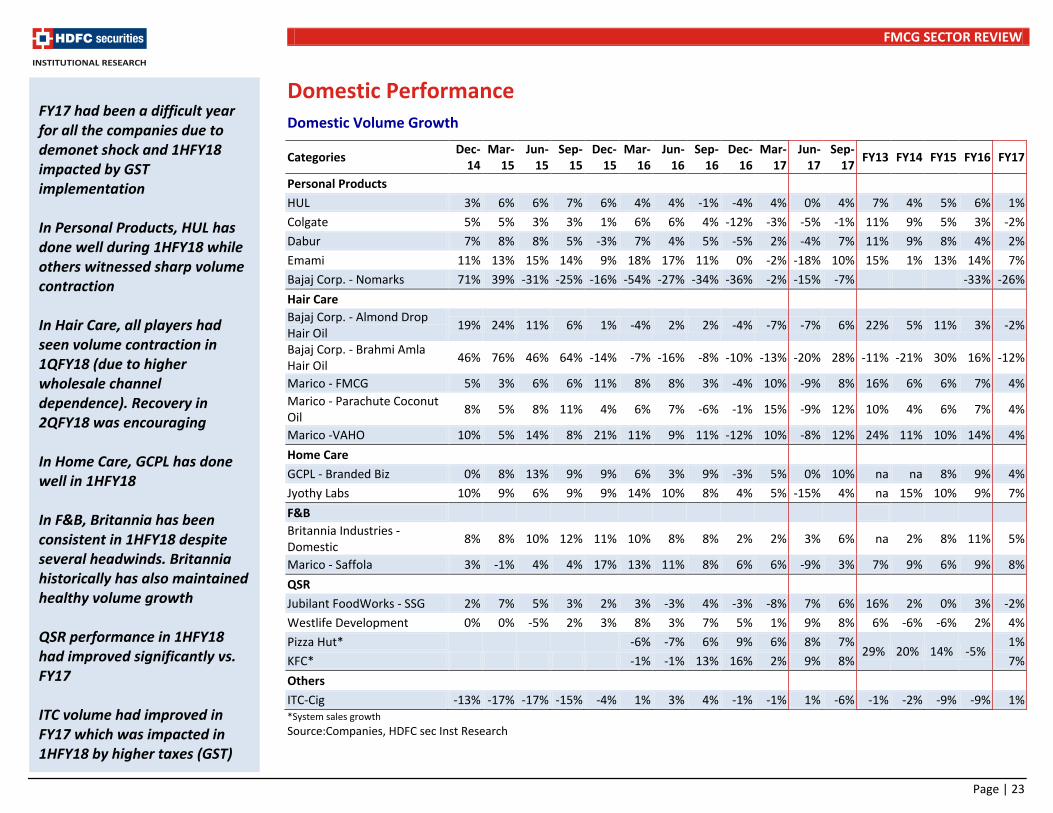
Domestic Performance Domestic Volume Growth
Categories Dec-
14 Mar-
15 Jun-
15 Sep-
15 Dec-
15 Mar-
16 Jun-
16 Sep-
16 Dec-
16 Mar-
17 Jun-
17 Sep-
17 FY13 FY14 FY15 FY16 FY17
Personal Products
HUL 3% 6% 6% 7% 6% 4% 4% -1% -4% 4% 0% 4% 7% 4% 5% 6% 1%
Colgate 5% 5% 3% 3% 1% 6% 6% 4% -12% -3% -5% -1% 11% 9% 5% 3% -2%
Dabur 7% 8% 8% 5% -3% 7% 4% 5% -5% 2% -4% 7% 11% 9% 8% 4% 2%
Emami 11% 13% 15% 14% 9% 18% 17% 11% 0% -2% -18% 10% 15% 1% 13% 14% 7%
Bajaj Corp. - Nomarks 71% 39% -31% -25% -16% -54% -27% -34% -36% -2% -15% -7% -33% -26%
Hair Care
Bajaj Corp. - Almond Drop Hair Oil
19% 24% 11% 6% 1% -4% 2% 2% -4% -7% -7% 6% 22% 5% 11% 3% -2%
Bajaj Corp. - Brahmi Amla Hair Oil
46% 76% 46% 64% -14% -7% -16% -8% -10% -13% -20% 28% -11% -21% 30% 16% -12%
Marico - FMCG 5% 3% 6% 6% 11% 8% 8% 3% -4% 10% -9% 8% 16% 6% 6% 7% 4%
Marico - Parachute Coconut Oil
8% 5% 8% 11% 4% 6% 7% -6% -1% 15% -9% 12% 10% 4% 6% 7% 4%
Marico -VAHO 10% 5% 14% 8% 21% 11% 9% 11% -12% 10% -8% 12% 24% 11% 10% 14% 4%
Home Care
GCPL - Branded Biz 0% 8% 13% 9% 9% 6% 3% 9% -3% 5% 0% 10% na na 8% 9% 4%
Jyothy Labs 10% 9% 6% 9% 9% 14% 10% 8% 4% 5% -15% 4% na 15% 10% 9% 7%
F&B
Britannia Industries - Domestic
8% 8% 10% 12% 11% 10% 8% 8% 2% 2% 3% 6% na 2% 8% 11% 5%
Marico - Saffola 3% -1% 4% 4% 17% 13% 11% 8% 6% 6% -9% 3% 7% 9% 6% 9% 8%
QSR
Jubilant FoodWorks - SSG 2% 7% 5% 3% 2% 3% -3% 4% -3% -8% 7% 6% 16% 2% 0% 3% -2%
Westlife Development 0% 0% -5% 2% 3% 8% 3% 7% 5% 1% 9% 8% 6% -6% -6% 2% 4%
Pizza Hut*
-6% -7% 6% 9% 6% 8% 7% 29% 20% 14% -5%
1%
KFC* -1% -1% 13% 16% 2% 9% 8% 7%
Others
ITC-Cig -13% -17% -17% -15% -4% 1% 3% 4% -1% -1% 1% -6% -1% -2% -9% -9% 1% *System sales growth
Source:Companies, HDFC sec Inst Research
FY17 had been a difficult year for all the companies due to demonet shock and 1HFY18 impacted by GST implementation In Personal Products, HUL has done well during 1HFY18 while others witnessed sharp volume contraction In Hair Care, all players had seen volume contraction in 1QFY18 (due to higher wholesale channel dependence). Recovery in 2QFY18 was encouraging In Home Care, GCPL has done well in 1HFY18 In F&B, Britannia has been consistent in 1HFY18 despite several headwinds. Britannia historically has also maintained healthy volume growth QSR performance in 1HFY18 had improved significantly vs. FY17 ITC volume had improved in FY17 which was impacted in 1HFY18 by higher taxes (GST)
FMCG SECTOR REVIEW
Page | 24
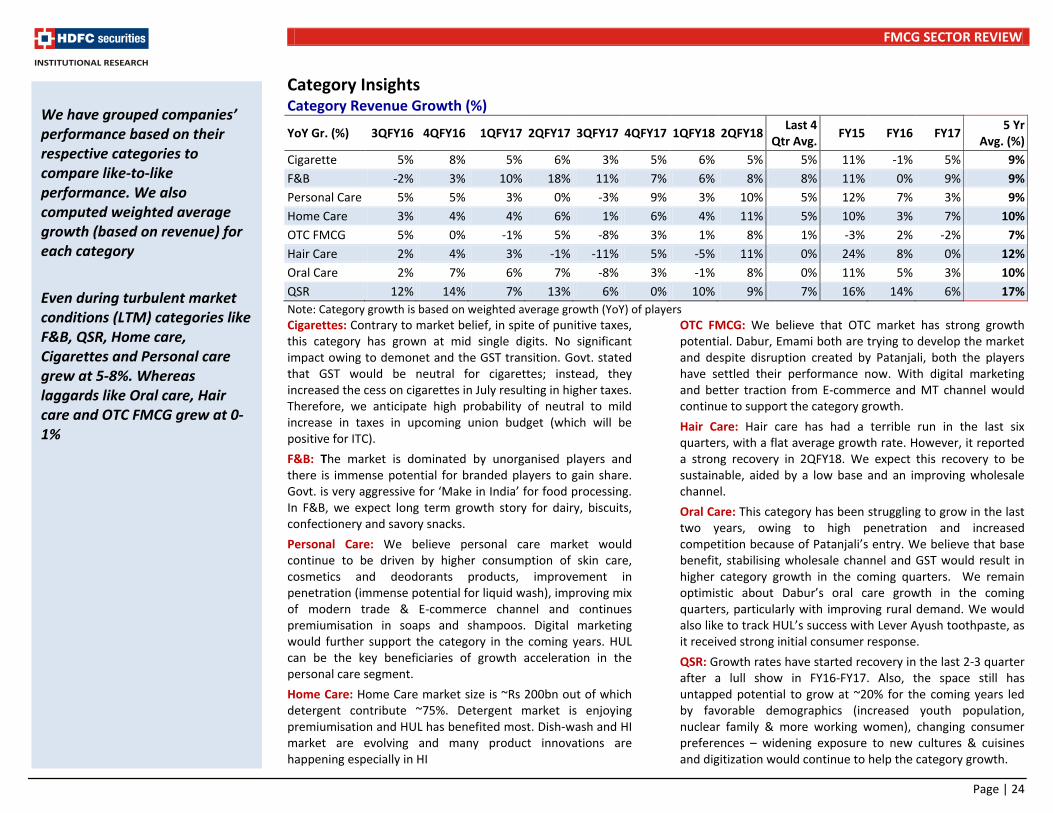
Category Insights Category Revenue Growth (%)
YoY Gr. (%) 3QFY16 4QFY16 1QFY17 2QFY17 3QFY17 4QFY17 1QFY18 2QFY18 Last 4
Qtr Avg. FY15 FY16 FY17
5 Yr Avg. (%)
Cigarette 5% 8% 5% 6% 3% 5% 6% 5% 5% 11% -1% 5% 9%
F&B -2% 3% 10% 18% 11% 7% 6% 8% 8% 11% 0% 9% 9%
Personal Care 5% 5% 3% 0% -3% 9% 3% 10% 5% 12% 7% 3% 9%
Home Care 3% 4% 4% 6% 1% 6% 4% 11% 5% 10% 3% 7% 10%
OTC FMCG 5% 0% -1% 5% -8% 3% 1% 8% 1% -3% 2% -2% 7%
Hair Care 2% 4% 3% -1% -11% 5% -5% 11% 0% 24% 8% 0% 12%
Oral Care 2% 7% 6% 7% -8% 3% -1% 8% 0% 11% 5% 3% 10%
QSR 12% 14% 7% 13% 6% 0% 10% 9% 7% 16% 14% 6% 17%
Note: Category growth is based on weighted average growth (YoY) of players
Cigarettes: Contrary to market belief, in spite of punitive taxes, this category has grown at mid single digits. No significant impact owing to demonet and the GST transition. Govt. stated that GST would be neutral for cigarettes; instead, they increased the cess on cigarettes in July resulting in higher taxes. Therefore, we anticipate high probability of neutral to mild increase in taxes in upcoming union budget (which will be positive for ITC).
F&B: The market is dominated by unorganised players and there is immense potential for branded players to gain share. Govt. is very aggressive for ‘Make in India’ for food processing. In F&B, we expect long term growth story for dairy, biscuits, confectionery and savory snacks.
Personal Care: We believe personal care market would continue to be driven by higher consumption of skin care, cosmetics and deodorants products, improvement in penetration (immense potential for liquid wash), improving mix of modern trade & E-commerce channel and continues premiumisation in soaps and shampoos. Digital marketing would further support the category in the coming years. HUL can be the key beneficiaries of growth acceleration in the personal care segment.
Home Care: Home Care market size is ~Rs 200bn out of which detergent contribute ~75%. Detergent market is enjoying premiumisation and HUL has benefited most. Dish-wash and HI market are evolving and many product innovations are happening especially in HI
OTC FMCG: We believe that OTC market has strong growth potential. Dabur, Emami both are trying to develop the market and despite disruption created by Patanjali, both the players have settled their performance now. With digital marketing and better traction from E-commerce and MT channel would continue to support the category growth.
Hair Care: Hair care has had a terrible run in the last six quarters, with a flat average growth rate. However, it reported a strong recovery in 2QFY18. We expect this recovery to be sustainable, aided by a low base and an improving wholesale channel.
Oral Care: This category has been struggling to grow in the last two years, owing to high penetration and increased competition because of Patanjali’s entry. We believe that base benefit, stabilising wholesale channel and GST would result in higher category growth in the coming quarters. We remain optimistic about Dabur’s oral care growth in the coming quarters, particularly with improving rural demand. We would also like to track HUL’s success with Lever Ayush toothpaste, as it received strong initial consumer response.
QSR: Growth rates have started recovery in the last 2-3 quarter after a lull show in FY16-FY17. Also, the space still has untapped potential to grow at ~20% for the coming years led by favorable demographics (increased youth population, nuclear family & more working women), changing consumer preferences – widening exposure to new cultures & cuisines and digitization would continue to help the category growth.
We have grouped companies’ performance based on their respective categories to compare like-to-like performance. We also computed weighted average growth (based on revenue) for each category
Even during turbulent market conditions (LTM) categories like F&B, QSR, Home care, Cigarettes and Personal care grew at 5-8%. Whereas laggards like Oral care, Hair care and OTC FMCG grew at 0-1%
FMCG SECTOR REVIEW
Page | 25
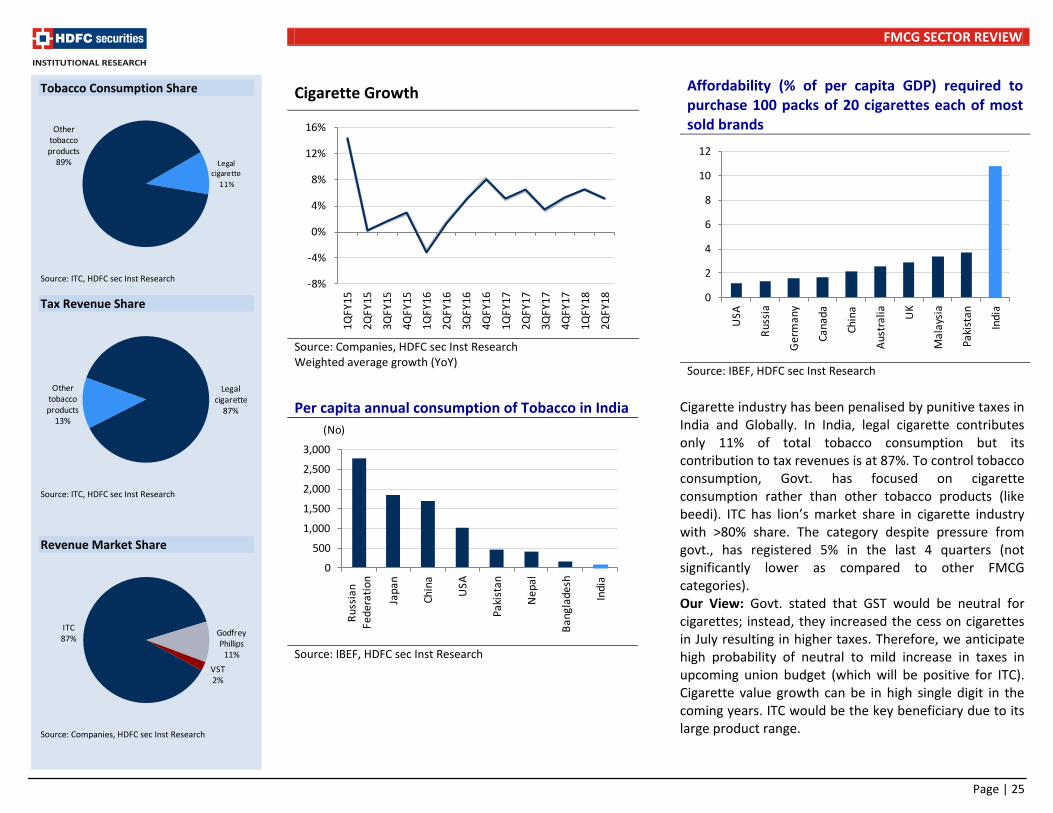
Cigarette Growth
Source: Companies, HDFC sec Inst Research Weighted average growth (YoY)
Per capita annual consumption of Tobacco in India
Source: IBEF, HDFC sec Inst Research
Affordability (% of per capita GDP) required to purchase 100 packs of 20 cigarettes each of most sold brands
Source: IBEF, HDFC sec Inst Research
Cigarette industry has been penalised by punitive taxes in India and Globally. In India, legal cigarette contributes only 11% of total tobacco consumption but its contribution to tax revenues is at 87%. To control tobacco consumption, Govt. has focused on cigarette consumption rather than other tobacco products (like beedi). ITC has lion’s market share in cigarette industry with >80% share. The category despite pressure from govt., has registered 5% in the last 4 quarters (not significantly lower as compared to other FMCG categories). Our View: Govt. stated that GST would be neutral for cigarettes; instead, they increased the cess on cigarettes in July resulting in higher taxes. Therefore, we anticipate high probability of neutral to mild increase in taxes in upcoming union budget (which will be positive for ITC). Cigarette value growth can be in high single digit in the coming years. ITC would be the key beneficiary due to its large product range.
Tobacco Consumption Share
Source: ITC, HDFC sec Inst Research
Tax Revenue Share
Source: ITC, HDFC sec Inst Research
Revenue Market Share
Source: Companies, HDFC sec Inst Research
Legal cigarette
11%
Other tobacco products
89%
Legal cigarette
87%
Other tobacco products
13%
ITC87%
Godfrey Phillips
11%
VST2%
-8%
-4%
0%
4%
8%
12%
16%
1QFY
15
2QFY
15
3QFY
15
4QFY
15
1QFY
16
2QFY
16
3QFY
16
4QFY
16
1QFY
17
2QFY
17
3QFY
17
4QFY
17
1QFY
18
2QFY
18
0
500
1,000
1,500
2,000
2,500
3,000
Rus
sian
Fede
rati
on
Japa
n
Chin
a
USA
Paki
stan
Nep
al
Ban
glad
esh
Indi
a
(No)
0
2
4
6
8
10
12
USA
Rus
sia
Ger
man
y
Cana
da
Chin
a
Aus
tral
ia UK
Mal
aysi
a
Paki
stan
Indi
a

FMCG SECTOR REVIEW
Page | 26
Change In Legal Cigarette Consumption
Period Total domestic tobacco consumption
including illegal cigarette (Mn Kgs)
Legal cigarette consumption (Mn Kgs)
% share of legal cigarette in total tobacco consumption
1981-82 406 86 21% 2009-10 499 73 15% 2014-15 562 62 11% Source:ITC
Legal cigarette share of total tobacco consumption Illegal Cigarette Volumes in India (Bn Sticks)
Source: Tobacco Institute India, HDFC sec Inst Research
Source: Tobacco Institute India, HDFC sec Inst Research
Revenue Gr. (%)
Brands 1Q
FY15 2Q
FY15 3Q
FY15 4Q
FY15 1Q
FY16 2Q
FY16 3Q
FY16 4Q
FY16 1Q
FY17 2Q
FY17 3Q
FY17 4Q
FY17 1Q
FY18 2Q
FY18 Avg.
4 Qtr
ITC Cigarette Gold Flake, Classic, Wills 14% 1% 3% 1% -1% 2% 6% 10% 6% 7% 2% 5% 7% 2% 4%
Godfrey Phillips
Cigarette Marlboro 14% -5% -18% 27% -17% -1% -3% -12% -13% -1% 12% 14% 11% 32% 17%
VST Cigarette Charms, Charminar, Gold, Moments, Zaffran
21% -3% -7% 16% -11% 0% 10% 23% 33% 13% 8% -18% -16% -2% -7%
Weighted Avg Gr. (%)
14% 0% 2% 3% -3% 1% 5% 8% 5% 6% 3% 5% 6% 5% 5%
Source:Companies, HDFC sec Inst Research
21%19%
16%15%
11%
0%
5%
10%
15%
20%
25%
1981-82 1994-95 1998-99 2005-06 2014-15
11.112.5 13.5
14.616.7 17.5 18.3
19.520.8 21.8 22.8
23.9
0
5
10
15
20
25
30
20
04
20
05
20
06
20
07
20
08
20
09
20
10
20
11
20
12
20
13
20
14
20
15
India is the 4th largest illegal cigarette market in the world Effective tax on tobacco consumption
Source: Tobacco Institute India, HDFC sec Inst Research
Illegal cigarettes contribute >20% of the market now, as compared to ~16% in 2010
81
Cigarette Other Tobacco Products
(Rs/kg) 4,159
FMCG SECTOR REVIEW
Page | 27
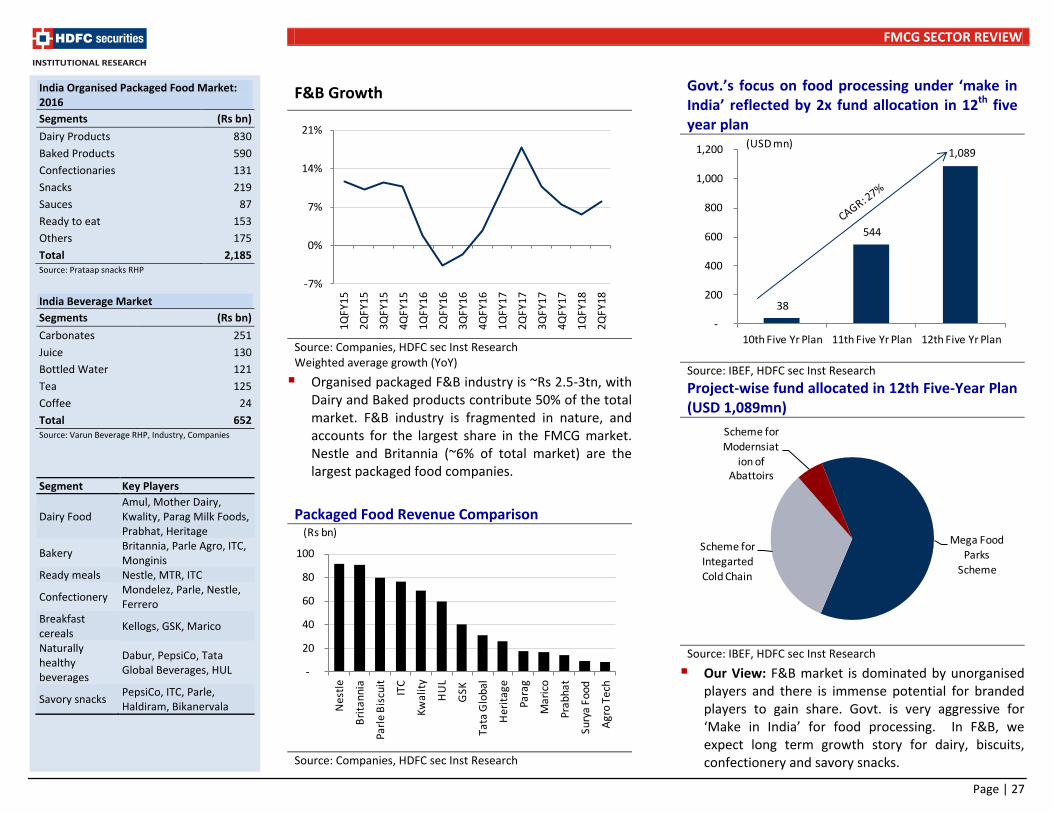
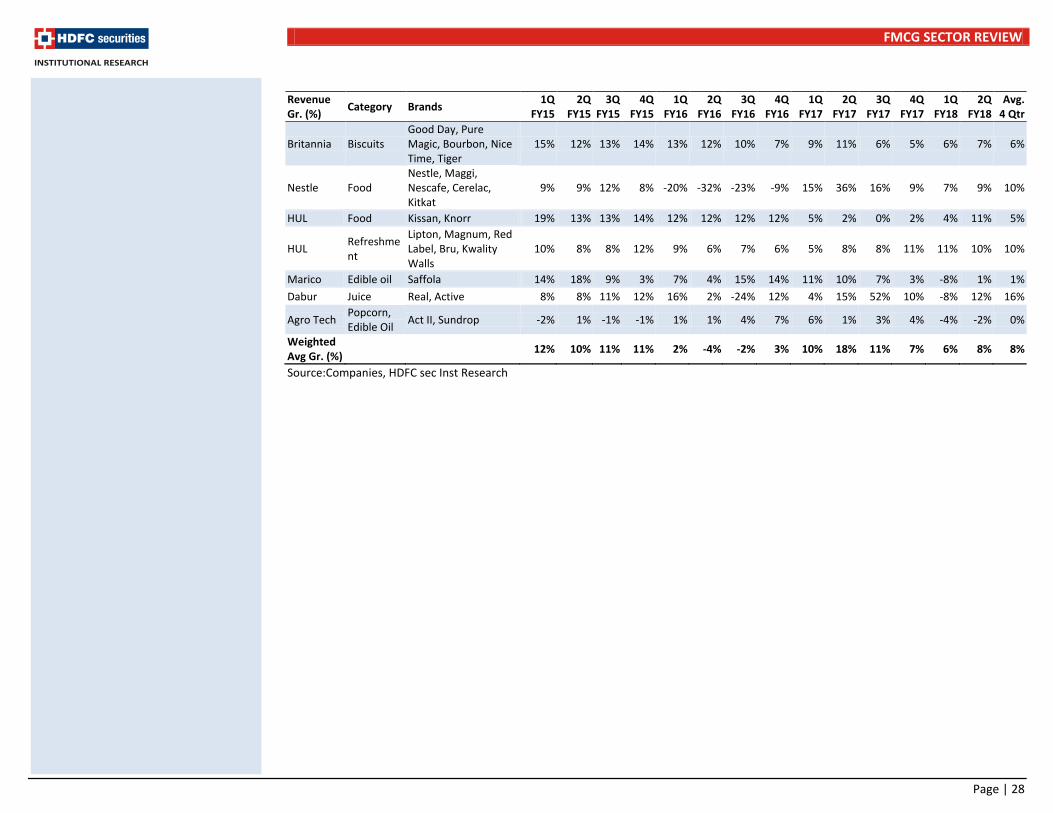
F&B Growth
Source: Companies, HDFC sec Inst Research Weighted average growth (YoY)
Organised packaged F&B industry is ~Rs 2.5-3tn, with Dairy and Baked products contribute 50% of the total market. F&B industry is fragmented in nature, and accounts for the largest share in the FMCG market. Nestle and Britannia (~6% of total market) are the largest packaged food companies.
Packaged Food Revenue Comparison
Source: Companies, HDFC sec Inst Research
Govt.’s focus on food processing under ‘make in India’ reflected by 2x fund allocation in 12th five year plan
Source: IBEF, HDFC sec Inst Research
Project-wise fund allocated in 12th Five-Year Plan (USD 1,089mn)
Source: IBEF, HDFC sec Inst Research
Our View: F&B market is dominated by unorganised players and there is immense potential for branded players to gain share. Govt. is very aggressive for ‘Make in India’ for food processing. In F&B, we expect long term growth story for dairy, biscuits, confectionery and savory snacks.
India Organised Packaged Food Market: 2016
Segments (Rs bn)
Dairy Products 830
Baked Products 590
Confectionaries 131
Snacks 219
Sauces 87
Ready to eat 153
Others 175
Total 2,185 Source: Prataap snacks RHP
India Beverage Market
Segments (Rs bn)
Carbonates 251
Juice 130
Bottled Water 121
Tea 125
Coffee 24
Total 652 Source: Varun Beverage RHP, Industry, Companies
Segment Key Players
Dairy Food Amul, Mother Dairy, Kwality, Parag Milk Foods, Prabhat, Heritage
Bakery Britannia, Parle Agro, ITC, Monginis
Ready meals Nestle, MTR, ITC
Confectionery Mondelez, Parle, Nestle, Ferrero
Breakfast cereals
Kellogs, GSK, Marico
Naturally healthy beverages
Dabur, PepsiCo, Tata Global Beverages, HUL
Savory snacks PepsiCo, ITC, Parle, Haldiram, Bikanervala
-7%
0%
7%
14%
21%
1QFY
15
2QFY
15
3QFY
15
4QFY
15
1QFY
16
2QFY
16
3QFY
16
4QFY
16
1QFY
17
2QFY
17
3QFY
17
4QFY
17
1QFY
18
2QFY
18
-
20
40
60
80
100
Nes
tle
Bri
tann
ia
Parl
e B
iscu
it
ITC
Kwal
ity
HU
L
GSK
Tata
Glo
bal
Her
itag
e
Para
g
Mar
ico
Prab
hat
Sury
a Fo
od
Agr
o Te
ch
(Rs bn)
38
544
1,089
-
200
400
600
800
1,000
1,200
10th Five Yr Plan 11th Five Yr Plan 12th Five Yr Plan
(USD mn)
Mega Food
Parks
Scheme
Scheme for
Integarted
Cold Chain
Scheme forModernsiat
ion ofAbattoirs
FMCG SECTOR REVIEW
Page | 28
Revenue Gr. (%)
Category Brands 1Q
FY15 2Q
FY15 3Q
FY15 4Q
FY15 1Q
FY16 2Q
FY16 3Q
FY16 4Q
FY16 1Q
FY17 2Q
FY17 3Q
FY17 4Q
FY17 1Q
FY18 2Q
FY18 Avg.
4 Qtr
Britannia Biscuits Good Day, Pure Magic, Bourbon, Nice Time, Tiger
15% 12% 13% 14% 13% 12% 10% 7% 9% 11% 6% 5% 6% 7% 6%
Nestle Food Nestle, Maggi, Nescafe, Cerelac, Kitkat
9% 9% 12% 8% -20% -32% -23% -9% 15% 36% 16% 9% 7% 9% 10%
HUL Food Kissan, Knorr 19% 13% 13% 14% 12% 12% 12% 12% 5% 2% 0% 2% 4% 11% 5%
HUL Refreshment
Lipton, Magnum, Red Label, Bru, Kwality Walls
10% 8% 8% 12% 9% 6% 7% 6% 5% 8% 8% 11% 11% 10% 10%
Marico Edible oil Saffola 14% 18% 9% 3% 7% 4% 15% 14% 11% 10% 7% 3% -8% 1% 1%
Dabur Juice Real, Active 8% 8% 11% 12% 16% 2% -24% 12% 4% 15% 52% 10% -8% 12% 16%
Agro Tech Popcorn, Edible Oil
Act II, Sundrop -2% 1% -1% -1% 1% 1% 4% 7% 6% 1% 3% 4% -4% -2% 0%
Weighted Avg Gr. (%)
12% 10% 11% 11% 2% -4% -2% 3% 10% 18% 11% 7% 6% 8% 8%
Source:Companies, HDFC sec Inst Research
FMCG SECTOR REVIEW
Page | 29
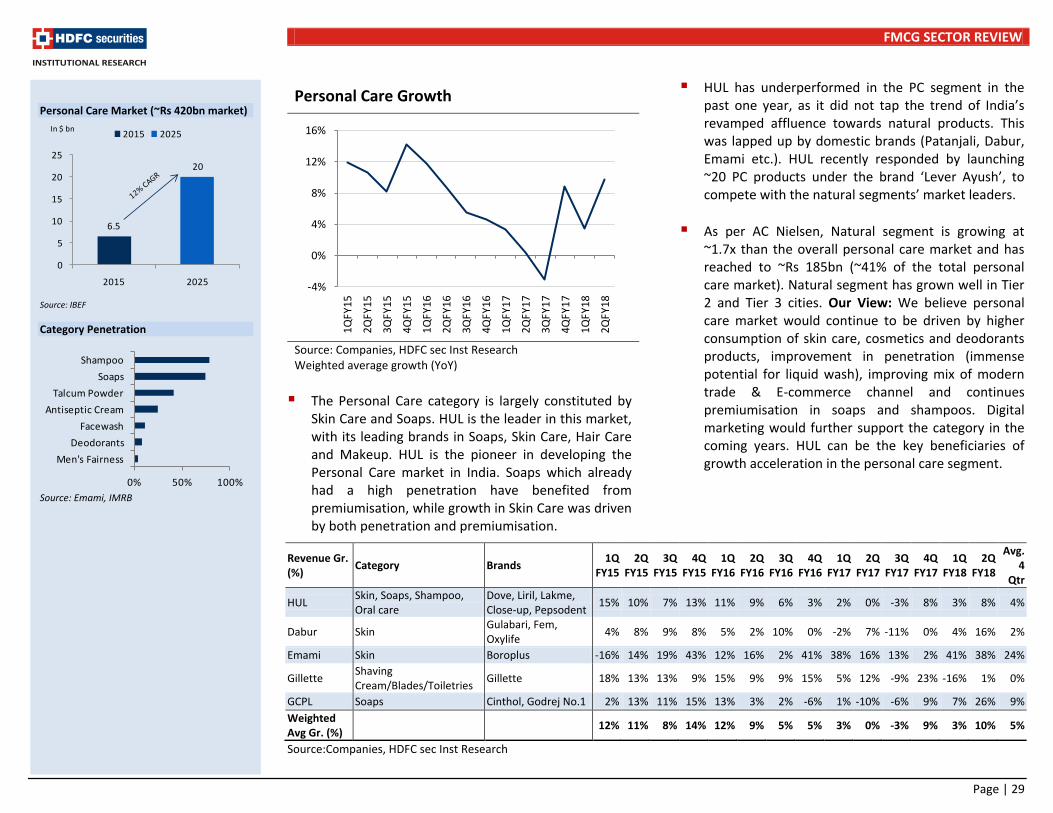
Personal Care Growth
Source: Companies, HDFC sec Inst Research Weighted average growth (YoY)
The Personal Care category is largely constituted by Skin Care and Soaps. HUL is the leader in this market, with its leading brands in Soaps, Skin Care, Hair Care and Makeup. HUL is the pioneer in developing the Personal Care market in India. Soaps which already had a high penetration have benefited from premiumisation, while growth in Skin Care was driven by both penetration and premiumisation.
HUL has underperformed in the PC segment in the past one year, as it did not tap the trend of India’s revamped affluence towards natural products. This was lapped up by domestic brands (Patanjali, Dabur, Emami etc.). HUL recently responded by launching ~20 PC products under the brand ‘Lever Ayush’, to compete with the natural segments’ market leaders.
As per AC Nielsen, Natural segment is growing at ~1.7x than the overall personal care market and has reached to ~Rs 185bn (~41% of the total personal care market). Natural segment has grown well in Tier 2 and Tier 3 cities. Our View: We believe personal care market would continue to be driven by higher consumption of skin care, cosmetics and deodorants products, improvement in penetration (immense potential for liquid wash), improving mix of modern trade & E-commerce channel and continues premiumisation in soaps and shampoos. Digital marketing would further support the category in the coming years. HUL can be the key beneficiaries of growth acceleration in the personal care segment.
Revenue Gr. (%)
Category Brands 1Q
FY15 2Q
FY15 3Q
FY15 4Q
FY15 1Q
FY16 2Q
FY16 3Q
FY16 4Q
FY16 1Q
FY17 2Q
FY17 3Q
FY17 4Q
FY17 1Q
FY18 2Q
FY18
Avg. 4
Qtr
HUL Skin, Soaps, Shampoo, Oral care
Dove, Liril, Lakme, Close-up, Pepsodent
15% 10% 7% 13% 11% 9% 6% 3% 2% 0% -3% 8% 3% 8% 4%
Dabur Skin Gulabari, Fem, Oxylife
4% 8% 9% 8% 5% 2% 10% 0% -2% 7% -11% 0% 4% 16% 2%
Emami Skin Boroplus -16% 14% 19% 43% 12% 16% 2% 41% 38% 16% 13% 2% 41% 38% 24%
Gillette Shaving Cream/Blades/Toiletries
Gillette 18% 13% 13% 9% 15% 9% 9% 15% 5% 12% -9% 23% -16% 1% 0%
GCPL Soaps Cinthol, Godrej No.1 2% 13% 11% 15% 13% 3% 2% -6% 1% -10% -6% 9% 7% 26% 9%
Weighted Avg Gr. (%)
12% 11% 8% 14% 12% 9% 5% 5% 3% 0% -3% 9% 3% 10% 5%
Source:Companies, HDFC sec Inst Research
Personal Care Market (~Rs 420bn market)
Source: IBEF
Category Penetration
Source: Emami, IMRB
6.5
20
0
5
10
15
20
25
2015 2025
2015 2025In $ bn
0% 50% 100%
Men's Fairness
Deodorants
Facewash
Antiseptic Cream
Talcum Powder
Soaps
Shampoo
-4%
0%
4%
8%
12%
16%
1QFY
15
2QFY
15
3QFY
15
4QFY
15
1QFY
16
2QFY
16
3QFY
16
4QFY
16
1QFY
17
2QFY
17
3QFY
17
4QFY
17
1QFY
18
2QFY
18

FMCG SECTOR REVIEW
Page | 30
Home Care Growth
Source: Companies, HDFC sec Inst Research Weighted average growth (YoY)
Premiumisation-driven Growth In Detergents
Source: Jyothy Labs AR (A.C. Nielsen), HDFC sec Inst Research
Detergent is the largest category under homecare, with a market size of ~Rs 200bn. HUL is the leading player, with ~40% market share. Detergents have attained a high penetration rate, owing to which the category has grown in low-single digit volume
growth. The growth has been led by premiumisation across both rural and urban areas.
Our View: Premium detergent is 3x in terms of pricing and 1/4th in terms of market size as compared to mass products. The penetration of washing machines is at ~11%. With growing disposable income and cheaper financing, we see significant scope for washing machine penetration. Hence, we believe that premiumisation-driven growth in detergents would continue in the coming years.
Detergent Volume
Source: Jyothy Labs AR (A.C. Nielsen), HDFC sec Inst Research
Detergent Market: Opportunity For Upgradation
Source: HUL, HDFC sec Inst Research
Premium
Mid
Mass
3X
1.5X
X
Price Index
Y
1.5Y
4Y
Market Size
Home Care market size is ~Rs 200bn out of which detergent contribute ~75%. Detergent market is enjoying premiumisation and HUL has benefited most. Dish-wash and HI market are evolving and many product innovations are happening especially in HI Detergent Price and Mix Led Growth
Source: Jyothy Labs
Detergent Market Share
Source: Jyothy Labs
Detergent premium products are 3x in terms of pricing and 1/4th in terms of size, as compared to mass products
0%
5%
9%
14%
18%
CY11 CY12 CY13 CY14 CY15
Urban Rural Total
HUL
Rohit Surfactant
(Ghari)
P&G
Jyothy Nirma
0%
4%
8%
12%
16%
1QFY
15
2QFY
15
3QFY
15
4QFY
15
1QFY
16
2QFY
16
3QFY
16
4QFY
16
1QFY
17
2QFY
17
3QFY
17
4QFY
17
1QFY
18
2QFY
18
12% 23%
10%4%
7%10%
19% 11%
10%12%
-
20,000
40,000
60,000
80,000
100,000
120,000
140,000
160,000
CY11 CY12 CY13 CY14 CY15
Urban Rural(Rs mn)
11%21%
7%10%
9%
1% 8%
2%-3%
4%
-3%3%
2%2%
8%
-
500,000
1,000,000
1,500,000
2,000,000
2,500,000
CY11 CY12 CY13 CY14 CY15
Urban Rural(mt)
-1%5%
-1%4%
6%

FMCG SECTOR REVIEW
Page | 31
Dishwash market is ~Rs 26bn out of which Bar contributes ~85% and Liquid ~15%. Overall market in the last 4 years has witnessed 11% CAGR while Liquid registered 21%.
Our View: We believe market would continue to shift towards liquid wash in the coming years. With improving penetration, higher share of liquid dishwash and shift from unconventional (ash, mud) to conventional methods in rural market, would continue to maintain healthy growth in coming years.
Liquid Dishwash Gaining Share
Source: Jyothy Labs AR (A.C. Nielsen), HDFC sec Inst Research
Household Insecticide (HI) market is ~Rs 35bn, coils contribute ~44%, liquid 46% and cards 10%. HI market has registered 8% CAGR in the last 4 years
with coils reported flat, liquid 11% and cards 79% growth. HI market is dominated by 4 players who hold 80% market share, namely Godrej Consumer Products, SC Johnson, Reckitt Benckiser and Jyothy Labs. Godrej is the leading player in this market, with >50% share.
Our View: Mosquito repellent players have launched innovative products in the premium category. Mosquito repellents’ penetration is <30% in rural areas, as they substitute with natural remedies. However, with lower price points and innovative products (Rs 1 per card), penetration is set to rise.
Liquid And Card Mosquito Repellent Gaining Share
Source: Jyothy Labs AR (A.C. Nielsen), HDFC sec Inst Research
Revenue Gr. (%)
Category Brands 1Q
FY15 2Q
FY15 3Q
FY15 4Q
FY15 1Q
FY16 2Q
FY16 3Q
FY16 4Q
FY16 1Q
FY17 2Q
FY17 3Q
FY17 4Q
FY17 1Q
FY18 2Q
FY18 Avg.
4 Qtr
HUL Detergent, Dishwash
Surf, Rin, Wheel, Vim 13% 11% 6% 5% 0% 2% 1% 2% 7% 3% 1% 7% 6% 13% 7%
GCPL HI GoodKnight 9% 2% 16% 11% 15% 13% 15% 10% -11% 18% -2% 4% 4% 4% 3%
Dabur HI Odonil, Odomos, Sanifresh 22% 29% 12% 20% 12% 12% 8% 19% 2% 20% 5% -7% 6% 10% 4%
Jyothy Fabric Care Ujala whitener, Henko detergent, Mr. White, Ujala Detergent
20% 14% 13% 7% 5% 12% 1% 13% 11% 3% 10% 8% -15% 4% 2%
Jyothy Dishwashing Pril, Exo 24% 17% 14% 16% 18% 10% 9% 12% 10% 15% 3% 4% -14% 12% 1%
Jyothy Mosquito Repellent
Maxo 19% 6% 48% 16% -2% 14% 32% 18% -11% 8% -15% -6% -19% 3% -10%
Weighted Avg Gr. (%) 13% 11% 8% 6% 3% 4% 3% 4% 4% 6% 1% 6% 4% 11% 5%
Dishwash continues to witness healthy traction from premiumisation in the form of Liquid Wash Dishwash Market Share
Source: Jyothy Labs AR
HI market is ~Rs 35bn out of which coils contribute to ~44%, liquid to 46% and cards 10% HI Market Share
Source: Jyothy Labs AR
HUL
Jyothy Labs
Others
Good Knight
All Out
Mortein
Maxo
27% 13%
13%8%
3%
38%31%
11% 15% 10%
-
5,000
10,000
15,000
20,000
25,000
30,000
CY12 CY13 CY14 CY15 CY16
Bar Liquid(Rs mn)
28%15%
9%12%
4%
10% 2% -3% 0% 0%
10% 10% 11% 11%
-
10,000
20,000
30,000
40,000
CY12 CY13 CY14 CY15 CY16
Coils Liquid Card(Rs mn)
10% 8%11%4%
7%
164%21%
FMCG SECTOR REVIEW
Page | 32
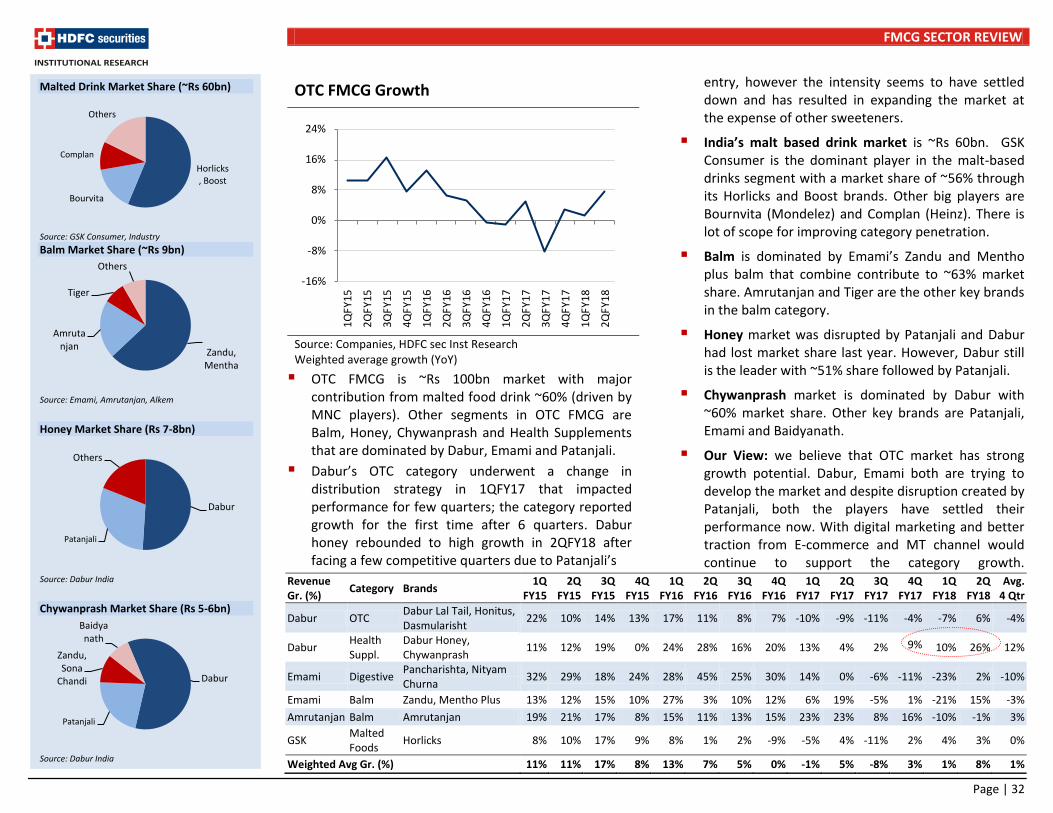
OTC FMCG Growth
Source: Companies, HDFC sec Inst Research Weighted average growth (YoY)
OTC FMCG is ~Rs 100bn market with major contribution from malted food drink ~60% (driven by MNC players). Other segments in OTC FMCG are Balm, Honey, Chywanprash and Health Supplements that are dominated by Dabur, Emami and Patanjali.
Dabur’s OTC category underwent a change in distribution strategy in 1QFY17 that impacted performance for few quarters; the category reported growth for the first time after 6 quarters. Dabur honey rebounded to high growth in 2QFY18 after facing a few competitive quarters due to Patanjali’s
entry, however the intensity seems to have settled down and has resulted in expanding the market at the expense of other sweeteners.
India’s malt based drink market is ~Rs 60bn. GSK Consumer is the dominant player in the malt-based drinks segment with a market share of ~56% through its Horlicks and Boost brands. Other big players are Bournvita (Mondelez) and Complan (Heinz). There is lot of scope for improving category penetration.
Balm is dominated by Emami’s Zandu and Mentho plus balm that combine contribute to ~63% market share. Amrutanjan and Tiger are the other key brands in the balm category.
Honey market was disrupted by Patanjali and Dabur had lost market share last year. However, Dabur still is the leader with ~51% share followed by Patanjali.
Chywanprash market is dominated by Dabur with ~60% market share. Other key brands are Patanjali, Emami and Baidyanath.
Our View: we believe that OTC market has strong growth potential. Dabur, Emami both are trying to develop the market and despite disruption created by Patanjali, both the players have settled their performance now. With digital marketing and better traction from E-commerce and MT channel would continue to support the category growth.
Revenue Gr. (%)
Category Brands 1Q
FY15 2Q
FY15 3Q
FY15 4Q
FY15 1Q
FY16 2Q
FY16 3Q
FY16 4Q
FY16 1Q
FY17 2Q
FY17 3Q
FY17 4Q
FY17 1Q
FY18 2Q
FY18 Avg.
4 Qtr
Dabur OTC Dabur Lal Tail, Honitus, Dasmularisht
22% 10% 14% 13% 17% 11% 8% 7% -10% -9% -11% -4% -7% 6% -4%
Dabur Health Suppl.
Dabur Honey, Chywanprash
11% 12% 19% 0% 24% 28% 16% 20% 13% 4% 2% 9% 10% 26% 12%
Emami Digestive Pancharishta, Nityam Churna
32% 29% 18% 24% 28% 45% 25% 30% 14% 0% -6% -11% -23% 2% -10%
Emami Balm Zandu, Mentho Plus 13% 12% 15% 10% 27% 3% 10% 12% 6% 19% -5% 1% -21% 15% -3%
Amrutanjan Balm Amrutanjan 19% 21% 17% 8% 15% 11% 13% 15% 23% 23% 8% 16% -10% -1% 3%
GSK Malted Foods
Horlicks 8% 10% 17% 9% 8% 1% 2% -9% -5% 4% -11% 2% 4% 3% 0%
Weighted Avg Gr. (%) 11% 11% 17% 8% 13% 7% 5% 0% -1% 5% -8% 3% 1% 8% 1%
Malted Drink Market Share (~Rs 60bn)
Source: GSK Consumer, Industry
Balm Market Share (~Rs 9bn)
Source: Emami, Amrutanjan, Alkem
Honey Market Share (Rs 7-8bn)
Source: Dabur India
Chywanprash Market Share (Rs 5-6bn)
Source: Dabur India
Horlicks, Boost
Bourvita
Complan
Others
Zandu, Mentha
Amrutanjan
Tiger
Others
Dabur
Patanjali
Others
Dabur
Patanjali
Zandu, Sona
Chandi
Baidyanath
-16%
-8%
0%
8%
16%
24%
1QFY
15
2QFY
15
3QFY
15
4QFY
15
1QFY
16
2QFY
16
3QFY
16
4QFY
16
1QFY
17
2QFY
17
3QFY
17
4QFY
17
1QFY
18
2QFY
18

FMCG SECTOR REVIEW
Page | 33
Hair Care Growth
Source: Companies, HDFC sec Inst Research Weighted average growth (YoY)
The size of the Hair Care market is ~Rs 200bn, It is dominated by Hair Oil, which comprises ~50% of the Hair Care market, followed by Shampoo 30%, Hair Dyes ~17% and Hair Conditioner ~3%.
The category has witnessed significant pressure in the last 4-5 quarters, and recovered strongly in 2QFY18 owing to high inflation in Coconut Oil.
Hair Oil Value And Volume Growth
Source: Bajaj Corp, HDFC sec Inst Research
Our View: We believe that base benefit, stabilising wholesale channel and GST implementation would result in healthier growth in the coming quarters.
Revenue Gr. (%)
Category Brands 1Q
FY15 2Q
FY15 3Q
FY15 4Q
FY15 1Q
FY16 2Q
FY16 3Q
FY16 4Q
FY16 1Q
FY17 2Q
FY17 3Q
FY17 4Q
FY17 1Q
FY18 2Q
FY18 Avg.
4 Qtr
Marico Coconut Parachute Coconut Oil (Rigid Pack)
41% 55% 48% 34% 16% 9% -1% -5% -12% -19% -12% 11% 3% 26% 7%
Marico VAHO Hair Care, Nihar 28% 33% 25% 14% 19% 9% 20% 12% 9% 11% -13% 9% -7% 12% 0%
Bajaj Corp LHO Almond Drop 5% 10% 25% 28% 16% 11% 4% 0% 3% 5% -10% -2% -3% 4% -3%
Dabur Hair Oil/Shampoo
Dabur Amla, Almond, Vatika
8% 14% 12% 7% 13% 9% -11% 10% 1% -5% -20% -4% -11% 2% -8%
Emami Hair Oil Navratana 14% 22% 27% 14% 17% 0% -6% 4% 8% -3% -4% 5% -15% 16% 1%
Emami Hair Oil Kesh King
50% 50% 2% 1% -28% -16% -10%
GCPL Hair Colors Godrej 15% 9% 10% 12% 12% 17% -1% 7% 4% 0% -2% 13% 5% 4% 5%
Weighted Avg Gr. (%)
22% 29% 27% 20% 15% 9% 2% 4% 3% -1% -11% 5% -5% 11% 0%
Source: Companies, HDFC sec Inst Research
Hair Care Market Breakup (~Rs 200bn market)
Hair Oil Market Breakup (~Rs 100bn market)
Source: Bajaj Corp
Hair Oil MRP (100ml) Cocounut Hair Oil
Parachute 36 Patanjali Tejus 33 Dabur Anmol 30 Light Hair Oil
Bajaj Almond 60 Dabur Almond 57 Hair & Care 55 Parachute advanced jasmine 41 Amla Based
Dabur Amla 49 Bajaj Bramhi Amla 45 Cooling Hair oil
Navratna 66 Bajaj Kailash Parbat 60 Ayurvedic/herbal
Indulekha 432 Kesh King 117
Hair Oil50%
Shampoo
30%
Hair Dyes17%
Hair Conditioner
3%
Coconut Oil, 33%
Light Hair Oils,
17%
Amla Based Oils, 16%
VACNO, 11%
Cooling Hair Oils,
10%
Ayurvedic/Herbal
, 7%
Others, 6%
-15%
-10%
-5%
0%
5%
10%
15%
20%
25%
30%
35%
1QFY
15
2QFY
15
3QFY
15
4QFY
15
1QFY
16
2QFY
16
3QFY
16
4QFY
16
1QFY
17
2QFY
17
3QFY
17
4QFY
17
1QFY
18
2QFY
18
10%
1%4%
9%
-5%
0%
4%
12%14%
22%
13%10%
8%6%
2%
13%
-7%
-1%
5%
11%
17%
23%
FY11 FY12 FY13 FY14 FY15 FY16 FY17 FY18
(YTD)
Volume Gr. (%) Value Gr. (%)
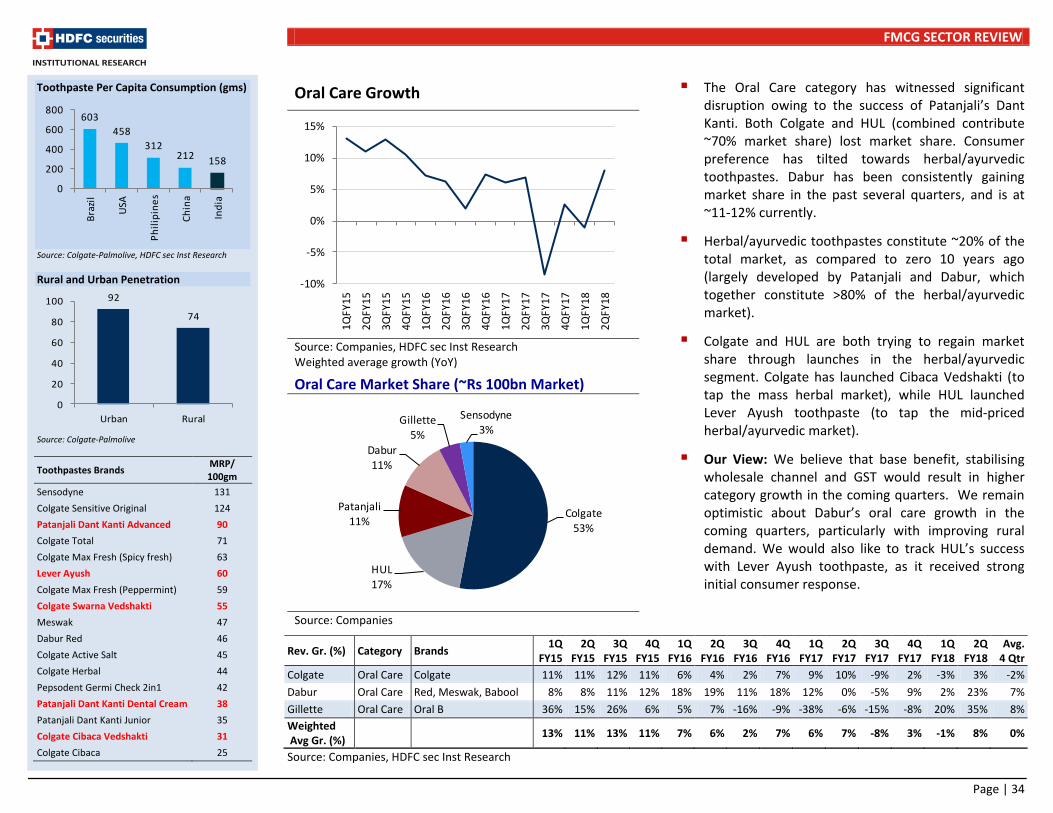
FMCG SECTOR REVIEW
Page | 34
Oral Care Growth
Source: Companies, HDFC sec Inst Research Weighted average growth (YoY)
Oral Care Market Share (~Rs 100bn Market)
Source: Companies
The Oral Care category has witnessed significant disruption owing to the success of Patanjali’s Dant Kanti. Both Colgate and HUL (combined contribute ~70% market share) lost market share. Consumer preference has tilted towards herbal/ayurvedic toothpastes. Dabur has been consistently gaining market share in the past several quarters, and is at ~11-12% currently.
Herbal/ayurvedic toothpastes constitute ~20% of the total market, as compared to zero 10 years ago (largely developed by Patanjali and Dabur, which together constitute >80% of the herbal/ayurvedic market).
Colgate and HUL are both trying to regain market share through launches in the herbal/ayurvedic segment. Colgate has launched Cibaca Vedshakti (to tap the mass herbal market), while HUL launched Lever Ayush toothpaste (to tap the mid-priced herbal/ayurvedic market).
Our View: We believe that base benefit, stabilising wholesale channel and GST would result in higher category growth in the coming quarters. We remain optimistic about Dabur’s oral care growth in the coming quarters, particularly with improving rural demand. We would also like to track HUL’s success with Lever Ayush toothpaste, as it received strong initial consumer response.
Rev. Gr. (%) Category Brands 1Q
FY15 2Q
FY15 3Q
FY15 4Q
FY15 1Q
FY16 2Q
FY16 3Q
FY16 4Q
FY16 1Q
FY17 2Q
FY17 3Q
FY17 4Q
FY17 1Q
FY18 2Q
FY18 Avg.
4 Qtr
Colgate Oral Care Colgate 11% 11% 12% 11% 6% 4% 2% 7% 9% 10% -9% 2% -3% 3% -2%
Dabur Oral Care Red, Meswak, Babool 8% 8% 11% 12% 18% 19% 11% 18% 12% 0% -5% 9% 2% 23% 7%
Gillette Oral Care Oral B 36% 15% 26% 6% 5% 7% -16% -9% -38% -6% -15% -8% 20% 35% 8%
Weighted Avg Gr. (%)
13% 11% 13% 11% 7% 6% 2% 7% 6% 7% -8% 3% -1% 8% 0%
Source: Companies, HDFC sec Inst Research
Toothpaste Per Capita Consumption (gms)
Source: Colgate-Palmolive, HDFC sec Inst Research
Rural and Urban Penetration
Source: Colgate-Palmolive
Toothpastes Brands MRP/ 100gm
Sensodyne 131
Colgate Sensitive Original 124
Patanjali Dant Kanti Advanced 90
Colgate Total 71
Colgate Max Fresh (Spicy fresh) 63
Lever Ayush 60
Colgate Max Fresh (Peppermint) 59
Colgate Swarna Vedshakti 55
Meswak 47
Dabur Red 46
Colgate Active Salt 45
Colgate Herbal 44
Pepsodent Germi Check 2in1 42
Patanjali Dant Kanti Dental Cream 38
Patanjali Dant Kanti Junior 35
Colgate Cibaca Vedshakti 31
Colgate Cibaca 25
603
458
312212 158
0
200
400
600
800
Bra
zil
USA
Ph
ilip
ine
s
Ch
ina
Ind
ia
92
74
0
20
40
60
80
100
Urban Rural
-10%
-5%
0%
5%
10%
15%
1QFY
15
2QFY
15
3QFY
15
4QFY
15
1QFY
16
2QFY
16
3QFY
16
4QFY
16
1QFY
17
2QFY
17
3QFY
17
4QFY
17
1QFY
18
2QFY
18
Colgate
53%
HUL
17%
Patanjali11%
Dabur11%
Gillette
5%
Sensodyne3%
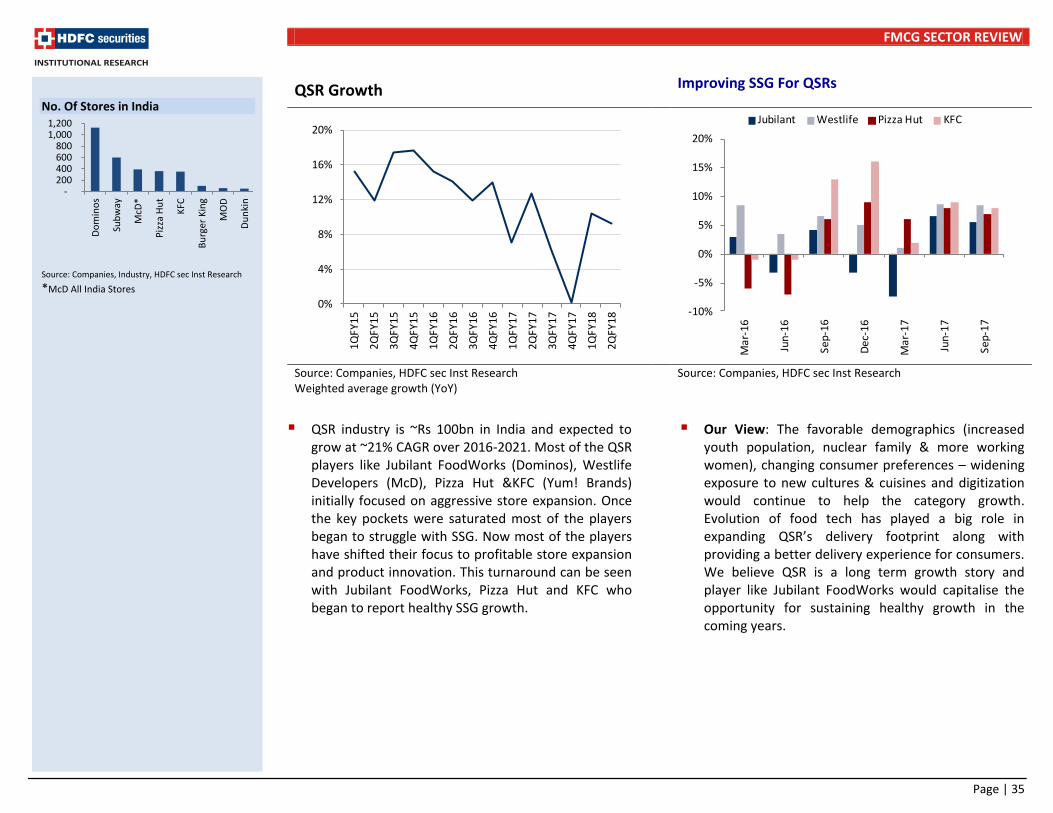
FMCG SECTOR REVIEW
Page | 35
QSR Growth Improving SSG For QSRs
Source: Companies, HDFC sec Inst Research Weighted average growth (YoY)
Source: Companies, HDFC sec Inst Research
QSR industry is ~Rs 100bn in India and expected to grow at ~21% CAGR over 2016-2021. Most of the QSR players like Jubilant FoodWorks (Dominos), Westlife Developers (McD), Pizza Hut &KFC (Yum! Brands) initially focused on aggressive store expansion. Once the key pockets were saturated most of the players began to struggle with SSG. Now most of the players have shifted their focus to profitable store expansion and product innovation. This turnaround can be seen with Jubilant FoodWorks, Pizza Hut and KFC who began to report healthy SSG growth.
Our View: The favorable demographics (increased youth population, nuclear family & more working women), changing consumer preferences – widening exposure to new cultures & cuisines and digitization would continue to help the category growth. Evolution of food tech has played a big role in expanding QSR’s delivery footprint along with providing a better delivery experience for consumers. We believe QSR is a long term growth story and player like Jubilant FoodWorks would capitalise the opportunity for sustaining healthy growth in the coming years.
No. Of Stores in India
Source: Companies, Industry, HDFC sec Inst Research
*McD All India Stores
- 200 400 600 800
1,000 1,200
Do
min
os
Sub
way
McD
*
Piz
za H
ut
KFC
Bu
rger
Kin
g
MO
D
Du
nki
n
0%
4%
8%
12%
16%
20%
1QFY
15
2QFY
15
3QFY
15
4QFY
15
1QFY
16
2QFY
16
3QFY
16
4QFY
16
1QFY
17
2QFY
17
3QFY
17
4QFY
17
1QFY
18
2QFY
18
-10%
-5%
0%
5%
10%
15%
20%
Mar
-16
Jun
-16
Sep-
16
Dec
-16
Mar
-17
Jun
-17
Sep-
17
Jubilant Westlife Pizza Hut KFC
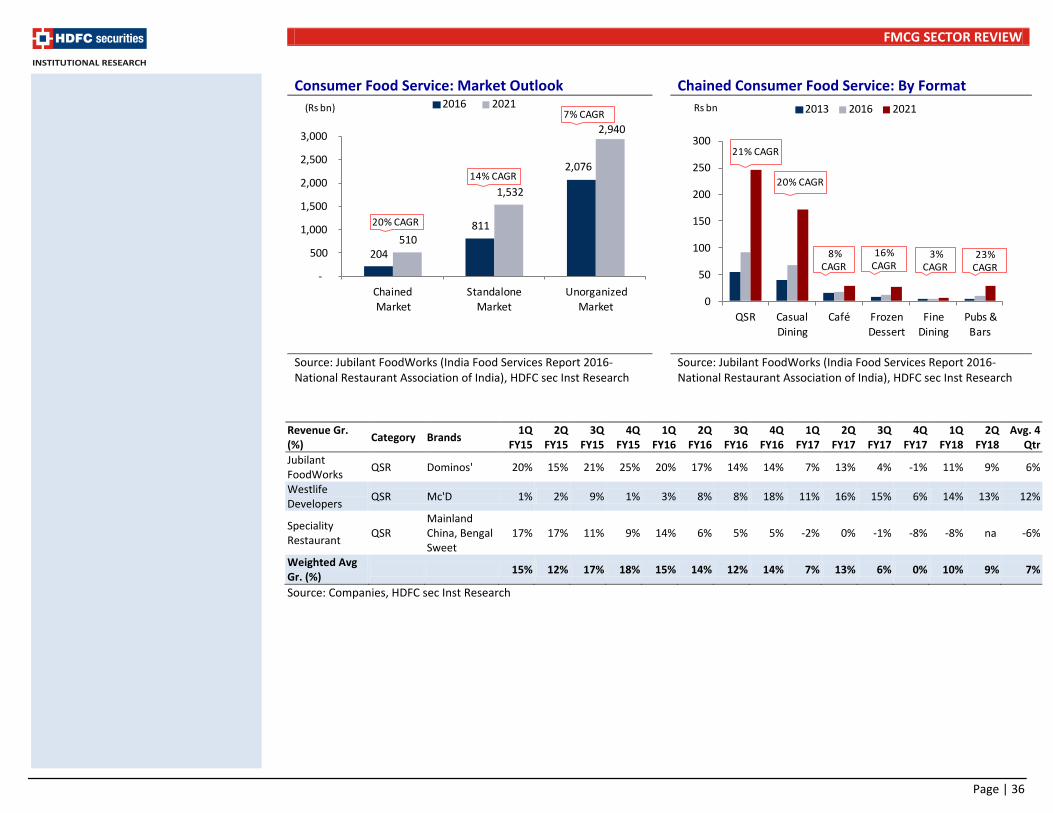
FMCG SECTOR REVIEW
Page | 36
Consumer Food Service: Market Outlook Chained Consumer Food Service: By Format
Source: Jubilant FoodWorks (India Food Services Report 2016- National Restaurant Association of India), HDFC sec Inst Research
Source: Jubilant FoodWorks (India Food Services Report 2016- National Restaurant Association of India), HDFC sec Inst Research
Revenue Gr. (%)
Category Brands 1Q
FY15 2Q
FY15 3Q
FY15 4Q
FY15 1Q
FY16 2Q
FY16 3Q
FY16 4Q
FY16 1Q
FY17 2Q
FY17 3Q
FY17 4Q
FY17 1Q
FY18 2Q
FY18 Avg. 4
Qtr
Jubilant FoodWorks
QSR Dominos' 20% 15% 21% 25% 20% 17% 14% 14% 7% 13% 4% -1% 11% 9% 6%
Westlife Developers
QSR Mc'D 1% 2% 9% 1% 3% 8% 8% 18% 11% 16% 15% 6% 14% 13% 12%
Speciality Restaurant
QSR Mainland China, Bengal Sweet
17% 17% 11% 9% 14% 6% 5% 5% -2% 0% -1% -8% -8% na -6%
Weighted Avg Gr. (%)
15% 12% 17% 18% 15% 14% 12% 14% 7% 13% 6% 0% 10% 9% 7%
Source: Companies, HDFC sec Inst Research
204
811
2,076
510
1,532
2,940
-
500
1,000
1,500
2,000
2,500
3,000
Chained
MarketStandalone
MarketUnorganized
Market
2016 2021
20% CAGR
(Rs bn)
14% CAGR
7% CAGR
0
50
100
150
200
250
300
QSR Casual
Dining
Café Frozen
Dessert
Fine
Dining
Pubs &
Bars
2013 2016 2021
21% CAGR
20% CAGR
8% CAGR
16% CAGR
23% CAGR
3% CAGR
Rs bn
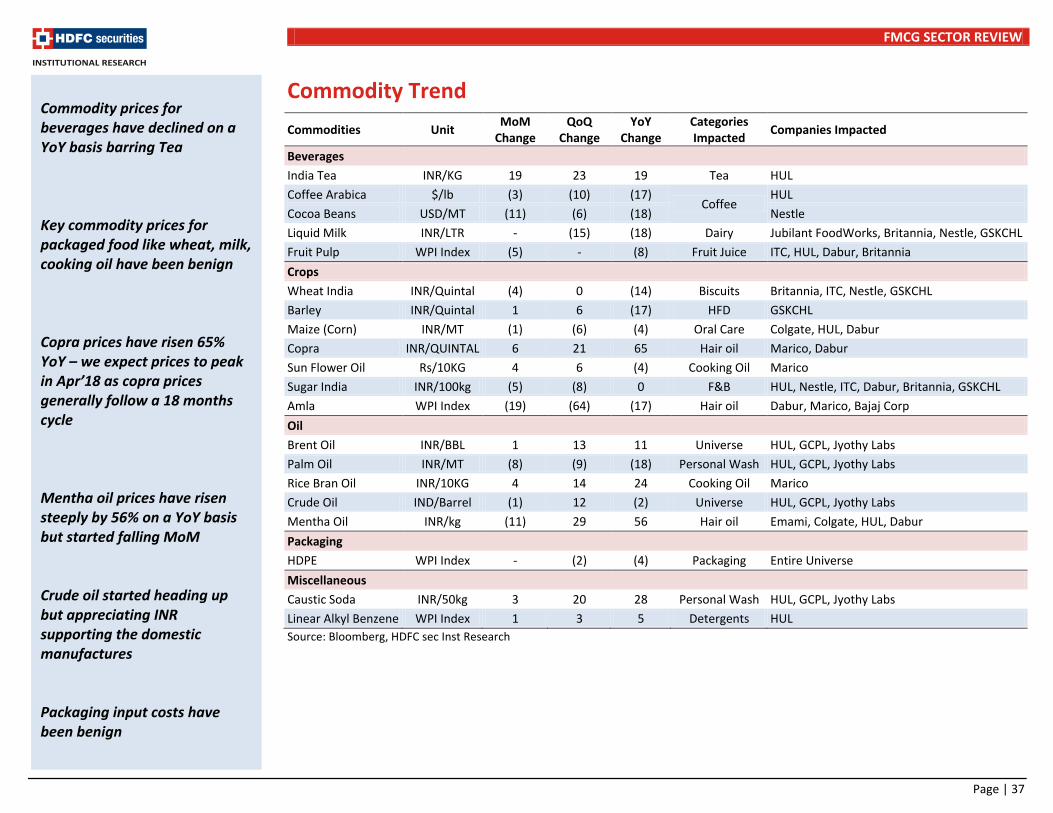
FMCG SECTOR REVIEW
Page | 37
Commodity Trend
Commodities Unit MoM
Change QoQ
Change YoY
Change Categories Impacted
Companies Impacted
Beverages
India Tea INR/KG 19 23 19 Tea HUL
Coffee Arabica $/lb (3) (10) (17) Coffee
HUL
Cocoa Beans USD/MT (11) (6) (18) Nestle
Liquid Milk INR/LTR - (15) (18) Dairy Jubilant FoodWorks, Britannia, Nestle, GSKCHL
Fruit Pulp WPI Index (5) - (8) Fruit Juice ITC, HUL, Dabur, Britannia
Crops
Wheat India INR/Quintal (4) 0 (14) Biscuits Britannia, ITC, Nestle, GSKCHL
Barley INR/Quintal 1 6 (17) HFD GSKCHL
Maize (Corn) INR/MT (1) (6) (4) Oral Care Colgate, HUL, Dabur
Copra INR/QUINTAL 6 21 65 Hair oil Marico, Dabur
Sun Flower Oil Rs/10KG 4 6 (4) Cooking Oil Marico
Sugar India INR/100kg (5) (8) 0 F&B HUL, Nestle, ITC, Dabur, Britannia, GSKCHL
Amla WPI Index (19) (64) (17) Hair oil Dabur, Marico, Bajaj Corp
Oil
Brent Oil INR/BBL 1 13 11 Universe HUL, GCPL, Jyothy Labs
Palm Oil INR/MT (8) (9) (18) Personal Wash HUL, GCPL, Jyothy Labs
Rice Bran Oil INR/10KG 4 14 24 Cooking Oil Marico
Crude Oil IND/Barrel (1) 12 (2) Universe HUL, GCPL, Jyothy Labs
Mentha Oil INR/kg (11) 29 56 Hair oil Emami, Colgate, HUL, Dabur
Packaging
HDPE WPI Index - (2) (4) Packaging Entire Universe
Miscellaneous
Caustic Soda INR/50kg 3 20 28 Personal Wash HUL, GCPL, Jyothy Labs
Linear Alkyl Benzene WPI Index 1 3 5 Detergents HUL
Source: Bloomberg, HDFC sec Inst Research
Commodity prices for beverages have declined on a YoY basis barring Tea Key commodity prices for packaged food like wheat, milk, cooking oil have been benign Copra prices have risen 65% YoY – we expect prices to peak in Apr’18 as copra prices generally follow a 18 months cycle Mentha oil prices have risen steeply by 56% on a YoY basis but started falling MoM Crude oil started heading up but appreciating INR supporting the domestic manufactures Packaging input costs have been benign

FMCG SECTOR REVIEW
Page | 38
International Performance International Presence
Companies International Revenue (Rs mn) International Revenue (% of total)
FY13 FY14 FY15 FY16 FY17 FY13 FY14 FY15 FY16 FY17
Britannia 3,143 3,610 4,450 5,700 4,912 5% 5% 6% 7% 5%
Dabur 19,772 22,674 24,577 24,903 23,721 32% 32% 31% 32% 30%
Marico 10,070 11,680 12,840 13,760 13,560 25% 28% 25% 22% 22%
Emami 1,800 2,185 3,104 3,356 2,774 11% 12% 14% 14% 11%
Source: Companies, HDFC sec Inst Research
International Performance
Companies
Revenue growth Reported Revenue Growth (YoY%)
Q3 FY15
Q4 FY15
1Q FY16
2Q FY16
3Q FY16
4Q FY16
1Q FY17
2Q FY17
3Q FY17
4Q FY17
1Q FY18
2Q FY18
FY13 FY14 FY15 FY16 FY17
Dabur 4% 9% 9% 9% 15% 16% 6% -2% -6% -20% -15% -11% 22% 22% 8% 12% -5%
Marico 4% 6% 4% 2% 9% 16% 6% 5% 0% -8% -1% -8% 8% 16% 10% 7% 1%
Emami 21% 48% 22% 12% 11% 17% 14% -11% -16% -38% -19% 22% -5% 23% 44% 15% -16%
Source: Companies, HDFC sec Inst Research
Dabur’s Geographic Break-up Marico’s Geographic Break-up
Source: Company, HDFC sec Inst Research
Source: Company, HDFC sec Inst Research
International Revenue Growth (%)
Source: Companies, HDFC sec Inst Research
Dabur, Marico and Emami’s international venture has significantly underperformed since the last 6 quarters primarily due to 1) Geo-political tension in MENA region 2) Low crude oil prices and 3) Depreciation of currencies against INR
-40%
-25%
-10%
5%
20%
35%
50%
Q3F
Y15
Q4F
Y15
1QFY
16
2QFY
16
3QFY
16
4QFY
16
1QFY
17
2QFY
17
3QFY
17
4QFY
17
1QFY
18
2QFY
18
Dabur Marico Emami
Geo-political and unfavorable
currency movement
impacted performance
Middle East (Saudi Arabia, UAE)
31%
Africa (Egypt,
Nigeria, Kenya,
South Africa)
20%
Asia (Nepal, Bangladesh,
Pakistan)19%
Europe (Turkey,
UK)13%
Americans (USA)17%
Bangladesh44%
South East Asia
(Vietnam)28%
MENA15%
South
Africa
7%
Others
6%

FMCG SECTOR REVIEW
Page | 39
Emami’s Geographical Breakup Britannia’s Geographical Breakup
Source: Company, HDFC sec Inst Research
Source: Company, HDFC sec Inst Research
Currency Movment (against USD) – Most currencies (barring INR) depreciated during FY17 and 1HFY18 and impacted internatinal performance for Dabur, Marico and Emami
Source: Bloomberg, HDFC sec Inst Research
-10% 0% 10% 20% 30% 40% 50% 60%
Europe
India
Egypt
Yemen
Syria
Bangladesh
Vietnam
Turkey
Q3FY18 FY18 (YTD) FY17
>60%
Currency depreciation pressure are softening in most geographies
SAARC &
SEA
53%
MENAP
27%
CISEE11%
Others
9%
Dubai74%
Oman26%
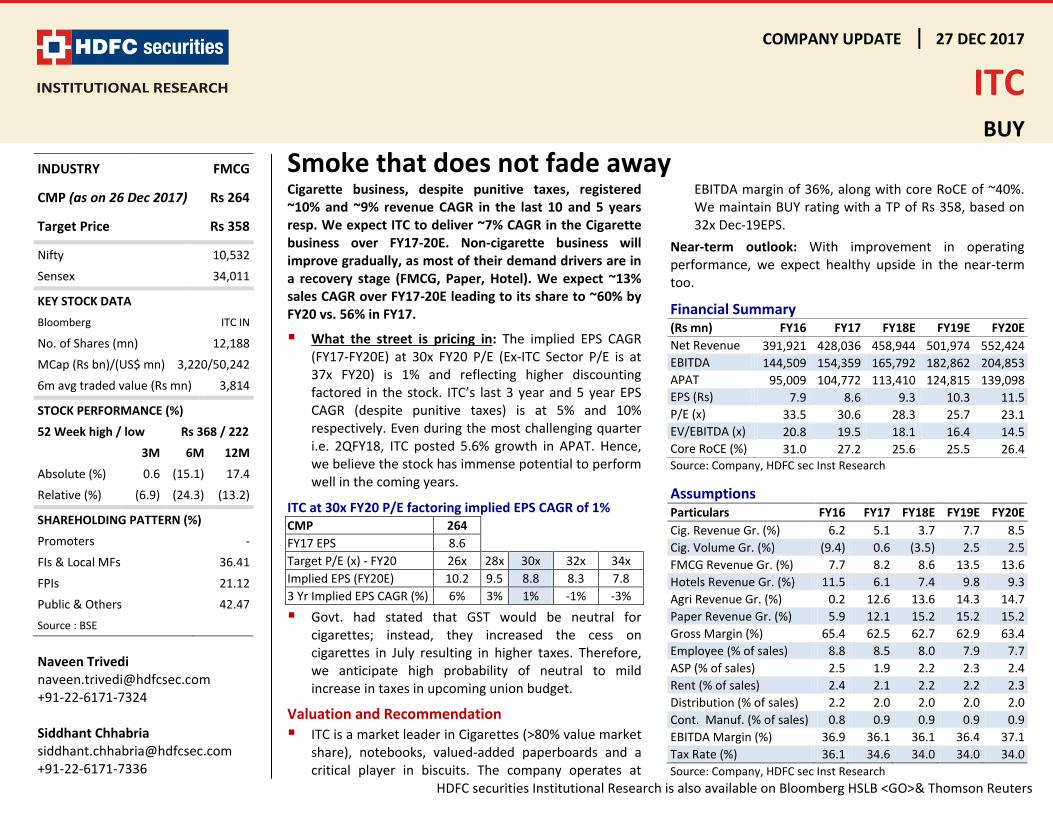
COMPANY UPDATE 27 DEC 2017
ITC
BUY
HDFC securities Institutional Research is also available on Bloomberg HSLB <GO>& Thomson Reuters
Smoke that does not fade away Cigarette business, despite punitive taxes, registered ~10% and ~9% revenue CAGR in the last 10 and 5 years resp. We expect ITC to deliver ~7% CAGR in the Cigarette business over FY17-20E. Non-cigarette business will improve gradually, as most of their demand drivers are in a recovery stage (FMCG, Paper, Hotel). We expect ~13% sales CAGR over FY17-20E leading to its share to ~60% by FY20 vs. 56% in FY17.
What the street is pricing in: The implied EPS CAGR (FY17-FY20E) at 30x FY20 P/E (Ex-ITC Sector P/E is at 37x FY20) is 1% and reflecting higher discounting factored in the stock. ITC’s last 3 year and 5 year EPS CAGR (despite punitive taxes) is at 5% and 10% respectively. Even during the most challenging quarter i.e. 2QFY18, ITC posted 5.6% growth in APAT. Hence, we believe the stock has immense potential to perform well in the coming years.
ITC at 30x FY20 P/E factoring implied EPS CAGR of 1% CMP 264
FY17 EPS 8.6
Target P/E (x) - FY20 26x 28x 30x 32x 34x
Implied EPS (FY20E) 10.2 9.5 8.8 8.3 7.8
3 Yr Implied EPS CAGR (%) 6% 3% 1% -1% -3%
Govt. had stated that GST would be neutral for cigarettes; instead, they increased the cess on cigarettes in July resulting in higher taxes. Therefore, we anticipate high probability of neutral to mild increase in taxes in upcoming union budget.
Valuation and Recommendation
ITC is a market leader in Cigarettes (>80% value market share), notebooks, valued-added paperboards and a critical player in biscuits. The company operates at
EBITDA margin of 36%, along with core RoCE of ~40%. We maintain BUY rating with a TP of Rs 358, based on 32x Dec-19EPS.
Near-term outlook: With improvement in operating performance, we expect healthy upside in the near-term too.
Financial Summary (Rs mn) FY16 FY17 FY18E FY19E FY20E
Net Revenue 391,921 428,036 458,944 501,974 552,424
EBITDA 144,509 154,359 165,792 182,862 204,853
APAT 95,009 104,772 113,410 124,815 139,098
EPS (Rs) 7.9 8.6 9.3 10.3 11.5
P/E (x) 33.5 30.6 28.3 25.7 23.1
EV/EBITDA (x) 20.8 19.5 18.1 16.4 14.5
Core RoCE (%) 31.0 27.2 25.6 25.5 26.4 Source: Company, HDFC sec Inst Research
Assumptions Particulars FY16 FY17 FY18E FY19E FY20E
Cig. Revenue Gr. (%) 6.2 5.1 3.7 7.7 8.5
Cig. Volume Gr. (%) (9.4) 0.6 (3.5) 2.5 2.5
FMCG Revenue Gr. (%) 7.7 8.2 8.6 13.5 13.6
Hotels Revenue Gr. (%) 11.5 6.1 7.4 9.8 9.3
Agri Revenue Gr. (%) 0.2 12.6 13.6 14.3 14.7
Paper Revenue Gr. (%) 5.9 12.1 15.2 15.2 15.2
Gross Margin (%) 65.4 62.5 62.7 62.9 63.4
Employee (% of sales) 8.8 8.5 8.0 7.9 7.7
ASP (% of sales) 2.5 1.9 2.2 2.3 2.4
Rent (% of sales) 2.4 2.1 2.2 2.2 2.3
Distribution (% of sales) 2.2 2.0 2.0 2.0 2.0
Cont. Manuf. (% of sales) 0.8 0.9 0.9 0.9 0.9
EBITDA Margin (%) 36.9 36.1 36.1 36.4 37.1
Tax Rate (%) 36.1 34.6 34.0 34.0 34.0
Source: Company, HDFC sec Inst Research
INDUSTRY FMCG
CMP (as on 27 Jul 2017) Rs 289
Target Price Rs 353
Nifty 10,021
Sensex 32,383
KEY STOCK DATA
Bloomberg ITC IN
No. of Shares (mn) 12,161
MCap (Rs bn)/(US$ mn) 3,509/54,743
6m avg traded value (Rs mn) 4,144
STOCK PERFORMANCE (%)
52 Week high / low Rs 368 / 222
3M 6M 12M
Absolute (%) 1.0 12.1 16.6
Relative (%) (6.9) (4.0) 1.1
SHAREHOLDING PATTERN (%)
Promoters 67.20
FIs & Local MFs 5.19
FPIs 13.79
Public & Others 13.82
Source : BSE
Naveen Trivedi [email protected] +91-22-6171-7324
INDUSTRY FMCG
CMP (as on 26 Dec 2017) Rs 264
Target Price Rs 358
Nifty 10,532
Sensex 34,011
KEY STOCK DATA
Bloomberg ITC IN
No. of Shares (mn) 12,188
MCap (Rs bn)/(US$ mn) 3,220/50,242
6m avg traded value (Rs mn) 3,814
STOCK PERFORMANCE (%)
52 Week high / low Rs 368 / 222
3M 6M 12M
Absolute (%) 0.6 (15.1) 17.4
Relative (%) (6.9) (24.3) (13.2)
SHAREHOLDING PATTERN (%)
Promoters -
FIs & Local MFs 36.41
FPIs 21.12
Public & Others 42.47
Source : BSE
Naveen Trivedi [email protected] +91-22-6171-7324 Siddhant Chhabria [email protected] +91-22-6171-7336
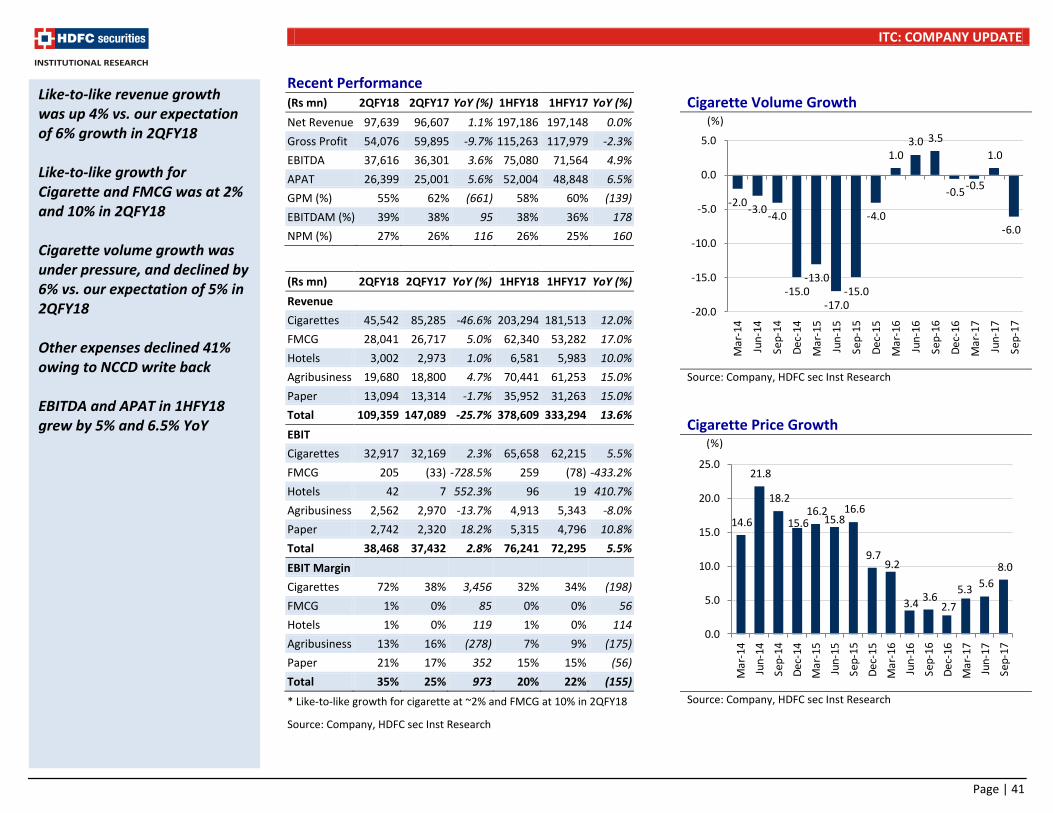
ITC: COMPANY UPDATE
Page | 41
Recent Performance (Rs mn) 2QFY18 2QFY17 YoY (%) 1HFY18 1HFY17 YoY (%)
Net Revenue 97,639 96,607 1.1% 197,186 197,148 0.0%
Gross Profit 54,076 59,895 -9.7% 115,263 117,979 -2.3%
EBITDA 37,616 36,301 3.6% 75,080 71,564 4.9%
APAT 26,399 25,001 5.6% 52,004 48,848 6.5%
GPM (%) 55% 62% (661) 58% 60% (139)
EBITDAM (%) 39% 38% 95 38% 36% 178
NPM (%) 27% 26% 116 26% 25% 160
(Rs mn) 2QFY18 2QFY17 YoY (%) 1HFY18 1HFY17 YoY (%)
Revenue
Cigarettes 45,542 85,285 -46.6% 203,294 181,513 12.0%
FMCG 28,041 26,717 5.0% 62,340 53,282 17.0%
Hotels 3,002 2,973 1.0% 6,581 5,983 10.0%
Agribusiness 19,680 18,800 4.7% 70,441 61,253 15.0%
Paper 13,094 13,314 -1.7% 35,952 31,263 15.0%
Total 109,359 147,089 -25.7% 378,609 333,294 13.6%
EBIT
Cigarettes 32,917 32,169 2.3% 65,658 62,215 5.5%
FMCG 205 (33) -728.5% 259 (78) -433.2%
Hotels 42 7 552.3% 96 19 410.7%
Agribusiness 2,562 2,970 -13.7% 4,913 5,343 -8.0%
Paper 2,742 2,320 18.2% 5,315 4,796 10.8%
Total 38,468 37,432 2.8% 76,241 72,295 5.5%
EBIT Margin
Cigarettes 72% 38% 3,456 32% 34% (198)
FMCG 1% 0% 85 0% 0% 56
Hotels 1% 0% 119 1% 0% 114
Agribusiness 13% 16% (278) 7% 9% (175)
Paper 21% 17% 352 15% 15% (56)
Total 35% 25% 973 20% 22% (155)
* Like-to-like growth for cigarette at ~2% and FMCG at 10% in 2QFY18
Source: Company, HDFC sec Inst Research
Cigarette Volume Growth
Source: Company, HDFC sec Inst Research
Cigarette Price Growth
Source: Company, HDFC sec Inst Research
Like-to-like revenue growth was up 4% vs. our expectation of 6% growth in 2QFY18 Like-to-like growth for Cigarette and FMCG was at 2% and 10% in 2QFY18 Cigarette volume growth was under pressure, and declined by 6% vs. our expectation of 5% in 2QFY18 Other expenses declined 41% owing to NCCD write back EBITDA and APAT in 1HFY18 grew by 5% and 6.5% YoY
-2.0-3.0
-4.0
-15.0-13.0
-17.0-15.0
-4.0
1.03.0 3.5
-0.5-0.5
1.0
-6.0
-20.0
-15.0
-10.0
-5.0
0.0
5.0
Mar
-14
Jun
-14
Sep
-14
Dec
-14
Mar
-15
Jun
-15
Sep
-15
Dec
-15
Mar
-16
Jun
-16
Sep
-16
Dec
-16
Mar
-17
Jun
-17
Sep
-17
(%)
14.6
21.8
18.2
15.6 16.2
15.8 16.6
9.7 9.2
3.4 3.6
2.7
5.3 5.6
8.0
0.0
5.0
10.0
15.0
20.0
25.0
Mar
-14
Jun
-14
Sep
-14
Dec
-14
Mar
-15
Jun
-15
Sep-
15
Dec
-15
Mar
-16
Jun
-16
Sep
-16
Dec
-16
Mar
-17
Jun
-17
Sep
-17
(%)
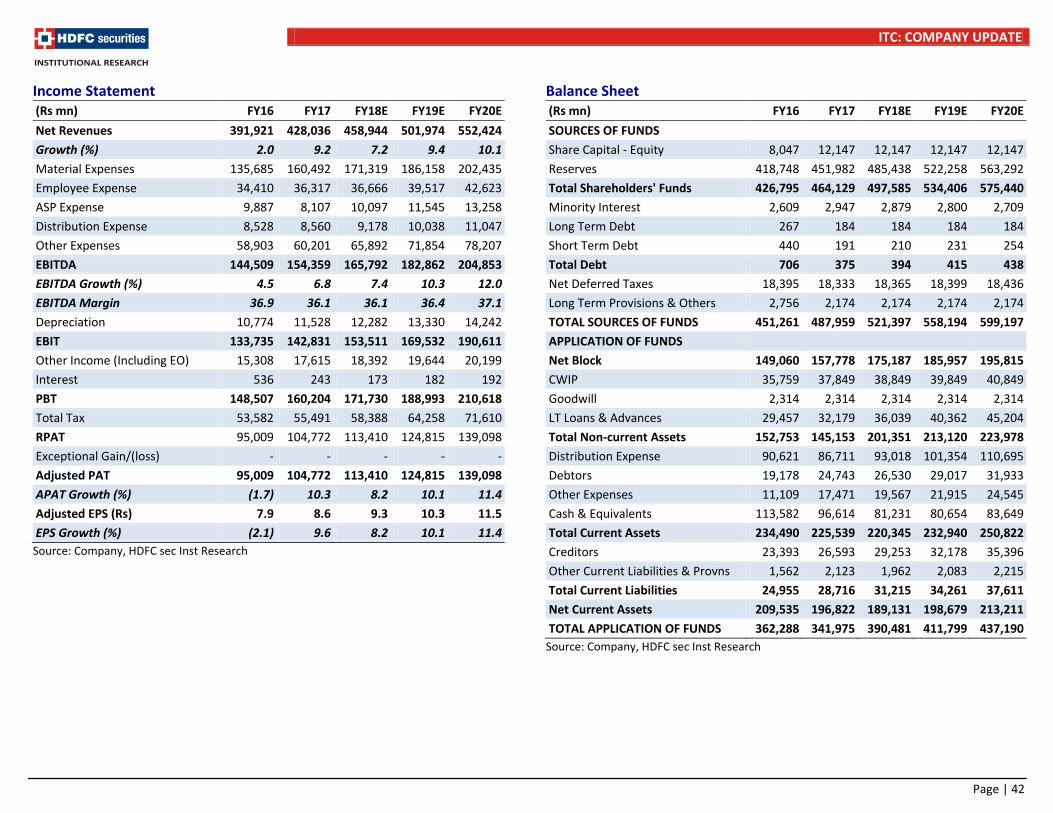
ITC: COMPANY UPDATE
Page | 42
Income Statement (Rs mn) FY16 FY17 FY18E FY19E FY20E
Net Revenues 391,921 428,036 458,944 501,974 552,424
Growth (%) 2.0 9.2 7.2 9.4 10.1
Material Expenses 135,685 160,492 171,319 186,158 202,435
Employee Expense 34,410 36,317 36,666 39,517 42,623
ASP Expense 9,887 8,107 10,097 11,545 13,258
Distribution Expense 8,528 8,560 9,178 10,038 11,047
Other Expenses 58,903 60,201 65,892 71,854 78,207
EBITDA 144,509 154,359 165,792 182,862 204,853
EBITDA Growth (%) 4.5 6.8 7.4 10.3 12.0
EBITDA Margin 36.9 36.1 36.1 36.4 37.1
Depreciation 10,774 11,528 12,282 13,330 14,242
EBIT 133,735 142,831 153,511 169,532 190,611
Other Income (Including EO) 15,308 17,615 18,392 19,644 20,199
Interest 536 243 173 182 192
PBT 148,507 160,204 171,730 188,993 210,618
Total Tax 53,582 55,491 58,388 64,258 71,610
RPAT 95,009 104,772 113,410 124,815 139,098
Exceptional Gain/(loss) - - - - -
Adjusted PAT 95,009 104,772 113,410 124,815 139,098
APAT Growth (%) (1.7) 10.3 8.2 10.1 11.4
Adjusted EPS (Rs) 7.9 8.6 9.3 10.3 11.5
EPS Growth (%) (2.1) 9.6 8.2 10.1 11.4
Source: Company, HDFC sec Inst Research
Balance Sheet (Rs mn) FY16 FY17 FY18E FY19E FY20E
SOURCES OF FUNDS
Share Capital - Equity 8,047 12,147 12,147 12,147 12,147
Reserves 418,748 451,982 485,438 522,258 563,292
Total Shareholders' Funds 426,795 464,129 497,585 534,406 575,440
Minority Interest 2,609 2,947 2,879 2,800 2,709
Long Term Debt 267 184 184 184 184
Short Term Debt 440 191 210 231 254
Total Debt 706 375 394 415 438
Net Deferred Taxes 18,395 18,333 18,365 18,399 18,436
Long Term Provisions & Others 2,756 2,174 2,174 2,174 2,174
TOTAL SOURCES OF FUNDS 451,261 487,959 521,397 558,194 599,197
APPLICATION OF FUNDS
Net Block 149,060 157,778 175,187 185,957 195,815
CWIP 35,759 37,849 38,849 39,849 40,849
Goodwill 2,314 2,314 2,314 2,314 2,314
LT Loans & Advances 29,457 32,179 36,039 40,362 45,204
Total Non-current Assets 152,753 145,153 201,351 213,120 223,978
Distribution Expense 90,621 86,711 93,018 101,354 110,695
Debtors 19,178 24,743 26,530 29,017 31,933
Other Expenses 11,109 17,471 19,567 21,915 24,545
Cash & Equivalents 113,582 96,614 81,231 80,654 83,649
Total Current Assets 234,490 225,539 220,345 232,940 250,822
Creditors 23,393 26,593 29,253 32,178 35,396
Other Current Liabilities & Provns 1,562 2,123 1,962 2,083 2,215
Total Current Liabilities 24,955 28,716 31,215 34,261 37,611
Net Current Assets 209,535 196,822 189,131 198,679 213,211
TOTAL APPLICATION OF FUNDS 362,288 341,975 390,481 411,799 437,190
Source: Company, HDFC sec Inst Research
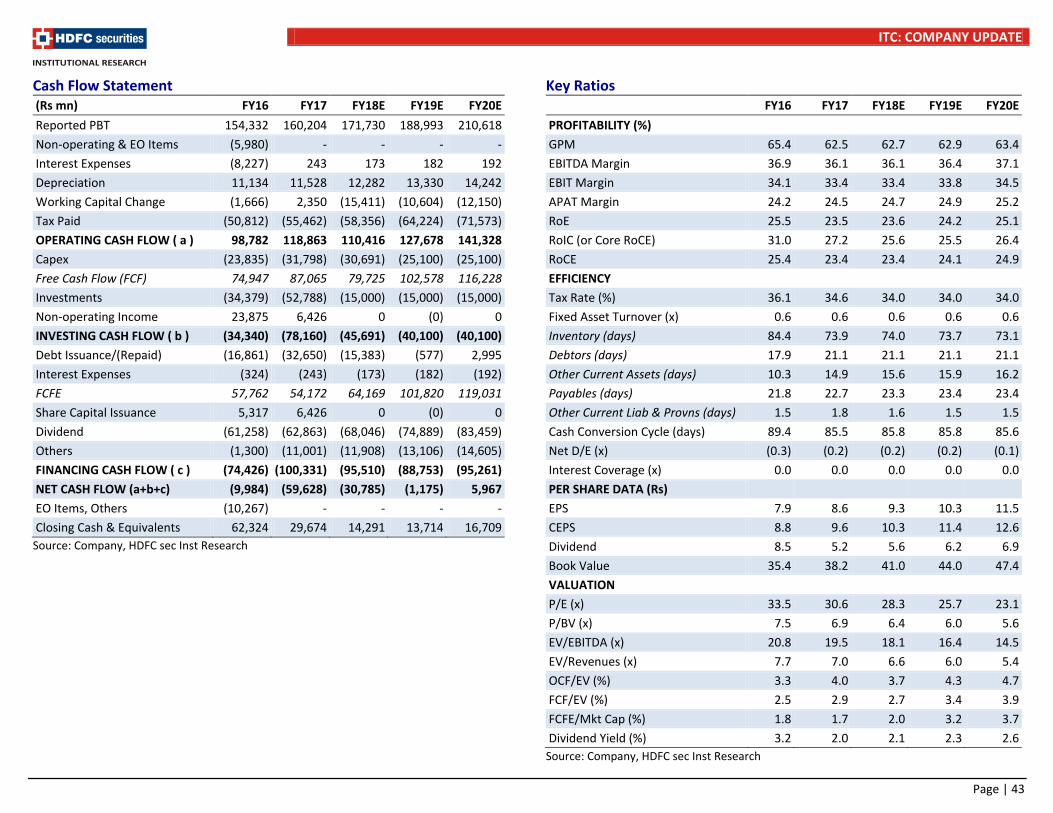
ITC: COMPANY UPDATE
Page | 43
Cash Flow Statement (Rs mn) FY16 FY17 FY18E FY19E FY20E
Reported PBT 154,332 160,204 171,730 188,993 210,618
Non-operating & EO Items (5,980) - - - -
Interest Expenses (8,227) 243 173 182 192
Depreciation 11,134 11,528 12,282 13,330 14,242
Working Capital Change (1,666) 2,350 (15,411) (10,604) (12,150)
Tax Paid (50,812) (55,462) (58,356) (64,224) (71,573)
OPERATING CASH FLOW ( a ) 98,782 118,863 110,416 127,678 141,328
Capex (23,835) (31,798) (30,691) (25,100) (25,100)
Free Cash Flow (FCF) 74,947 87,065 79,725 102,578 116,228
Investments (34,379) (52,788) (15,000) (15,000) (15,000)
Non-operating Income 23,875 6,426 0 (0) 0
INVESTING CASH FLOW ( b ) (34,340) (78,160) (45,691) (40,100) (40,100)
Debt Issuance/(Repaid) (16,861) (32,650) (15,383) (577) 2,995
Interest Expenses (324) (243) (173) (182) (192)
FCFE 57,762 54,172 64,169 101,820 119,031
Share Capital Issuance 5,317 6,426 0 (0) 0
Dividend (61,258) (62,863) (68,046) (74,889) (83,459)
Others (1,300) (11,001) (11,908) (13,106) (14,605)
FINANCING CASH FLOW ( c ) (74,426) (100,331) (95,510) (88,753) (95,261)
NET CASH FLOW (a+b+c) (9,984) (59,628) (30,785) (1,175) 5,967
EO Items, Others (10,267) - - - -
Closing Cash & Equivalents 62,324 29,674 14,291 13,714 16,709
Source: Company, HDFC sec Inst Research
Key Ratios FY16 FY17 FY18E FY19E FY20E
PROFITABILITY (%)
GPM 65.4 62.5 62.7 62.9 63.4
EBITDA Margin 36.9 36.1 36.1 36.4 37.1
EBIT Margin 34.1 33.4 33.4 33.8 34.5
APAT Margin 24.2 24.5 24.7 24.9 25.2
RoE 25.5 23.5 23.6 24.2 25.1
RoIC (or Core RoCE) 31.0 27.2 25.6 25.5 26.4
RoCE 25.4 23.4 23.4 24.1 24.9
EFFICIENCY
Tax Rate (%) 36.1 34.6 34.0 34.0 34.0
Fixed Asset Turnover (x) 0.6 0.6 0.6 0.6 0.6
Inventory (days) 84.4 73.9 74.0 73.7 73.1
Debtors (days) 17.9 21.1 21.1 21.1 21.1
Other Current Assets (days) 10.3 14.9 15.6 15.9 16.2
Payables (days) 21.8 22.7 23.3 23.4 23.4
Other Current Liab & Provns (days) 1.5 1.8 1.6 1.5 1.5
Cash Conversion Cycle (days) 89.4 85.5 85.8 85.8 85.6
Net D/E (x) (0.3) (0.2) (0.2) (0.2) (0.1)
Interest Coverage (x) 0.0 0.0 0.0 0.0 0.0
PER SHARE DATA (Rs)
EPS 7.9 8.6 9.3 10.3 11.5
CEPS 8.8 9.6 10.3 11.4 12.6
Dividend 8.5 5.2 5.6 6.2 6.9
Book Value 35.4 38.2 41.0 44.0 47.4
VALUATION
P/E (x) 33.5 30.6 28.3 25.7 23.1
P/BV (x) 7.5 6.9 6.4 6.0 5.6
EV/EBITDA (x) 20.8 19.5 18.1 16.4 14.5
EV/Revenues (x) 7.7 7.0 6.6 6.0 5.4
OCF/EV (%) 3.3 4.0 3.7 4.3 4.7
FCF/EV (%) 2.5 2.9 2.7 3.4 3.9
FCFE/Mkt Cap (%) 1.8 1.7 2.0 3.2 3.7
Dividend Yield (%) 3.2 2.0 2.1 2.3 2.6
Source: Company, HDFC sec Inst Research
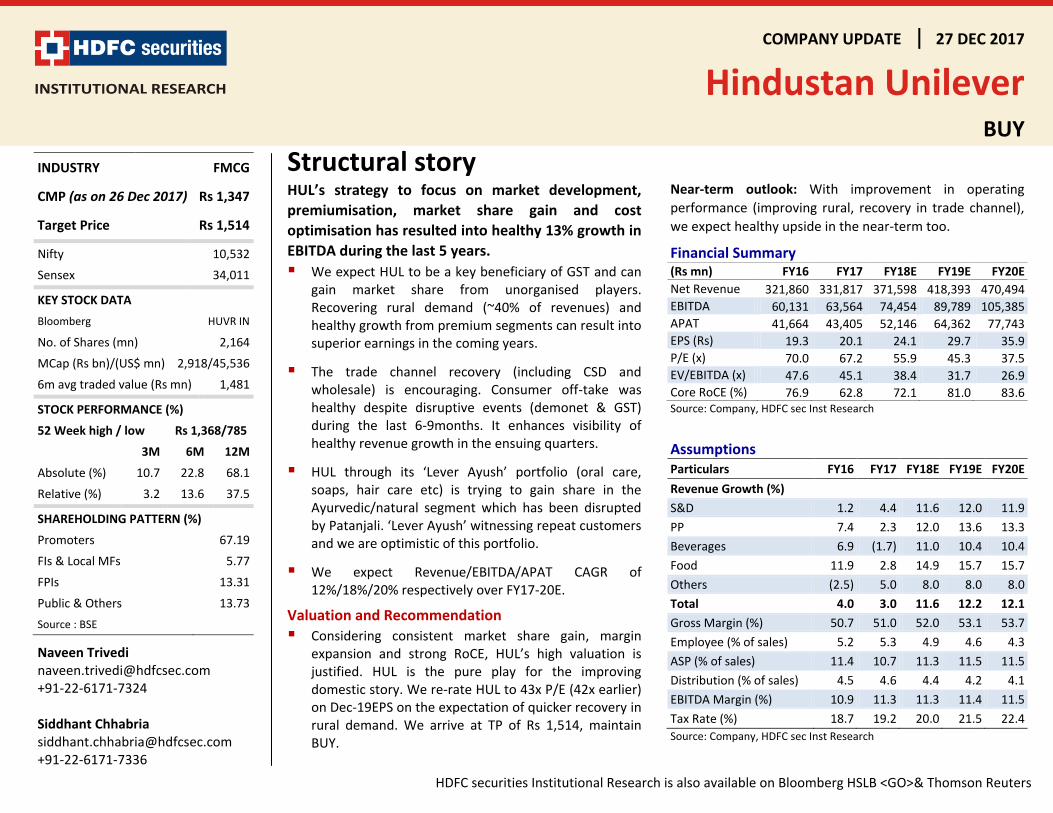
COMPANY UPDATE 27 DEC 2017
Hindustan Unilever
BUY
HDFC securities Institutional Research is also available on Bloomberg HSLB <GO>& Thomson Reuters
Structural story HUL’s strategy to focus on market development,
premiumisation, market share gain and cost
optimisation has resulted into healthy 13% growth in
EBITDA during the last 5 years.
We expect HUL to be a key beneficiary of GST and can gain market share from unorganised players. Recovering rural demand (~40% of revenues) and healthy growth from premium segments can result into superior earnings in the coming years.
The trade channel recovery (including CSD and wholesale) is encouraging. Consumer off-take was healthy despite disruptive events (demonet & GST) during the last 6-9months. It enhances visibility of healthy revenue growth in the ensuing quarters.
HUL through its ‘Lever Ayush’ portfolio (oral care, soaps, hair care etc) is trying to gain share in the Ayurvedic/natural segment which has been disrupted by Patanjali. ‘Lever Ayush’ witnessing repeat customers and we are optimistic of this portfolio.
We expect Revenue/EBITDA/APAT CAGR of 12%/18%/20% respectively over FY17-20E.
Valuation and Recommendation
Considering consistent market share gain, margin expansion and strong RoCE, HUL’s high valuation is justified. HUL is the pure play for the improving domestic story. We re-rate HUL to 43x P/E (42x earlier) on Dec-19EPS on the expectation of quicker recovery in rural demand. We arrive at TP of Rs 1,514, maintain BUY.
Near-term outlook: With improvement in operating
performance (improving rural, recovery in trade channel),
we expect healthy upside in the near-term too.
Financial Summary (Rs mn) FY16 FY17 FY18E FY19E FY20E
Net Revenue 321,860 331,817 371,598 418,393 470,494
EBITDA 60,131 63,564 74,454 89,789 105,385
APAT 41,664 43,405 52,146 64,362 77,743
EPS (Rs) 19.3 20.1 24.1 29.7 35.9
P/E (x) 70.0 67.2 55.9 45.3 37.5
EV/EBITDA (x) 47.6 45.1 38.4 31.7 26.9
Core RoCE (%) 76.9 62.8 72.1 81.0 83.6 Source: Company, HDFC sec Inst Research
Assumptions Particulars FY16 FY17 FY18E FY19E FY20E
Revenue Growth (%)
S&D 1.2 4.4 11.6 12.0 11.9
PP 7.4 2.3 12.0 13.6 13.3
Beverages 6.9 (1.7) 11.0 10.4 10.4
Food 11.9 2.8 14.9 15.7 15.7
Others (2.5) 5.0 8.0 8.0 8.0
Total 4.0 3.0 11.6 12.2 12.1
Gross Margin (%) 50.7 51.0 52.0 53.1 53.7
Employee (% of sales) 5.2 5.3 4.9 4.6 4.3
ASP (% of sales) 11.4 10.7 11.3 11.5 11.5
Distribution (% of sales) 4.5 4.6 4.4 4.2 4.1
EBITDA Margin (%) 10.9 11.3 11.3 11.4 11.5
Tax Rate (%) 18.7 19.2 20.0 21.5 22.4
Source: Company, HDFC sec Inst Research
INDUSTRY FMCG
CMP (as on 26 Dec 2017) Rs 1,347
Target Price Rs 1,514
Nifty 10,532
Sensex 34,011
KEY STOCK DATA
Bloomberg HUVR IN
No. of Shares (mn) 2,164
MCap (Rs bn)/(US$ mn) 2,918/45,536
6m avg traded value (Rs mn) 1,481
STOCK PERFORMANCE (%)
52 Week high / low Rs 1,368/785
3M 6M 12M
Absolute (%) 10.7 22.8 68.1
Relative (%) 3.2 13.6 37.5
SHAREHOLDING PATTERN (%)
Promoters 67.19
FIs & Local MFs 5.77
FPIs 13.31
Public & Others 13.73
Source : BSE
Naveen Trivedi [email protected] +91-22-6171-7324 Siddhant Chhabria [email protected] +91-22-6171-7336
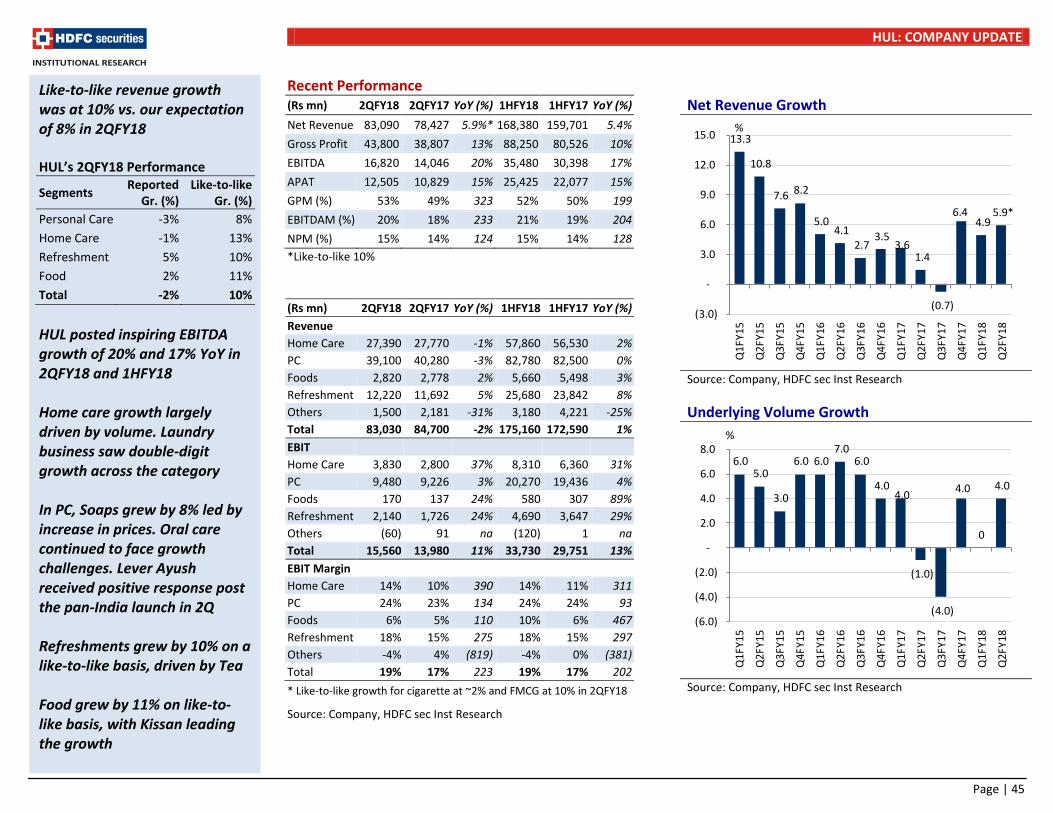
HUL: COMPANY UPDATE
Page | 45
Recent Performance (Rs mn) 2QFY18 2QFY17 YoY (%) 1HFY18 1HFY17 YoY (%)
Net Revenue 83,090 78,427 5.9%* 168,380 159,701 5.4%
Gross Profit 43,800 38,807 13% 88,250 80,526 10%
EBITDA 16,820 14,046 20% 35,480 30,398 17%
APAT 12,505 10,829 15% 25,425 22,077 15%
GPM (%) 53% 49% 323 52% 50% 199
EBITDAM (%) 20% 18% 233 21% 19% 204
NPM (%) 15% 14% 124 15% 14% 128
*Like-to-like 10%
(Rs mn) 2QFY18 2QFY17 YoY (%) 1HFY18 1HFY17 YoY (%)
Revenue
Home Care 27,390 27,770 -1% 57,860 56,530 2%
PC 39,100 40,280 -3% 82,780 82,500 0%
Foods 2,820 2,778 2% 5,660 5,498 3%
Refreshment 12,220 11,692 5% 25,680 23,842 8%
Others 1,500 2,181 -31% 3,180 4,221 -25%
Total 83,030 84,700 -2% 175,160 172,590 1%
EBIT
Home Care 3,830 2,800 37% 8,310 6,360 31%
PC 9,480 9,226 3% 20,270 19,436 4%
Foods 170 137 24% 580 307 89%
Refreshment 2,140 1,726 24% 4,690 3,647 29%
Others (60) 91 na (120) 1 na
Total 15,560 13,980 11% 33,730 29,751 13%
EBIT Margin
Home Care 14% 10% 390 14% 11% 311
PC 24% 23% 134 24% 24% 93
Foods 6% 5% 110 10% 6% 467
Refreshment 18% 15% 275 18% 15% 297
Others -4% 4% (819) -4% 0% (381)
Total 19% 17% 223 19% 17% 202
* Like-to-like growth for cigarette at ~2% and FMCG at 10% in 2QFY18
Source: Company, HDFC sec Inst Research
Net Revenue Growth
Source: Company, HDFC sec Inst Research
Underlying Volume Growth
Source: Company, HDFC sec Inst Research
Like-to-like revenue growth was at 10% vs. our expectation of 8% in 2QFY18 HUL’s 2QFY18 Performance
Segments Reported
Gr. (%) Like-to-like
Gr. (%)
Personal Care -3% 8%
Home Care -1% 13%
Refreshment 5% 10%
Food 2% 11%
Total -2% 10%
HUL posted inspiring EBITDA growth of 20% and 17% YoY in 2QFY18 and 1HFY18 Home care growth largely driven by volume. Laundry business saw double-digit growth across the category In PC, Soaps grew by 8% led by increase in prices. Oral care continued to face growth challenges. Lever Ayush received positive response post the pan-India launch in 2Q Refreshments grew by 10% on a like-to-like basis, driven by Tea Food grew by 11% on like-to-like basis, with Kissan leading the growth
13.3
10.8
7.6 8.2
5.0 4.1
2.7 3.5
3.6 1.4
(0.7)
6.4 4.9
5.9*
(3.0)
-
3.0
6.0
9.0
12.0
15.0
Q1
FY1
5
Q2
FY1
5
Q3
FY1
5
Q4
FY1
5
Q1
FY1
6
Q2
FY1
6
Q3
FY1
6
Q4
FY1
6
Q1
FY1
7
Q2
FY1
7
Q3
FY1
7
Q4
FY1
7
Q1
FY1
8
Q2
FY1
8
%
6.0 5.0
3.0
6.0 6.0 7.0
6.0
4.0 4.0
(1.0)
(4.0)
4.0
0
4.0
(6.0)
(4.0)
(2.0)
-
2.0
4.0
6.0
8.0
Q1
FY1
5
Q2
FY1
5
Q3
FY1
5
Q4
FY1
5
Q1
FY1
6
Q2
FY1
6
Q3
FY1
6
Q4
FY1
6
Q1
FY1
7
Q2
FY1
7
Q3
FY1
7
Q4
FY1
7
Q1
FY1
8
Q2
FY1
8
%
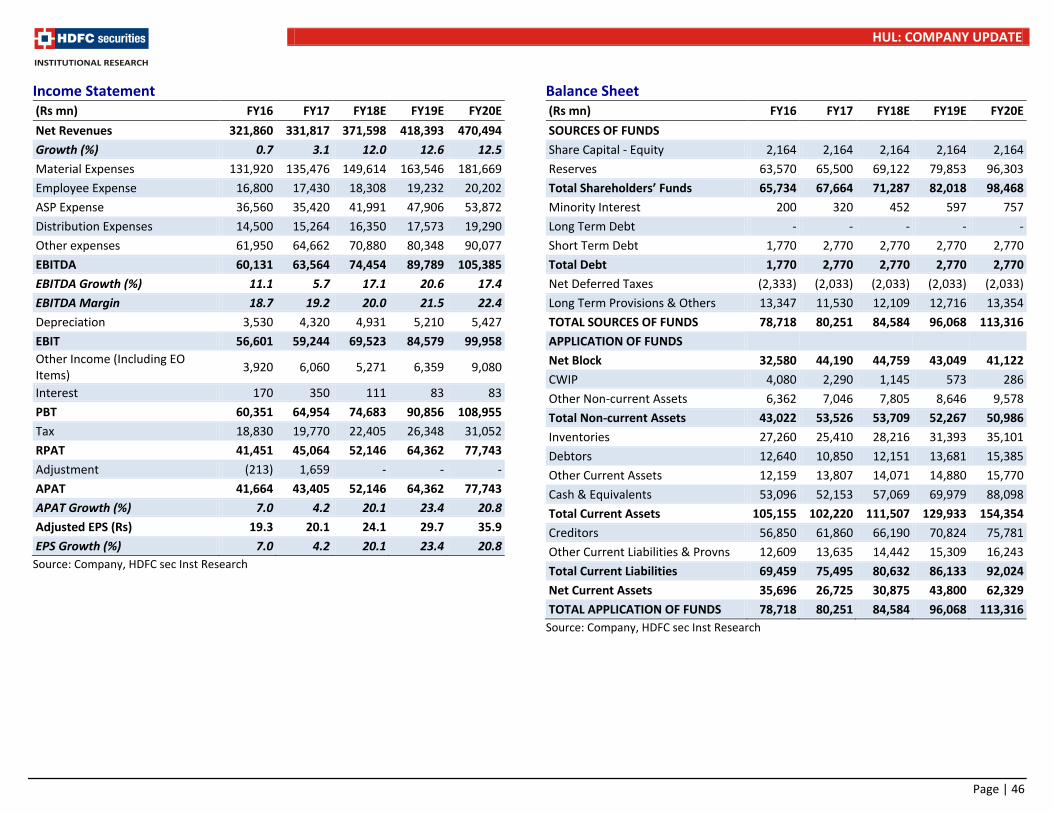
HUL: COMPANY UPDATE
Page | 46
Income Statement (Rs mn) FY16 FY17 FY18E FY19E FY20E
Net Revenues 321,860 331,817 371,598 418,393 470,494
Growth (%) 0.7 3.1 12.0 12.6 12.5
Material Expenses 131,920 135,476 149,614 163,546 181,669
Employee Expense 16,800 17,430 18,308 19,232 20,202
ASP Expense 36,560 35,420 41,991 47,906 53,872
Distribution Expenses 14,500 15,264 16,350 17,573 19,290
Other expenses 61,950 64,662 70,880 80,348 90,077
EBITDA 60,131 63,564 74,454 89,789 105,385
EBITDA Growth (%) 11.1 5.7 17.1 20.6 17.4
EBITDA Margin 18.7 19.2 20.0 21.5 22.4
Depreciation 3,530 4,320 4,931 5,210 5,427
EBIT 56,601 59,244 69,523 84,579 99,958
Other Income (Including EO Items)
3,920 6,060 5,271 6,359 9,080
Interest 170 350 111 83 83
PBT 60,351 64,954 74,683 90,856 108,955
Tax 18,830 19,770 22,405 26,348 31,052
RPAT 41,451 45,064 52,146 64,362 77,743
Adjustment (213) 1,659 - - -
APAT 41,664 43,405 52,146 64,362 77,743
APAT Growth (%) 7.0 4.2 20.1 23.4 20.8
Adjusted EPS (Rs) 19.3 20.1 24.1 29.7 35.9
EPS Growth (%) 7.0 4.2 20.1 23.4 20.8
Source: Company, HDFC sec Inst Research
Balance Sheet (Rs mn) FY16 FY17 FY18E FY19E FY20E
SOURCES OF FUNDS
Share Capital - Equity 2,164 2,164 2,164 2,164 2,164
Reserves 63,570 65,500 69,122 79,853 96,303
Total Shareholders’ Funds 65,734 67,664 71,287 82,018 98,468
Minority Interest 200 320 452 597 757
Long Term Debt - - - - -
Short Term Debt 1,770 2,770 2,770 2,770 2,770
Total Debt 1,770 2,770 2,770 2,770 2,770
Net Deferred Taxes (2,333) (2,033) (2,033) (2,033) (2,033)
Long Term Provisions & Others 13,347 11,530 12,109 12,716 13,354
TOTAL SOURCES OF FUNDS 78,718 80,251 84,584 96,068 113,316
APPLICATION OF FUNDS
Net Block 32,580 44,190 44,759 43,049 41,122
CWIP 4,080 2,290 1,145 573 286
Other Non-current Assets 6,362 7,046 7,805 8,646 9,578
Total Non-current Assets 43,022 53,526 53,709 52,267 50,986
Inventories 27,260 25,410 28,216 31,393 35,101
Debtors 12,640 10,850 12,151 13,681 15,385
Other Current Assets 12,159 13,807 14,071 14,880 15,770
Cash & Equivalents 53,096 52,153 57,069 69,979 88,098
Total Current Assets 105,155 102,220 111,507 129,933 154,354
Creditors 56,850 61,860 66,190 70,824 75,781
Other Current Liabilities & Provns 12,609 13,635 14,442 15,309 16,243
Total Current Liabilities 69,459 75,495 80,632 86,133 92,024
Net Current Assets 35,696 26,725 30,875 43,800 62,329
TOTAL APPLICATION OF FUNDS 78,718 80,251 84,584 96,068 113,316
Source: Company, HDFC sec Inst Research

HUL: COMPANY UPDATE
Page | 47
Cash Flow Statement (Rs mn) FY16 FY17 FY18E FY19E FY20E
Reported PBT 59,851 64,954 74,683 90,856 108,955
Non-operating & EO Items (947) - - - -
Interest Expenses (2,481) 350 111 83 83
Depreciation 3,573 4,320 4,931 5,210 5,427
Working Capital Change (1,079) 5,527 585 (249) (704)
Tax Paid (17,663) (19,470) (22,405) (26,348) (31,052)
OPERATING CASH FLOW ( a ) 41,253 55,681 57,905 69,552 82,709
Capex (7,914) (14,140) (4,355) (2,928) (3,214)
Free Cash Flow (FCF) 33,340 41,541 53,550 66,624 79,495
Investments 689 (12,280) (3,500) (3,500) (3,500)
Non-operating Income 4,542 447 - - -
INVESTING CASH FLOW ( b ) (2,682) (25,973) (7,855) (6,428) (6,714)
Debt Issuance/(Repaid) 2,117 1,000 - - -
Interest Expenses (45) (350) (111) (83) (83)
FCFE 35,412 42,191 53,439 66,541 79,412
Share Capital Issuance (110) - - - -
Dividend (33,417) (36,793) (41,122) (45,450) (51,943)
Others (6,735) (6,623) (7,402) (8,181) (9,350)
FINANCING CASH FLOW ( c ) (38,190) (42,766) (48,634) (53,714) (61,376)
NET CASH FLOW (a+b+c) 382 (13,058) 1,416 9,410 14,619
EO Items, Others 3,384 - - - -
Closing Cash & Equivalents 27,436 14,213 15,629 25,039 39,658
Source: Company, HDFC sec Inst Research
Key Ratios FY16 FY17 FY18E FY19E FY20E
PROFITABILITY (%)
GPM 50.7 51.0 52.0 53.1 53.7
EBITDA Margin 18.7 19.2 20.0 21.5 22.4
EBIT Margin 17.6 17.9 18.7 20.2 21.2
APAT Margin 12.9 13.1 14.0 15.4 16.5
RoE 78.6 65.1 75.1 84.0 86.1
RoCE 76.9 62.8 72.1 81.0 83.6
EFFICIENCY
Tax Rate (%) 31.2 30.4 30.0 29.0 28.5
Fixed Asset Turnover (x) 5.3 4.3 4.5 4.9 5.3
Inventory (days) 30.9 28.0 27.7 27.4 27.2
Debtors (days) 14.3 11.9 11.9 11.9 11.9
Other Current Assets (days) 13.8 15.2 13.8 13.0 12.2
Payables (days) 64.5 68.0 65.0 61.8 58.8
Other Current Liab & Provns (days) 14.3 15.0 14.2 13.4 12.6
Cash Conversion Cycle (days) (19.7) (28.0) (25.7) (22.8) (20.0)
Net D/E (x) (0.8) (0.7) (0.8) (0.8) (0.9)
PER SHARE DATA (Rs)
EPS 19.3 20.1 24.1 29.7 35.9
CEPS 20.9 22.1 26.4 32.1 38.4
Dividend 16.0 17.0 19.0 21.0 24.0
Book Value 30.4 31.3 32.9 37.9 45.5
VALUATION
P/E (x) 70.0 67.2 55.9 45.3 37.5
P/BV (x) 44.3 43.1 40.9 35.5 29.6
EV/EBITDA (x) 47.6 45.1 38.4 31.7 26.9
EV/Revenues (x) 8.9 8.6 7.7 6.8 6.0
OCF/EV (%) 1.4 1.9 2.0 2.4 2.9
FCF/EV (%) 1.2 1.4 1.9 2.3 2.8
FCFE/Mkt Cap (%) 1.2 1.4 1.8 2.3 2.7
Dividend Yield (%) 1.2 1.3 1.4 1.6 1.8
Source: Company, HDFC sec Inst Research
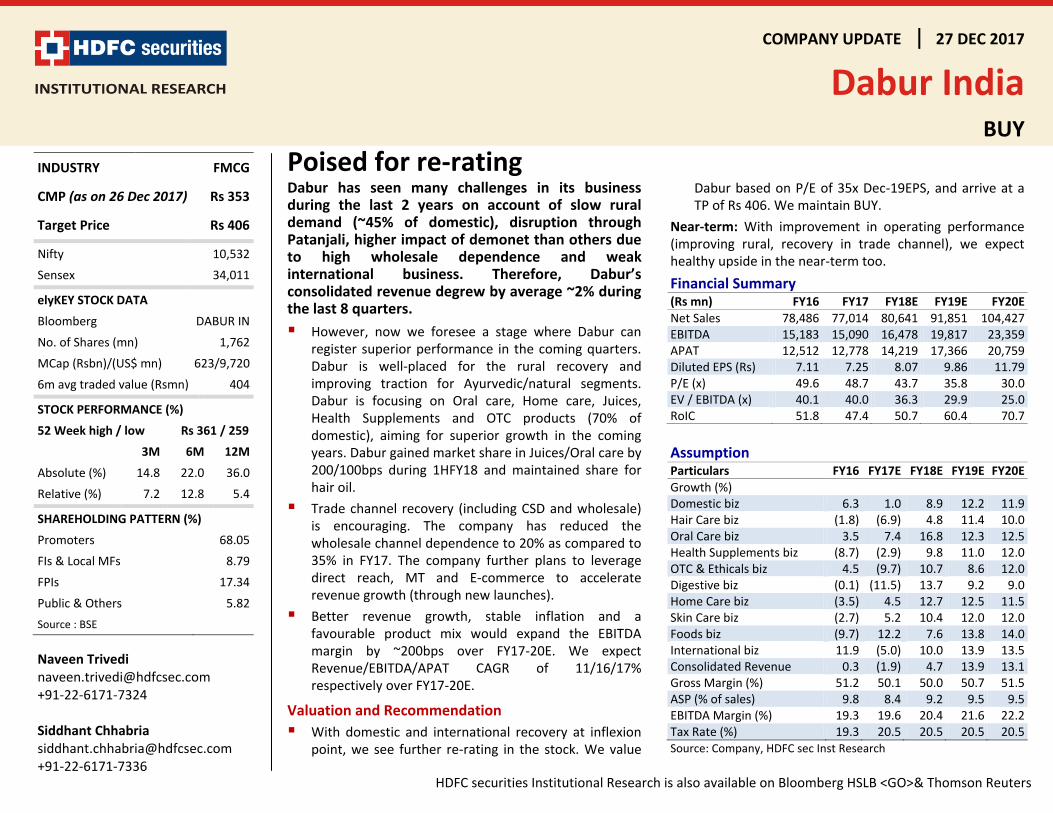
COMPANY UPDATE 27 DEC 2017
Dabur India
BUY
HDFC securities Institutional Research is also available on Bloomberg HSLB <GO>& Thomson Reuters
Poised for re-rating Dabur has seen many challenges in its business during the last 2 years on account of slow rural demand (~45% of domestic), disruption through Patanjali, higher impact of demonet than others due to high wholesale dependence and weak international business. Therefore, Dabur’s consolidated revenue degrew by average ~2% during the last 8 quarters.
However, now we foresee a stage where Dabur can register superior performance in the coming quarters. Dabur is well-placed for the rural recovery and improving traction for Ayurvedic/natural segments. Dabur is focusing on Oral care, Home care, Juices, Health Supplements and OTC products (70% of domestic), aiming for superior growth in the coming years. Dabur gained market share in Juices/Oral care by 200/100bps during 1HFY18 and maintained share for hair oil.
Trade channel recovery (including CSD and wholesale) is encouraging. The company has reduced the wholesale channel dependence to 20% as compared to 35% in FY17. The company further plans to leverage direct reach, MT and E-commerce to accelerate revenue growth (through new launches).
Better revenue growth, stable inflation and a favourable product mix would expand the EBITDA margin by ~200bps over FY17-20E. We expect Revenue/EBITDA/APAT CAGR of 11/16/17% respectively over FY17-20E.
Valuation and Recommendation
With domestic and international recovery at inflexion point, we see further re-rating in the stock. We value
Dabur based on P/E of 35x Dec-19EPS, and arrive at a TP of Rs 406. We maintain BUY.
Near-term: With improvement in operating performance (improving rural, recovery in trade channel), we expect healthy upside in the near-term too.
Financial Summary (Rs mn) FY16 FY17 FY18E FY19E FY20E Net Sales 78,486 77,014 80,641 91,851 104,427 EBITDA 15,183 15,090 16,478 19,817 23,359 APAT 12,512 12,778 14,219 17,366 20,759 Diluted EPS (Rs) 7.11 7.25 8.07 9.86 11.79 P/E (x) 49.6 48.7 43.7 35.8 30.0 EV / EBITDA (x) 40.1 40.0 36.3 29.9 25.0 RoIC 51.8 47.4 50.7 60.4 70.7
Assumption Particulars FY16 FY17E FY18E FY19E FY20E Growth (%)
Domestic biz 6.3 1.0 8.9 12.2 11.9 Hair Care biz (1.8) (6.9) 4.8 11.4 10.0 Oral Care biz 3.5 7.4 16.8 12.3 12.5 Health Supplements biz (8.7) (2.9) 9.8 11.0 12.0 OTC & Ethicals biz 4.5 (9.7) 10.7 8.6 12.0 Digestive biz (0.1) (11.5) 13.7 9.2 9.0 Home Care biz (3.5) 4.5 12.7 12.5 11.5 Skin Care biz (2.7) 5.2 10.4 12.0 12.0 Foods biz (9.7) 12.2 7.6 13.8 14.0 International biz 11.9 (5.0) 10.0 13.9 13.5 Consolidated Revenue 0.3 (1.9) 4.7 13.9 13.1 Gross Margin (%) 51.2 50.1 50.0 50.7 51.5 ASP (% of sales) 9.8 8.4 9.2 9.5 9.5 EBITDA Margin (%) 19.3 19.6 20.4 21.6 22.2 Tax Rate (%) 19.3 20.5 20.5 20.5 20.5 Source: Company, HDFC sec Inst Research
INDUSTRY FMCG
CMP (as on 26 Dec 2017) Rs 353
Target Price Rs 406
Nifty 10,532
Sensex 34,011
elyKEY STOCK DATA
Bloomberg DABUR IN
No. of Shares (mn) 1,762
MCap (Rsbn)/(US$ mn) 623/9,720
6m avg traded value (Rsmn) 404
STOCK PERFORMANCE (%)
52 Week high / low Rs 361 / 259
3M 6M 12M
Absolute (%) 14.8 22.0 36.0
Relative (%) 7.2 12.8 5.4
SHAREHOLDING PATTERN (%)
Promoters 68.05
FIs & Local MFs 8.79
FPIs 17.34
Public & Others 5.82
Source : BSE
Naveen Trivedi [email protected] +91-22-6171-7324 Siddhant Chhabria [email protected] +91-22-6171-7336
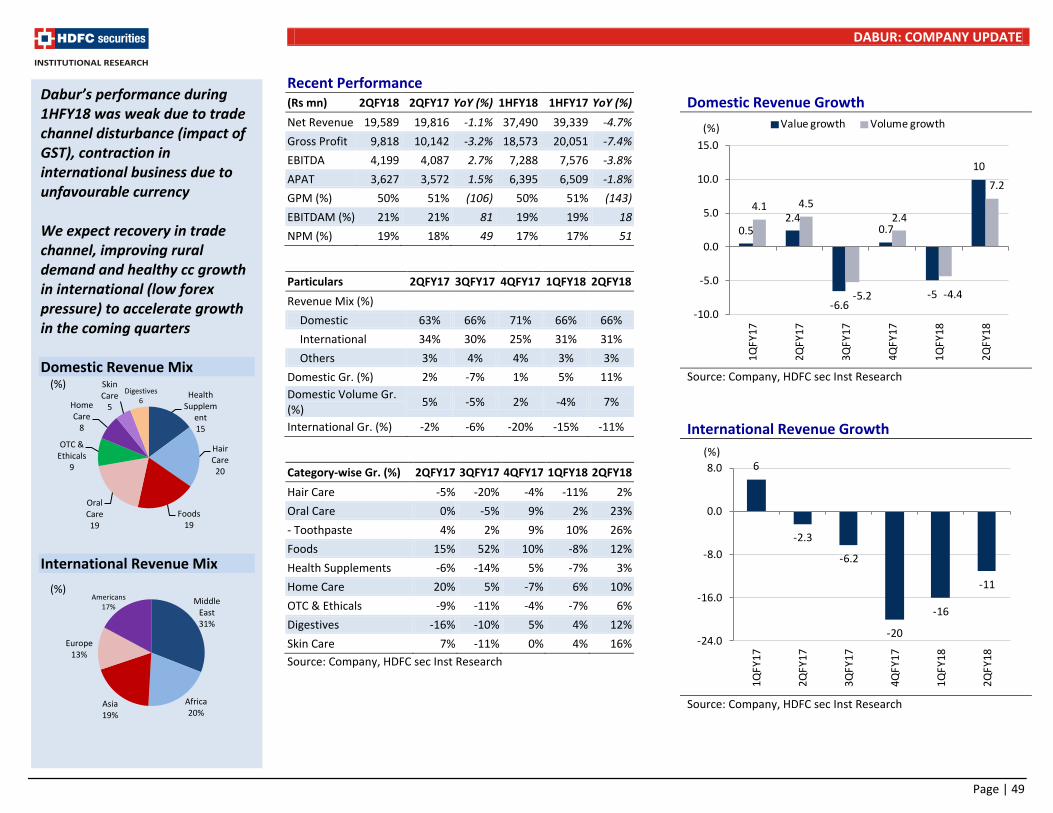
DABUR: COMPANY UPDATE
Page | 49
Recent Performance (Rs mn) 2QFY18 2QFY17 YoY (%) 1HFY18 1HFY17 YoY (%)
Net Revenue 19,589 19,816 -1.1% 37,490 39,339 -4.7%
Gross Profit 9,818 10,142 -3.2% 18,573 20,051 -7.4%
EBITDA 4,199 4,087 2.7% 7,288 7,576 -3.8%
APAT 3,627 3,572 1.5% 6,395 6,509 -1.8%
GPM (%) 50% 51% (106) 50% 51% (143)
EBITDAM (%) 21% 21% 81 19% 19% 18
NPM (%) 19% 18% 49 17% 17% 51
Particulars 2QFY17 3QFY17 4QFY17 1QFY18 2QFY18
Revenue Mix (%)
Domestic 63% 66% 71% 66% 66%
International 34% 30% 25% 31% 31%
Others 3% 4% 4% 3% 3%
Domestic Gr. (%) 2% -7% 1% 5% 11%
Domestic Volume Gr. (%)
5% -5% 2% -4% 7%
International Gr. (%) -2% -6% -20% -15% -11%
Category-wise Gr. (%) 2QFY17 3QFY17 4QFY17 1QFY18 2QFY18
Hair Care -5% -20% -4% -11% 2%
Oral Care 0% -5% 9% 2% 23%
- Toothpaste 4% 2% 9% 10% 26%
Foods 15% 52% 10% -8% 12%
Health Supplements -6% -14% 5% -7% 3%
Home Care 20% 5% -7% 6% 10%
OTC & Ethicals -9% -11% -4% -7% 6%
Digestives -16% -10% 5% 4% 12%
Skin Care 7% -11% 0% 4% 16%
Source: Company, HDFC sec Inst Research
Domestic Revenue Growth
Source: Company, HDFC sec Inst Research
International Revenue Growth
Source: Company, HDFC sec Inst Research
Dabur’s performance during 1HFY18 was weak due to trade channel disturbance (impact of GST), contraction in international business due to unfavourable currency We expect recovery in trade channel, improving rural demand and healthy cc growth in international (low forex pressure) to accelerate growth in the coming quarters Domestic Revenue Mix
International Revenue Mix
Health Supplem
ent 15
Hair Care 20
Foods 19
Oral Care 19
OTC & Ethicals
9
Home Care
8
Skin Care
5
Digestives 6
(%)
Middle East 31%
Africa 20%
Asia 19%
Europe 13%
Americans 17%
(%)
0.52.4
-6.6
0.7
-5
10
4.1 4.5
-5.2
2.4
-4.4
7.2
-10.0
-5.0
0.0
5.0
10.0
15.0
1Q
FY1
7
2Q
FY1
7
3Q
FY1
7
4Q
FY1
7
1Q
FY1
8
2Q
FY1
8
Value growth Volume growth (%)
6
-2.3
-6.2
-20
-16
-11
-24.0
-16.0
-8.0
0.0
8.0
1Q
FY1
7
2Q
FY1
7
3Q
FY1
7
4Q
FY1
7
1Q
FY1
8
2QFY
18
(%)
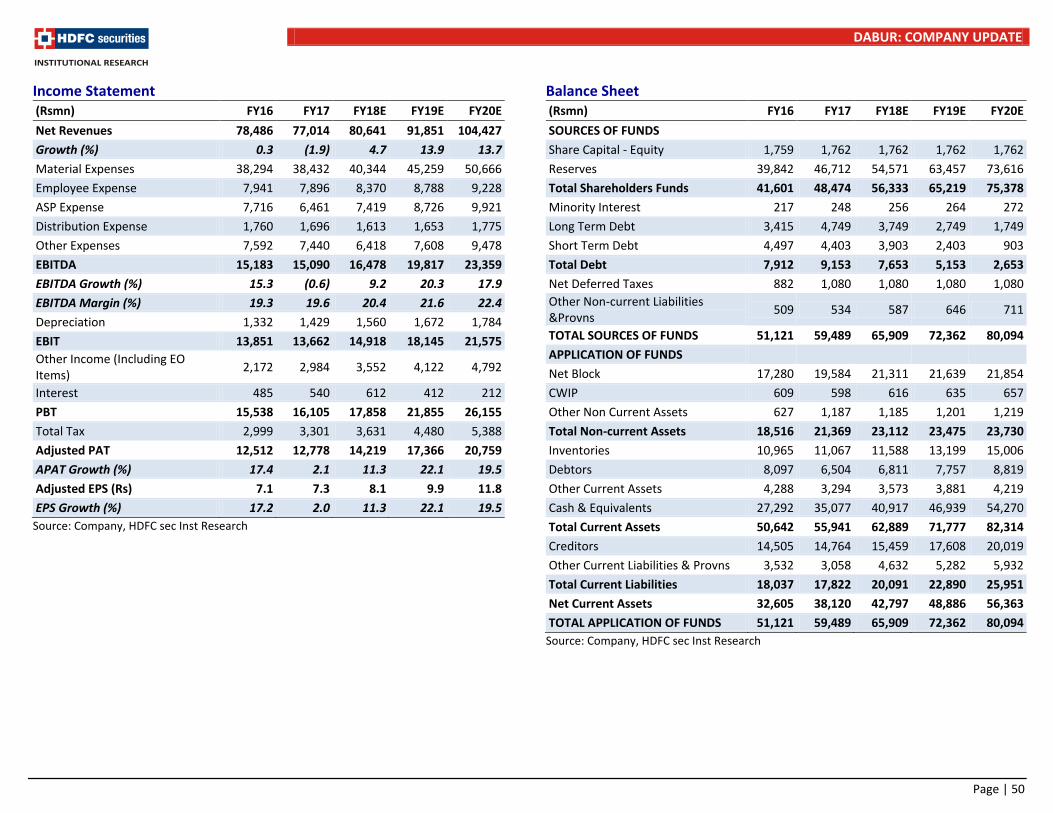
DABUR: COMPANY UPDATE
Page | 50
Income Statement (Rsmn) FY16 FY17 FY18E FY19E FY20E
Net Revenues 78,486 77,014 80,641 91,851 104,427
Growth (%) 0.3 (1.9) 4.7 13.9 13.7
Material Expenses 38,294 38,432 40,344 45,259 50,666
Employee Expense 7,941 7,896 8,370 8,788 9,228
ASP Expense 7,716 6,461 7,419 8,726 9,921
Distribution Expense 1,760 1,696 1,613 1,653 1,775
Other Expenses 7,592 7,440 6,418 7,608 9,478
EBITDA 15,183 15,090 16,478 19,817 23,359
EBITDA Growth (%) 15.3 (0.6) 9.2 20.3 17.9
EBITDA Margin (%) 19.3 19.6 20.4 21.6 22.4
Depreciation 1,332 1,429 1,560 1,672 1,784
EBIT 13,851 13,662 14,918 18,145 21,575
Other Income (Including EO Items)
2,172 2,984 3,552 4,122 4,792
Interest 485 540 612 412 212
PBT 15,538 16,105 17,858 21,855 26,155
Total Tax 2,999 3,301 3,631 4,480 5,388
Adjusted PAT 12,512 12,778 14,219 17,366 20,759
APAT Growth (%) 17.4 2.1 11.3 22.1 19.5
Adjusted EPS (Rs) 7.1 7.3 8.1 9.9 11.8
EPS Growth (%) 17.2 2.0 11.3 22.1 19.5
Source: Company, HDFC sec Inst Research
Balance Sheet (Rsmn) FY16 FY17 FY18E FY19E FY20E
SOURCES OF FUNDS
Share Capital - Equity 1,759 1,762 1,762 1,762 1,762
Reserves 39,842 46,712 54,571 63,457 73,616
Total Shareholders Funds 41,601 48,474 56,333 65,219 75,378
Minority Interest 217 248 256 264 272
Long Term Debt 3,415 4,749 3,749 2,749 1,749
Short Term Debt 4,497 4,403 3,903 2,403 903
Total Debt 7,912 9,153 7,653 5,153 2,653
Net Deferred Taxes 882 1,080 1,080 1,080 1,080
Other Non-current Liabilities &Provns
509 534 587 646 711
TOTAL SOURCES OF FUNDS 51,121 59,489 65,909 72,362 80,094
APPLICATION OF FUNDS
Net Block 17,280 19,584 21,311 21,639 21,854
CWIP 609 598 616 635 657
Other Non Current Assets 627 1,187 1,185 1,201 1,219
Total Non-current Assets 18,516 21,369 23,112 23,475 23,730
Inventories 10,965 11,067 11,588 13,199 15,006
Debtors 8,097 6,504 6,811 7,757 8,819
Other Current Assets 4,288 3,294 3,573 3,881 4,219
Cash & Equivalents 27,292 35,077 40,917 46,939 54,270
Total Current Assets 50,642 55,941 62,889 71,777 82,314
Creditors 14,505 14,764 15,459 17,608 20,019
Other Current Liabilities & Provns 3,532 3,058 4,632 5,282 5,932
Total Current Liabilities 18,037 17,822 20,091 22,890 25,951
Net Current Assets 32,605 38,120 42,797 48,886 56,363
TOTAL APPLICATION OF FUNDS 51,121 59,489 65,909 72,362 80,094
Source: Company, HDFC sec Inst Research
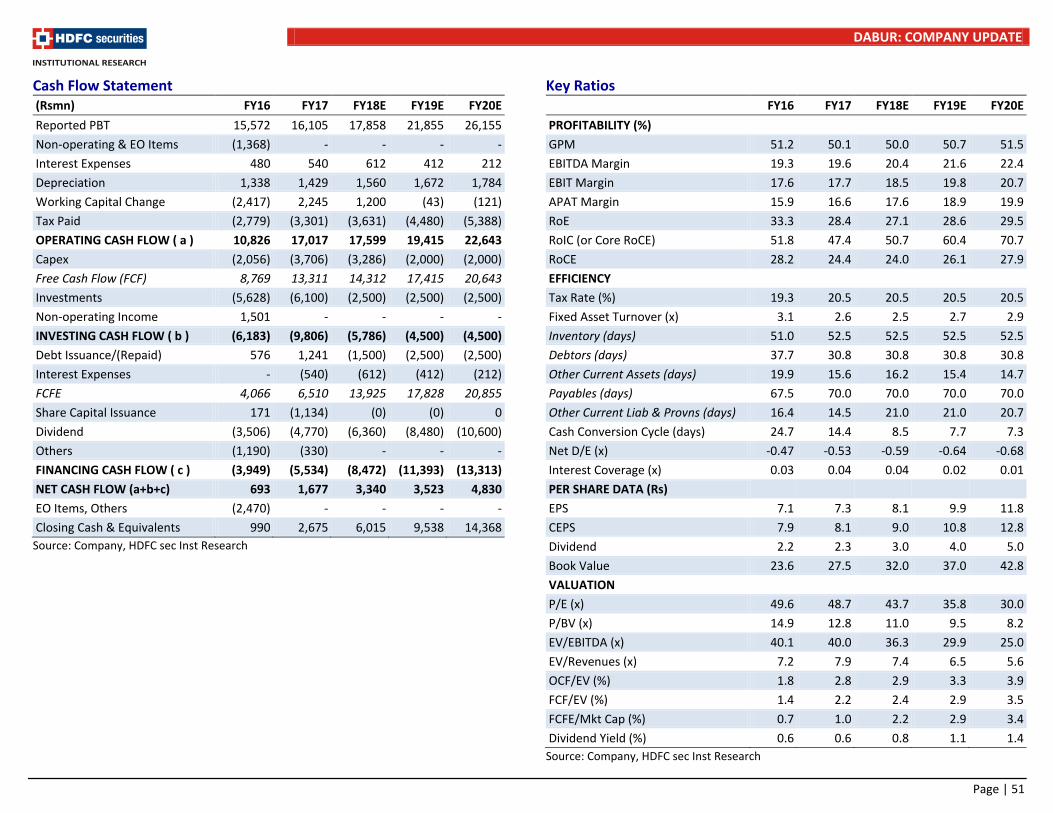
DABUR: COMPANY UPDATE
Page | 51
Cash Flow Statement (Rsmn) FY16 FY17 FY18E FY19E FY20E
Reported PBT 15,572 16,105 17,858 21,855 26,155
Non-operating & EO Items (1,368) - - - -
Interest Expenses 480 540 612 412 212
Depreciation 1,338 1,429 1,560 1,672 1,784
Working Capital Change (2,417) 2,245 1,200 (43) (121)
Tax Paid (2,779) (3,301) (3,631) (4,480) (5,388)
OPERATING CASH FLOW ( a ) 10,826 17,017 17,599 19,415 22,643
Capex (2,056) (3,706) (3,286) (2,000) (2,000)
Free Cash Flow (FCF) 8,769 13,311 14,312 17,415 20,643
Investments (5,628) (6,100) (2,500) (2,500) (2,500)
Non-operating Income 1,501 - - - -
INVESTING CASH FLOW ( b ) (6,183) (9,806) (5,786) (4,500) (4,500)
Debt Issuance/(Repaid) 576 1,241 (1,500) (2,500) (2,500)
Interest Expenses - (540) (612) (412) (212)
FCFE 4,066 6,510 13,925 17,828 20,855
Share Capital Issuance 171 (1,134) (0) (0) 0
Dividend (3,506) (4,770) (6,360) (8,480) (10,600)
Others (1,190) (330) - - -
FINANCING CASH FLOW ( c ) (3,949) (5,534) (8,472) (11,393) (13,313)
NET CASH FLOW (a+b+c) 693 1,677 3,340 3,523 4,830
EO Items, Others (2,470) - - - -
Closing Cash & Equivalents 990 2,675 6,015 9,538 14,368
Source: Company, HDFC sec Inst Research
Key Ratios FY16 FY17 FY18E FY19E FY20E
PROFITABILITY (%)
GPM 51.2 50.1 50.0 50.7 51.5
EBITDA Margin 19.3 19.6 20.4 21.6 22.4
EBIT Margin 17.6 17.7 18.5 19.8 20.7
APAT Margin 15.9 16.6 17.6 18.9 19.9
RoE 33.3 28.4 27.1 28.6 29.5
RoIC (or Core RoCE) 51.8 47.4 50.7 60.4 70.7
RoCE 28.2 24.4 24.0 26.1 27.9
EFFICIENCY
Tax Rate (%) 19.3 20.5 20.5 20.5 20.5
Fixed Asset Turnover (x) 3.1 2.6 2.5 2.7 2.9
Inventory (days) 51.0 52.5 52.5 52.5 52.5
Debtors (days) 37.7 30.8 30.8 30.8 30.8
Other Current Assets (days) 19.9 15.6 16.2 15.4 14.7
Payables (days) 67.5 70.0 70.0 70.0 70.0
Other Current Liab & Provns (days) 16.4 14.5 21.0 21.0 20.7
Cash Conversion Cycle (days) 24.7 14.4 8.5 7.7 7.3
Net D/E (x) -0.47 -0.53 -0.59 -0.64 -0.68
Interest Coverage (x) 0.03 0.04 0.04 0.02 0.01
PER SHARE DATA (Rs)
EPS 7.1 7.3 8.1 9.9 11.8
CEPS 7.9 8.1 9.0 10.8 12.8
Dividend 2.2 2.3 3.0 4.0 5.0
Book Value 23.6 27.5 32.0 37.0 42.8
VALUATION
P/E (x) 49.6 48.7 43.7 35.8 30.0
P/BV (x) 14.9 12.8 11.0 9.5 8.2
EV/EBITDA (x) 40.1 40.0 36.3 29.9 25.0
EV/Revenues (x) 7.2 7.9 7.4 6.5 5.6
OCF/EV (%) 1.8 2.8 2.9 3.3 3.9
FCF/EV (%) 1.4 2.2 2.4 2.9 3.5
FCFE/Mkt Cap (%) 0.7 1.0 2.2 2.9 3.4
Dividend Yield (%) 0.6 0.6 0.8 1.1 1.4
Source: Company, HDFC sec Inst Research
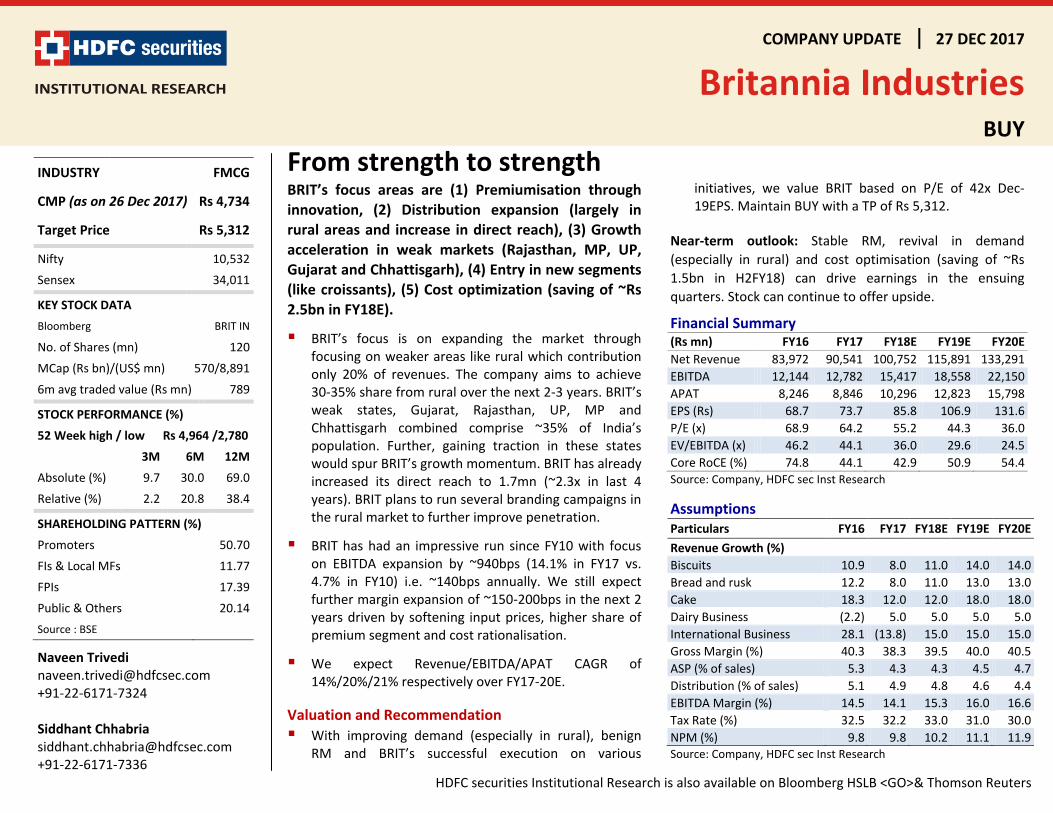
COMPANY UPDATE 27 DEC 2017
Britannia Industries BUY
HDFC securities Institutional Research is also available on Bloomberg HSLB <GO>& Thomson Reuters
From strength to strength BRIT’s focus areas are (1) Premiumisation through innovation, (2) Distribution expansion (largely in rural areas and increase in direct reach), (3) Growth acceleration in weak markets (Rajasthan, MP, UP, Gujarat and Chhattisgarh), (4) Entry in new segments (like croissants), (5) Cost optimization (saving of ~Rs 2.5bn in FY18E).
BRIT’s focus is on expanding the market through focusing on weaker areas like rural which contribution only 20% of revenues. The company aims to achieve 30-35% share from rural over the next 2-3 years. BRIT’s weak states, Gujarat, Rajasthan, UP, MP and Chhattisgarh combined comprise ~35% of India’s population. Further, gaining traction in these states would spur BRIT’s growth momentum. BRIT has already increased its direct reach to 1.7mn (~2.3x in last 4 years). BRIT plans to run several branding campaigns in the rural market to further improve penetration.
BRIT has had an impressive run since FY10 with focus on EBITDA expansion by ~940bps (14.1% in FY17 vs. 4.7% in FY10) i.e. ~140bps annually. We still expect further margin expansion of ~150-200bps in the next 2 years driven by softening input prices, higher share of premium segment and cost rationalisation.
We expect Revenue/EBITDA/APAT CAGR of 14%/20%/21% respectively over FY17-20E.
Valuation and Recommendation
With improving demand (especially in rural), benign RM and BRIT’s successful execution on various
initiatives, we value BRIT based on P/E of 42x Dec-19EPS. Maintain BUY with a TP of Rs 5,312.
Near-term outlook: Stable RM, revival in demand
(especially in rural) and cost optimisation (saving of ~Rs
1.5bn in H2FY18) can drive earnings in the ensuing
quarters. Stock can continue to offer upside.
Financial Summary (Rs mn) FY16 FY17 FY18E FY19E FY20E
Net Revenue 83,972 90,541 100,752 115,891 133,291
EBITDA 12,144 12,782 15,417 18,558 22,150
APAT 8,246 8,846 10,296 12,823 15,798
EPS (Rs) 68.7 73.7 85.8 106.9 131.6
P/E (x) 68.9 64.2 55.2 44.3 36.0
EV/EBITDA (x) 46.2 44.1 36.0 29.6 24.5
Core RoCE (%) 74.8 44.1 42.9 50.9 54.4 Source: Company, HDFC sec Inst Research
Assumptions Particulars FY16 FY17 FY18E FY19E FY20E
Revenue Growth (%)
Biscuits 10.9 8.0 11.0 14.0 14.0
Bread and rusk 12.2 8.0 11.0 13.0 13.0
Cake 18.3 12.0 12.0 18.0 18.0
Dairy Business (2.2) 5.0 5.0 5.0 5.0
International Business 28.1 (13.8) 15.0 15.0 15.0
Gross Margin (%) 40.3 38.3 39.5 40.0 40.5
ASP (% of sales) 5.3 4.3 4.3 4.5 4.7
Distribution (% of sales) 5.1 4.9 4.8 4.6 4.4
EBITDA Margin (%) 14.5 14.1 15.3 16.0 16.6
Tax Rate (%) 32.5 32.2 33.0 31.0 30.0
NPM (%) 9.8 9.8 10.2 11.1 11.9 Source: Company, HDFC sec Inst Research
INDUSTRY FMCG
CMP (as on 26 Dec 2017) Rs 4,734
Target Price Rs 5,312
Nifty 10,532
Sensex 34,011
KEY STOCK DATA
Bloomberg BRIT IN
No. of Shares (mn) 120
MCap (Rs bn)/(US$ mn) 570/8,891
6m avg traded value (Rs mn) 789
STOCK PERFORMANCE (%)
52 Week high / low Rs 4,964 /2,780
3M 6M 12M
Absolute (%) 9.7 30.0 69.0
Relative (%) 2.2 20.8 38.4
SHAREHOLDING PATTERN (%)
Promoters 50.70
FIs & Local MFs 11.77
FPIs 17.39
Public & Others 20.14
Source : BSE
Naveen Trivedi [email protected] +91-22-6171-7324 Siddhant Chhabria [email protected] +91-22-6171-7336
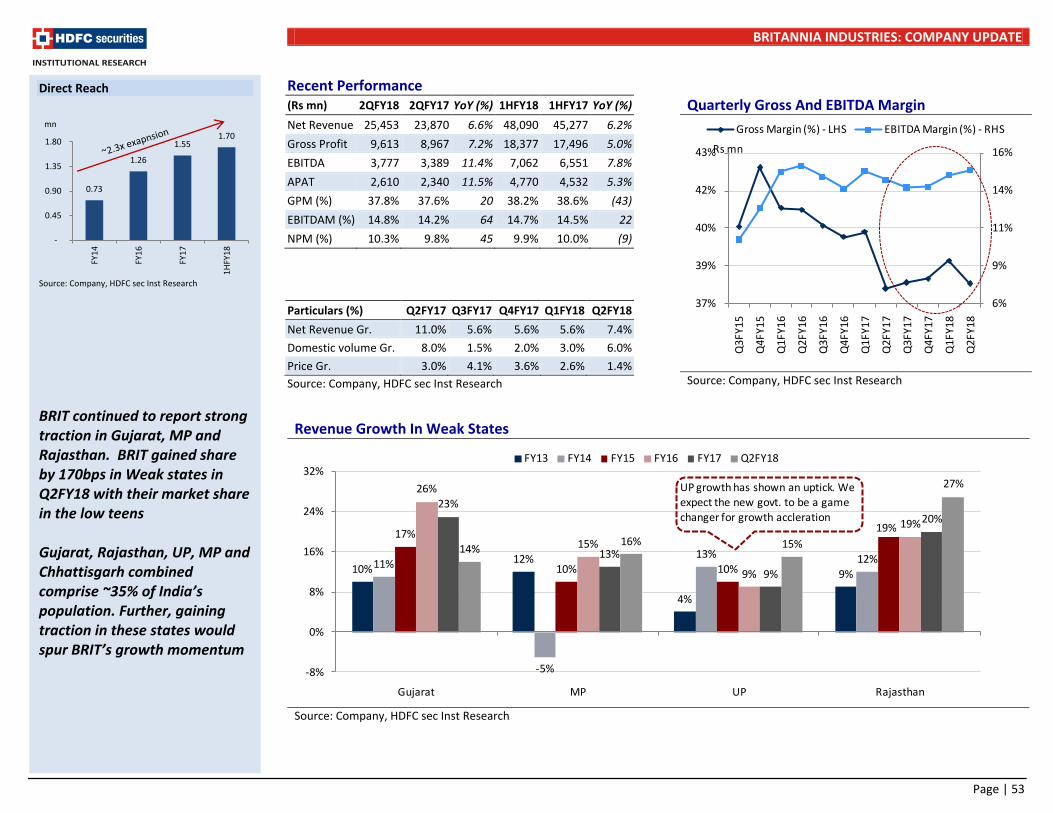
BRITANNIA INDUSTRIES: COMPANY UPDATE
Page | 53
Recent Performance (Rs mn) 2QFY18 2QFY17 YoY (%) 1HFY18 1HFY17 YoY (%)
Net Revenue 25,453 23,870 6.6% 48,090 45,277 6.2%
Gross Profit 9,613 8,967 7.2% 18,377 17,496 5.0%
EBITDA 3,777 3,389 11.4% 7,062 6,551 7.8%
APAT 2,610 2,340 11.5% 4,770 4,532 5.3%
GPM (%) 37.8% 37.6% 20 38.2% 38.6% (43)
EBITDAM (%) 14.8% 14.2% 64 14.7% 14.5% 22
NPM (%) 10.3% 9.8% 45 9.9% 10.0% (9)
Particulars (%) Q2FY17 Q3FY17 Q4FY17 Q1FY18 Q2FY18
Net Revenue Gr. 11.0% 5.6% 5.6% 5.6% 7.4%
Domestic volume Gr. 8.0% 1.5% 2.0% 3.0% 6.0%
Price Gr. 3.0% 4.1% 3.6% 2.6% 1.4%
Source: Company, HDFC sec Inst Research
Quarterly Gross And EBITDA Margin
Source: Company, HDFC sec Inst Research
Revenue Growth In Weak States
Source: Company, HDFC sec Inst Research
6%
9%
11%
14%
16%
37%
39%
40%
42%
43%
Q3F
Y15
Q4F
Y15
Q1F
Y16
Q2F
Y16
Q3F
Y16
Q4F
Y16
Q1F
Y17
Q2F
Y17
Q3F
Y17
Q4F
Y17
Q1F
Y18
Q2F
Y18
Gross Margin (%) - LHS EBITDA Margin (%) - RHS
Rs mn
10%12%
4%
9%11%
-5%
13% 12%
17%
10% 10%
19%
26%
15%
9%
19%
23%
13%
9%
20%
14%16% 15%
27%
-8%
0%
8%
16%
24%
32%
Gujarat MP UP Rajasthan
FY13 FY14 FY15 FY16 FY17 Q2FY18
UP growth has shown an uptick. We expect the new govt. to be a game changer for growth accleration
Direct Reach
Source: Company, HDFC sec Inst Research
BRIT continued to report strong traction in Gujarat, MP and Rajasthan. BRIT gained share by 170bps in Weak states in Q2FY18 with their market share in the low teens Gujarat, Rajasthan, UP, MP and Chhattisgarh combined comprise ~35% of India’s population. Further, gaining traction in these states would spur BRIT’s growth momentum
0.73
1.26
1.55 1.70
-
0.45
0.90
1.35
1.80
FY1
4
FY1
6
FY1
7
1H
FY1
8
mn

BRITANNIA INDUSTRIES: COMPANY UPDATE
Page | 54
Income Statement (Rs mn) FY16 FY17 FY18E FY19E FY20E
Net Revenues 83,972 90,541 100,752 115,891 133,291
Growth (%) 10.4 7.8 11.3 15.0 15.0
Material Expenses 50,127 55,887 60,955 69,534 79,308
Employee Expense 3,414 3,526 4,091 4,518 4,991
ASP Expense 4,461 3,850 4,284 5,160 6,268
Distribution Expense 4,310 4,459 4,836 5,273 5,798
Other Expense 9,517 10,037 11,169 12,847 14,776
EBITDA 12,144 12,782 15,417 18,558 22,150
EBITDA Growth (%) 40.6 5.3 20.6 20.4 19.4
EBITDA Margin (%) 14.5 14.1 15.3 16.0 16.6
Depreciation & Amortisation 1,134 1,193 1,393 1,593 1,805
EBIT 11,010 11,589 14,024 16,966 20,345
Other Income (Including EO Items)
1,244 1,505 1,393 1,649 2,251
Interest 49 55 50 30 27
PBT 12,205 13,040 15,367 18,584 22,568
Tax 3,961 4,197 5,071 5,761 6,770
RPAT 8,246 8,846 10,296 12,823 15,798
Adjustment - - - - -
APAT 8,246 8,846 10,296 12,823 15,798
APAT Growth (%) 27.2 7.3 16.4 24.6 23.2
Adjusted EPS (Rs) 68.7 73.7 85.8 106.9 131.6
EPS Growth (%) 27.1 7.3 16.4 24.6 23.2
Source: Company, HDFC sec Inst Research
Balance Sheet (Rs mn) FY16 FY17 FY18E FY19E FY20E
SOURCES OF FUNDS
Share Capital - Equity 240 240 240 240 240
Reserves 20,739 26,767 33,451 41,942 53,118
Total Shareholders Funds 20,979 27,007 33,691 42,182 53,358
Minority interest 25 26 26 26 26
Long Term Debt 377 314 264 214 164
Short Term Debt 934 922 881 844 809
Total Debt 1,311 1,236 1,145 1,058 973
Net Deferred Taxes (444) (231) (231) (231) (231)
Non Current Liabilities 282 307 345 393 448
TOTAL SOURCES OF FUNDS 22,153 28,344 34,976 43,428 54,573
APPLICATION OF FUNDS
Net Block 8,343 10,322 12,353 14,300 16,035
CWIP (Including capital advances) 901 301 - - -
Goodwill 1,159 1,278 1,278 1,278 1,278
LT Loans & Advances 2,562 834 928 1,068 1,228
Other Non Current Assets 562 1,610 1,791 2,061 2,370
Total Non-current Assets 13,528 14,345 16,351 18,706 20,911
Inventories 4,407 6,615 7,360 8,466 9,738
Debtors 1,706 1,792 1,994 2,293 2,638
Other Current Assets 6,095 12,030 13,387 15,398 17,710
Cash & Equivalents 8,760 6,076 13,460 18,951 26,679
Total Current Assets 20,967 26,512 36,201 45,109 56,765
Creditors 9,827 9,822 14,581 16,944 19,141
Other Current Liabilities 2,516 2,691 2,994 3,444 3,961
Total Current Liabilities 12,343 12,513 17,575 20,388 23,102
Source: Company, HDFC sec Inst Research

BRITANNIA INDUSTRIES: COMPANY UPDATE
Page | 55
Cash Flow Statement (Rs mn) FY16 FY17 FY18E FY19E FY20E
Reported PBT 11,979 13,040 15,367 18,584 22,568
Non-operating & EO Items (872) - - - -
Interest Expenses 49 55 50 30 27
Depreciation 1,134 1,193 1,393 1,593 1,805
Working Capital Change 1,356 (8,072) 2,717 (641) (1,248)
Tax Paid (4,032) (4,197) (5,071) (5,761) (6,770)
OPERATING CASH FLOW ( a ) 9,614 2,019 14,455 13,805 16,382
Capex (2,494) (2,574) (3,239) (3,540) (3,540)
Free Cash Flow (FCF) 7,120 (555) 11,216 10,265 12,842
Investments (5,967) 3,002 (500) (500) (500)
Non-operating Income 1,409 978 (120) (361) (415)
INVESTING CASH FLOW ( b ) (7,052) 1,406 (3,860) (4,401) (4,455)
Debt Issuance/(Repaid) (168) (63) (50) (50) (50)
Interest Expenses (51) (55) (50) (30) (27)
FCFE 2,343 3,308 10,495 9,324 11,850
Share Capital Issuance 44 - - - -
Dividend (2,308) (3,177) (3,611) (4,333) (4,622)
Others - - - - -
FINANCING CASH FLOW ( c ) (2,483) (3,295) (3,711) (4,413) (4,699)
NET CASH FLOW (a+b+c) 78 130 6,884 4,992 7,228
EO Items, Others 379 188 (1) - -
Closing Cash & Equivalents 889 1,208 8,091 13,083 20,311
Source: Company, HDFC sec Inst Research
Key Ratios FY16 FY17 FY18E FY19E FY20E
PROFITABILITY (%)
GPM 40.3 38.3 39.5 40.0 40.5
ASP 5.3 4.3 4.3 4.5 4.7
EBITDA Margin 14.5 14.1 15.3 16.0 16.6
EBIT Margin 13.1 12.8 13.9 14.6 15.3
APAT Margin 9.8 9.8 10.2 11.1 11.9
RoE 49.3 36.9 33.9 33.8 33.1
RoIC (or Core RoCE) 74.8 44.1 42.9 50.9 54.4
RoCE 45.9 35.2 32.6 32.8 32.3
EFFICIENCY
Tax Rate (%) 32.5 32.2 33.0 31.0 30.0
Fixed Asset Turnover (x) 4.4 4.0 3.9 3.9 4.0
Inventory (days) 19.2 26.7 26.7 26.7 26.7
Debtors (days) 7.42 7.22 7.22 7.22 7.22
Other Current Assets (days) 26.5 48.5 48.5 48.5 48.5
Payables (days) 42.7 39.6 52.8 53.4 52.4
Other Current Liab & Provns (days) 10.9 10.8 10.8 10.8 10.8
Cash Conversion Cycle (days) (0.6) 31.9 18.7 18.2 19.1
Net D/E (x) (0.4) (0.2) (0.4) (0.4) (0.5)
Interest Coverage (x) 226.1 212.6 278.4 561.6 747.7
PER SHARE DATA (Rs)
EPS 68.7 73.7 85.8 106.9 131.6
CEPS 78.2 83.7 97.4 120.1 146.7
Dividend 20.0 22.0 25.0 30.0 32.0
Book Value 174.8 225.1 280.8 351.5 444.6
VALUATION
P/E (x) 68.9 64.2 55.2 44.3 36.0
P/BV (x) 27.1 21.0 16.9 13.5 10.6
EV/EBITDA (x) 46.2 44.1 36.0 29.6 24.5
EV/Revenues (x) 6.7 6.2 5.5 4.7 4.1
OCF/EV (%) 1.7 0.4 2.6 2.5 3.0
Source: Company, HDFC sec Inst Research
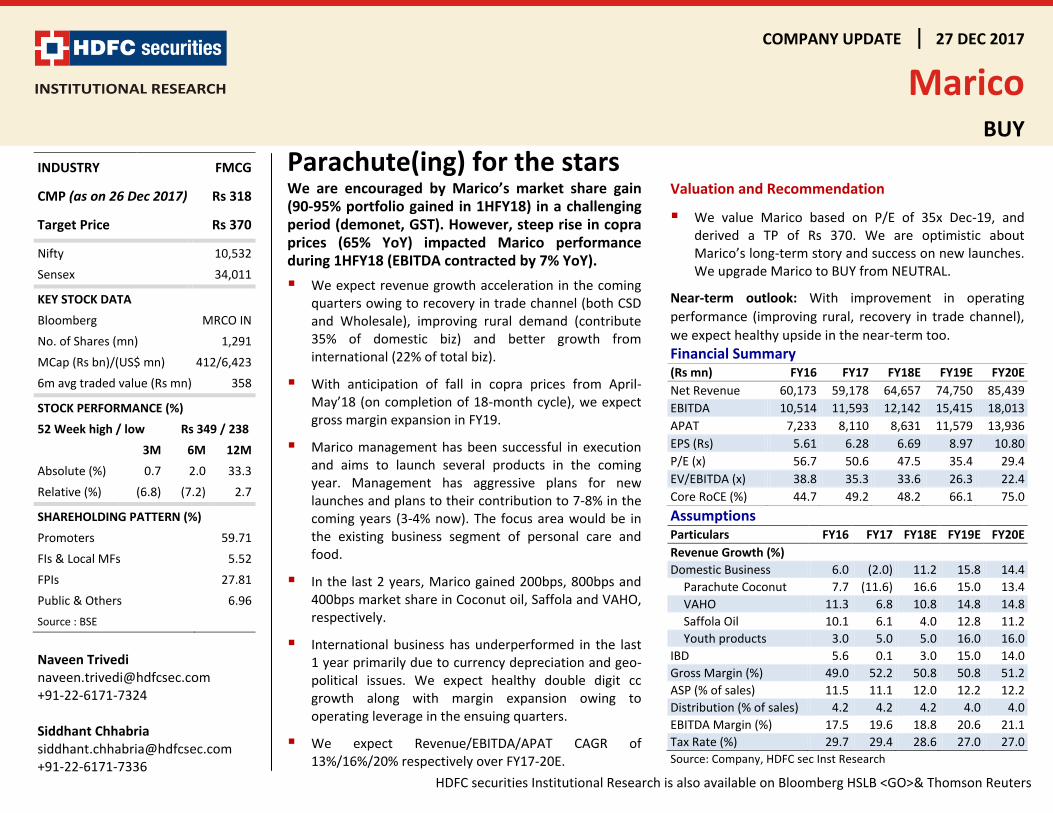
COMPANY UPDATE 27 DEC 2017
Marico
BUY
HDFC securities Institutional Research is also available on Bloomberg HSLB <GO>& Thomson Reuters
Parachute(ing) for the stars We are encouraged by Marico’s market share gain (90-95% portfolio gained in 1HFY18) in a challenging period (demonet, GST). However, steep rise in copra prices (65% YoY) impacted Marico performance during 1HFY18 (EBITDA contracted by 7% YoY).
We expect revenue growth acceleration in the coming quarters owing to recovery in trade channel (both CSD and Wholesale), improving rural demand (contribute 35% of domestic biz) and better growth from international (22% of total biz).
With anticipation of fall in copra prices from April-May’18 (on completion of 18-month cycle), we expect gross margin expansion in FY19.
Marico management has been successful in execution and aims to launch several products in the coming year. Management has aggressive plans for new launches and plans to their contribution to 7-8% in the coming years (3-4% now). The focus area would be in the existing business segment of personal care and food.
In the last 2 years, Marico gained 200bps, 800bps and 400bps market share in Coconut oil, Saffola and VAHO, respectively.
International business has underperformed in the last 1 year primarily due to currency depreciation and geo-political issues. We expect healthy double digit cc growth along with margin expansion owing to operating leverage in the ensuing quarters.
We expect Revenue/EBITDA/APAT CAGR of 13%/16%/20% respectively over FY17-20E.
Valuation and Recommendation
We value Marico based on P/E of 35x Dec-19, and derived a TP of Rs 370. We are optimistic about Marico’s long-term story and success on new launches. We upgrade Marico to BUY from NEUTRAL.
Near-term outlook: With improvement in operating
performance (improving rural, recovery in trade channel),
we expect healthy upside in the near-term too.
Financial Summary (Rs mn) FY16 FY17 FY18E FY19E FY20E
Net Revenue 60,173 59,178 64,657 74,750 85,439
EBITDA 10,514 11,593 12,142 15,415 18,013
APAT 7,233 8,110 8,631 11,579 13,936
EPS (Rs) 5.61 6.28 6.69 8.97 10.80
P/E (x) 56.7 50.6 47.5 35.4 29.4
EV/EBITDA (x) 38.8 35.3 33.6 26.3 22.4
Core RoCE (%) 44.7 49.2 48.2 66.1 75.0
Assumptions Particulars FY16 FY17 FY18E FY19E FY20E
Revenue Growth (%)
Domestic Business 6.0 (2.0) 11.2 15.8 14.4
Parachute Coconut 7.7 (11.6) 16.6 15.0 13.4
VAHO 11.3 6.8 10.8 14.8 14.8
Saffola Oil 10.1 6.1 4.0 12.8 11.2
Youth products 3.0 5.0 5.0 16.0 16.0
IBD 5.6 0.1 3.0 15.0 14.0
Gross Margin (%) 49.0 52.2 50.8 50.8 51.2
ASP (% of sales) 11.5 11.1 12.0 12.2 12.2
Distribution (% of sales) 4.2 4.2 4.2 4.0 4.0
EBITDA Margin (%) 17.5 19.6 18.8 20.6 21.1
Tax Rate (%) 29.7 29.4 28.6 27.0 27.0
Source: Company, HDFC sec Inst Research
INDUSTRY FMCG
CMP (as on 26 Dec 2017) Rs 318
Target Price Rs 370
Nifty 10,532
Sensex 34,011
KEY STOCK DATA
Bloomberg MRCO IN
No. of Shares (mn) 1,291
MCap (Rs bn)/(US$ mn) 412/6,423
6m avg traded value (Rs mn) 358
STOCK PERFORMANCE (%)
52 Week high / low Rs 349 / 238
3M 6M 12M
Absolute (%) 0.7 2.0 33.3
Relative (%) (6.8) (7.2) 2.7
SHAREHOLDING PATTERN (%)
Promoters 59.71
FIs & Local MFs 5.52
FPIs 27.81
Public & Others 6.96
Source : BSE
Naveen Trivedi [email protected] +91-22-6171-7324 Siddhant Chhabria [email protected] +91-22-6171-7336
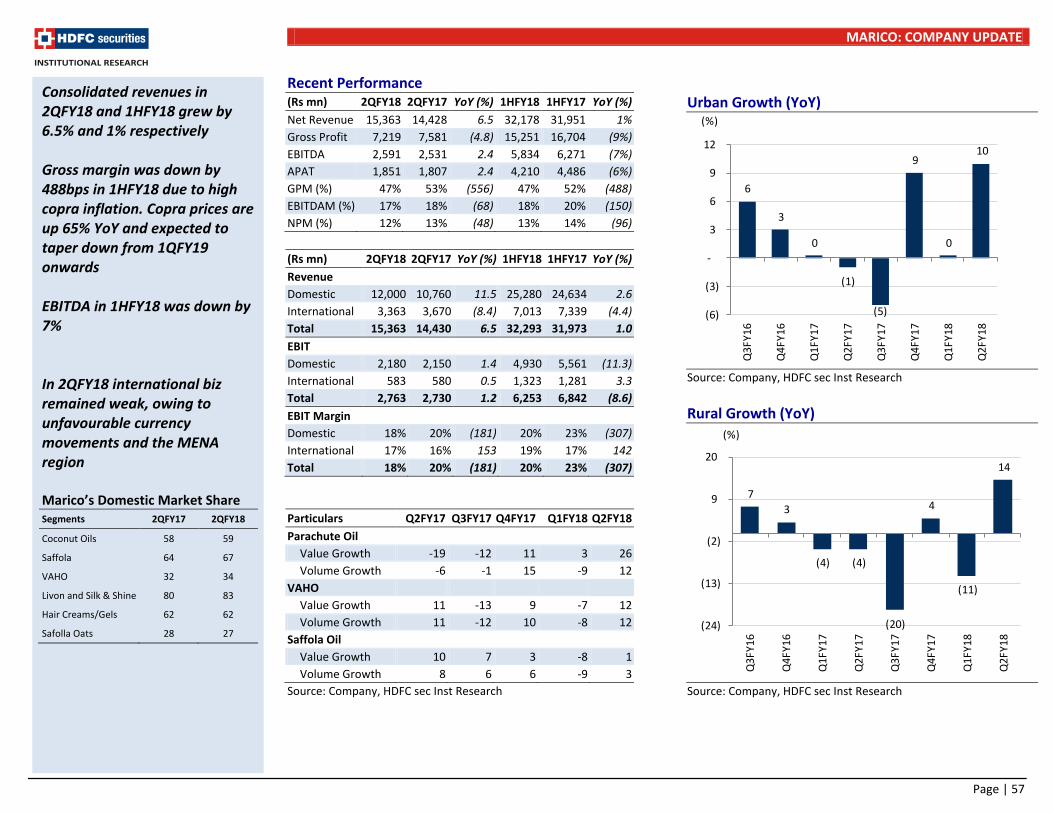
MARICO: COMPANY UPDATE
Page | 57
Recent Performance (Rs mn) 2QFY18 2QFY17 YoY (%) 1HFY18 1HFY17 YoY (%)
Net Revenue 15,363 14,428 6.5 32,178 31,951 1%
Gross Profit 7,219 7,581 (4.8) 15,251 16,704 (9%)
EBITDA 2,591 2,531 2.4 5,834 6,271 (7%)
APAT 1,851 1,807 2.4 4,210 4,486 (6%)
GPM (%) 47% 53% (556) 47% 52% (488)
EBITDAM (%) 17% 18% (68) 18% 20% (150)
NPM (%) 12% 13% (48) 13% 14% (96)
(Rs mn) 2QFY18 2QFY17 YoY (%) 1HFY18 1HFY17 YoY (%)
Revenue
Domestic 12,000 10,760 11.5 25,280 24,634 2.6
International 3,363 3,670 (8.4) 7,013 7,339 (4.4)
Total 15,363 14,430 6.5 32,293 31,973 1.0
EBIT
Domestic 2,180 2,150 1.4 4,930 5,561 (11.3)
International 583 580 0.5 1,323 1,281 3.3
Total 2,763 2,730 1.2 6,253 6,842 (8.6)
EBIT Margin
Domestic 18% 20% (181) 20% 23% (307)
International 17% 16% 153 19% 17% 142
Total 18% 20% (181) 20% 23% (307)
Particulars Q2FY17 Q3FY17 Q4FY17 Q1FY18 Q2FY18
Parachute Oil
Value Growth -19 -12 11 3 26
Volume Growth -6 -1 15 -9 12
VAHO
Value Growth 11 -13 9 -7 12
Volume Growth 11 -12 10 -8 12
Saffola Oil
Value Growth 10 7 3 -8 1
Volume Growth 8 6 6 -9 3
Source: Company, HDFC sec Inst Research
Urban Growth (YoY)
Source: Company, HDFC sec Inst Research
Rural Growth (YoY)
Source: Company, HDFC sec Inst Research
Consolidated revenues in 2QFY18 and 1HFY18 grew by 6.5% and 1% respectively Gross margin was down by 488bps in 1HFY18 due to high copra inflation. Copra prices are up 65% YoY and expected to taper down from 1QFY19 onwards EBITDA in 1HFY18 was down by 7% In 2QFY18 international biz remained weak, owing to unfavourable currency movements and the MENA region Marico’s Domestic Market Share Segments 2QFY17 2QFY18
Coconut Oils 58 59
Saffola 64 67
VAHO 32 34
Livon and Silk & Shine 80 83
Hair Creams/Gels 62 62
Safolla Oats 28 27
6
3
0
(1)
(5)
9
0
10
(6)
(3)
-
3
6
9
12
Q3
FY1
6
Q4
FY1
6
Q1
FY1
7
Q2
FY1
7
Q3
FY1
7
Q4
FY1
7
Q1
FY1
8
Q2
FY1
8
(%)
7
3
(4) (4)
(20)
4
(11)
14
(24)
(13)
(2)
9
20
Q3F
Y16
Q4
FY16
Q1
FY17
Q2
FY17
Q3
FY17
Q4
FY17
Q1
FY18
Q2
FY18
(%)
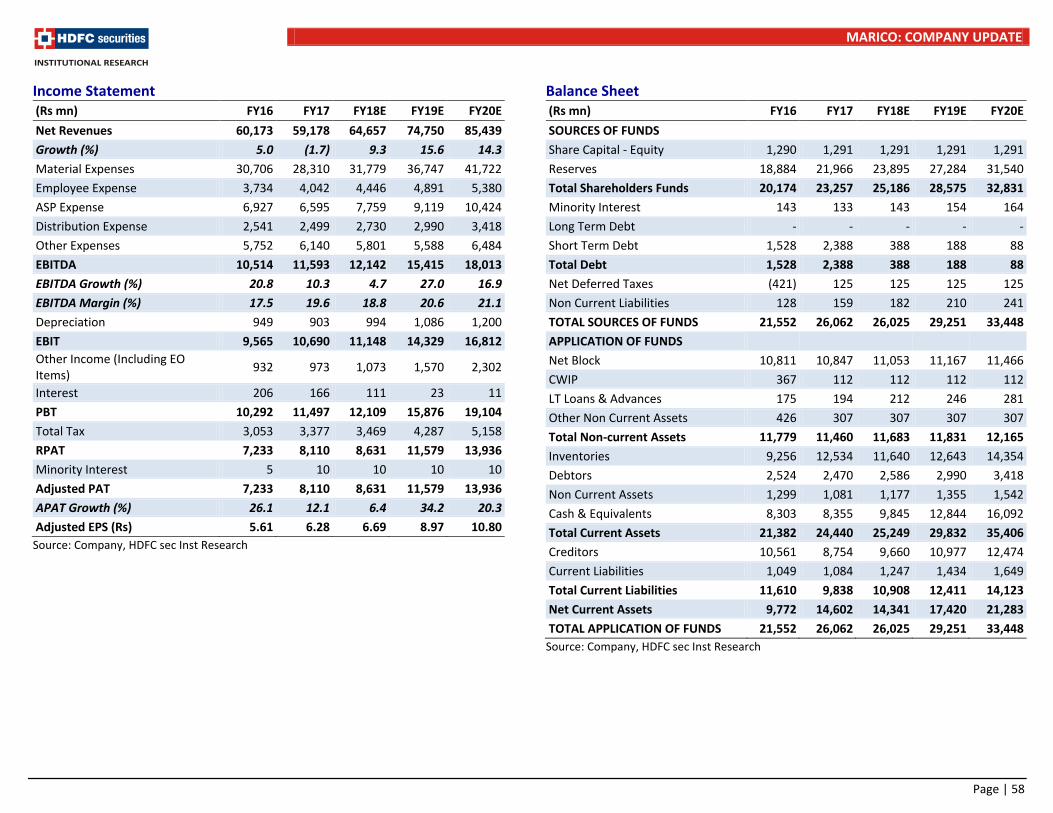
MARICO: COMPANY UPDATE
Page | 58
Income Statement (Rs mn) FY16 FY17 FY18E FY19E FY20E
Net Revenues 60,173 59,178 64,657 74,750 85,439
Growth (%) 5.0 (1.7) 9.3 15.6 14.3
Material Expenses 30,706 28,310 31,779 36,747 41,722
Employee Expense 3,734 4,042 4,446 4,891 5,380
ASP Expense 6,927 6,595 7,759 9,119 10,424
Distribution Expense 2,541 2,499 2,730 2,990 3,418
Other Expenses 5,752 6,140 5,801 5,588 6,484
EBITDA 10,514 11,593 12,142 15,415 18,013
EBITDA Growth (%) 20.8 10.3 4.7 27.0 16.9
EBITDA Margin (%) 17.5 19.6 18.8 20.6 21.1
Depreciation 949 903 994 1,086 1,200
EBIT 9,565 10,690 11,148 14,329 16,812
Other Income (Including EO Items)
932 973 1,073 1,570 2,302
Interest 206 166 111 23 11
PBT 10,292 11,497 12,109 15,876 19,104
Total Tax 3,053 3,377 3,469 4,287 5,158
RPAT 7,233 8,110 8,631 11,579 13,936
Minority Interest 5 10 10 10 10
Adjusted PAT 7,233 8,110 8,631 11,579 13,936
APAT Growth (%) 26.1 12.1 6.4 34.2 20.3
Adjusted EPS (Rs) 5.61 6.28 6.69 8.97 10.80
Source: Company, HDFC sec Inst Research
Balance Sheet (Rs mn) FY16 FY17 FY18E FY19E FY20E
SOURCES OF FUNDS
Share Capital - Equity 1,290 1,291 1,291 1,291 1,291
Reserves 18,884 21,966 23,895 27,284 31,540
Total Shareholders Funds 20,174 23,257 25,186 28,575 32,831
Minority Interest 143 133 143 154 164
Long Term Debt - - - - -
Short Term Debt 1,528 2,388 388 188 88
Total Debt 1,528 2,388 388 188 88
Net Deferred Taxes (421) 125 125 125 125
Non Current Liabilities 128 159 182 210 241
TOTAL SOURCES OF FUNDS 21,552 26,062 26,025 29,251 33,448
APPLICATION OF FUNDS
Net Block 10,811 10,847 11,053 11,167 11,466
CWIP 367 112 112 112 112
LT Loans & Advances 175 194 212 246 281
Other Non Current Assets 426 307 307 307 307
Total Non-current Assets 11,779 11,460 11,683 11,831 12,165
Inventories 9,256 12,534 11,640 12,643 14,354
Debtors 2,524 2,470 2,586 2,990 3,418
Non Current Assets 1,299 1,081 1,177 1,355 1,542
Cash & Equivalents 8,303 8,355 9,845 12,844 16,092
Total Current Assets 21,382 24,440 25,249 29,832 35,406
Creditors 10,561 8,754 9,660 10,977 12,474
Current Liabilities 1,049 1,084 1,247 1,434 1,649
Total Current Liabilities 11,610 9,838 10,908 12,411 14,123
Net Current Assets 9,772 14,602 14,341 17,420 21,283
TOTAL APPLICATION OF FUNDS 21,552 26,062 26,025 29,251 33,448
Source: Company, HDFC sec Inst Research
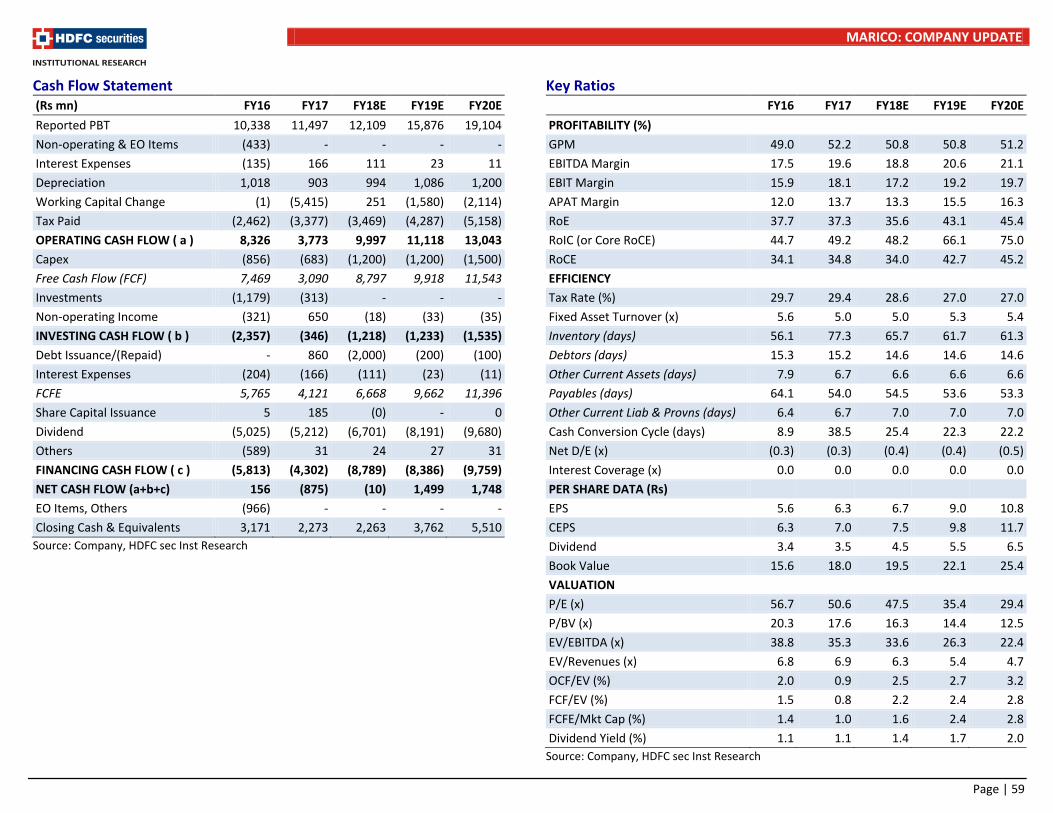
MARICO: COMPANY UPDATE
Page | 59
Cash Flow Statement (Rs mn) FY16 FY17 FY18E FY19E FY20E
Reported PBT 10,338 11,497 12,109 15,876 19,104
Non-operating & EO Items (433) - - - -
Interest Expenses (135) 166 111 23 11
Depreciation 1,018 903 994 1,086 1,200
Working Capital Change (1) (5,415) 251 (1,580) (2,114)
Tax Paid (2,462) (3,377) (3,469) (4,287) (5,158)
OPERATING CASH FLOW ( a ) 8,326 3,773 9,997 11,118 13,043
Capex (856) (683) (1,200) (1,200) (1,500)
Free Cash Flow (FCF) 7,469 3,090 8,797 9,918 11,543
Investments (1,179) (313) - - -
Non-operating Income (321) 650 (18) (33) (35)
INVESTING CASH FLOW ( b ) (2,357) (346) (1,218) (1,233) (1,535)
Debt Issuance/(Repaid) - 860 (2,000) (200) (100)
Interest Expenses (204) (166) (111) (23) (11)
FCFE 5,765 4,121 6,668 9,662 11,396
Share Capital Issuance 5 185 (0) - 0
Dividend (5,025) (5,212) (6,701) (8,191) (9,680)
Others (589) 31 24 27 31
FINANCING CASH FLOW ( c ) (5,813) (4,302) (8,789) (8,386) (9,759)
NET CASH FLOW (a+b+c) 156 (875) (10) 1,499 1,748
EO Items, Others (966) - - - -
Closing Cash & Equivalents 3,171 2,273 2,263 3,762 5,510
Source: Company, HDFC sec Inst Research
Key Ratios FY16 FY17 FY18E FY19E FY20E
PROFITABILITY (%)
GPM 49.0 52.2 50.8 50.8 51.2
EBITDA Margin 17.5 19.6 18.8 20.6 21.1
EBIT Margin 15.9 18.1 17.2 19.2 19.7
APAT Margin 12.0 13.7 13.3 15.5 16.3
RoE 37.7 37.3 35.6 43.1 45.4
RoIC (or Core RoCE) 44.7 49.2 48.2 66.1 75.0
RoCE 34.1 34.8 34.0 42.7 45.2
EFFICIENCY
Tax Rate (%) 29.7 29.4 28.6 27.0 27.0
Fixed Asset Turnover (x) 5.6 5.0 5.0 5.3 5.4
Inventory (days) 56.1 77.3 65.7 61.7 61.3
Debtors (days) 15.3 15.2 14.6 14.6 14.6
Other Current Assets (days) 7.9 6.7 6.6 6.6 6.6
Payables (days) 64.1 54.0 54.5 53.6 53.3
Other Current Liab & Provns (days) 6.4 6.7 7.0 7.0 7.0
Cash Conversion Cycle (days) 8.9 38.5 25.4 22.3 22.2
Net D/E (x) (0.3) (0.3) (0.4) (0.4) (0.5)
Interest Coverage (x) 0.0 0.0 0.0 0.0 0.0
PER SHARE DATA (Rs)
EPS 5.6 6.3 6.7 9.0 10.8
CEPS 6.3 7.0 7.5 9.8 11.7
Dividend 3.4 3.5 4.5 5.5 6.5
Book Value 15.6 18.0 19.5 22.1 25.4
VALUATION
P/E (x) 56.7 50.6 47.5 35.4 29.4
P/BV (x) 20.3 17.6 16.3 14.4 12.5
EV/EBITDA (x) 38.8 35.3 33.6 26.3 22.4
EV/Revenues (x) 6.8 6.9 6.3 5.4 4.7
OCF/EV (%) 2.0 0.9 2.5 2.7 3.2
FCF/EV (%) 1.5 0.8 2.2 2.4 2.8
FCFE/Mkt Cap (%) 1.4 1.0 1.6 2.4 2.8
Dividend Yield (%) 1.1 1.1 1.4 1.7 2.0
Source: Company, HDFC sec Inst Research
COMPANY UPDATE 27 DEC 2017
Colgate-Palmolive
NEUTRAL
HDFC securities Institutional Research is also available on Bloomberg HSLB <GO>& Thomson Reuters
Awaiting For Revival Colgate continued to lose market share due to rising competition from Patanjali and Dabur. Its Toothpaste and Toothbrush market share stood at 54% (-170bps YoY) and 45.5% (-110bps YoY). Colgate was the only FMCG company in our coverage which reported volume decline (-1%) in 2QFY18, despite benefits of restocking owing to GST transition.
In response to the euphoria around Ayurvedic/Natural products Colgate strengthened its natural portfolio through Colgate Cibaca Vedshakti and Colgate Swarna Vedshakti (premium).
Colgate was among the key beneficiaries of GST (lower bracket of 18%) as a result the company managed an 8-9% price cut. We will keenly watch if Colgate can regain/maintain market share.
Colgate improved its EBITDA margins by 185bps in 1HFY18 (YoY) primarily by cutting down on its A&P spend by 112bps. We expect the company to increase ASP spend in ensuing quarters in order to protect/regain its market share.
We expect Revenue/EBITDA/APAT CAGR of 11%/13%/16% respectively over FY17-20E.
Valuation and Recommendation
With recovery in rural demand and normalizing trade channels, we are positive on the sector. However, Colgate, with a single-category presence, will find it difficult to capitalize on this vis-à-vis other companies. We valued Colgate based on P/E of 34x on Dec-19 EPS to arrive at a TP of 1,118. We maintain NEUTRAL.
Near-term outlook: We expect the recovery to be more U-
shaped in nature and expect the company to report higher
trajectory of growth. However, we prefer other mid-cap
companies like Emami and Dabur.
Financial Summary (Rs mn) FY16 FY17 FY18E FY19E FY20E
Net Revenue 38,682 39,818 42,916 48,088 53,884
EBITDA 9,382 9,444 10,567 12,208 13,957
APAT 6,031 5,774 6,639 7,862 9,246
EPS (Rs) 22.2 21.2 24.4 28.9 34.0
P/E (x) 48.8 51.0 44.4 37.5 31.8
EV/EBITDA (x) 31.0 30.8 27.3 23.3 20.2
Core RoCE (%) 82.2 58.3 59.5 74.3 91.8
Source: Company, HDFC sec Inst Research
Assumptions Particulars FY16 FY17 FY18E FY19E FY20E
Toothpaste Revenue Gr. (%)
(2.6) 2.7 7.6 12.3 12.3
Toothpaste Volume Gr. (%) 5.0 (2.0) 5.5 7.5 7.5
GM (%) 61.8 62.9 64.1 64.1 64.8
Employee (% of sales) 6.8 7.2 7.3 7.3 7.3
ASP (% of sales) 11.6 12.9 12.2 12.5 12.5
Distribution (% of sales) 3.6 3.2 3.1 3.0 3.2
Royalty (% of sales) 5.7 5.2 5.2 5.2 5.2
EBITDA Margin (%) 24.3 23.7 24.6 25.4 25.9
ETR (%) 30.4 32.2 31.5 31.0 30.0
Source: Company, HDFC sec Inst Research
INDUSTRY FMCG
CMP (as on 26 Dec 2017) Rs 1,082
Target Price Rs 1,118
Nifty 10,532
Sensex 34,011
KEY STOCK DATA
Bloomberg CLGT IN
No. of Shares (mn) 272
MCap (Rs bn)/(US$ mn) 295/4,600
6 m avg traded value (Rs mn) 356
STOCK PERFORMANCE (%)
52 Week high / low Rs 1,178/861
3M 6M 12M
Absolute (%) 0.3 (2.5) 21.0
Relative (%) (7.2) (11.7) (9.6)
SHAREHOLDING PATTERN (%)
Promoters 51.00
FIs & Local MFs 10.26
FPIs 15.97
Public & Others 22.77
Source : BSE
Naveen Trivedi [email protected] +91-22-6171-7324 Siddhant Chhabria [email protected] +91-22-6171-7336

COLGATE: COMPANY UPDATE
Page | 61
Recent Performance (Rs mn) 2QFY18 2QFY17 YoY (%) 1HFY18 1HFY17 YoY (%)
Net Revenue 10,780 10,483 3% 20,474 20,539 0%
Gross Profit 6,879 6,656 3% 13,077 12,965 1%
EBITDA 3,006 2,747 9% 5,224 4,860 8%
APAT 1,776 1,813 -2% 3,140 3,070 2%
GPM (%) 64% 63% 32 64% 63% 74
EBITDAM (%) 28% 26% 168 26% 24% 185
NPM (%) 16% 17% (82) 15% 15% 39
Particulars
1Q FY17
2Q FY17
3Q FY17
4Q FY17
1Q FY18
2Q FY18
Sales Gr. (%) 8.9% 9.4% -8.8% 2.5% -3.6% 2.8%
Volume Gr. (%) 6.0% 4.0% -12.0% -3.0% -5.0% -0.9%
Price Gr. (%)) 2.9% 5.4% 3.2% 5.5% 1.4% 3.7%
Volume Market Share
Toothpaste 55.9% 55.7% 55.4% 55.1% 54.3% 54.0%
Toothbrush 46.8% 46.6% 47.0% 47.4% 45.0% 45.5%
Toothpaste Market Share
Source: Company, HDFC sec Inst Research
Toothbrush Market Share
Source: Company, HDFC sec Inst Research
Flat revenue growth in 1HFY18. Expect recovery to be more gradual We expect Advertising spend to increase in the coming quarters. Colgate would spend more aggressively to accelerate volume growth EBITDA margin at 28% in 1HFY18 is healthy. However we expect increase in A&P spend to constrain margin expansion Colgate has reported volume decline in its last 4 consecutive quarters
48.8 48.452.2 53.3 52.7 54.5 56.1 57.0 57.4 55.6
25.1 24.6 22.8 22.6 23.3 23.5 22.8 21.3 19.6 19.1
11.9 12.2 12.9 13.714.8 14.0 13.4 13.4 13.9 15.3
0.0 0.1 0.4 0.6 1.3 2.80.0
10.0
20.0
30.0
40.0
50.0
60.0
2007
2008
2009
2010
2011
2012
2013
2014
2015
2016
Colgate Competitor 1
Competitor 2 Competitor 3(%)
33.4
38.4 38.035.9
39.842.3 42.8 44.4
47.3
11.4 11.914.8
17.8 18.8 18.4 18.2 17.414.6
5.9 6.4 7.2 7.2 6.7 7.5 7.9 9.3 10.7
0.0
10.0
20.0
30.0
40.0
50.0
60.0
20
08
20
09
20
10
20
11
20
12
20
13
20
14
20
15
20
16
Colgate Competitor 1 Competitor 2(%)

COLGATE: COMPANY UPDATE
Page | 62
Income Statement (Rs mn) FY16 FY17 FY18E FY19E FY20E
Net Revenues 38,682 39,818 42,916 48,088 53,884
Growth (%) 4.5 2.9 7.8 12.1 12.1
Material Expenses 14,766 14,768 15,426 17,242 18,983
Employee Expense 2,624 2,885 3,142 3,500 3,960
ASP Expense 4,476 5,118 5,246 6,002 6,725
Distribution Expense 1,390 1,274 1,330 1,443 1,724
Other Expenses 6,044 6,330 7,205 7,693 8,535
EBITDA 9,382 9,444 10,567 12,208 13,957
EBITDA Growth (%) 14.1 0.7 11.9 15.5 14.3
EBITDA Margin (%) 24.3 23.7 24.6 25.4 25.9
Depreciation 1,114 1,332 1,505 1,634 1,795
EBIT 8,268 8,112 9,062 10,574 12,162
Other Income (Including EO Items)
86 403 629 820 1,047
Interest - - - - -
PBT 8,354 8,514 9,691 11,394 13,209
Total Tax 2,541 2,740 3,053 3,532 3,963
RPAT 5,812 5,774 6,639 7,862 9,246
Exceptional Gain/(loss) (218) - - - -
Adjusted PAT 6,031 5,774 6,639 7,862 9,246
APAT Growth (%) 7.9 (4.2) 15.0 18.4 17.6
Adjusted EPS (Rs) 22.2 21.2 24.4 28.9 34.0
EPS Growth (%) 7.8 (4.2) 15.0 18.4 17.6
Source: Company, HDFC sec Inst Research
Balance Sheet (Rs mn) FY16 FY17 FY18E FY19E FY20E
SOURCES OF FUNDS
Share Capital - Equity 272 272 272 272 272
Reserves 10,038 12,614 15,353 18,596 20,780
Total Shareholders Funds 10,311 12,887 15,625 18,868 21,053
Long Term Debt - - - - -
Short Term Debt - - - - -
Total Debt - - - - -
Net Deferred Taxes 400 275 275 275 275
Other Non-current Liabilities & Provns
1,235 1,004 1,023 1,049 1,078
TOTAL SOURCES OF FUNDS 11,945 14,166 16,923 20,192 22,405
APPLICATION OF FUNDS
Net Block 10,081 11,081 11,717 11,683 11,888
CWIP 784 1,666 833 - -
Other Non-current Assets 1,191 1,157 1,272 1,400 1,536
Total Non-current Assets 12,056 13,904 13,822 13,083 13,424
Inventories 2,915 2,926 3,110 3,464 3,852
Debtors 1,015 1,299 1,400 1,569 1,758
Other Current Assets 951 1,630 1,793 1,973 2,170
Cash & Equivalents 3,198 3,356 6,309 10,621 12,871
Total Current Assets 8,080 9,211 12,612 17,627 20,651
Creditors 7,902 8,653 9,215 10,221 11,374
Other Current Liabilities & Provns 290 296 296 296 296
Total Current Liabilities 8,191 8,949 9,511 10,517 11,670
Net Current Assets (111) 262 3,101 7,110 8,981
TOTAL APPLICATION OF FUNDS 11,945 14,166 16,923 20,192 22,405
Source: Company, HDFC sec Inst Research
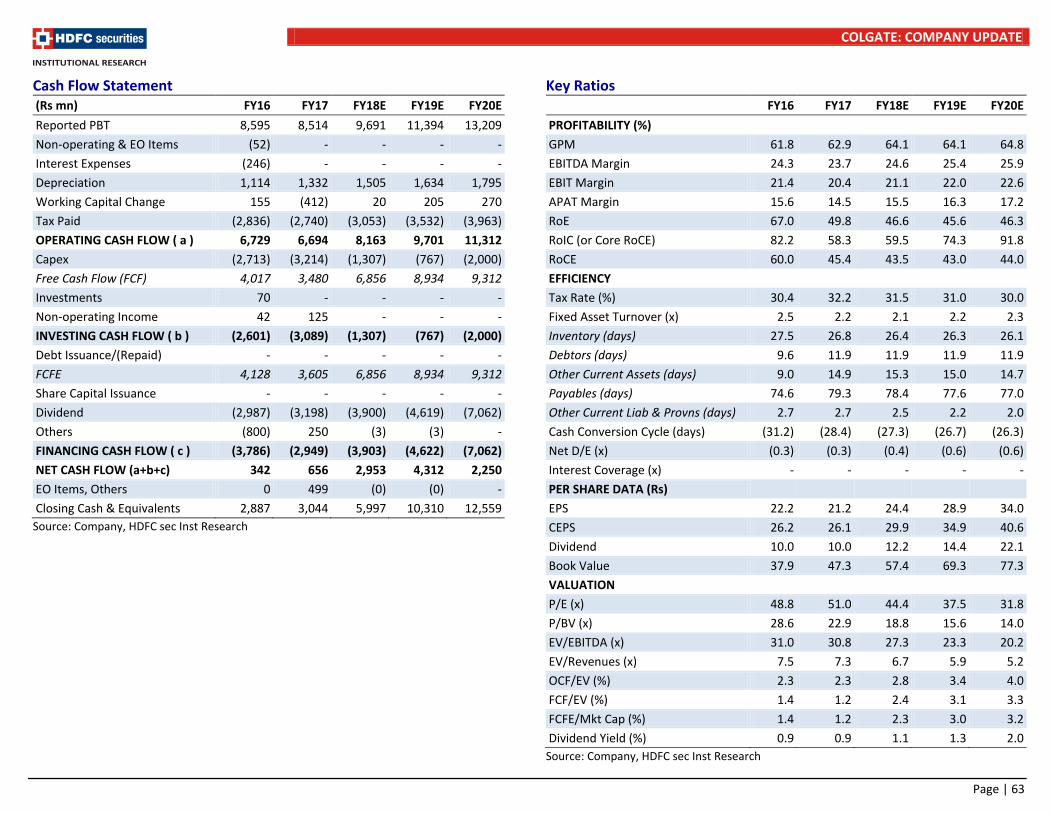
COLGATE: COMPANY UPDATE
Page | 63
Cash Flow Statement (Rs mn) FY16 FY17 FY18E FY19E FY20E
Reported PBT 8,595 8,514 9,691 11,394 13,209
Non-operating & EO Items (52) - - - -
Interest Expenses (246) - - - -
Depreciation 1,114 1,332 1,505 1,634 1,795
Working Capital Change 155 (412) 20 205 270
Tax Paid (2,836) (2,740) (3,053) (3,532) (3,963)
OPERATING CASH FLOW ( a ) 6,729 6,694 8,163 9,701 11,312
Capex (2,713) (3,214) (1,307) (767) (2,000)
Free Cash Flow (FCF) 4,017 3,480 6,856 8,934 9,312
Investments 70 - - - -
Non-operating Income 42 125 - - -
INVESTING CASH FLOW ( b ) (2,601) (3,089) (1,307) (767) (2,000)
Debt Issuance/(Repaid) - - - - -
FCFE 4,128 3,605 6,856 8,934 9,312
Share Capital Issuance - - - - -
Dividend (2,987) (3,198) (3,900) (4,619) (7,062)
Others (800) 250 (3) (3) -
FINANCING CASH FLOW ( c ) (3,786) (2,949) (3,903) (4,622) (7,062)
NET CASH FLOW (a+b+c) 342 656 2,953 4,312 2,250
EO Items, Others 0 499 (0) (0) -
Closing Cash & Equivalents 2,887 3,044 5,997 10,310 12,559
Source: Company, HDFC sec Inst Research
Key Ratios FY16 FY17 FY18E FY19E FY20E
PROFITABILITY (%)
GPM 61.8 62.9 64.1 64.1 64.8
EBITDA Margin 24.3 23.7 24.6 25.4 25.9
EBIT Margin 21.4 20.4 21.1 22.0 22.6
APAT Margin 15.6 14.5 15.5 16.3 17.2
RoE 67.0 49.8 46.6 45.6 46.3
RoIC (or Core RoCE) 82.2 58.3 59.5 74.3 91.8
RoCE 60.0 45.4 43.5 43.0 44.0
EFFICIENCY
Tax Rate (%) 30.4 32.2 31.5 31.0 30.0
Fixed Asset Turnover (x) 2.5 2.2 2.1 2.2 2.3
Inventory (days) 27.5 26.8 26.4 26.3 26.1
Debtors (days) 9.6 11.9 11.9 11.9 11.9
Other Current Assets (days) 9.0 14.9 15.3 15.0 14.7
Payables (days) 74.6 79.3 78.4 77.6 77.0
Other Current Liab & Provns (days) 2.7 2.7 2.5 2.2 2.0
Cash Conversion Cycle (days) (31.2) (28.4) (27.3) (26.7) (26.3)
Net D/E (x) (0.3) (0.3) (0.4) (0.6) (0.6)
Interest Coverage (x) - - - - -
PER SHARE DATA (Rs)
EPS 22.2 21.2 24.4 28.9 34.0
CEPS 26.2 26.1 29.9 34.9 40.6
Dividend 10.0 10.0 12.2 14.4 22.1
Book Value 37.9 47.3 57.4 69.3 77.3
VALUATION
P/E (x) 48.8 51.0 44.4 37.5 31.8
P/BV (x) 28.6 22.9 18.8 15.6 14.0
EV/EBITDA (x) 31.0 30.8 27.3 23.3 20.2
EV/Revenues (x) 7.5 7.3 6.7 5.9 5.2
OCF/EV (%) 2.3 2.3 2.8 3.4 4.0
FCF/EV (%) 1.4 1.2 2.4 3.1 3.3
FCFE/Mkt Cap (%) 1.4 1.2 2.3 3.0 3.2
Dividend Yield (%) 0.9 0.9 1.1 1.3 2.0
Source: Company, HDFC sec Inst Research

COMPANY UPDATE 27 DEC 2017
Emami BUY
HDFC securities Institutional Research is also available on Bloomberg HSLB <GO>& Thomson Reuters
Groomed for growth Emami’s success of the company’s strategy (focus on low penetration and high-margin categories) is reflected by its revenue/EBITDA/APAT CAGR of 17/28/24% in the last 10 years. We like Emami on account of (1) Leadership in ~70% domestic portfolio and gaining market share gain, (2) Focus on low penetration and high-margin categories, (3) New launches, (4) Distribution expansion (direct reach to be ~0.8mn by FY18 vs. 0.73mn in FY17).
Emami’s all trade channels (including CSD and Wholesale) started recovering and the company can deliver superior performance in the ensuing quarters after lull show in 1HFY18 (EBITDA contracted by 13%).
Kesh King’s acquisition (in FY15) is yet to deliver, as the brand impacted by high channel inventory (pre-acquisition) and slow hair oil growth. The mgt. expects Kesh King to do well in the medium-long term on account of rural recovery and improving hair oil growth. Emami’s new launches like F&H facewash and F&H Laser cream, received positive response.
Mgt. expects modern trade and e-commerce to continue to gain importance, hence acquired 30% stake in Men’s premium grooming startup ‘The Man Company’ (online platform). This acquisition will aid Emami to learn the ropes of trade (e-commerce).
International biz (IBD) posted healthy 22% growth in 2QFY18 due to favourable base and strong performance in SAARC and African markets. Management expects 16-18% growth in 2HFY18 and international mix to grow to 15% vs. 11% currently in the next five years.
We expect Revenue/EBITDA/APAT CAGR of 13%/16%/19% respectively over FY17-20E. We expect EPS CAGR of 18% over FY17-20E. We value Emami based on P/E of 36x on Dec-19 EPS. Our TP is Rs 1,445. We maintain our BUY rating.
Near-term outlook: With improvement in performance, we
expect healthy upside in the near-term too.
Financial Summary (Rs mn) FY16 FY17 FY18E FY19E FY20E Net Revenue 23,970 25,208 27,598 31,877 36,708 EBITDA 6,873 7,591 8,521 10,014 11,848 APAT 5,326 5,511 6,366 7,718 9,267 EPS (Rs) 23.5 24.3 28.0 34.0 40.8 P/E (x) 55.2 53.3 46.1 38.1 31.7 EV/EBITDA (x) 43.5 39.2 34.6 29.2 24.4 Core RoCE (%) 38.8 24.1 27.7 34.3 41.8
Assumptions Particulars FY16 FY17 FY18E FY19E FY20E
Domestic Gr. (%) 18.3 10.0 9.0 15.6 15.2
Navratna oil 6.0 3.0 6.5 13.5 13.5
Boroplus cream 8.0 15.0 13.0 13.0 13.0
Balm 12.0 6.0 8.0 14.0 14.0
Fair & Handsome 9.0 (6.0) 11.0 17.5 16.5
Kesh King
48.0 (0.5) 15.0 14.0
International Gr. (%) 18.3 (16.0) 13.0 14.6 14.6
Gross Margin (%) 64.5 65.7 65.6 65.8 66.3
Employee (% of sales) 8.7 9.1 9.3 9.3 9.1
ASP (% of sales) 18.0 17.6 16.7 16.5 16.4
Distribution (% of sales) 2.5 2.5 2.5 2.5 2.5
Other Exp. (% of sales) 6.7 6.3 6.2 6.1 6.0
EBITDA Margin (%) 28.7 30.1 30.9 31.4 32.3
Tax Rate (%) 14.1 19.7 20.0 20.0 20.0
Source: Company, HDFC sec Inst Research
INDUSTRY FMCG
CMP (as on 26 Dec 2017) Rs 1,294
Target Price Rs 1,445
Nifty 10,532
Sensex 34,011
KEY STOCK DATA
Bloomberg HMN IN
No. of Shares (mn) 227
MCap (Rs bn)/(US$ mn) 295/4,602
6m avg traded value (Rs mn) 187
STOCK PERFORMANCE (%)
52 Week high / low Rs 1,352 / 938
3M 6M 12M
Absolute (%) 18.6 19.2 31.3
Relative (%) 11.1 10.0 0.7
SHAREHOLDING PATTERN (%)
Promoters 72.74
FIs & Local MFs 4.24
FPIs 14.38
Public & Others 8.64
Source : BSE
Naveen Trivedi [email protected] +91-22-6171-7324 Siddhant Chhabria [email protected] +91-22-6171-7336
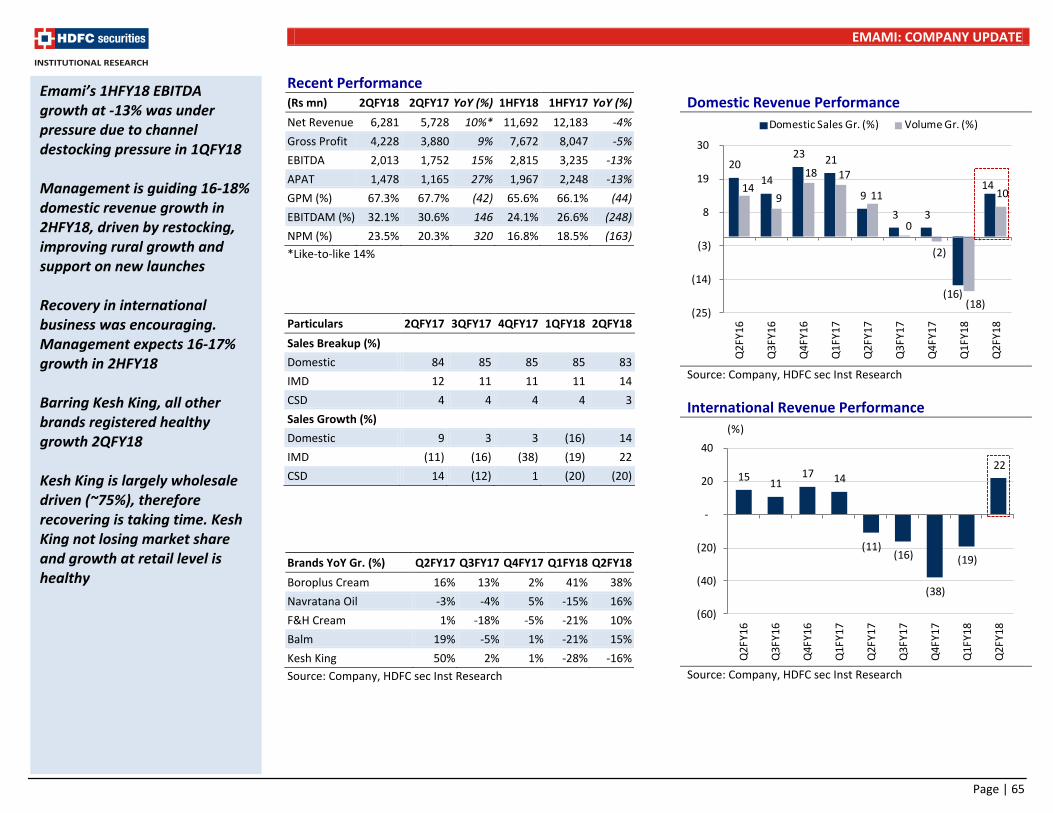
EMAMI: COMPANY UPDATE
Page | 65
Recent Performance (Rs mn) 2QFY18 2QFY17 YoY (%) 1HFY18 1HFY17 YoY (%)
Net Revenue 6,281 5,728 10%* 11,692 12,183 -4%
Gross Profit 4,228 3,880 9% 7,672 8,047 -5%
EBITDA 2,013 1,752 15% 2,815 3,235 -13%
APAT 1,478 1,165 27% 1,967 2,248 -13%
GPM (%) 67.3% 67.7% (42) 65.6% 66.1% (44)
EBITDAM (%) 32.1% 30.6% 146 24.1% 26.6% (248)
NPM (%) 23.5% 20.3% 320 16.8% 18.5% (163)
*Like-to-like 14%
Particulars 2QFY17 3QFY17 4QFY17 1QFY18 2QFY18
Sales Breakup (%)
Domestic 84 85 85 85 83
IMD 12 11 11 11 14
CSD 4 4 4 4 3
Sales Growth (%)
Domestic 9 3 3 (16) 14
IMD (11) (16) (38) (19) 22
CSD 14 (12) 1 (20) (20)
Brands YoY Gr. (%) Q2FY17 Q3FY17 Q4FY17 Q1FY18 Q2FY18
Boroplus Cream 16% 13% 2% 41% 38%
Navratana Oil -3% -4% 5% -15% 16%
F&H Cream 1% -18% -5% -21% 10%
Balm 19% -5% 1% -21% 15%
Kesh King 50% 2% 1% -28% -16%
Source: Company, HDFC sec Inst Research
Domestic Revenue Performance
Source: Company, HDFC sec Inst Research
International Revenue Performance
Source: Company, HDFC sec Inst Research
20
14
23 21
9
3 3
(16)
14 14 9
18 17
11
0
(2)
(18)
10
(25)
(14)
(3)
8
19
30
Q2
FY1
6
Q3
FY1
6
Q4
FY1
6
Q1
FY1
7
Q2
FY1
7
Q3
FY1
7
Q4
FY1
7
Q1
FY1
8
Q2
FY1
8
Domestic Sales Gr. (%) Volume Gr. (%)
15 11
17 14
(11)(16)
(38)
(19)
22
(60)
(40)
(20)
-
20
40
Q2
FY1
6
Q3
FY1
6
Q4
FY1
6
Q1
FY1
7
Q2
FY1
7
Q3
FY1
7
Q4
FY1
7
Q1
FY1
8
Q2
FY1
8
(%)
Emami’s 1HFY18 EBITDA growth at -13% was under pressure due to channel destocking pressure in 1QFY18 Management is guiding 16-18% domestic revenue growth in 2HFY18, driven by restocking, improving rural growth and support on new launches Recovery in international business was encouraging. Management expects 16-17% growth in 2HFY18 Barring Kesh King, all other brands registered healthy growth 2QFY18 Kesh King is largely wholesale driven (~75%), therefore recovering is taking time. Kesh King not losing market share and growth at retail level is healthy
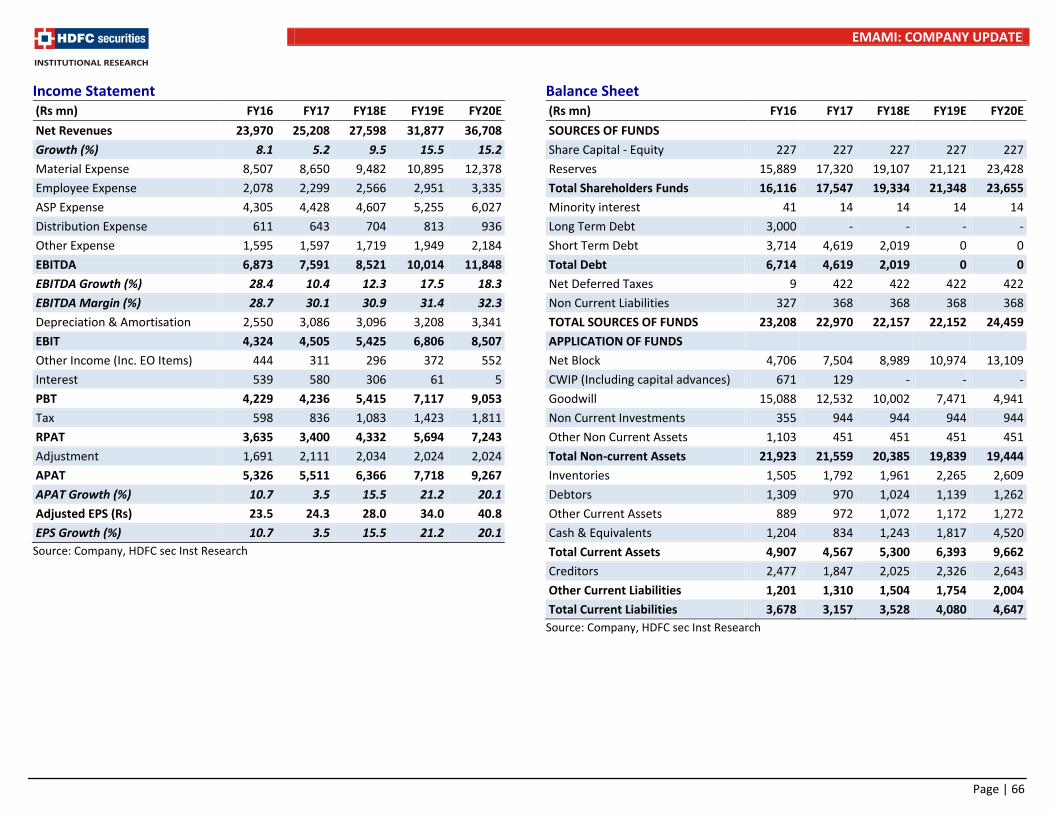
EMAMI: COMPANY UPDATE
Page | 66
Income Statement (Rs mn) FY16 FY17 FY18E FY19E FY20E
Net Revenues 23,970 25,208 27,598 31,877 36,708
Growth (%) 8.1 5.2 9.5 15.5 15.2
Material Expense 8,507 8,650 9,482 10,895 12,378
Employee Expense 2,078 2,299 2,566 2,951 3,335
ASP Expense 4,305 4,428 4,607 5,255 6,027
Distribution Expense 611 643 704 813 936
Other Expense 1,595 1,597 1,719 1,949 2,184
EBITDA 6,873 7,591 8,521 10,014 11,848
EBITDA Growth (%) 28.4 10.4 12.3 17.5 18.3
EBITDA Margin (%) 28.7 30.1 30.9 31.4 32.3
Depreciation & Amortisation 2,550 3,086 3,096 3,208 3,341
EBIT 4,324 4,505 5,425 6,806 8,507
Other Income (Inc. EO Items) 444 311 296 372 552
Interest 539 580 306 61 5
PBT 4,229 4,236 5,415 7,117 9,053
Tax 598 836 1,083 1,423 1,811
RPAT 3,635 3,400 4,332 5,694 7,243
Adjustment 1,691 2,111 2,034 2,024 2,024
APAT 5,326 5,511 6,366 7,718 9,267
APAT Growth (%) 10.7 3.5 15.5 21.2 20.1
Adjusted EPS (Rs) 23.5 24.3 28.0 34.0 40.8
EPS Growth (%) 10.7 3.5 15.5 21.2 20.1
Source: Company, HDFC sec Inst Research
Balance Sheet (Rs mn) FY16 FY17 FY18E FY19E FY20E
SOURCES OF FUNDS
Share Capital - Equity 227 227 227 227 227
Reserves 15,889 17,320 19,107 21,121 23,428
Total Shareholders Funds 16,116 17,547 19,334 21,348 23,655
Minority interest 41 14 14 14 14
Long Term Debt 3,000 - - - -
Short Term Debt 3,714 4,619 2,019 0 0
Total Debt 6,714 4,619 2,019 0 0
Net Deferred Taxes 9 422 422 422 422
Non Current Liabilities 327 368 368 368 368
TOTAL SOURCES OF FUNDS 23,208 22,970 22,157 22,152 24,459
APPLICATION OF FUNDS
Net Block 4,706 7,504 8,989 10,974 13,109
CWIP (Including capital advances) 671 129 - - -
Goodwill 15,088 12,532 10,002 7,471 4,941
Non Current Investments 355 944 944 944 944
Other Non Current Assets 1,103 451 451 451 451
Total Non-current Assets 21,923 21,559 20,385 19,839 19,444
Inventories 1,505 1,792 1,961 2,265 2,609
Debtors 1,309 970 1,024 1,139 1,262
Other Current Assets 889 972 1,072 1,172 1,272
Cash & Equivalents 1,204 834 1,243 1,817 4,520
Total Current Assets 4,907 4,567 5,300 6,393 9,662
Creditors 2,477 1,847 2,025 2,326 2,643
Other Current Liabilities 1,201 1,310 1,504 1,754 2,004
Total Current Liabilities 3,678 3,157 3,528 4,080 4,647
Source: Company, HDFC sec Inst Research

EMAMI: COMPANY UPDATE
Page | 67
Cash Flow Statement (Rs mn) FY16 FY17 FY18E FY19E FY20E
Reported PBT 4,171 4,236 5,415 7,117 9,053
Non-operating & EO Items 663 - - - -
Interest Expenses 539 580 306 61 5
Depreciation 2,101 3,086 3,096 3,208 3,341
Working Capital Change (542) 139 (2,696) (2,486) (499)
Tax Paid (957) (836) (1,083) (1,423) (1,811)
OPERATING CASH FLOW ( a ) 5,312 7,205 5,038 6,477 10,090
Capex (18,153) (2,786) (1,922) (2,663) (2,946)
Free Cash Flow (FCF) (12,841) 4,419 3,116 3,814 7,144
Investments 4,260 (589) - - -
Non-operating Income 823 435 - - -
INVESTING CASH FLOW ( b ) (13,070) (2,940) (1,922) (2,663) (2,946)
Debt Issuance/(Repaid) 3,357 (3,000) - - -
Interest Expenses (519) (580) (306) (61) (5)
FCFE (4,921) 685 2,810 3,753 7,139
Share Capital Issuance 3,000 - - - -
Dividend (818) (1,867) (2,545) (3,680) (4,936)
Others 13 648 0 - -
FINANCING CASH FLOW ( c ) 5,032 (4,799) (2,851) (3,740) (4,941)
NET CASH FLOW (a+b+c) (2,726) (534) 265 74 2,203
EO Items, Others (269) 50 56 0 -
Closing Cash & Equivalents 1,084 501 710 784 2,987
Source: Company, HDFC sec Inst Research
Key Ratios FY16 FY17 FY18E FY19E FY20E
PROFITABILITY (%) GPM 64.5 65.7 65.6 65.8 66.3
ASP (% of sales) 18.0 17.6 16.7 16.5 16.4
EBITDA Margin 28.7 30.1 30.9 31.4 32.3
EBIT Margin 18.0 17.9 19.7 21.4 23.2
APAT Margin 22.2 21.9 23.1 24.2 25.2
RoE 37.5 32.7 34.5 37.9 41.2
RoIC (or Core RoCE) 38.8 24.1 27.7 34.3 41.8
RoCE 20.5 15.7 19.2 24.6 29.2
EFFICIENCY Tax Rate (%) 14.1 19.7 20.0 20.0 20.0
Fixed Asset Turnover (x) 5.1 3.4 3.1 2.9 2.8
Inventory (days) 22.9 25.9 25.9 25.9 25.9
Debtors (days) 19.9 14.0 13.5 13.0 12.5
Other Current Assets (days) 13.5 14.1 14.2 13.4 12.6
Payables (days) 37.7 26.7 26.8 26.6 26.3
Other Current Liab & Provns (days) 18.3 19.0 19.9 20.1 19.9
Cash Conversion Cycle (days) 0.4 8.3 7.0 5.7 4.9
Net D/E (x) 0.3 0.2 0.0 (0.1) (0.2)
Interest Coverage (x) 8.0 7.8 17.8 112.4 1,696.6
PER SHARE DATA (Rs) EPS 23.5 24.3 28.0 34.0 40.8
CEPS 25.3 26.3 30.5 37.0 44.4
Dividend 7.0 7.0 9.5 13.8 18.5
Book Value 71.0 77.3 85.2 94.0 104.2
VALUATION P/E (x) 55.2 53.3 46.1 38.1 31.7
P/BV (x) 18.2 16.7 15.2 13.8 12.4
EV/EBITDA (x) 43.5 39.2 34.6 29.2 24.4
EV/Revenues (x) 12.5 11.8 10.7 9.2 7.9
OCF/EV (%) 1.8 2.4 1.7 2.2 3.5
FCF/EV (%) (4.3) 1.5 1.1 1.3 2.5
FCFE/Mkt Cap (%) (1.7) 0.2 1.0 1.3 2.4
Dividend Yield (%) 0.5 0.5 0.7 1.1 1.4 Source: Company, HDFC sec Inst Research
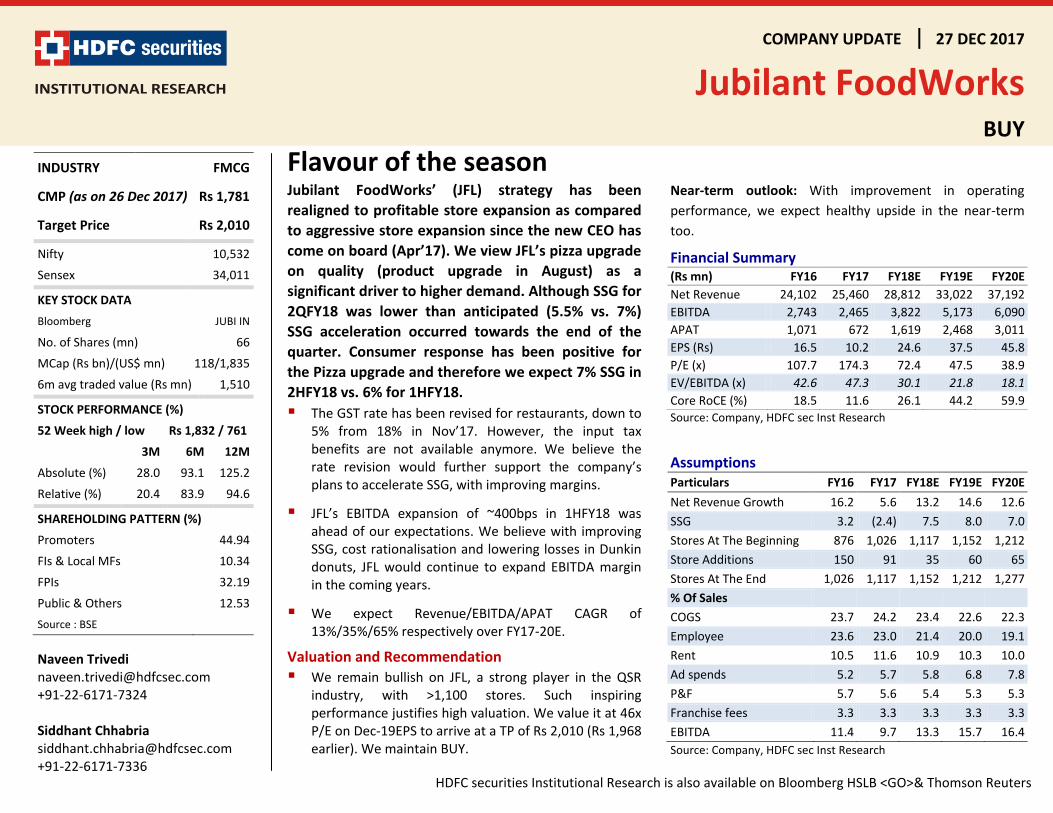
COMPANY UPDATE 27 DEC 2017
Jubilant FoodWorks
BUY
HDFC securities Institutional Research is also available on Bloomberg HSLB <GO>& Thomson Reuters
Flavour of the season Jubilant FoodWorks’ (JFL) strategy has been
realigned to profitable store expansion as compared
to aggressive store expansion since the new CEO has
come on board (Apr’17). We view JFL’s pizza upgrade
on quality (product upgrade in August) as a
significant driver to higher demand. Although SSG for
2QFY18 was lower than anticipated (5.5% vs. 7%)
SSG acceleration occurred towards the end of the
quarter. Consumer response has been positive for
the Pizza upgrade and therefore we expect 7% SSG in
2HFY18 vs. 6% for 1HFY18.
The GST rate has been revised for restaurants, down to 5% from 18% in Nov’17. However, the input tax benefits are not available anymore. We believe the rate revision would further support the company’s plans to accelerate SSG, with improving margins.
JFL’s EBITDA expansion of ~400bps in 1HFY18 was ahead of our expectations. We believe with improving SSG, cost rationalisation and lowering losses in Dunkin donuts, JFL would continue to expand EBITDA margin in the coming years.
We expect Revenue/EBITDA/APAT CAGR of 13%/35%/65% respectively over FY17-20E.
Valuation and Recommendation
We remain bullish on JFL, a strong player in the QSR industry, with >1,100 stores. Such inspiring performance justifies high valuation. We value it at 46x P/E on Dec-19EPS to arrive at a TP of Rs 2,010 (Rs 1,968 earlier). We maintain BUY.
Near-term outlook: With improvement in operating
performance, we expect healthy upside in the near-term
too.
Financial Summary (Rs mn) FY16 FY17 FY18E FY19E FY20E
Net Revenue 24,102 25,460 28,812 33,022 37,192
EBITDA 2,743 2,465 3,822 5,173 6,090
APAT 1,071 672 1,619 2,468 3,011
EPS (Rs) 16.5 10.2 24.6 37.5 45.8
P/E (x) 107.7 174.3 72.4 47.5 38.9
EV/EBITDA (x) 42.6 47.3 30.1 21.8 18.1
Core RoCE (%) 18.5 11.6 26.1 44.2 59.9
Source: Company, HDFC sec Inst Research
Assumptions Particulars FY16 FY17 FY18E FY19E FY20E
Net Revenue Growth 16.2 5.6 13.2 14.6 12.6
SSG 3.2 (2.4) 7.5 8.0 7.0
Stores At The Beginning 876 1,026 1,117 1,152 1,212
Store Additions 150 91 35 60 65
Stores At The End 1,026 1,117 1,152 1,212 1,277
% Of Sales
COGS 23.7 24.2 23.4 22.6 22.3
Employee 23.6 23.0 21.4 20.0 19.1
Rent 10.5 11.6 10.9 10.3 10.0
Ad spends 5.2 5.7 5.8 6.8 7.8
P&F 5.7 5.6 5.4 5.3 5.3
Franchise fees 3.3 3.3 3.3 3.3 3.3
EBITDA 11.4 9.7 13.3 15.7 16.4
Source: Company, HDFC sec Inst Research
INDUSTRY FMCG
CMP (as on 26 Dec 2017) Rs 1,781
Target Price Rs 2,010
Nifty 10,532
Sensex 34,011
KEY STOCK DATA
Bloomberg JUBI IN
No. of Shares (mn) 66
MCap (Rs bn)/(US$ mn) 118/1,835
6m avg traded value (Rs mn) 1,510
STOCK PERFORMANCE (%)
52 Week high / low Rs 1,832 / 761
3M 6M 12M
Absolute (%) 28.0 93.1 125.2
Relative (%) 20.4 83.9 94.6
SHAREHOLDING PATTERN (%)
Promoters 44.94
FIs & Local MFs 10.34
FPIs 32.19
Public & Others 12.53
Source : BSE
Naveen Trivedi [email protected] +91-22-6171-7324 Siddhant Chhabria [email protected] +91-22-6171-7336
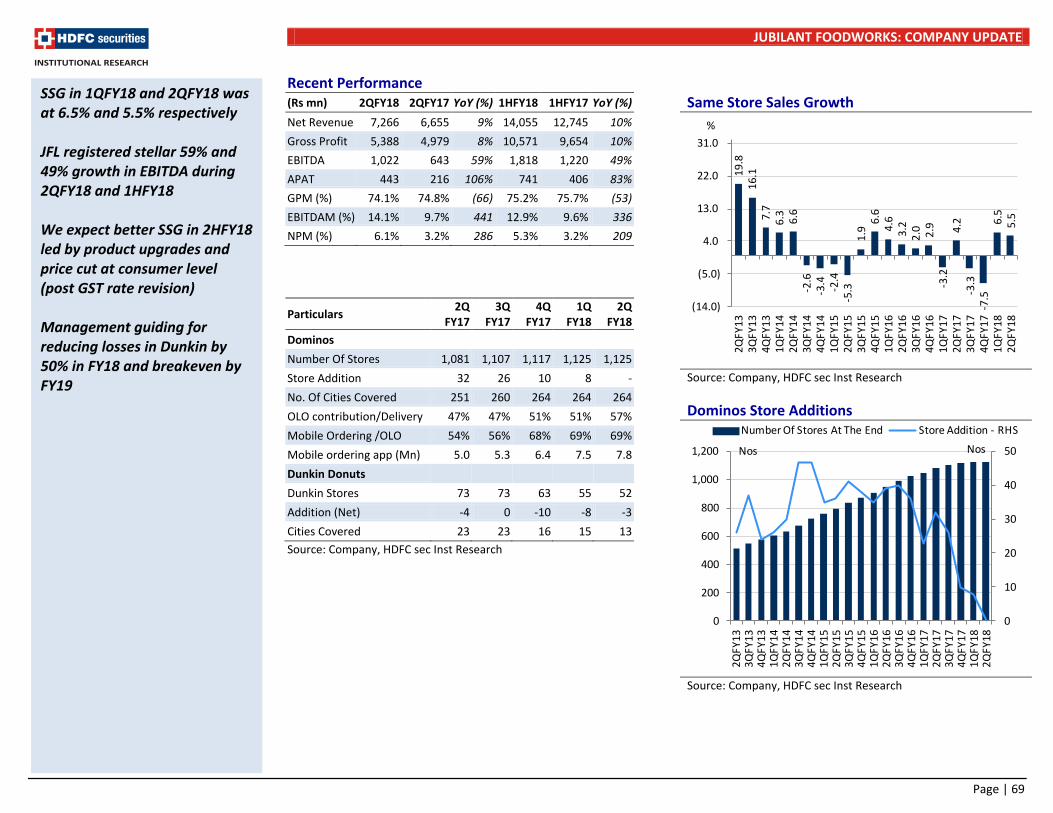
JUBILANT FOODWORKS: COMPANY UPDATE
Page | 69
Recent Performance (Rs mn) 2QFY18 2QFY17 YoY (%) 1HFY18 1HFY17 YoY (%)
Net Revenue 7,266 6,655 9% 14,055 12,745 10%
Gross Profit 5,388 4,979 8% 10,571 9,654 10%
EBITDA 1,022 643 59% 1,818 1,220 49%
APAT 443 216 106% 741 406 83%
GPM (%) 74.1% 74.8% (66) 75.2% 75.7% (53)
EBITDAM (%) 14.1% 9.7% 441 12.9% 9.6% 336
NPM (%) 6.1% 3.2% 286 5.3% 3.2% 209
Particulars 2Q
FY17 3Q
FY17 4Q
FY17 1Q
FY18 2Q
FY18
Dominos
Number Of Stores 1,081 1,107 1,117 1,125 1,125
Store Addition 32 26 10 8 -
No. Of Cities Covered 251 260 264 264 264
OLO contribution/Delivery 47% 47% 51% 51% 57%
Mobile Ordering /OLO 54% 56% 68% 69% 69%
Mobile ordering app (Mn) 5.0 5.3 6.4 7.5 7.8
Dunkin Donuts
Dunkin Stores 73 73 63 55 52
Addition (Net) -4 0 -10 -8 -3
Cities Covered 23 23 16 15 13
Source: Company, HDFC sec Inst Research
Same Store Sales Growth
Source: Company, HDFC sec Inst Research
Dominos Store Additions
Source: Company, HDFC sec Inst Research
SSG in 1QFY18 and 2QFY18 was at 6.5% and 5.5% respectively JFL registered stellar 59% and 49% growth in EBITDA during 2QFY18 and 1HFY18 We expect better SSG in 2HFY18 led by product upgrades and price cut at consumer level (post GST rate revision) Management guiding for reducing losses in Dunkin by 50% in FY18 and breakeven by FY19
19
.81
6.1
7.7
6.3
6.6
-2.6
-3.4
-2.4
-5.3
1.9
6.6
4.6
3.2
2.0 2.9
-3.2
4.2
-3.3
-7.5
6.5
5.5
(14.0)
(5.0)
4.0
13.0
22.0
31.0
2Q
FY1
33
QFY
13
4Q
FY1
31
QFY
14
2Q
FY1
43
QFY
14
4Q
FY1
41
QFY
15
2Q
FY1
53
QFY
15
4Q
FY1
51
QFY
16
2Q
FY1
63
QFY
16
4Q
FY1
61
QFY
17
2Q
FY1
73
QFY
17
4Q
FY1
71
QFY
18
2Q
FY1
8
%
0
10
20
30
40
50
0
200
400
600
800
1,000
1,200
2Q
FY1
33
QFY
13
4Q
FY1
31
QFY
14
2Q
FY1
43
QFY
14
4Q
FY1
41
QFY
15
2Q
FY1
53
QFY
15
4Q
FY1
51
QFY
16
2Q
FY1
63
QFY
16
4Q
FY1
61
QFY
17
2Q
FY1
73
QFY
17
4Q
FY1
71
QFY
18
2Q
FY1
8
Number Of Stores At The End Store Addition - RHS
Nos Nos
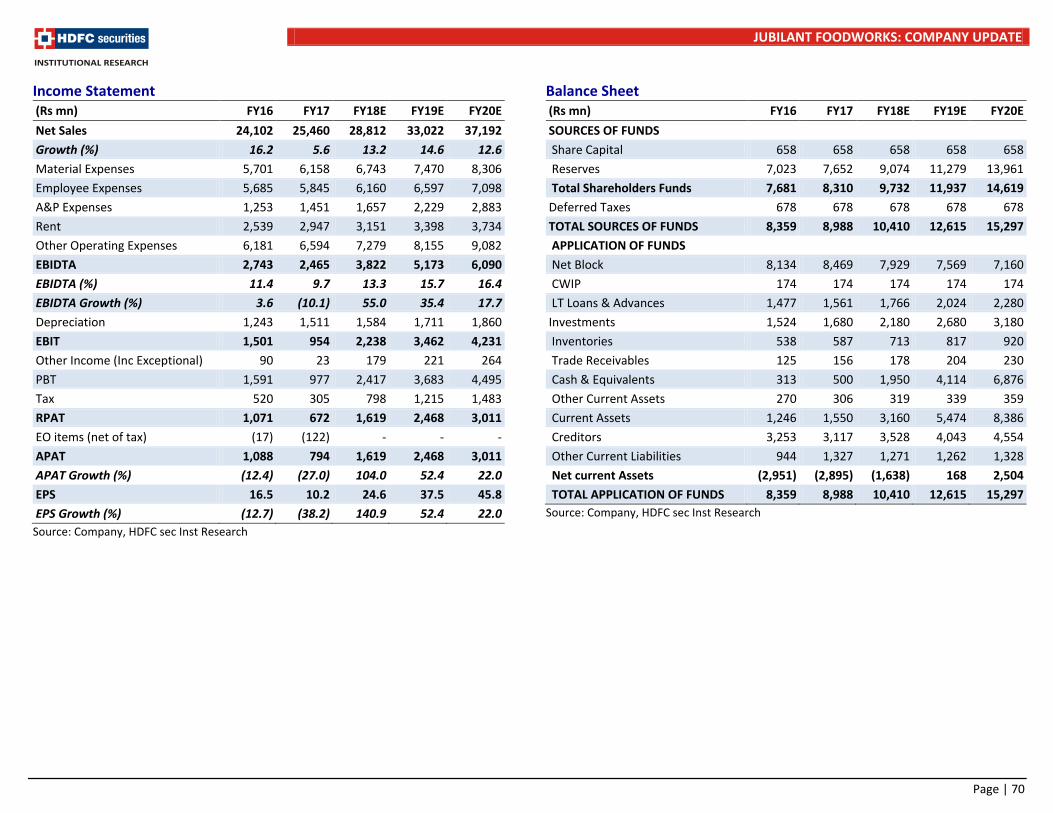
JUBILANT FOODWORKS: COMPANY UPDATE
Page | 70
Income Statement (Rs mn) FY16 FY17 FY18E FY19E FY20E
Net Sales 24,102 25,460 28,812 33,022 37,192
Growth (%) 16.2 5.6 13.2 14.6 12.6
Material Expenses 5,701 6,158 6,743 7,470 8,306
Employee Expenses 5,685 5,845 6,160 6,597 7,098
A&P Expenses 1,253 1,451 1,657 2,229 2,883
Rent 2,539 2,947 3,151 3,398 3,734
Other Operating Expenses 6,181 6,594 7,279 8,155 9,082
EBIDTA 2,743 2,465 3,822 5,173 6,090
EBIDTA (%) 11.4 9.7 13.3 15.7 16.4
EBIDTA Growth (%) 3.6 (10.1) 55.0 35.4 17.7
Depreciation 1,243 1,511 1,584 1,711 1,860
EBIT 1,501 954 2,238 3,462 4,231
Other Income (Inc Exceptional) 90 23 179 221 264
PBT 1,591 977 2,417 3,683 4,495
Tax 520 305 798 1,215 1,483
RPAT 1,071 672 1,619 2,468 3,011
EO items (net of tax) (17) (122) - - -
APAT 1,088 794 1,619 2,468 3,011
APAT Growth (%) (12.4) (27.0) 104.0 52.4 22.0
EPS 16.5 10.2 24.6 37.5 45.8
EPS Growth (%) (12.7) (38.2) 140.9 52.4 22.0
Source: Company, HDFC sec Inst Research
Balance Sheet (Rs mn) FY16 FY17 FY18E FY19E FY20E
SOURCES OF FUNDS
Share Capital 658 658 658 658 658
Reserves 7,023 7,652 9,074 11,279 13,961
Total Shareholders Funds 7,681 8,310 9,732 11,937 14,619
Deferred Taxes 678 678 678 678 678
TOTAL SOURCES OF FUNDS 8,359 8,988 10,410 12,615 15,297
APPLICATION OF FUNDS
Net Block 8,134 8,469 7,929 7,569 7,160
CWIP 174 174 174 174 174
LT Loans & Advances 1,477 1,561 1,766 2,024 2,280
Investments 1,524 1,680 2,180 2,680 3,180
Inventories 538 587 713 817 920
Trade Receivables 125 156 178 204 230
Cash & Equivalents 313 500 1,950 4,114 6,876
Other Current Assets 270 306 319 339 359
Current Assets 1,246 1,550 3,160 5,474 8,386
Creditors 3,253 3,117 3,528 4,043 4,554
Other Current Liabilities 944 1,327 1,271 1,262 1,328
Net current Assets (2,951) (2,895) (1,638) 168 2,504
TOTAL APPLICATION OF FUNDS 8,359 8,988 10,410 12,615 15,297
Source: Company, HDFC sec Inst Research
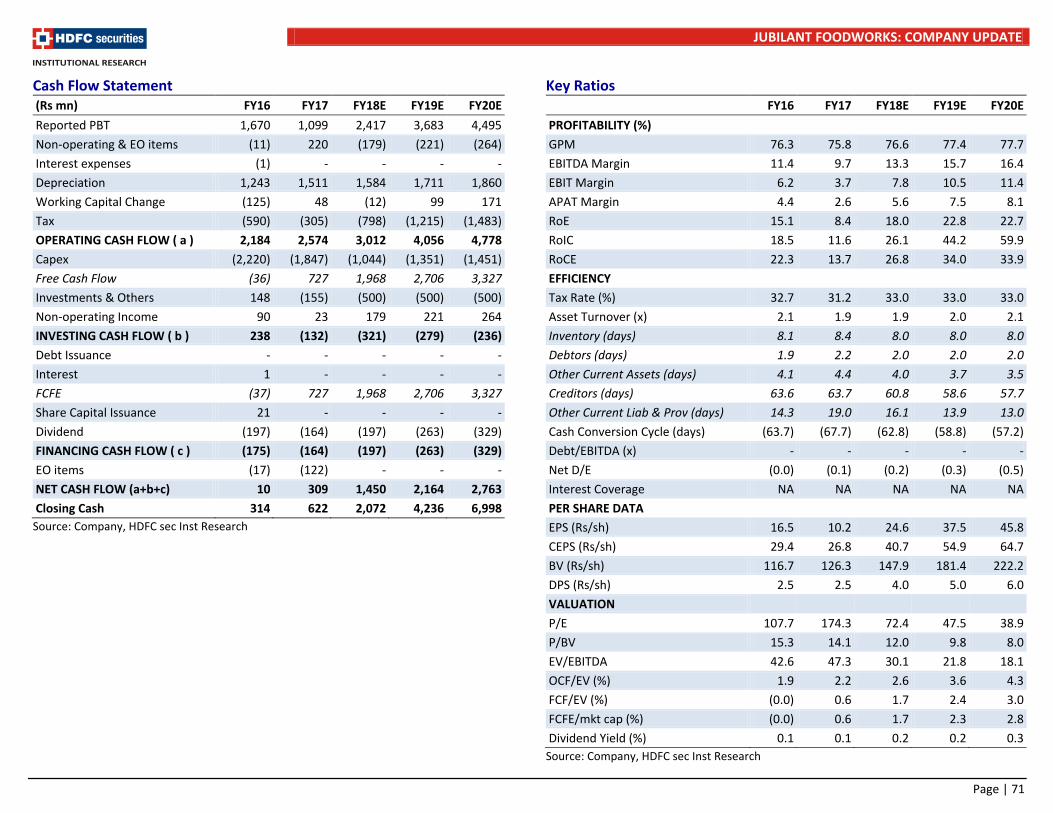
JUBILANT FOODWORKS: COMPANY UPDATE
Page | 71
Cash Flow Statement (Rs mn) FY16 FY17 FY18E FY19E FY20E
Reported PBT 1,670 1,099 2,417 3,683 4,495
Non-operating & EO items (11) 220 (179) (221) (264)
Interest expenses (1) - - - -
Depreciation 1,243 1,511 1,584 1,711 1,860
Working Capital Change (125) 48 (12) 99 171
Tax (590) (305) (798) (1,215) (1,483)
OPERATING CASH FLOW ( a ) 2,184 2,574 3,012 4,056 4,778
Capex (2,220) (1,847) (1,044) (1,351) (1,451)
Free Cash Flow (36) 727 1,968 2,706 3,327
Investments & Others 148 (155) (500) (500) (500)
Non-operating Income 90 23 179 221 264
INVESTING CASH FLOW ( b ) 238 (132) (321) (279) (236)
Debt Issuance - - - - -
Interest 1 - - - -
FCFE (37) 727 1,968 2,706 3,327
Share Capital Issuance 21 - - - -
Dividend (197) (164) (197) (263) (329)
FINANCING CASH FLOW ( c ) (175) (164) (197) (263) (329)
EO items (17) (122) - - -
NET CASH FLOW (a+b+c) 10 309 1,450 2,164 2,763
Closing Cash 314 622 2,072 4,236 6,998
Source: Company, HDFC sec Inst Research
Key Ratios FY16 FY17 FY18E FY19E FY20E
PROFITABILITY (%)
GPM 76.3 75.8 76.6 77.4 77.7
EBITDA Margin 11.4 9.7 13.3 15.7 16.4
EBIT Margin 6.2 3.7 7.8 10.5 11.4
APAT Margin 4.4 2.6 5.6 7.5 8.1
RoE 15.1 8.4 18.0 22.8 22.7
RoIC 18.5 11.6 26.1 44.2 59.9
RoCE 22.3 13.7 26.8 34.0 33.9
EFFICIENCY
Tax Rate (%) 32.7 31.2 33.0 33.0 33.0
Asset Turnover (x) 2.1 1.9 1.9 2.0 2.1
Inventory (days) 8.1 8.4 8.0 8.0 8.0
Debtors (days) 1.9 2.2 2.0 2.0 2.0
Other Current Assets (days) 4.1 4.4 4.0 3.7 3.5
Creditors (days) 63.6 63.7 60.8 58.6 57.7
Other Current Liab & Prov (days) 14.3 19.0 16.1 13.9 13.0
Cash Conversion Cycle (days) (63.7) (67.7) (62.8) (58.8) (57.2)
Debt/EBITDA (x) - - - - -
Net D/E (0.0) (0.1) (0.2) (0.3) (0.5)
Interest Coverage NA NA NA NA NA
PER SHARE DATA
EPS (Rs/sh) 16.5 10.2 24.6 37.5 45.8
CEPS (Rs/sh) 29.4 26.8 40.7 54.9 64.7
BV (Rs/sh) 116.7 126.3 147.9 181.4 222.2
DPS (Rs/sh) 2.5 2.5 4.0 5.0 6.0
VALUATION
P/E 107.7 174.3 72.4 47.5 38.9
P/BV 15.3 14.1 12.0 9.8 8.0
EV/EBITDA 42.6 47.3 30.1 21.8 18.1
OCF/EV (%) 1.9 2.2 2.6 3.6 4.3
FCF/EV (%) (0.0) 0.6 1.7 2.4 3.0
FCFE/mkt cap (%) (0.0) 0.6 1.7 2.3 2.8
Dividend Yield (%) 0.1 0.1 0.2 0.2 0.3
Source: Company, HDFC sec Inst Research
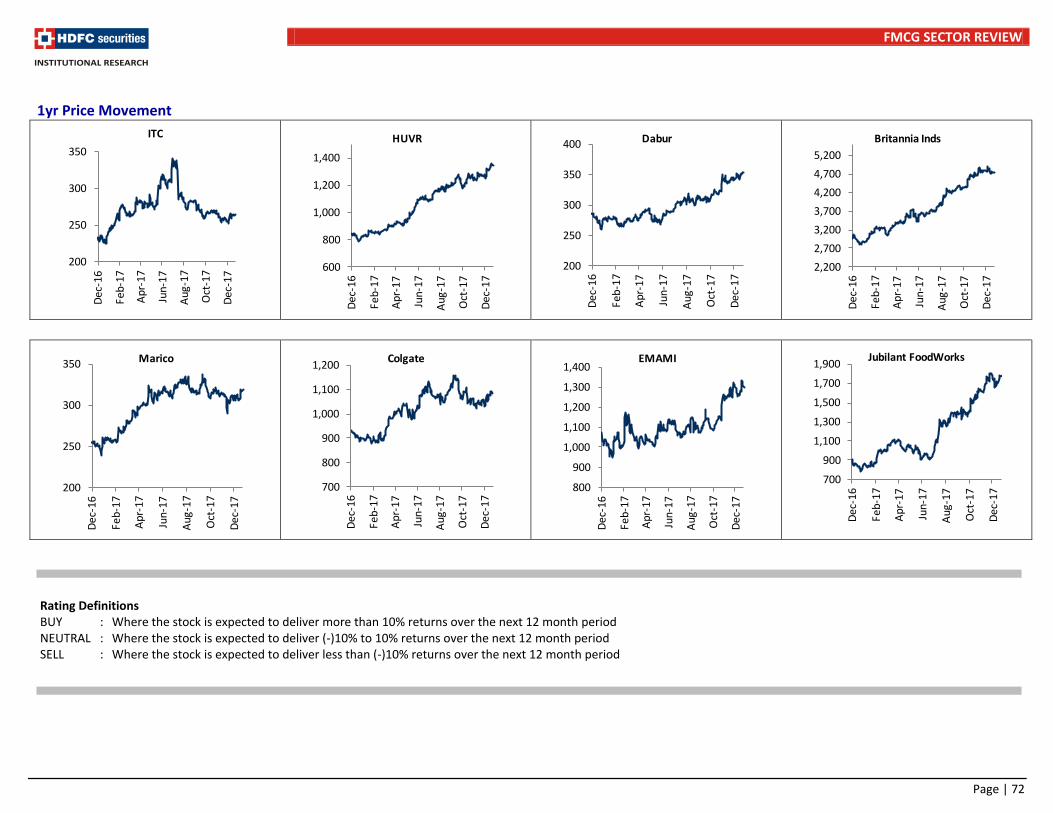
FMCG SECTOR REVIEW
Page | 72
1yr Price Movement
Rating Definitions BUY : Where the stock is expected to deliver more than 10% returns over the next 12 month period NEUTRAL : Where the stock is expected to deliver (-)10% to 10% returns over the next 12 month period SELL : Where the stock is expected to deliver less than (-)10% returns over the next 12 month period
200
250
300
350
Dec
-16
Feb
-17
Ap
r-1
7
Jun-
17
Au
g-1
7
Oct
-17
Dec
-17
ITC
600
800
1,000
1,200
1,400
Dec
-16
Feb
-17
Ap
r-1
7
Jun
-17
Au
g-1
7
Oct
-17
Dec
-17
HUVR
200
250
300
350
400
Dec
-16
Feb
-17
Ap
r-1
7
Jun
-17
Au
g-1
7
Oct
-17
De
c-1
7
Dabur
2,200
2,700
3,200
3,700
4,200
4,700
5,200
Dec
-16
Feb
-17
Ap
r-1
7
Jun
-17
Au
g-1
7
Oct
-17
De
c-1
7
Britannia Inds
200
250
300
350
De
c-1
6
Feb
-17
Ap
r-1
7
Jun
-17
Au
g-1
7
Oct
-17
Dec
-17
Marico
700
800
900
1,000
1,100
1,200
Dec
-16
Feb
-17
Ap
r-1
7
Jun
-17
Au
g-1
7
Oct
-17
Dec
-17
Colgate
800
900
1,000
1,100
1,200
1,300
1,400
Dec
-16
Feb
-17
Ap
r-1
7
Jun
-17
Au
g-1
7
Oct
-17
Dec
-17
EMAMI
700
900
1,100
1,300
1,500
1,700
1,900
Dec
-16
Fe
b-1
7
Ap
r-1
7
Jun-
17
Au
g-1
7
Oct
-17
Dec
-17
Jubilant FoodWorks
FMCG SECTOR REVIEW
Page | 73
Disclosure: We, Naveen Trivedi, MBA & Siddhant Chhabria, PGDBM, authors and the names subscribed to this report, hereby certify that all of the views expressed in this research report accurately reflect our views about the subject issuer(s) or securities. HSL has no material adverse disciplinary history as on the date of publication of this report. We also certify that no part of our compensation was, is, or will be directly or indirectly related to the specific recommendation(s) or view(s) in this report. Research Analyst or his/her relative or HDFC Securities Ltd. does not have any financial interest in the subject company. Also Research Analyst or his relative or HDFC Securities Ltd. or its Associate may have beneficial ownership of 1% or more in the subject company at the end of the month immediately preceding the date of publication of the Research Report. Further Research Analyst or his relative or HDFC Securities Ltd. or its associate does not have any material conflict of interest. Any holding in stock –No HDFC Securities Limited (HSL) is a SEBI Registered Research Analyst having registration no. INH000002475. Disclaimer: This report has been prepared by HDFC Securities Ltd and is meant for sole use by the recipient and not for circulation. The information and opinions contained herein have been compiled or arrived at, based upon information obtained in good faith from sources believed to be reliable. Such information has not been independently verified and no guaranty, representation of warranty, express or implied, is made as to its accuracy, completeness or correctness. All such information and opinions are subject to change without notice. This document is for information purposes only. Descriptions of any company or companies or their securities mentioned herein are not intended to be complete and this document is not, and should not be construed as an offer or solicitation of an offer, to buy or sell any securities or other financial instruments. This report is not directed to, or intended for display, downloading, printing, reproducing or for distribution to or use by, any person or entity who is a citizen or resident or located in any locality, state, country or other jurisdiction where such distribution, publication, reproduction, availability or use would be contrary to law or regulation or what would subject HSL or its affiliates to any registration or licensing requirement within such jurisdiction. If this report is inadvertently send or has reached any individual in such country, especially, USA, the same may be ignored and brought to the attention of the sender. This document may not be reproduced, distributed or published for any purposes without prior written approval of HSL. Foreign currencies denominated securities, wherever mentioned, are subject to exchange rate fluctuations, which could have an adverse effect on their value or price, or the income derived from them. In addition, investors in securities such as ADRs, the values of which are influenced by foreign currencies effectively assume currency risk. It should not be considered to be taken as an offer to sell or a solicitation to buy any security. HSL may from time to time solicit from, or perform broking, or other services for, any company mentioned in this mail and/or its attachments. HSL and its affiliated company(ies), their directors and employees may; (a) from time to time, have a long or short position in, and buy or sell the securities of the company(ies) mentioned herein or (b) be engaged in any other transaction involving such securities and earn brokerage or other compensation or act as a market maker in the financial instruments of the company(ies) discussed herein or act as an advisor or lender/borrower to such company(ies) or may have any other potential conflict of interests with respect to any recommendation and other related information and opinions. HSL, its directors, analysts or employees do not take any responsibility, financial or otherwise, of the losses or the damages sustained due to the investments made or any action taken on basis of this report, including but not restricted to, fluctuation in the prices of shares and bonds, changes in the currency rates, diminution in the NAVs, reduction in the dividend or income, etc. HSL and other group companies, its directors, associates, employees may have various positions in any of the stocks, securities and financial instruments dealt in the report, or may make sell or purchase or other deals in these securities from time to time or may deal in other securities of the companies / organizations described in this report. HSL or its associates might have managed or co-managed public offering of securities for the subject company or might have been mandated by the subject company for any other assignment in the past twelve months. HSL or its associates might have received any compensation from the companies mentioned in the report during the period preceding twelve months from t date of this report for services in respect of managing or co-managing public offerings, corporate finance, investment banking or merchant banking, brokerage services or other advisory service in a merger or specific transaction in the normal course of business. HSL or its analysts did not receive any compensation or other benefits from the companies mentioned in the report or third party in connection with preparation of the research report. Accordingly, neither HSL nor Research Analysts have any material conflict of interest at the time of publication of this report. Compensation of our Research Analysts is not based on any specific merchant banking, investment banking or brokerage service transactions. HSL may have issued other reports that are inconsistent with and reach different conclusion from the information presented in this report. Research entity has not been engaged in market making activity for the subject company. Research analyst has not served as an officer, director or employee of the subject company. We have not received any compensation/benefits from the subject company or third party in connection with the Research Report. HDFC securities Limited, I Think Techno Campus, Building - B, "Alpha", Office Floor 8, Near Kanjurmarg Station, Opp. Crompton Greaves, Kanjurmarg (East), Mumbai 400 042 Phone: (022) 3075 3400 Fax: (022) 2496 5066 Compliance Officer: Binkle R. Oza Email: [email protected] Phone: (022) 3045 3600 HDFC Securities Limited, SEBI Reg. No.: NSE-INB/F/E 231109431, BSE-INB/F 011109437, AMFI Reg. No. ARN: 13549, PFRDA Reg. No. POP: 04102015, IRDA Corporate Agent License No.: HDF 2806925/HDF C000222657, SEBI Research Analyst Reg. No.: INH000002475, CIN - U67120MH2000PLC152193 Mutual Funds Investments are subject to market risk. Please read the offer and scheme related documents carefully before investing.
FMCG SECTOR REVIEW
Page | 74
HDFC securities Institutional Equities Unit No. 1602, 16th Floor, Tower A, Peninsula Business Park, Senapati Bapat Marg, Lower Parel,Mumbai - 400 013 Board : +91-22-6171 7330www.hdfcsec.com


![FMCG Sector Report[1]](https://img.pdfslide.us/doc/110x75/54fed95e4a7959b8508b4bac/fmcg-sector-report1.jpg)