Embed Size (px)
Citation preview
CAMBODIA
SECTOR-SPECIFIC INVESTMENT STRATEGY AND ACTION PLAN
G20 Indicators for Measuring and Maximizing Economic Value Added and Job Creation from Private Investment in Specific Value Chains
Pilot Study Results
UNCTAD
February 2013
This Report forms part of the work undertaken by the Inter-Agency Working Group for the
Private Investment and Job Creation Pillar of the G20 Multi-Year Action Plan on Development
Inter-Agency Working Group
2
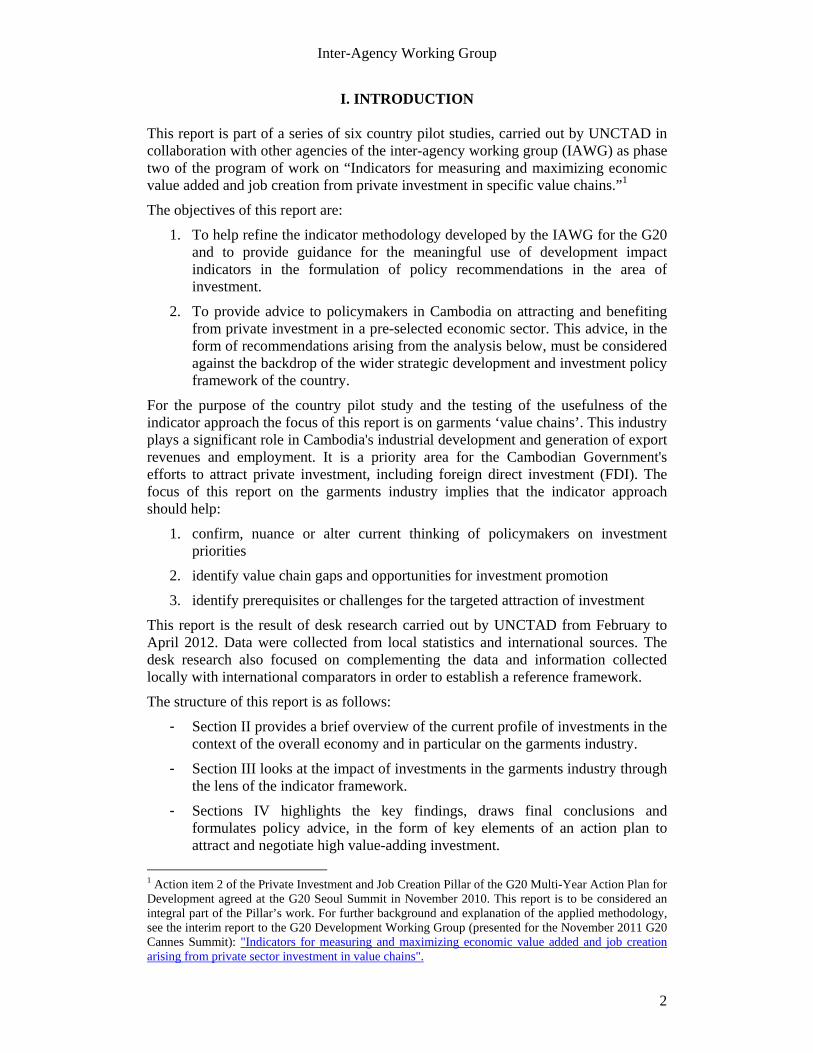
I. INTRODUCTION This report is part of a series of six country pilot studies, carried out by UNCTAD in collaboration with other agencies of the inter-agency working group (IAWG) as phase two of the program of work on “Indicators for measuring and maximizing economic value added and job creation from private investment in specific value chains.”1
The objectives of this report are:
1. To help refine the indicator methodology developed by the IAWG for the G20 and to provide guidance for the meaningful use of development impact indicators in the formulation of policy recommendations in the area of investment.
2. To provide advice to policymakers in Cambodia on attracting and benefiting from private investment in a pre-selected economic sector. This advice, in the form of recommendations arising from the analysis below, must be considered against the backdrop of the wider strategic development and investment policy framework of the country.
For the purpose of the country pilot study and the testing of the usefulness of the indicator approach the focus of this report is on garments ‘value chains’. This industry plays a significant role in Cambodia's industrial development and generation of export revenues and employment. It is a priority area for the Cambodian Government's efforts to attract private investment, including foreign direct investment (FDI). The focus of this report on the garments industry implies that the indicator approach should help:
1. confirm, nuance or alter current thinking of policymakers on investment priorities
2. identify value chain gaps and opportunities for investment promotion
3. identify prerequisites or challenges for the targeted attraction of investment
This report is the result of desk research carried out by UNCTAD from February to April 2012. Data were collected from local statistics and international sources. The desk research also focused on complementing the data and information collected locally with international comparators in order to establish a reference framework.
The structure of this report is as follows:
- Section II provides a brief overview of the current profile of investments in the context of the overall economy and in particular on the garments industry.
- Section III looks at the impact of investments in the garments industry through the lens of the indicator framework.
- Sections IV highlights the key findings, draws final conclusions and formulates policy advice, in the form of key elements of an action plan to attract and negotiate high value-adding investment.
1 Action item 2 of the Private Investment and Job Creation Pillar of the G20 Multi-Year Action Plan for Development agreed at the G20 Seoul Summit in November 2010. This report is to be considered an integral part of the Pillar’s work. For further background and explanation of the applied methodology, see the interim report to the G20 Development Working Group (presented for the November 2011 G20 Cannes Summit): "Indicators for measuring and maximizing economic value added and job creation arising from private sector investment in value chains".
Inter-Agency Working Group
3
0%
20%
40%
60%
80%
100%
Average Textile and Garments
Domestic
Foreign
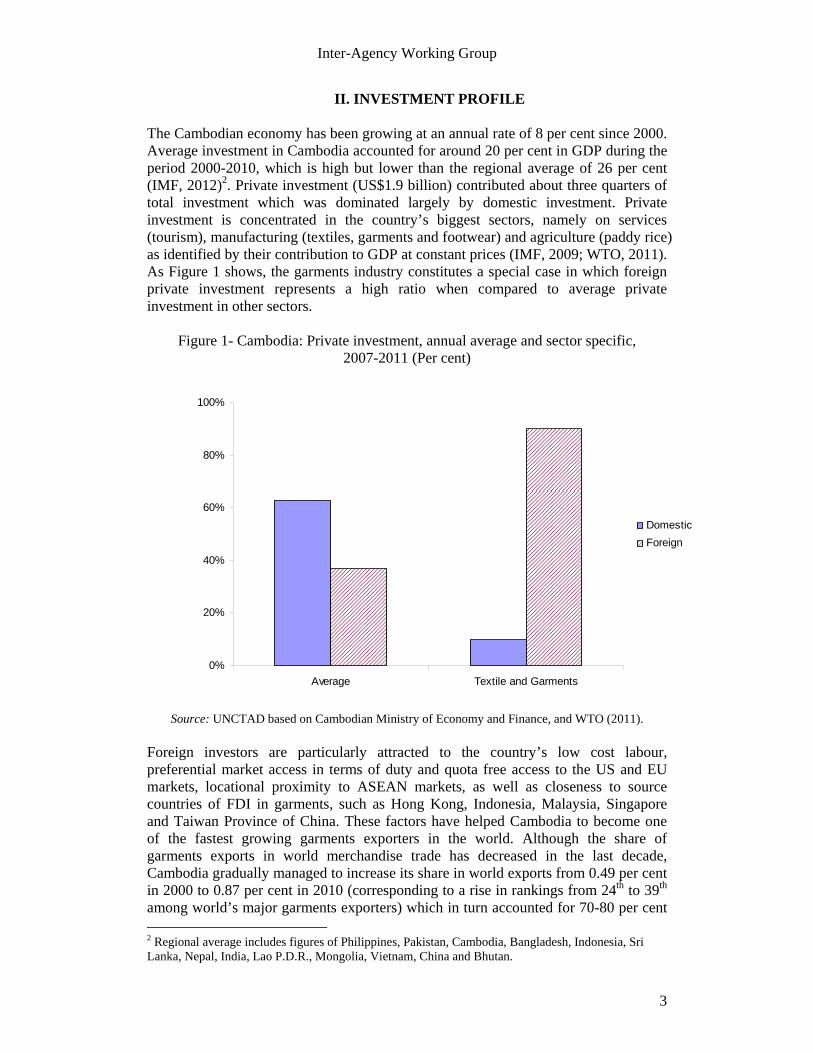
II. INVESTMENT PROFILE The Cambodian economy has been growing at an annual rate of 8 per cent since 2000. Average investment in Cambodia accounted for around 20 per cent in GDP during the period 2000-2010, which is high but lower than the regional average of 26 per cent (IMF, 2012)2. Private investment (US$1.9 billion) contributed about three quarters of total investment which was dominated largely by domestic investment. Private investment is concentrated in the country’s biggest sectors, namely on services (tourism), manufacturing (textiles, garments and footwear) and agriculture (paddy rice) as identified by their contribution to GDP at constant prices (IMF, 2009; WTO, 2011). As Figure 1 shows, the garments industry constitutes a special case in which foreign private investment represents a high ratio when compared to average private investment in other sectors.
Figure 1- Cambodia: Private investment, annual average and sector specific, 2007-2011 (Per cent)
Source: UNCTAD based on Cambodian Ministry of Economy and Finance, and WTO (2011). Foreign investors are particularly attracted to the country’s low cost labour, preferential market access in terms of duty and quota free access to the US and EU markets, locational proximity to ASEAN markets, as well as closeness to source countries of FDI in garments, such as Hong Kong, Indonesia, Malaysia, Singapore and Taiwan Province of China. These factors have helped Cambodia to become one of the fastest growing garments exporters in the world. Although the share of garments exports in world merchandise trade has decreased in the last decade, Cambodia gradually managed to increase its share in world exports from 0.49 per cent in 2000 to 0.87 per cent in 2010 (corresponding to a rise in rankings from 24th to 39th among world’s major garments exporters) which in turn accounted for 70-80 per cent 2 Regional average includes figures of Philippines, Pakistan, Cambodia, Bangladesh, Indonesia, Sri Lanka, Nepal, India, Lao P.D.R., Mongolia, Vietnam, China and Bhutan.
Inter-Agency Working Group
4
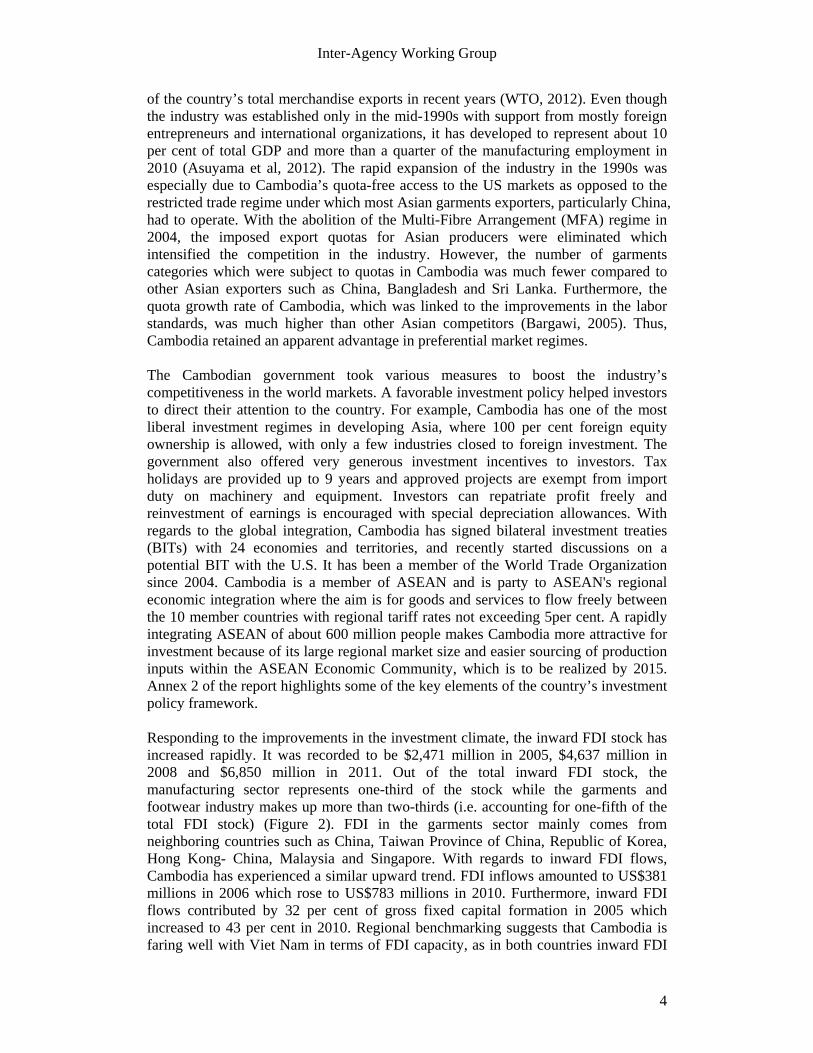
of the country’s total merchandise exports in recent years (WTO, 2012). Even though the industry was established only in the mid-1990s with support from mostly foreign entrepreneurs and international organizations, it has developed to represent about 10 per cent of total GDP and more than a quarter of the manufacturing employment in 2010 (Asuyama et al, 2012). The rapid expansion of the industry in the 1990s was especially due to Cambodia’s quota-free access to the US markets as opposed to the restricted trade regime under which most Asian garments exporters, particularly China, had to operate. With the abolition of the Multi-Fibre Arrangement (MFA) regime in 2004, the imposed export quotas for Asian producers were eliminated which intensified the competition in the industry. However, the number of garments categories which were subject to quotas in Cambodia was much fewer compared to other Asian exporters such as China, Bangladesh and Sri Lanka. Furthermore, the quota growth rate of Cambodia, which was linked to the improvements in the labor standards, was much higher than other Asian competitors (Bargawi, 2005). Thus, Cambodia retained an apparent advantage in preferential market regimes. The Cambodian government took various measures to boost the industry’s competitiveness in the world markets. A favorable investment policy helped investors to direct their attention to the country. For example, Cambodia has one of the most liberal investment regimes in developing Asia, where 100 per cent foreign equity ownership is allowed, with only a few industries closed to foreign investment. The government also offered very generous investment incentives to investors. Tax holidays are provided up to 9 years and approved projects are exempt from import duty on machinery and equipment. Investors can repatriate profit freely and reinvestment of earnings is encouraged with special depreciation allowances. With regards to the global integration, Cambodia has signed bilateral investment treaties (BITs) with 24 economies and territories, and recently started discussions on a potential BIT with the U.S. It has been a member of the World Trade Organization since 2004. Cambodia is a member of ASEAN and is party to ASEAN's regional economic integration where the aim is for goods and services to flow freely between the 10 member countries with regional tariff rates not exceeding 5per cent. A rapidly integrating ASEAN of about 600 million people makes Cambodia more attractive for investment because of its large regional market size and easier sourcing of production inputs within the ASEAN Economic Community, which is to be realized by 2015. Annex 2 of the report highlights some of the key elements of the country’s investment policy framework. Responding to the improvements in the investment climate, the inward FDI stock has increased rapidly. It was recorded to be $2,471 million in 2005, $4,637 million in 2008 and $6,850 million in 2011. Out of the total inward FDI stock, the manufacturing sector represents one-third of the stock while the garments and footwear industry makes up more than two-thirds (i.e. accounting for one-fifth of the total FDI stock) (Figure 2). FDI in the garments sector mainly comes from neighboring countries such as China, Taiwan Province of China, Republic of Korea, Hong Kong- China, Malaysia and Singapore. With regards to inward FDI flows, Cambodia has experienced a similar upward trend. FDI inflows amounted to US$381 millions in 2006 which rose to US$783 millions in 2010. Furthermore, inward FDI flows contributed by 32 per cent of gross fixed capital formation in 2005 which increased to 43 per cent in 2010. Regional benchmarking suggests that Cambodia is faring well with Viet Nam in terms of FDI capacity, as in both countries inward FDI
Inter-Agency Working Group
5
Food, beverages, tobacco; 3%
Agriculture; 12%
Garments; 19%
Footwear; 2%
Service sector; 41%
Others; 23%
Food, beverages, tobacco; 3%
Agriculture; 12%
Garments; 19%
Footwear; 2%
Others; 23%
Service sector; 41%
flows represent around 7-8 per cent of GDP and surpasses other countries in the region such as Bangladesh (0.9 per cent) and Lao PDR (5.1 per cent) but is outperformed by countries like Mongolia (25 per cent) (UNCTAD, Globstat database).
Figure 2- Inward FDI stock in Cambodia, by sector, 2011
Source: National Bank of Cambodia
Typically production in the global garments value chain is highly disaggregated. Large transnational retailers such as Gap (US) and H&M (Sweden) usually sub-contract the manufacturing in many parts of the world due to high volume of demand, and sell the products in their own stores with their own labels. Generally speaking, there are two patterns which differentiate the tier of countries that participate in the global value chain: i) a cluster of countries (companies) that contact and receive orders directly from global retailers/buyers (e.g. Turkey and India); and ii) another group of countries that use intermediaries to reach global buyers (e.g. Cambodia and Vietnam). In East and South East Asia the latter pattern generally prevails; the garments value chain is commonly coordinated by companies such as Li & Fung Ltd (Hong Kong). These intermediaries coordinate and control manufacturing sub-contractors and ship finished garments back to retailers. In addition, they may provide other services from product design to raw material sourcing, quality control and logistics, which cover the entire supply chain. The contractors that are responsible for the actual manufacturing of the garments either specialize in assembly activities (i.e. sewing the fabric and finishing) or provide full-package services that involve sourcing the textiles input, controlling the intermediary steps, packaging and shipping the order to the wholesalers or retailers.
Inter-Agency Working Group
6
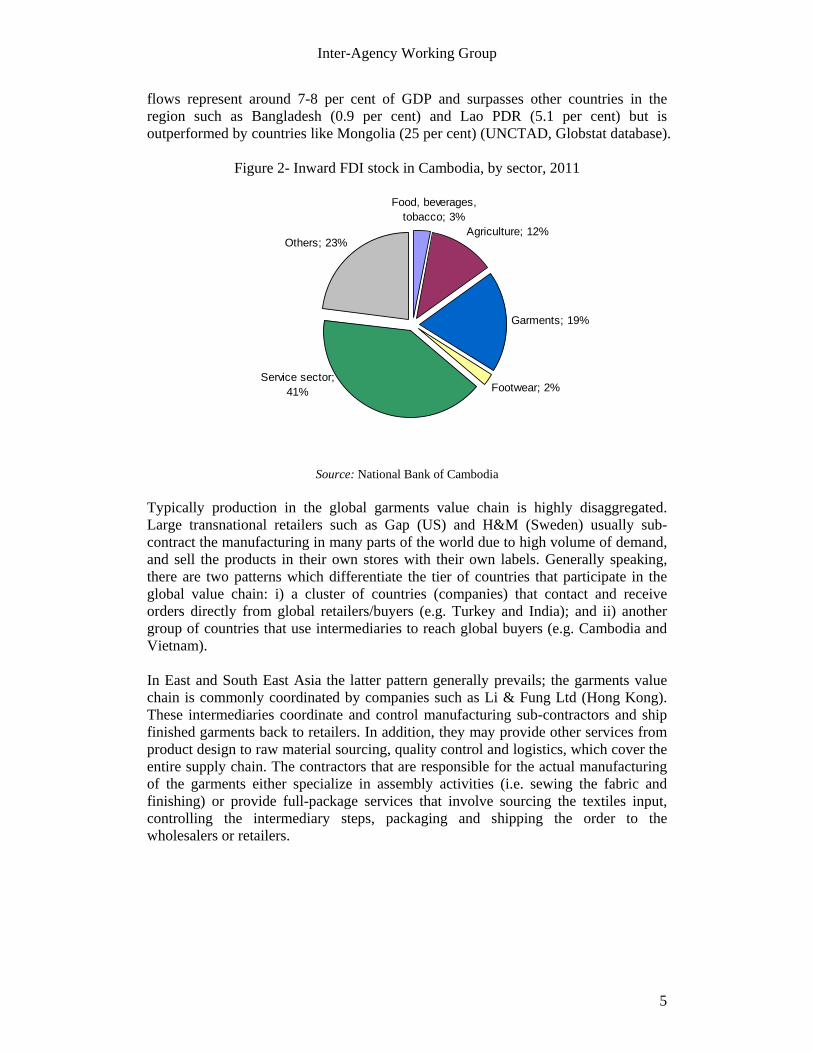
Figure 3- Garments Value Chain Diagram
Source: Gereffi and Frederick (2010)
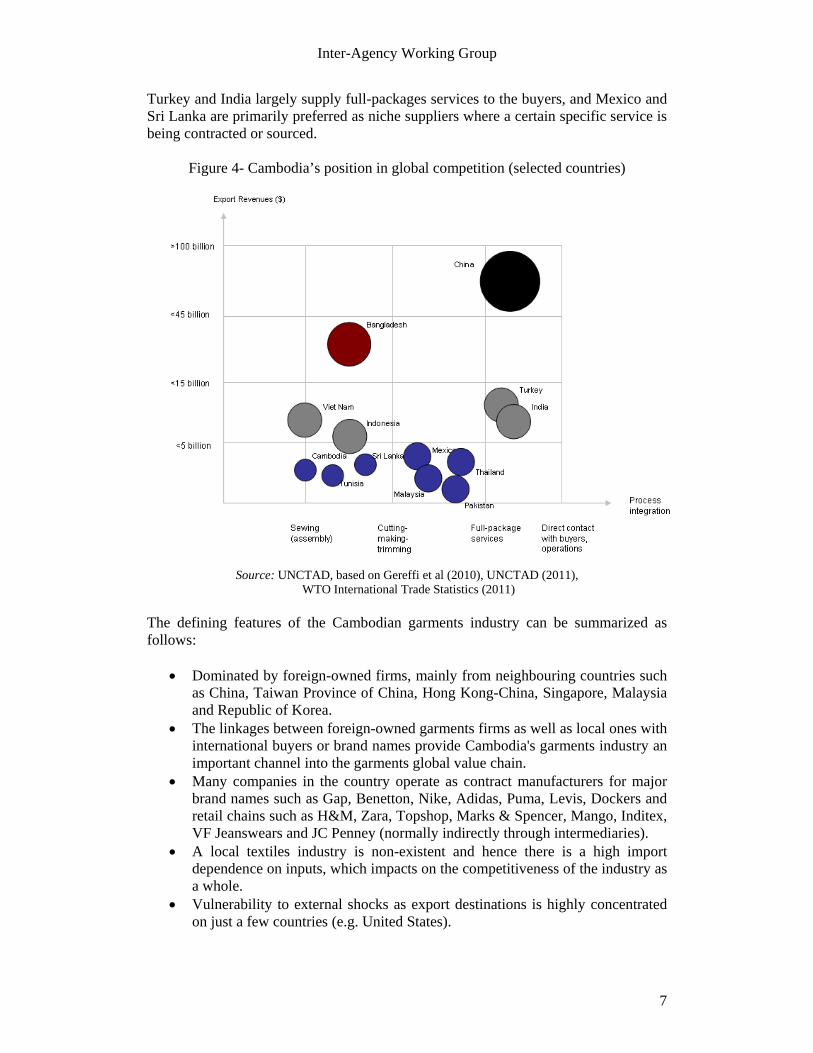
The main stages of production and distribution processes are illustrated in the figure above. Provision of inputs such as fibre and yarn, and processing into textiles is the initial step in the production process, which is followed by garments manufacturing. The garments manufacturing process comprises cutting and trimming fabrics, sewing, ironing, packing, adding final labels, and finishing the product. Once these stages are completed, distribution and sales services are undertaken by network providers, brand managers and marketers, as well as retailers, ensure that the products reach the final customers. Within the chain, value adding activities also include R&D and design, marketing and customer services (Gereffi and Frederick, 2010). However, as in the case of many developing countries, Cambodian garments producers are integrated into the global value chain by operating at the downstream end of the value chain; cutting and making yarns into finished garments (assembly activities) in which profit margins are relatively low and dependence on imports are high (Bargawi, 2005). Even though there are a number of leading garments exporting countries, it might be misleading to make comparisons among all exporters, as the industry characteristics in each country depend highly on the type of product (niche vs. basic) and the production segment in which the suppliers operate. In Cambodia, the majority of garments factories concentrate on cut-make-trim activities of basic garments; only a quarter of them cover full-package services and 15 per cent produce exclusively for big retail companies (i.e. subcontractors undertaking CMT operations) (USAID, 2007). Furthermore, the size of the industry in Cambodia compares well with those of Sri Lanka and Mexico, while India and Viet Nam have almost 3-4 times as large an export market as Cambodia. Figure 4 below clusters countries which essentially engage in direct competition in the value chain; the clustering is based on the size of their industries and specialization in the global production process. For example, while Viet Nam and Cambodia predominantly provide basic assembly services,
Inter-Agency Working Group
7
Turkey and India largely supply full-packages services to the buyers, and Mexico and Sri Lanka are primarily preferred as niche suppliers where a certain specific service is being contracted or sourced.
Figure 4- Cambodia’s position in global competition (selected countries)
Source: UNCTAD, based on Gereffi et al (2010), UNCTAD (2011), WTO International Trade Statistics (2011)
The defining features of the Cambodian garments industry can be summarized as follows:
Dominated by foreign-owned firms, mainly from neighbouring countries such as China, Taiwan Province of China, Hong Kong-China, Singapore, Malaysia and Republic of Korea.
The linkages between foreign-owned garments firms as well as local ones with international buyers or brand names provide Cambodia's garments industry an important channel into the garments global value chain.
Many companies in the country operate as contract manufacturers for major brand names such as Gap, Benetton, Nike, Adidas, Puma, Levis, Dockers and retail chains such as H&M, Zara, Topshop, Marks & Spencer, Mango, Inditex, VF Jeanswears and JC Penney (normally indirectly through intermediaries).
A local textiles industry is non-existent and hence there is a high import dependence on inputs, which impacts on the competitiveness of the industry as a whole.
Vulnerability to external shocks as export destinations is highly concentrated on just a few countries (e.g. United States).

Inter-Agency Working Group
8
FDI in Garments involves highly labour-intensive activities and is potentially footloose. .
Cambodian garments production is confined to lower value added of the value chain in ‘cut-make-assemble’ phase. The marketing function and production orders are dictated by parent companies based in home country or affiliates located in a third country. Cut, make and trim implies that supplier or buyer controls the designs and fabrics used, but outsources the labour-intensive operations.
Some 60 per cent of the garments factories operate on a cut, make and trim arrangement as subsidiaries of companies based in the neighbouring countries such as China, Taiwan Province of China and Republic of Korea.
Key contributor to employment, women empowerment, economic growth, export revenues and poverty reduction.
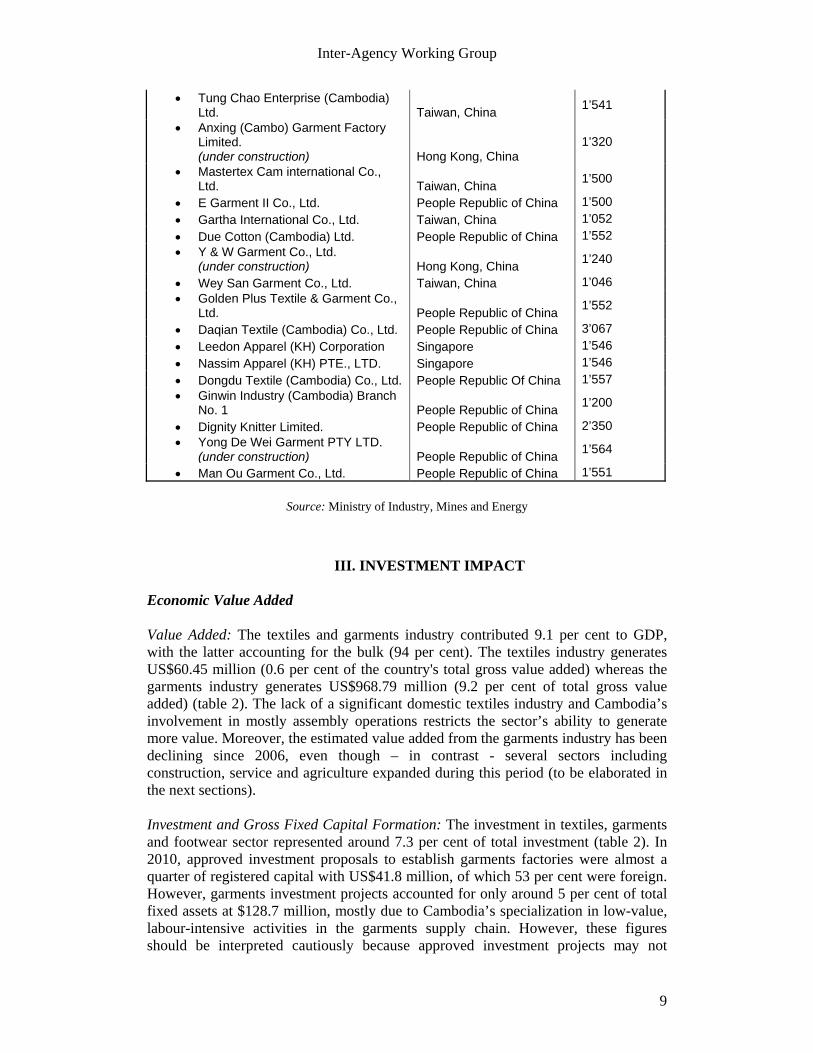
Major recipient of FDI accounting for a quarter of the total FDI stock. Table 1 below provides a list of selected major garments producers in Cambodia with employment size exceeding 1000 workers.
Table 1- Selected major foreign garments manufacturers in Cambodia
Name of company Home country Employment(Numbers)
PCCS Garments Limited Malaysia 10'000 Supertex Company Limited Hong Kong, China 7'000 QMI Industrial Company Limited Taiwan Province, China 6'930 June Textiles Company Limited Malaysia 5'000 SL Garment Processing Limited Singapore 5'000 Cambo Handsome Limited Republic of Korea 3'700 Violet Apparel Company Limited Malaysia 3'200 Camwell MFG Company Limited Taiwan Province, China 3'000 Global Apparels Limited Malaysia 2'200 Gennon Garment Manufacturing
Limited Hong Kong, China 2'000
Ocean Garments Co. Ltd. Bangladesh 1'970 Meng Ieng Garment Factory Ltd. Hong Kong, China 1'550 Quantum Clothing Limited United Kingdom 3’120 New Mingda Company Limited China 1'700
Royal Crowntex International Inc. USA/ Taiwan Province, China
1'500
Canteran Apparel Company Limited Malaysia 1'400 Meng Tong Garment Manufactory
Ltd. Hong Kong, China 1'050
Da Joo Limited Republic of Korea 1'000 Winner Garment Manufacturing
Company Limited (Purchased by Great Honour Textile Factory Limited
Taiwan Province, China (to China)
1’300
Dewhirst (Cambodia) Co., Ltd. England 1’319 Conpress holdings (Cambodia)
Garment Factory Limited. People Republic of China 1’200
Juin Ye Garment (Cambodia) Co., Ltd. Taiwan, China
1’352
Fu Chuen (Cambodia) Corp Ltd. People Republic of China 1’031
Inter-Agency Working Group
9
Tung Chao Enterprise (Cambodia) Ltd. Taiwan, China
1’541
Anxing (Cambo) Garment Factory Limited. (under construction) Hong Kong, China
1’320
Mastertex Cam international Co., Ltd. Taiwan, China
1’500
E Garment II Co., Ltd. People Republic of China 1’500
Gartha International Co., Ltd. Taiwan, China 1’052
Due Cotton (Cambodia) Ltd. People Republic of China 1’552 Y & W Garment Co., Ltd.
(under construction) Hong Kong, China 1’240
Wey San Garment Co., Ltd. Taiwan, China 1’046 Golden Plus Textile & Garment Co.,
Ltd. People Republic of China 1’552
Daqian Textile (Cambodia) Co., Ltd. People Republic of China 3’067
Leedon Apparel (KH) Corporation Singapore 1’546
Nassim Apparel (KH) PTE., LTD. Singapore 1’546
Dongdu Textile (Cambodia) Co., Ltd. People Republic Of China 1’557 Ginwin Industry (Cambodia) Branch
No. 1 People Republic of China 1’200
Dignity Knitter Limited. People Republic of China 2’350 Yong De Wei Garment PTY LTD.
(under construction) People Republic of China1’564
Man Ou Garment Co., Ltd. People Republic of China 1’551
Source: Ministry of Industry, Mines and Energy
III. INVESTMENT IMPACT
Economic Value Added Value Added: The textiles and garments industry contributed 9.1 per cent to GDP, with the latter accounting for the bulk (94 per cent). The textiles industry generates US$60.45 million (0.6 per cent of the country's total gross value added) whereas the garments industry generates US$968.79 million (9.2 per cent of total gross value added) (table 2). The lack of a significant domestic textiles industry and Cambodia’s involvement in mostly assembly operations restricts the sector’s ability to generate more value. Moreover, the estimated value added from the garments industry has been declining since 2006, even though – in contrast - several sectors including construction, service and agriculture expanded during this period (to be elaborated in the next sections). Investment and Gross Fixed Capital Formation: The investment in textiles, garments and footwear sector represented around 7.3 per cent of total investment (table 2). In 2010, approved investment proposals to establish garments factories were almost a quarter of registered capital with US$41.8 million, of which 53 per cent were foreign. However, garments investment projects accounted for only around 5 per cent of total fixed assets at $128.7 million, mostly due to Cambodia’s specialization in low-value, labour-intensive activities in the garments supply chain. However, these figures should be interpreted cautiously because approved investment projects may not
Inter-Agency Working Group
10
represent the actual registered capital or fixed assets as some investment proposals may not have been carried out. Exports: More than 70 per cent of the country's export revenues in 2007-2010 came from garments production alone, which was equivalent on average to 27per cent of Cambodia's GDP at current prices. In 2005, the garments exports were around US$2.2 billion, rising to US$3.0 billion in 2010. Cambodia’s garments products are exported to the US and, to a lesser extent, to the EU. Together these two markets account for a total of 75-80 per cent of the country’s garment exports. Other major export markets include Canada, Japan and Mexico. The conditions for preferential access to the EU markets are satisfied only in the case of Cambodia-made sweaters; and this makes the US market relatively more profitable. The largest buyer is the US garments retailer, GAP, accounting for one third of total exports. Other key buyers include Nike, Raebok, Adidas, Abercrombie & Fitch, Marks & Spencer’s and Wal-Mart. etc. The product portfolio is concentrated on knitted fabric garments; and the top 5 product categories account for around 65-70 per cent of total exports to the US and EU markets. These are typically t-shirts, sweaters, cardigans, pullovers and polo shirts which are classified as basic garments and do not require high-value added activities. Given the lack of a domestic textiles industry, garments producers almost exclusively rely on imported raw materials such as yarns, woven and circular knitted fabrics, accessories, trimmings like threads and almost all packing materials. The main sources of these inputs are China, Hong Kong, Taiwan Province of China and South Korea (Staritz, 2011). The share of imported textiles materials to total merchandise imports is around 25 per cent (two thirds supplied from China), which reduces the local value added generated from the garments production.

Inter-Agency Working Group
11
Table 2: Summary of key quantifiable indicators, 2010 estimates
Textiles Garments Value
(constant 2010 $ million or
number)
Share of total economy (per
cent)
Value (constant 2010 $ million
or number)
Share of total
economy (per cent)
Value added 60.5 0.6 969 9 Capital formation
registered capital: 41.8 fixed assets: 128.7
25 5
Export generation
19.4 0.4 3,041 54
Number of firms
250-350
No. of factories that are owned by large-sized firms3
50 8.64 343 ~60
Employment ~25,000 ~0.4 ~250,000 (direct)
~150,000 (indirect) ~4- 4.5
Wages ($ per hour)
0.27- 0.35 0.27- 0.35 per hour 60-70 per month
67per cent more
than the national average
Share of women in workforce
90
Memorandum: FDI stock (2010)
1,090 million 18.3
FDI inflows (2010)
131.5 million 16.8
Source: see Annex 3 for details and sources. Number of Business Entities: In 2008, the number of factories owned by large-sized firms, defined as an establishment with employment greater than 50 and/or actual investment of more than $1 million, was recorded to be 49 and 343 for textiles and garments factories respectively. Textiles factories account for 9 per cent of factories owned by large firms, whereas garments factories represent almost 60 per cent of such
3 Large-sized firms are defined by employment greater than 50 and/or actual investment of more than $1 million 4 The shares for this indicator shows the proportion of textiles and garments factories in the total number of factories owned by large firms
Inter-Agency Working Group
12
entities in the Cambodian economy (IFC, 2009). These factories are mostly foreign owned, usually Asian, with investors from Taiwan, Province of China, Hong-Kong, and China (65 per cent of all factories) to the fore. There are very few joint ventures between foreigner and Cambodian companies. The implication of this is that major managerial decisions to do with local manufacturing are almost exclusively made outside Cambodia. In addition to big exporters, there are also a significant number of local, “non-exporter” companies which receive orders as subcontracting arrangements from the larger garments factories during the peak season.5 Total fiscal revenues: Total tax revenue in Cambodia was $1.2 billion in 2011 (General Department of Taxation). The majority of this (over 80 percent of the total) was indirect tax (VAT, import & export duties etc.). Direct taxes, such as on profits (corporate tax), wages & salaries and rents/leases, comprise the rest. Much of this direct tax will come from local value added in the garments sector, which is by far the largest formal sector in the economy. Formalization is important because the Government can collect income tax from the work-force; and given that such a large part of the workforce is in garments and receives a relatively high wages (next section), the industry contributes significantly to Government revenues. At the same time, the country has to be wary of a too generous use of tax holidays (appendix 2). For instance, although corporate income tax in Cambodia is today set at around 20 per cent, except for the exploration and exploitation of natural resources,6 the relatively low share of direct to indirect taxes indicates that not all profits are being taxed. This is important, since the garments industry in Cambodia is now of long-standing. Having said this, because the predominant share of garments manufactured are exported, though garments sector will not contribute to indirect taxes such as VAT, the sector does pay import and export duties. In 2011 these duties amounted to over 20 percent of tax revenue (2.3 percent of GDP) and inasmuch as most of these can be attributed to garments, the sector (together with corporate and income taxes) makes an appreciable contribution to the country's fiscal revenue. Job Creation Total Employment: The garments industry is an important source of employment in the manufacturing sector given the labour-intensive operations in which the country specializes. The industry provides total employment of about 320,000 in the formal sector, a 12 per cent increase since 2005 (WTO, 2011). Linkages to the local economy provide further business and employment opportunities in transportation, construction and local trade activities. Considering the overall contribution of the sector, employment in the garments industry is estimated to be approximately 4 per cent of total employment, and 27 percent of the manufacturing sector in Cambodia. Despite some fluctuations, the average number of Cambodians employed per firm has
5 It was estimated that some 2000 to 3000 small garments factories in the capital city supply and act as subcontractors to the former big registered factories. See Bloomberg, " 'Just like China' before wage surge lures bra maker to Cambodia", 12 January 2012 (http://www.bloomberg.com/news/2012-01-12/-just-like-china-before-wage-surge-lures-bra-maker-to-cambodia.html). Also see EIC (2006), ref:10 6 However, prior to the promulgation of a new law on taxation in 1994, the corporate tax rate was only 9 per cent (appendix 2); after a phase-out period in general the new rate is now applicable.
Inter-Agency Working Group
13
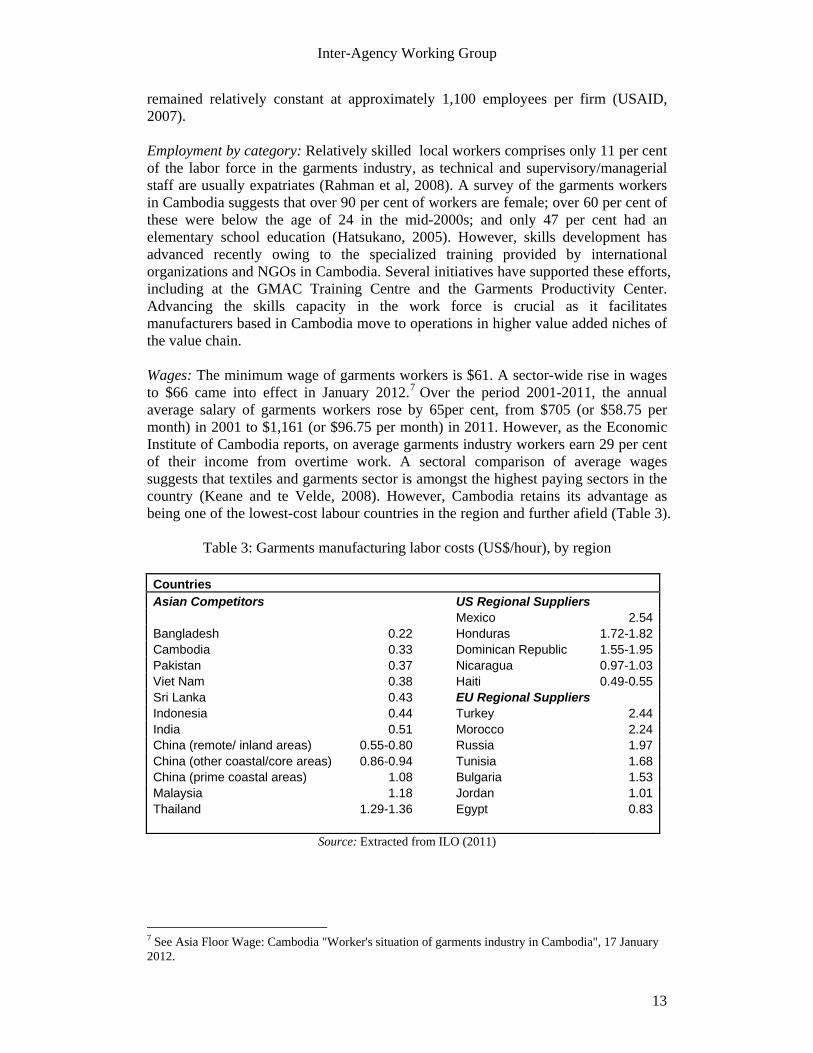
remained relatively constant at approximately 1,100 employees per firm (USAID, 2007). Employment by category: Relatively skilled local workers comprises only 11 per cent of the labor force in the garments industry, as technical and supervisory/managerial staff are usually expatriates (Rahman et al, 2008). A survey of the garments workers in Cambodia suggests that over 90 per cent of workers are female; over 60 per cent of these were below the age of 24 in the mid-2000s; and only 47 per cent had an elementary school education (Hatsukano, 2005). However, skills development has advanced recently owing to the specialized training provided by international organizations and NGOs in Cambodia. Several initiatives have supported these efforts, including at the GMAC Training Centre and the Garments Productivity Center. Advancing the skills capacity in the work force is crucial as it facilitates manufacturers based in Cambodia move to operations in higher value added niches of the value chain. Wages: The minimum wage of garments workers is $61. A sector-wide rise in wages to $66 came into effect in January 2012.7 Over the period 2001-2011, the annual average salary of garments workers rose by 65per cent, from $705 (or $58.75 per month) in 2001 to $1,161 (or $96.75 per month) in 2011. However, as the Economic Institute of Cambodia reports, on average garments industry workers earn 29 per cent of their income from overtime work. A sectoral comparison of average wages suggests that textiles and garments sector is amongst the highest paying sectors in the country (Keane and te Velde, 2008). However, Cambodia retains its advantage as being one of the lowest-cost labour countries in the region and further afield (Table 3).
Table 3: Garments manufacturing labor costs (US$/hour), by region
Countries Asian Competitors US Regional Suppliers Mexico 2.54 Bangladesh 0.22 Honduras 1.72-1.82 Cambodia 0.33 Dominican Republic 1.55-1.95 Pakistan 0.37 Nicaragua 0.97-1.03 Viet Nam 0.38 Haiti 0.49-0.55 Sri Lanka 0.43 EU Regional Suppliers Indonesia 0.44 Turkey 2.44 India 0.51 Morocco 2.24 China (remote/ inland areas) 0.55-0.80 Russia 1.97 China (other coastal/core areas) 0.86-0.94 Tunisia 1.68 China (prime coastal areas) 1.08 Bulgaria 1.53 Malaysia 1.18 Jordan 1.01 Thailand 1.29-1.36 Egypt 0.83
Source: Extracted from ILO (2011)
7 See Asia Floor Wage: Cambodia "Worker's situation of garments industry in Cambodia", 17 January 2012.
Inter-Agency Working Group
14
Sustainable Development Labor impact: Labor standards and practices are increasingly becoming a major factor in global buyers’ sourcing decisions. In fact, a survey conducted among major garments buyers revealed that labor standards are regarded as more important locational considerations than access to international materials/ supplies, customs facilitation, or tariff preferences. The survey also showed that Cambodia was ranked among the highest on the 'level of labor standards', especially compared to other Asian garments exporting countries such as Bangladesh, China, Thailand and Vietnam (FIAS, 2004). Efforts in this area were initiated first by the US-Cambodia Trade Agreement on Textiles and Apparel (TATA) in 1999 which linked quota access by Cambodian garments exports to labour-standard compliance in the countries factories. As a result of improvements in these standards, Cambodia received a bonus quota of 9 per cent in 2002 and 14 per cent in 2004 from the US. Further, ILO monitoring and implementation of the project ‘Better Factories Cambodia’ has more recently made a significant positive effect on Cambodia’s image. Social impact: The garments industry not only generates job opportunities for a large number of people, but also offers financial independence for women as the labor force in the factories consist mostly of women (around 90 per cent). In consequence 20 per cent of the entire female workforce is accounted for by this industry alone. Furthermore, the industry provides opportunities for entrepreneurship, particularly for women. Women entrepreneurs in the textiles and garments sector accounted for 30 per cent of the total women entrepreneurs in small-scale manufacturing businesses which have less than 50 employees and with assets not greater than $250,000 (Ministry of Industry, Mine and Energy). Poverty Alleviation: The industry plays a significant role in poverty alleviation through two main channels. First, it provides employment opportunities for young, low-skilled entry-level workers with salaries well above the poverty line (60 per cent more per month, given that the national poverty line is set at $1.25). Secondly, garments workers send almost 50 per cent of their monthly wages to their families in rural areas. IFC estimates suggest that the garments industry helps alleviate the poverty of nearly 1.5 million people (i.e. 10 per cent of the total population), assuming that each worker supports 4 or 5 family members. Environmental Impact: In terms of energy usage and cost; Cambodian garments factories can improve their efficiency. A recent assessment8 shows that energy is most commonly used during working hours, that is about 10 hours per day, 6 days per week. Electricity and rubber wood are the two most commonly used types of fuel. Electricity accounts for only 24.5% of total energy usage, but its cost represents 53% of total energy cost per ton of production.9 While the average energy cost to produce a ton of garments is US$560, the most energy intensive production facilities per ton of product
8 This assessment is based on the field survey of 31 garments factories in Cambodia, conducted during July and August 2009. The sample of factories represented approximately 12 per cent of exporting factories in operation in Cambodia. However, the results are still indicative as this study is the first exercise to make an assessment of the environmental impact of the sector (ILO and IFC, 2009). 9 Wood is used to produce 43.3% of total energy used in factories and is used by a majority (71%) of factories. Wood is the cheapest source of energy and it accounts for only 10% of total energy cost per ton of product.
Inter-Agency Working Group
15
are factories producing bottoms (i.e. trousers, jeans, shorts) with 56GJ per ton of products and shirts with 55GJ per ton of products, and factories with more than 3000 employees (74GJ/t). In terms of greenhouse emissions; the average emission level from the surveyed factories is 2.74tCO2e per ton of garments production. The best quartile of factories emit less than 1.39tCO2e. Electricity represents 60% of the greenhouse gas emissions, followed by diesel at 24%.The highest GHG emissions are observed in factories with relatively low energy intensity (ILO, IFC and GMAC, 2009). Overall the analyses on which this paragraph draws show that there is room for reducing the overall energy consumption in the sector through adopting more efficient processes and techniques.
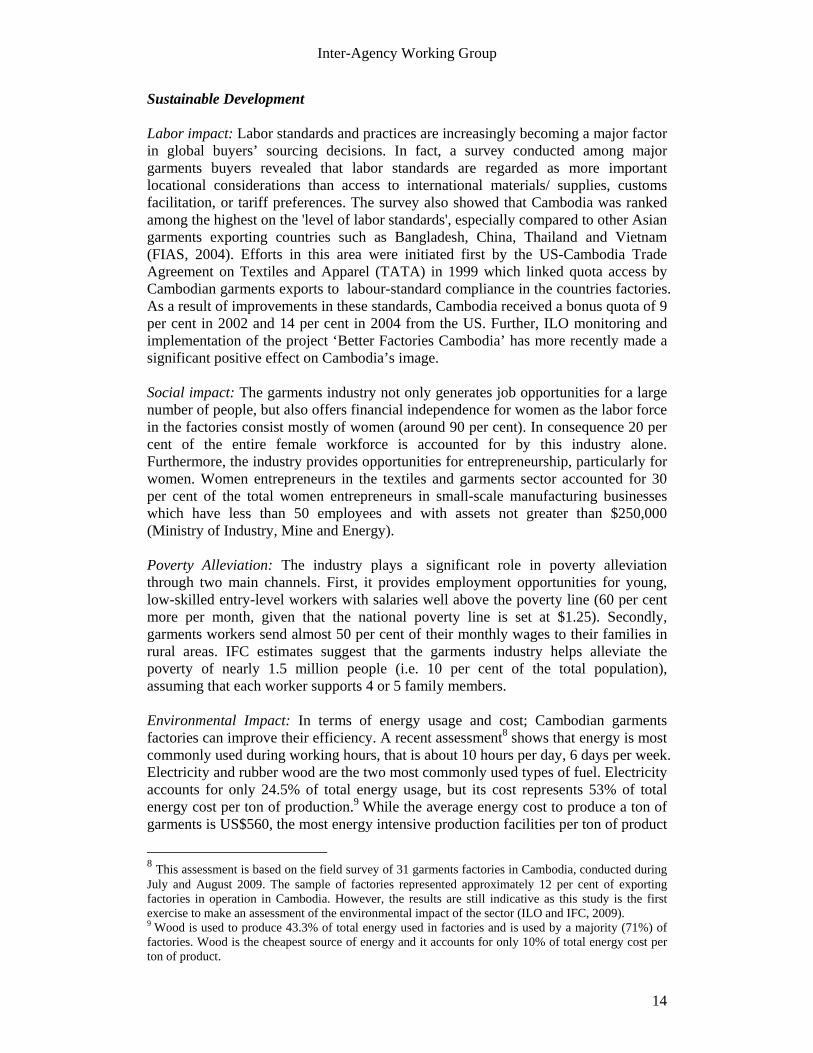
IV. POLICY CHALLENGES AND OPPORTUNITIES Cambodia’s current role as a cut-make-trim operator in the global value chain offers limited profit margins, which has implications for vertical integration or expansion into higher-value activities. Cambodia’s specialization in assembly activities that involve cutting and sewing the fabrics into finished garments make up only a small part in the total production process. As shown in the Figure 5, cut-make-trim activities cost only about $2 of the overall typical retail price of $30.65 of a basic men’s cotton shirt. Further, considering the total cost of the finished garments, which is around $6.80, the CMT operations still represents a low share in the cost structure (20 per cent). Hence, even with Cambodia’s advantage in low cost labor, the profit margins for garments manufacturers tend to be small. This suggests that further business opportunities can be found in vertical integration of garments production (particularly provision of fabric and assembly) or in other parts of the production process (e.g. retail including marketing and R&D operations) which generate higher value added per unit.
Figure 5- Cost Breakdown of a Men’s Woven Cotton Shirt
Source: UNCTAD based on InfoDev study
Inter-Agency Working Group
16
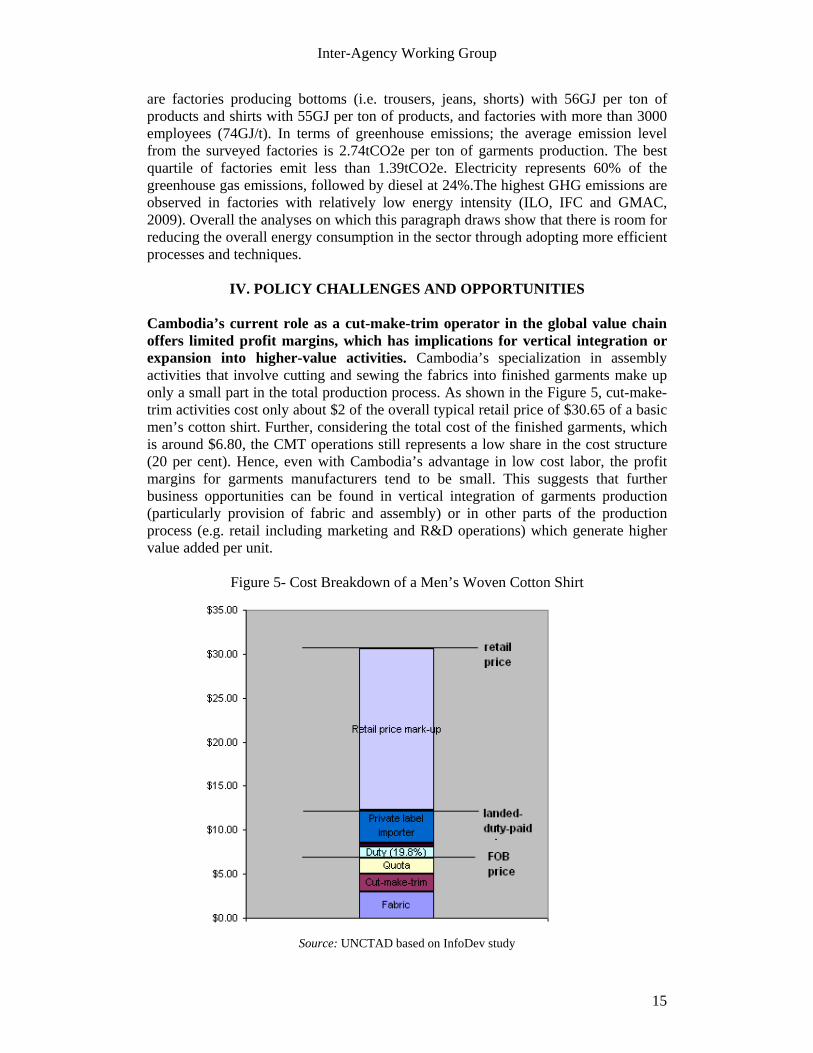
Even within the small segment of the value chain in which Cambodia operates, value added has been declining. Given the current structure of the value chain in the economy, characterized by a virtually non-existent domestic textiles industry, a high share of foreign factory ownership, specialization in basic low value added operations that involve mostly assembly activities to prepare finished garments, Cambodia’s manufacturers increasingly face competitive pressures from global markets. When Cambodia’s performance is compared with the other major garments exporters in the region, it becomes evident that Cambodia has been experiencing a downturn in the sector. Using the residual from the share of textiles imports in garments exports as a proxy for the value added, chart 6 below generates a number of implications for the Cambodian industry.
Figure 6- Trend in estimated value added as a percentage of garments export value, by country
Source: UNCTAD based on UN Comtrade data As can be seen in the chart, Viet Nam started with a low share of local value added with around 20 per cent of export value, but gradually increased it to above 30 per cent. Bangladesh similarly saw a rapid growth in value added, particularly due to government policies encouraging investment in the textiles and garments industry locally. Sri Lanka, Malaysia and Cambodia started with similar shares of value added in the early 2000s, but followed different paths: on the one hand, while Sri Lanka had a steady but modest growth in the value added in export value, Malaysia experienced a significant growth of about 20 per cent, particularly in the last 5 years. Cambodia, on the other hand, experienced a notable decline in its value added share, losing 15 per cent points in recent years (local value added now stands at 40%). Although the proxy used is not perfect, the analysis suggests that the country is not able to fully capture or retain value added in the industry, as little of the value chain operates inside the country. All the other countries in this analysis possess a significant local textiles industry, as well as other segments of the value chain operating in their economies.

Inter-Agency Working Group
17
The reasons causing this decline in the competitiveness of Cambodia’s garments industry are twofold10. First, since the Multi-Fibre Arrangement (MFA) phase-out in 2004, which used to secure the developing country market shares in the US and the EU markets due to preferential access, the unit price of garments exports has been dropping (Figure 7). The increased competition arising from this development has led to a reduction in the price of exports by around 30 per cent in six years. Second, the unit price of imported fabric has been on rise possibly due to factors such as the overall increase in the commodity prices, and the competitive pressure for quality-fabrics from other Asian garments exporters. Figure 7 shows that the loss of value added is explained equally by increasing fabric prices as falling garments prices. A possible way to capture more value in the garments industry is to expand textiles operations and for garments factories to do even more cutting and design.
Figure 7- Unit export and import prices and loss in value added for Cambodia
Source: UNCTAD based on data from UNComtrade and Asuyama et al (2012) Complications related to cross-border trade are putting Cambodia at a disadvantage. Due to the highly dispersed nature of the production process around the globe, transaction costs, particularly those related to the circulation of inputs among contracted manufacturers in different countries, have a great impact on the industry’s competitiveness. Cross-country rankings of the ease of trade highlight Cambodia’s weak position in comparison to other major garments exporter countries. The figure below shows an overall ranking for cross-border trade which measures the related procedures, time and cost to export and import a package, comparing Cambodia with a set of competitor countries (figure 8). Hence, improving trade facilitation could in itself be an avenue to improve the sector performance. It should be noted, however, that significant progress in Customs has been made under the leadership of the General Department of Customs and Excise. In collaboration with other agencies, notably the World Bank, OECD-WTO, and WCO, efforts have been in place for the application of appropriate IT to border management activities,
10 The effect of fluctuations in the real effective exchange rate has been considered, but was not found significant. Furthermore, the possibility that high share of imported textiles helping to boost the garments exports and surge the value added is examined, but concluded rather on the detrimental effect of imported textiless.
0.2
0.25
0.3
0.35
0.4
0.45
0.5
0.55
0.6
0.65
2000 2002 2004 2006 2008 2010
1.8
2.3
2.8
3.3
3.8
4.3
4.8
5.3
5.8
import of textiles/export of garments unit fabric import price(nominal USD per yarn)
0.2
0.25
0.3
0.35
0.4
0.45
0.5
0.55
0.6
0.65
2000 2002 2004 2006 2008 201015
20
25
30
35
40
45
50
import of text iles/export of garments unit garment export price(nominal USD per dozen)
Inter-Agency Working Group
18
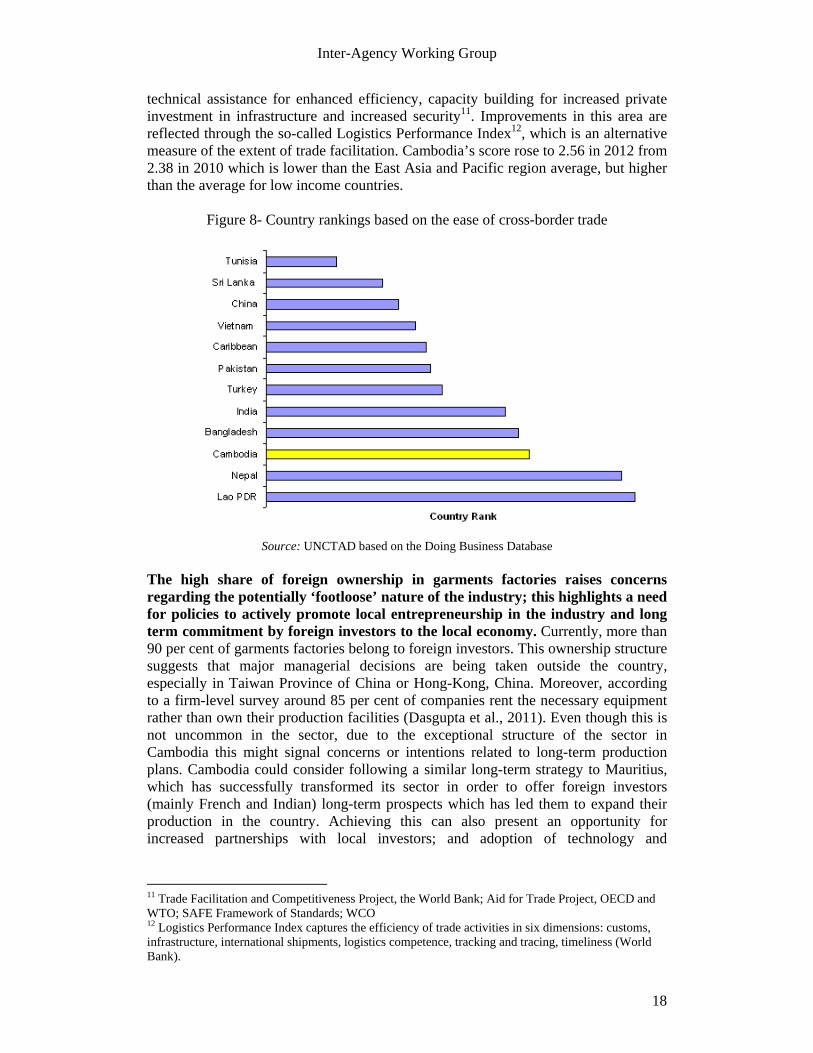
technical assistance for enhanced efficiency, capacity building for increased private investment in infrastructure and increased security11. Improvements in this area are reflected through the so-called Logistics Performance Index12, which is an alternative measure of the extent of trade facilitation. Cambodia’s score rose to 2.56 in 2012 from 2.38 in 2010 which is lower than the East Asia and Pacific region average, but higher than the average for low income countries.
Figure 8- Country rankings based on the ease of cross-border trade
Source: UNCTAD based on the Doing Business Database The high share of foreign ownership in garments factories raises concerns regarding the potentially ‘footloose’ nature of the industry; this highlights a need for policies to actively promote local entrepreneurship in the industry and long term commitment by foreign investors to the local economy. Currently, more than 90 per cent of garments factories belong to foreign investors. This ownership structure suggests that major managerial decisions are being taken outside the country, especially in Taiwan Province of China or Hong-Kong, China. Moreover, according to a firm-level survey around 85 per cent of companies rent the necessary equipment rather than own their production facilities (Dasgupta et al., 2011). Even though this is not uncommon in the sector, due to the exceptional structure of the sector in Cambodia this might signal concerns or intentions related to long-term production plans. Cambodia could consider following a similar long-term strategy to Mauritius, which has successfully transformed its sector in order to offer foreign investors (mainly French and Indian) long-term prospects which has led them to expand their production in the country. Achieving this can also present an opportunity for increased partnerships with local investors; and adoption of technology and
11 Trade Facilitation and Competitiveness Project, the World Bank; Aid for Trade Project, OECD and WTO; SAFE Framework of Standards; WCO 12 Logistics Performance Index captures the efficiency of trade activities in six dimensions: customs, infrastructure, international shipments, logistics competence, tracking and tracing, timeliness (World Bank).

Inter-Agency Working Group
19
managerial know-how jointly with others may gradually add to the competitiveness of the sector. Increased demands from global buyers are raising barriers to entry into new production segments, as well as making it more difficult to maintain competitiveness in segments of the global garments value chain already present in the country. Cambodia’s competitive advantage is largely based on low labor costs. However, the criteria for sourcing and investment decisions have become more diverse than simply cost structures within the last decade. Issues such as compliance with labor and environmental standards, flexibility with production schemes, increased responsibility for controlling and managing a more integrated supply chain have become more important. Global buyers have become more sensitive to compliance issues, they ask for reduced lead times and greater control over the manufacturing process. Cambodia has made great improvement on compliance to labor standards but it has been left behind by its competitors in terms of lead times in the production of knitted garments: Cambodia (80-110 days), Bangladesh (60-80 days), Indonesia, Sri Lanka, Malaysia, Viet Nam (60-90 days), Thailand (50-60 days), India (60-70 days), China (50-60 days) (World Bank, 2011). Thus, given the variety of factors determining the competitiveness in the sector, Cambodian garments manufacturers should not only focus on low-cost basic operations, but also seek ways to improve their production capabilities.
V. CONCLUSIONS AND POLICY RECOMMENDATIONS Short-term recommendations Expanding the value chain in the country is possible through expanding design and cutting activities. The current National Strategic Development Plan 2009-13 takes note of ‘the sector’s limited participation in garments value chain functions’ and ‘the signs of losing its competitive edge’, but does not provide any specific policy action or strategy to enhance Cambodian manufacturers’ position in the world markets. The analysis in this report suggests that the declining value added in the garments industry and limited participation in the global value chain are particularly linked to the increasing price of the imported material, notably yarn and fabric. Encouraging garments manufacturers to expanding design and consequent cutting activities within their factories may be an option to reduce dependence on high-priced already-designed-and-cut fabric. This strategy by garments manufacturers could be complemented and supported by initiatives to expand the textiles industry; and doing this will also increase local economic value added in the inputs segment of the value chain. Putting in place trade facilitation measures can improve the sector’s contribution to the Cambodian economy. As highlighted in the previous section, Cambodia performs poorly in terms of many cross-border trade indicators (Figure 8). Given the highly fragmented nature of global garments production, transaction costs arising from movement of intermediate goods is an important determining factor in investment decisions. To improve this aspect, Cambodia could focus on increasing the efficiency of its main international ports (Sihanoukville, Phnom Penh, Koh Kong), the main highroads connecting to major Asian markets and transport hubs, and

Inter-Agency Working Group
20
communications more generally. Implementing such a strategy would facilitate exports of garments to neighboring countries, stimulate triangular cooperation among Cambodia, Viet Nam and Lao PDR, and accelerate country’s integration into the regional and global economy on a larger scale. Long-term recommendations FDI and regional cooperation may be important instruments to stimulate the textiles sector. In the long-term, policymakers could direct their efforts toward developing a robust domestic textiles industry, which can supply the necessary inputs, including accessories, to garments manufacturers. However, stimulating the textiles industry and maintaining competitiveness in the garments sector at the same time may not be straightforward given the following constraints faced by Cambodia: i) the lack of local production in cotton and man-made fibers; ii) investment requirements in equipment and machinery (textiles is a capital intensive sector); iii) reliance on the quality of infrastructure (particularly water and electricity); iv) a need for skills pertinent to the industry. Thus, promoting FDI or joint ventures to facilitate linkages between the textiles and garments industries and develop vertical integration may be the most viable strategy. For example, Bangladesh gradually supported the local textiles industry (including foreign-invested operations) with various investment incentives and successfully reduced the share of imported textiles material in the manufacturing process. At the same time, however, Cambodia does not possess a well-established traditional textiles industry on which it can easily build; nor might the local garments sector be of a sufficient scale to justify large-scale investment in textiles factories. Hence, another option may be to take advantage of the regional textiles/garments value chain. Given the prominent role of the textiles and garments sector in neighboring countries’ economies, incentives may be offered to investors in these countries (e.g. big textiles companies in Malaysia) to establish operations in Cambodia, not only to supply the domestic Cambodian market, but also other ASEAN countries. These incentives could be in the form of reduced duty charges, exemption from taxes and promotion of the ASEAN Economic Community in which Cambodia could carve a strategic role in the regional textiles and garments value chains, including easy sourcing of inputs. Cambodian garments industry could diversify its product portfolio and end-markets. Cambodia predominantly specializes in manufacturing basic garments, which are typically produced in high volume, low value added operations; of which, approximately 70 per cent are knitted garments and 30 per cent are woven products. The top 5 product categories13 make up nearly 65-70 per cent of the country’s total garments exports. The US and the EU are the primary markets for Cambodian garments, accounting for around 75-80 per cent of total exports. As the National Strategic Development Plan acknowledges, this narrow production base and high dependence on the US and EU markets makes the industry vulnerable to shocks. In this regard, gradually moving away from basic garments production and focusing on niche markets, as in the case of Sri Lanka and Mexico, may gain Cambodia
13 These categories include jackets, dresses; pullovers, cardigans; suits, trousers; t-shirts, singlets; underwear, nightwear

Inter-Agency Working Group
21
competitive advantage in the longer term, as well as reduce its dependence on specific products or markets. Operating as a niche market supplier implies specializing in terms of market, product or customers, and serving smaller segments of the market. Former mass market garments exporters in other countries pursued this strategy mainly because niche producers are able to compete on quality, design and lead times, rather than on cost. This makes sense increasingly as cost pressures increase in the sector, particularly from Chinese and Indian manufacturers, making it ever more difficult for small countries to maintain their competitiveness. By way of example, this has lead to the adoption of alternative production schemes by many smaller manufacturers. Particularly after the MFA phase out in 2004, Sri Lanka pursued a strategy of specialization, for instance in women’s underwear and active wear; Mexico promoted denim trousers and image-wear to its niche buyers; and Mauritius consciously moved towards high quality knits and woven men’s shirts. Concentrating in the production of specific categories, these countries were able to establish long term strategic relationships with global buyers (e.g. Sri Lanka with Victoria’s Secret, Nike and Gap). Cambodia could also pursue a similar diversification strategy in order to secure its share in the global market. Diversification may also open up opportunities for local entrepreneurs in new lines of business. Harnessing a skilled workforce offers further prospects. Owing to the rapid industrialization and training provided by NGOs and manufacturers, Cambodia has developed a skilled labor force in the garments industry. The capacity of this skilled workforce may be used in several areas beyond this value chain. First, encouragement could be given to companies to expand employment of Cambodians in managerial and technical positions; currently most of the upper level positions are filled by expatriates. Secondly, these managerial/technical skills could be used – in due course as workers move between firms – by (sub-contractor) companies to foster better, independent networks with global buyers, thereby reducing reliance on intermediaries in Taiwan Province of China, Hong Kong, China and elsewhere. This open avenues for businesses, as the new networks can lead to additional investment opportunities. Finally, with careful targeting and a gradual change in the investment climate, local entrepreneurship may be fostered with the aim of their entry into other related industries or sectors (e.g. footwear). Leveraging the skills gained in the garments industry may be instrumental in developing entrepreneurial capacity, as well as new industries.

Inter-Agency Working Group
22
Annex 1
List of Meetings and Interviews
Name Position Organization
Mr. Dara CHEA Director of SME Department Ministry of Industry, Mine and Energy
Mr. Khin Vorac EM Deputy Director General General Department of Customs and Excise of Cambodia
Mr. Sovuthea HAY Deputy Head of Social Policy Division
Supreme National Economic Council
Mrs. Supheap PHENG Director of Inter-Ministerial Coordination Department
Cambodian Investment Board
Mr. Sochinda SENG Director of Environmental Impact Assessment Department
Cambodian Investment Board
Annex 2
Cambodia: Foreign investment policy regime and incentives
Area Comment
Government agency dealing with FDI
Cambodian Investment Board (CIB) Council for the Development of Cambodia (CDC)
Limits on foreign equity participation
100per cent foreign ownership is allowed in all sectors/industries
Tax incentives A tax holiday determined according to the formula: "trigger period + 3 years + n priority years". (Trigger period: the first year of profit or 3 years after the first revenue is made, whichever is sooner. Priority period: to be determined by CDC)
A standard 20per cent corporate tax rate for all new projects (domestic and foreign-invested firms) from May 2005
The 9per cent corporate tax rate applicable to invested enterprises approved prior to the promulgation of the new law (5 August 1994) to be phased out, 20per cent within the ensuing 5 years
Inter-Agency Working Group
23
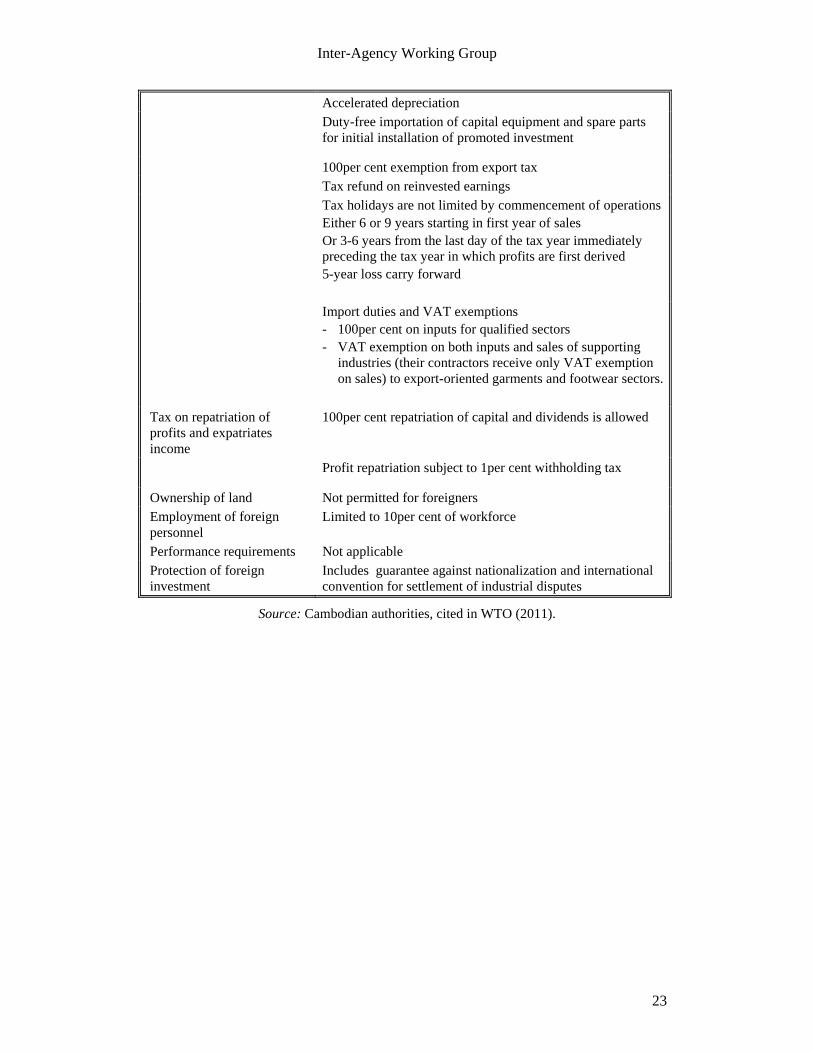
Accelerated depreciation Duty-free importation of capital equipment and spare parts
for initial installation of promoted investment
100per cent exemption from export tax Tax refund on reinvested earnings Tax holidays are not limited by commencement of operations
Either 6 or 9 years starting in first year of sales Or 3-6 years from the last day of the tax year immediately preceding the tax year in which profits are first derived 5-year loss carry forward
Import duties and VAT exemptions - 100per cent on inputs for qualified sectors - VAT exemption on both inputs and sales of supporting
industries (their contractors receive only VAT exemption on sales) to export-oriented garments and footwear sectors.
Tax on repatriation of profits and expatriates income
100per cent repatriation of capital and dividends is allowed
Profit repatriation subject to 1per cent withholding tax
Ownership of land Not permitted for foreigners Employment of foreign personnel
Limited to 10per cent of workforce
Performance requirements Not applicable Protection of foreign investment
Includes guarantee against nationalization and international convention for settlement of industrial disputes
Source: Cambodian authorities, cited in WTO (2011).
Inter-Agency Working Group
24
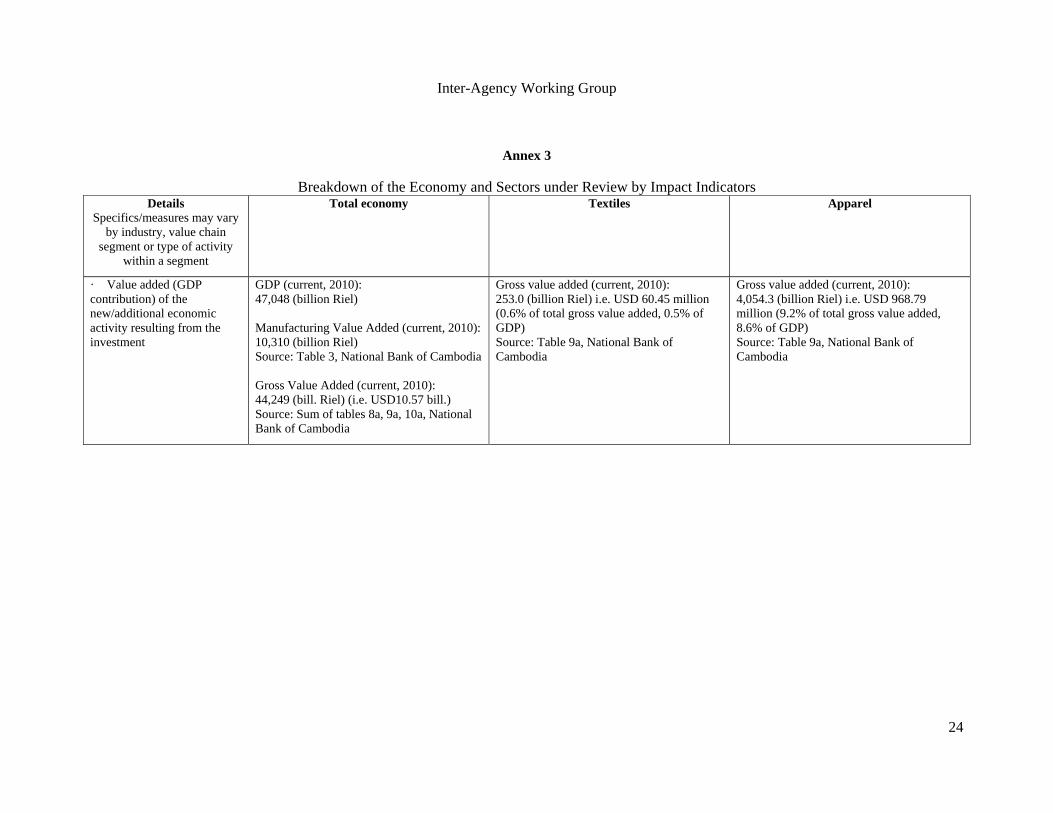
Annex 3
Breakdown of the Economy and Sectors under Review by Impact Indicators Details
Specifics/measures may vary by industry, value chain
segment or type of activity within a segment
Total economy Textiles Apparel
· Value added (GDP contribution) of the new/additional economic activity resulting from the investment
GDP (current, 2010): 47,048 (billion Riel) Manufacturing Value Added (current, 2010):10,310 (billion Riel) Source: Table 3, National Bank of Cambodia Gross Value Added (current, 2010): 44,249 (bill. Riel) (i.e. USD10.57 bill.) Source: Sum of tables 8a, 9a, 10a, National Bank of Cambodia
Gross value added (current, 2010): 253.0 (billion Riel) i.e. USD 60.45 million (0.6% of total gross value added, 0.5% of GDP) Source: Table 9a, National Bank of Cambodia
Gross value added (current, 2010): 4,054.3 (billion Riel) i.e. USD 968.79 million (9.2% of total gross value added, 8.6% of GDP) Source: Table 9a, National Bank of Cambodia
Inter-Agency Working Group
25
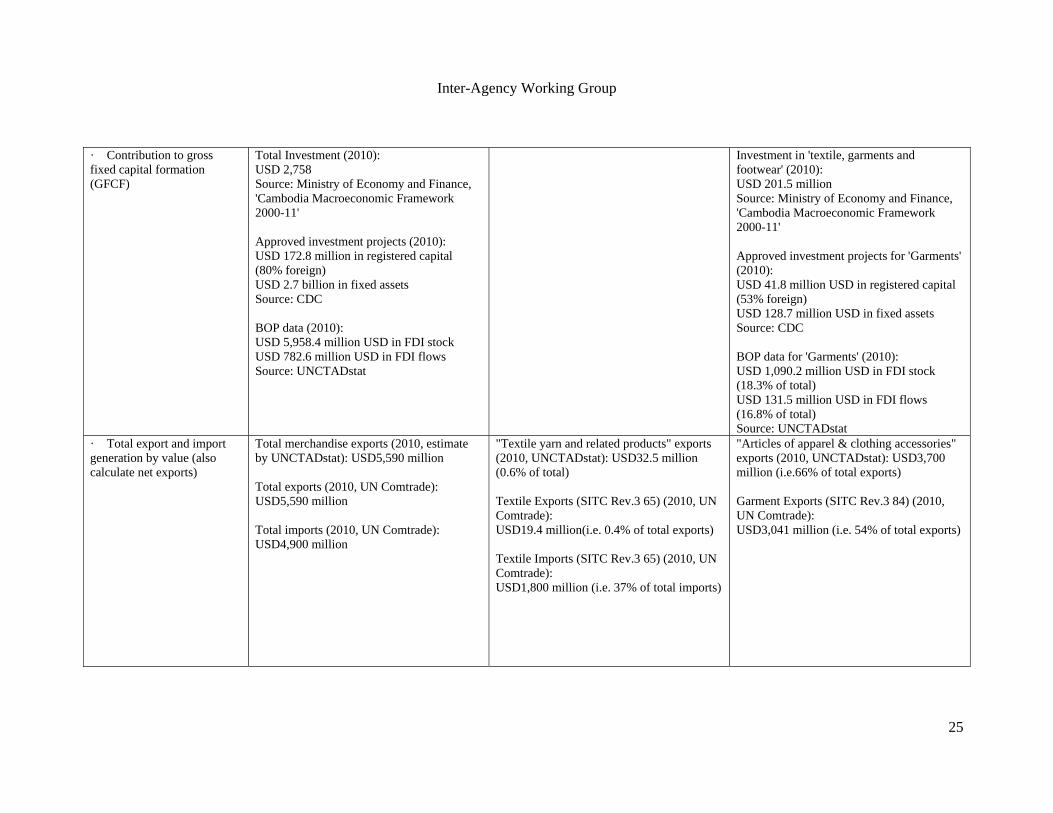
· Contribution to gross fixed capital formation (GFCF)
Total Investment (2010): USD 2,758 Source: Ministry of Economy and Finance, 'Cambodia Macroeconomic Framework 2000-11' Approved investment projects (2010): USD 172.8 million in registered capital (80% foreign) USD 2.7 billion in fixed assets Source: CDC BOP data (2010): USD 5,958.4 million USD in FDI stock USD 782.6 million USD in FDI flows Source: UNCTADstat
Investment in 'textile, garments and footwear' (2010): USD 201.5 million Source: Ministry of Economy and Finance, 'Cambodia Macroeconomic Framework 2000-11' Approved investment projects for 'Garments' (2010): USD 41.8 million USD in registered capital (53% foreign) USD 128.7 million USD in fixed assets Source: CDC BOP data for 'Garments' (2010): USD 1,090.2 million USD in FDI stock (18.3% of total) USD 131.5 million USD in FDI flows (16.8% of total) Source: UNCTADstat
· Total export and import generation by value (also calculate net exports)
Total merchandise exports (2010, estimate by UNCTADstat): USD5,590 million Total exports (2010, UN Comtrade): USD5,590 million Total imports (2010, UN Comtrade): USD4,900 million
"Textile yarn and related products" exports (2010, UNCTADstat): USD32.5 million (0.6% of total) Textile Exports (SITC Rev.3 65) (2010, UN Comtrade): USD19.4 million(i.e. 0.4% of total exports) Textile Imports (SITC Rev.3 65) (2010, UN Comtrade): USD1,800 million (i.e. 37% of total imports)
"Articles of apparel & clothing accessories" exports (2010, UNCTADstat): USD3,700 million (i.e.66% of total exports) Garment Exports (SITC Rev.3 84) (2010, UN Comtrade): USD3,041 million (i.e. 54% of total exports)

Inter-Agency Working Group
26
· Number of businesses in the value chain or value chain element supported by the investment.
376,761 establishments in economy (2009). Of which: 362,083 Private (domestic) 144 Private (foreign) 8,672 State-owned 907 NGO 4,953 Other Source: Nation-Wide Establishment Listing 2009.
11,387 establishments in economy (2009). Source: Nation-Wide Establishment Listing 2009. (one firm can have several establishments) Number of factories owned by large-sized firms (2008): textile: 49 (i.e. 8.6% of all factories) (Large-sized firm is defined as an establishment with employment greater than 50 and/or actual investment of more than USD 1million.) Source: IFC 2009
9,425 establishments in economy (2009). Source: Nation-Wide Establishment Listing 2009. Number of factories owned by large-sized firms (2008): wearing apparel: 343 (i.e. 59.9% of all factories) Source: IFC 2009 Number of factories (2000-10 average): 250-300 Source: Ministry of Commerce, Cambodia
· Total fiscal take from the economic activity resulting from the investment, through all forms of taxation, including taxes levied from the company as well as from employees
Total government revenues (2009): 6,611 (bill. riel) Of which: Taxes: 4,163 (bill. riel) (63% of total revenue). Of which: Taxes on income, profits, and capital gains: 744 (bill. riel) Taxes on property: 0 (bill. riel) Taxes on goods and services: 2,348 (bill. riel) Taxes on international trade and transactions: 1,064 (bill. riel) (Source: GFS, IMF)
Not separately available Not separately available
Inter-Agency Working Group
27
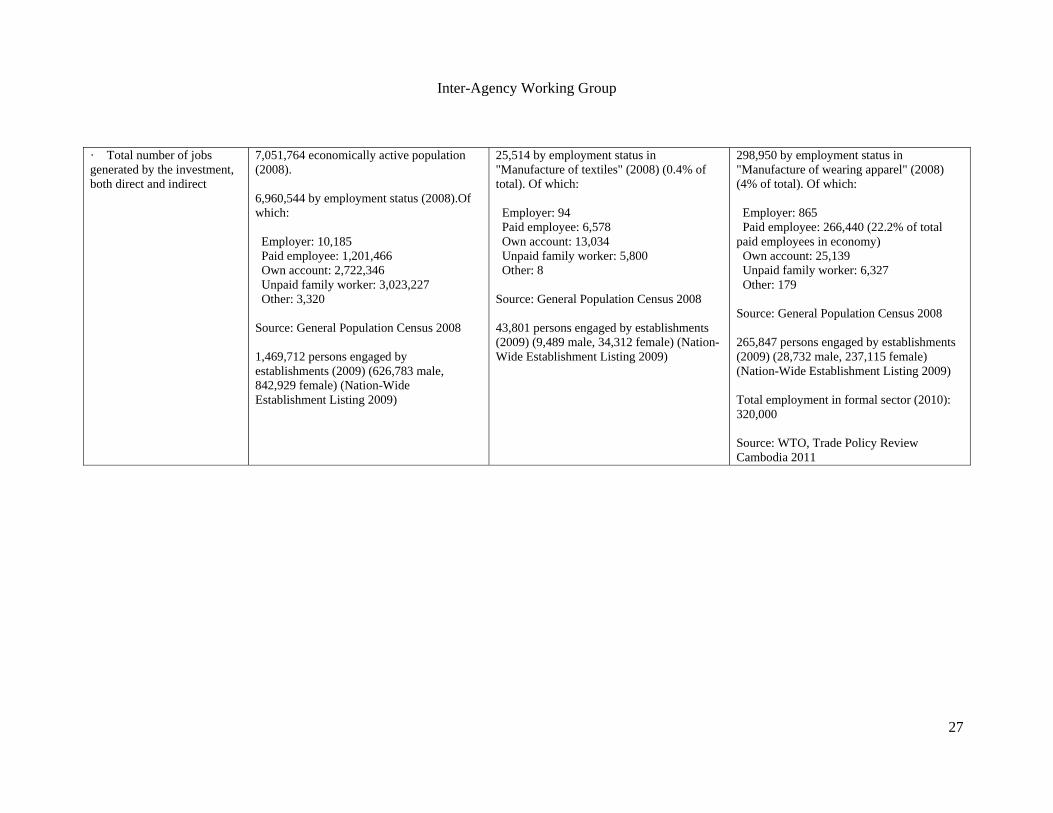
· Total number of jobs generated by the investment, both direct and indirect
7,051,764 economically active population (2008). 6,960,544 by employment status (2008).Of which: Employer: 10,185 Paid employee: 1,201,466 Own account: 2,722,346 Unpaid family worker: 3,023,227 Other: 3,320 Source: General Population Census 2008 1,469,712 persons engaged by establishments (2009) (626,783 male, 842,929 female) (Nation-Wide Establishment Listing 2009)
25,514 by employment status in "Manufacture of textiles" (2008) (0.4% of total). Of which: Employer: 94 Paid employee: 6,578 Own account: 13,034 Unpaid family worker: 5,800 Other: 8 Source: General Population Census 2008 43,801 persons engaged by establishments (2009) (9,489 male, 34,312 female) (Nation-Wide Establishment Listing 2009)
298,950 by employment status in "Manufacture of wearing apparel" (2008) (4% of total). Of which: Employer: 865 Paid employee: 266,440 (22.2% of total paid employees in economy) Own account: 25,139 Unpaid family worker: 6,327 Other: 179 Source: General Population Census 2008 265,847 persons engaged by establishments (2009) (28,732 male, 237,115 female) (Nation-Wide Establishment Listing 2009) Total employment in formal sector (2010): 320,000 Source: WTO, Trade Policy Review Cambodia 2011
Inter-Agency Working Group
28
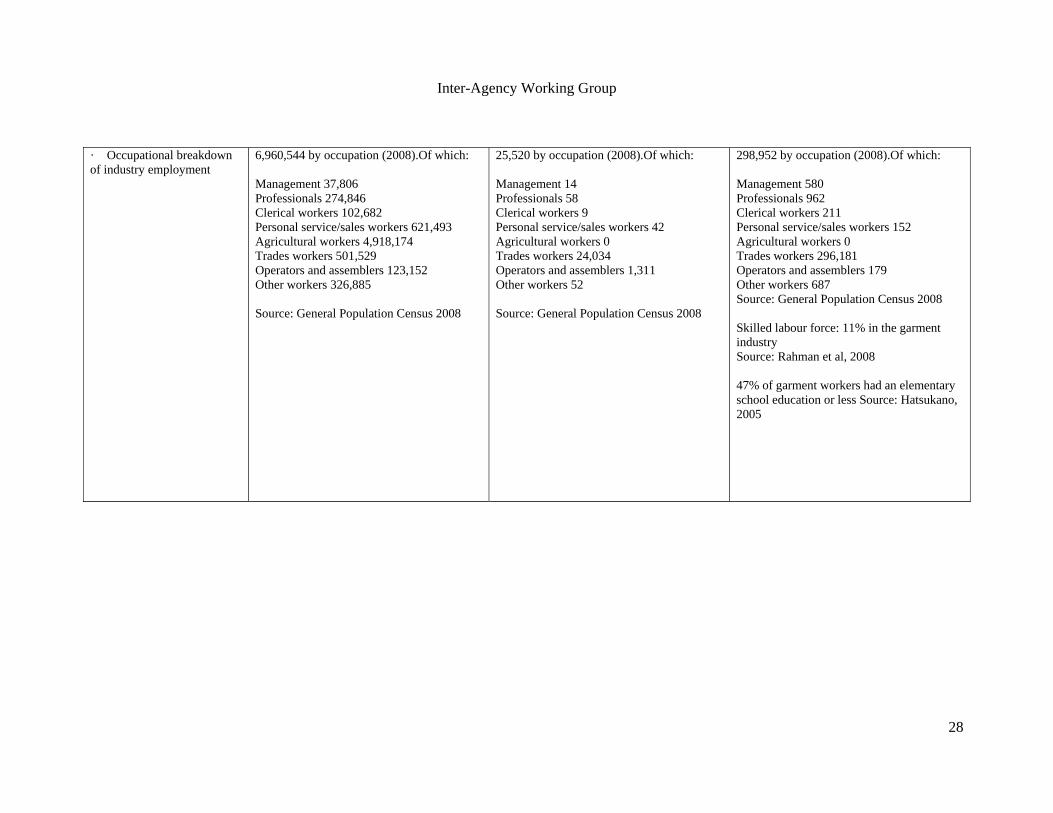
· Occupational breakdown of industry employment
6,960,544 by occupation (2008).Of which: Management 37,806 Professionals 274,846 Clerical workers 102,682 Personal service/sales workers 621,493 Agricultural workers 4,918,174 Trades workers 501,529 Operators and assemblers 123,152 Other workers 326,885 Source: General Population Census 2008
25,520 by occupation (2008).Of which: Management 14 Professionals 58 Clerical workers 9 Personal service/sales workers 42 Agricultural workers 0 Trades workers 24,034 Operators and assemblers 1,311 Other workers 52 Source: General Population Census 2008
298,952 by occupation (2008).Of which: Management 580 Professionals 962 Clerical workers 211 Personal service/sales workers 152 Agricultural workers 0 Trades workers 296,181 Operators and assemblers 179 Other workers 687 Source: General Population Census 2008 Skilled labour force: 11% in the garment industry Source: Rahman et al, 2008 47% of garment workers had an elementary school education or less Source: Hatsukano, 2005
Inter-Agency Working Group
29
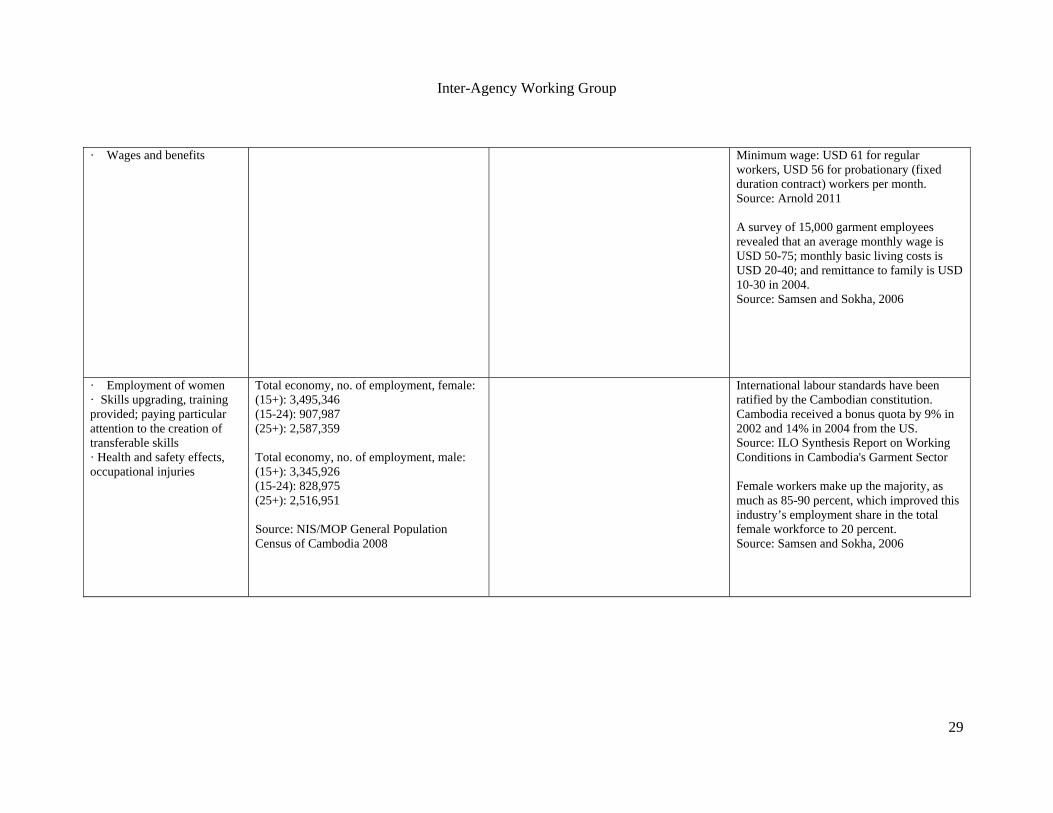
· Wages and benefits Minimum wage: USD 61 for regular workers, USD 56 for probationary (fixed duration contract) workers per month. Source: Arnold 2011 A survey of 15,000 garment employees revealed that an average monthly wage is USD 50-75; monthly basic living costs is USD 20-40; and remittance to family is USD 10-30 in 2004. Source: Samsen and Sokha, 2006
· Employment of women · Skills upgrading, training provided; paying particular attention to the creation of transferable skills · Health and safety effects, occupational injuries
Total economy, no. of employment, female: (15+): 3,495,346 (15-24): 907,987 (25+): 2,587,359 Total economy, no. of employment, male: (15+): 3,345,926 (15-24): 828,975 (25+): 2,516,951 Source: NIS/MOP General Population Census of Cambodia 2008
International labour standards have been ratified by the Cambodian constitution. Cambodia received a bonus quota by 9% in 2002 and 14% in 2004 from the US. Source: ILO Synthesis Report on Working Conditions in Cambodia's Garment Sector Female workers make up the majority, as much as 85-90 percent, which improved this industry’s employment share in the total female workforce to 20 percent. Source: Samsen and Sokha, 2006
Inter-Agency Working Group
30
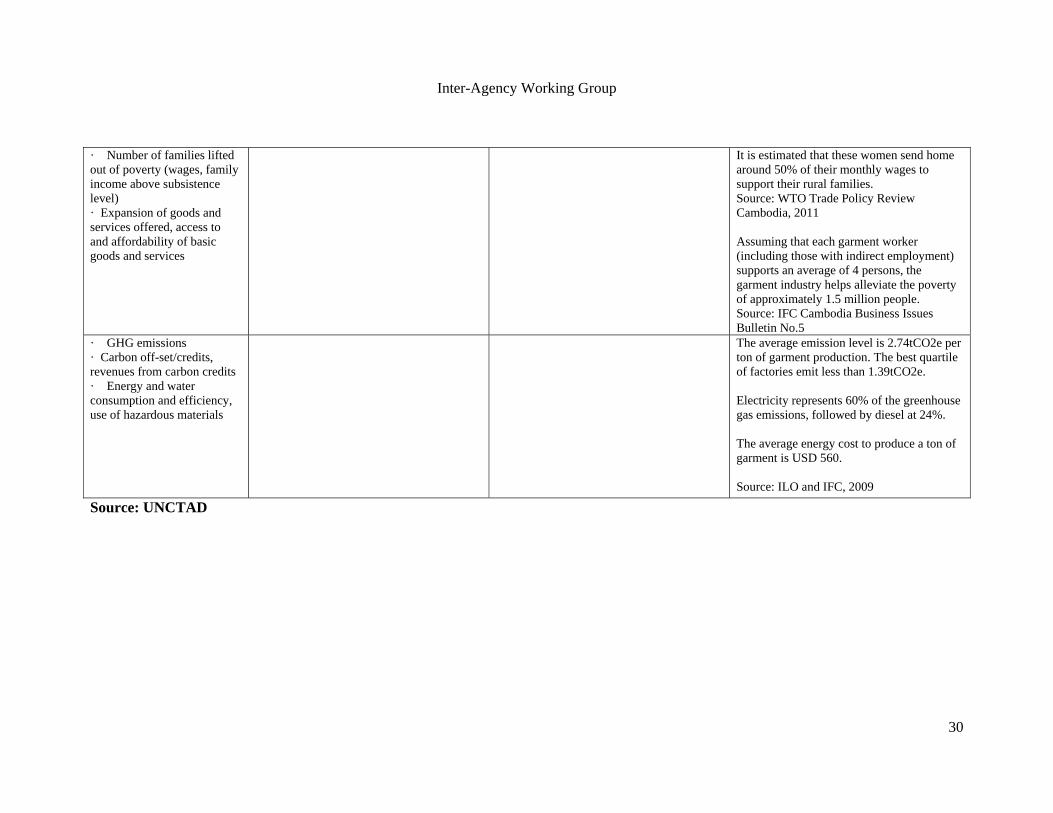
· Number of families lifted out of poverty (wages, family income above subsistence level) · Expansion of goods and services offered, access to and affordability of basic goods and services
It is estimated that these women send home around 50% of their monthly wages to support their rural families. Source: WTO Trade Policy Review Cambodia, 2011 Assuming that each garment worker (including those with indirect employment) supports an average of 4 persons, the garment industry helps alleviate the poverty of approximately 1.5 million people. Source: IFC Cambodia Business Issues Bulletin No.5
· GHG emissions · Carbon off-set/credits, revenues from carbon credits · Energy and water consumption and efficiency, use of hazardous materials
The average emission level is 2.74tCO2e per ton of garment production. The best quartile of factories emit less than 1.39tCO2e. Electricity represents 60% of the greenhouse gas emissions, followed by diesel at 24%. The average energy cost to produce a ton of garment is USD 560. Source: ILO and IFC, 2009
Source: UNCTAD
Inter-Agency Working Group
31
References Arnold, Dennis and Toh Han Shih (2010). "A fair model of globalization? Labour and global production in Cambodia", Journal of Contemporary Asia, Vol. 40, No.3, August, pp.401-424. Asian Development Bank (2011). Key Indicators for Asia and the Pacific, 2011. (ADB: Manila). (www.adb.org/statistics). Asuyama, Yoko and Neou, Seiha (2012). “How Has the Cambodian Garments Industry Evolved?”. In Fukunishi (Eds.), Dynamics of the Garment Industry in Low-Income Countries: Experience of Asia and Africa (Interim Report). Chousakenkyu Houkokusho, IDE- JETRO. Bargawi, Omar (2005). “Cambodia’s Garments Industry: Origins and Future Prospects”. ESAU Working Paper 13, Overseas Development Institute: London Dasgupta, Sukti, Poutiainen, Tuomo and Williams, David (2011). “From Downturn to Recovery: Cambodia’s Garment Sector in Transition”. International Labour Organization Country Office for Thailand, Cambodia and Lao People’s Democratic Republic. ILO:Phnom Penh. Gereffi, Gary and Frederick, Stacey (2010). “The Global Apparel Value Chain, Trade and the Crisis: Challenges and Opportunities for Developing Countries”. Policy Research Paper No. 5281, World Bank, April. FIAS (Foreign Investment Advisory Service) (2004). “Corporate Social Responsibility and the Apparel Sector: Buyer Survey Results”. Report. IFC and World Bank: Washington, DC. Hatsukano, Naomi (2005). “Present Status of Industry in Cambodia:Focusing on Garment Industry”, in Ishida, M (ed.) Regional Development in Mekong. Chiba, the Institute of Developing Economies, JETRO. International Monetary Fund (2012). "Cambodia: 2011 Article IV Consultation". IMF Country Report No.12/46, February. International Monetary Fund (2009). “Cambodia Country Report”. No. 09/48 Statistical Annex, February. International Labour Organization (ILO) (2008). "Cambodian Garments Industry: Challenges and opportunities", Better Factories Cambodia", April. Available at: http://www.betterfactories.org/ILO/aboutIndustry.aspx?Z3&c=1. International Labour Organization (ILO), International Finance Corporation (IFC), Garment Manufacturers Assocation of Cambodia (GMAC) (2009). “Energy Performance in the Cambodia Garments Sector: A Benchmarking Survey”, November.
Inter-Agency Working Group
32
InfoDev study (2008) “The Global Textiles and Garments Industry: The Role of Information and Communication Technologies (ICTs) in Exploiting the Value Chain”. McNamara, Kerry (Ed.), Enlightenment Economics, June. International Finance Corporation (IFC) (2009). “A Better Investment Climate to Sustain Growth in Cambodia”. Second Investment Climate Assessment. International Finance Corporation and World Bank, April. Keane, Jodie and te Velde, Dirk Willem (2008). “The Role of Textiles and Clothing Industries in Growth and Development Strategies”. Investment and Growth Programme, Overseas Development Institute (ODI), May. Nathan Associates Inc. and Werner International (2007). "Factory-level value chain analysis of Cambodia's apparel industry" (http://www.usaid.gov/kh/documents/Cambodia_ValueChain_Garments_Industry_2008.pdf). Neak, Samsen and Yem Sokha (2006). "Trade and Poverty Link: The case of the Cambodian Garments Industry", CUTS International, August. Polaski, Sandra (2009). "Harnessing global force to create decent work in Cambodia", International Institute for Labour Studies, International Labour Organisation: Geneva. Rahman, Mustafizur; Debapriya, Bhattacharya and Khondaker Golam Moazzem eds. (2008) “Bangladesh Apparel Sector in Post MFA Era: A Study on the Ongoing Restructuring Process”, Dhaka; Centre for Policy Dialogue Royal Government of Cambodia. (2009). “National Strategic Development Plan Update 2009-13 for Growth, Employment, Equity and Efficiency to Reach Cambodia Millennium Development Goals” Samsen, Neak and Sokha, Yem (2006). “Trade and Poverty Link: The Case of the Cambodian Garment Industry,” Draft report for comments, August 7, Phnom Penh. Available at: http://www.cuts-citee.org/tdp/pdf/Case_Study-Cambodian_Garment_Industry.pdf. Sophal, Chea (2011). "Historical development of minimum wage in the Cambodia garments industry", Nokor Khmer, 15 August 2011 (http://nokorkhmer.blogspot.com/2011/08/historical-development-of-minimum-wage_15.html). Staritz, Cornelia (2011) “Making the Cut? Low- Income Countries and the Global Clothing Value Chain in a Post-Quota and Post-Crisis World”. World Bank: Washington, DC. United Nations Conference on Trade and Development (UNCTAD) (2011). “Potential Supply Chains in Textiless and Clothing Sector in South Asia: An Exploratory Study” United Nations and Commonwealth Secreteriat: Geneva, Switzerland.
Inter-Agency Working Group
33
U.S. Agency for International Development (USAID) (2007). "Factory-level value chain analysis of Cambodia's apparel industry", September. (http://www.usaid.gov/kh/documents/Cambodia_ValueChain_Garments_Industry_2008.pdf) World Bank (2006). “Cambodia: Poverty Assessment 2006”. Prepared by the World Bank for the Consultative Group Meeting. February. World Bank (2012). “Capturing New Sources of Growth”. East Asia and Pacific Economic Update, May, World Bank: Washington, DC. World Investment Report (2011). Non-equity modes of international production and development. (UNCTAD: Geneva). World Trade Organization (2012). “International Trade Statistics Database”. Available at: http://www.wto.org/english/res_e/statis_e/its2012_e/its12_toc_e.htm World Trade Organization, (2011) "Trade Policy Review: Cambodia, 2011". . Report No. RWT/TPR/G/253, September. Yamagata, Tatsufumi (2006). "The Garments Industry in Cambodia: Its Role in Poverty Reduction Through Export-Oriented Development", Institute of Developing Economies, Discussion Paper No. 62, June.