Embed Size (px)
Citation preview
1
Annual Visible Learning Conference 2017 Making Learning Visible Across the School By B.R. Jones, PhD [email protected]; [email protected] Learning Intentions:
• Evaluate the importance of clear learning intentions and success criteria. • Understand how data can be used to promote collective inquiry and
efficacy. • Compare and contrast the importance of a focus on proficiency and
progress. Success Criteria:
• Be able to share the importance of clear learning intentions and success criteria with a colleague and how one might go about creating these for use in the school.
• Develop a deeper understanding of how data can be used across a school and develop the ability to share some key reasons how, when used effectively, data can help drive improvement across the school.
• Be able to discuss with a colleague – and develop a commitment to – promoting the need for both proficiency and progress for all of a school’s students.
Section I. Let’s Be Clear Activity #1 – Let’s Draw In the space provided, draw a picture of a mushroom.
2
Activity #2 – Let’s Pair Up
• Divide into pairs. • Using an activity or task you previously used (or observed) in class,
determine two (2) possible Learning Intention(s) that were reinforced by the task.
• Create a “child speak” learning intention(s), then the success criterion, and rework until all agree.
• Then match the learning intentions with the learning resources (are they matched, efficient, etc.).
• Be prepared to share your work. The Task or Activity
Learning Intention – First Draft Child Friendly Version Success Criteria – First Draft Final Version: We Are Learning To:
• •
We will know we have learned it if:
• • • • •
3
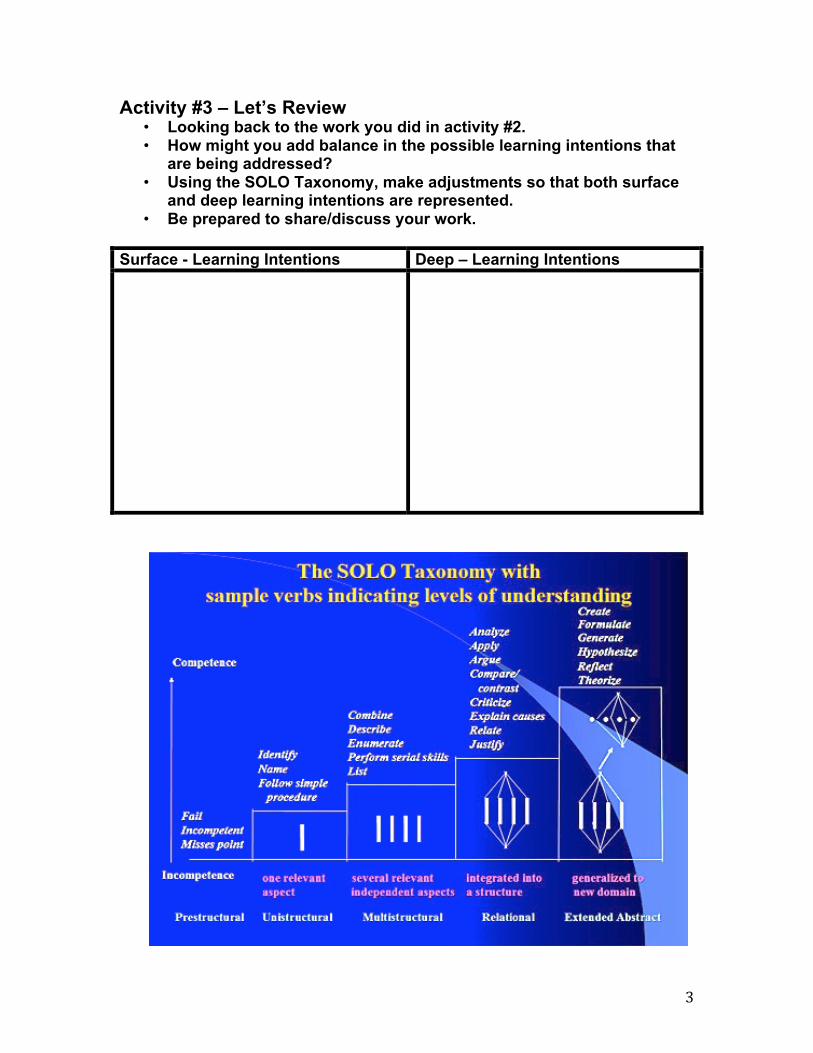
Activity #3 – Let’s Review • Looking back to the work you did in activity #2. • How might you add balance in the possible learning intentions that
are being addressed? • Using the SOLO Taxonomy, make adjustments so that both surface
and deep learning intentions are represented. • Be prepared to share/discuss your work.
Surface - Learning Intentions Deep – Learning Intentions
4
Activity #4 – Partner Ponder (Think, Pair, Share) 1. Presently, on a daily basis, how do students know what they are learning in
your school?
2. What evidence do you use to measure if students’ know what they are learning?
3. What could clarity around what students are learning look like in your school?
5
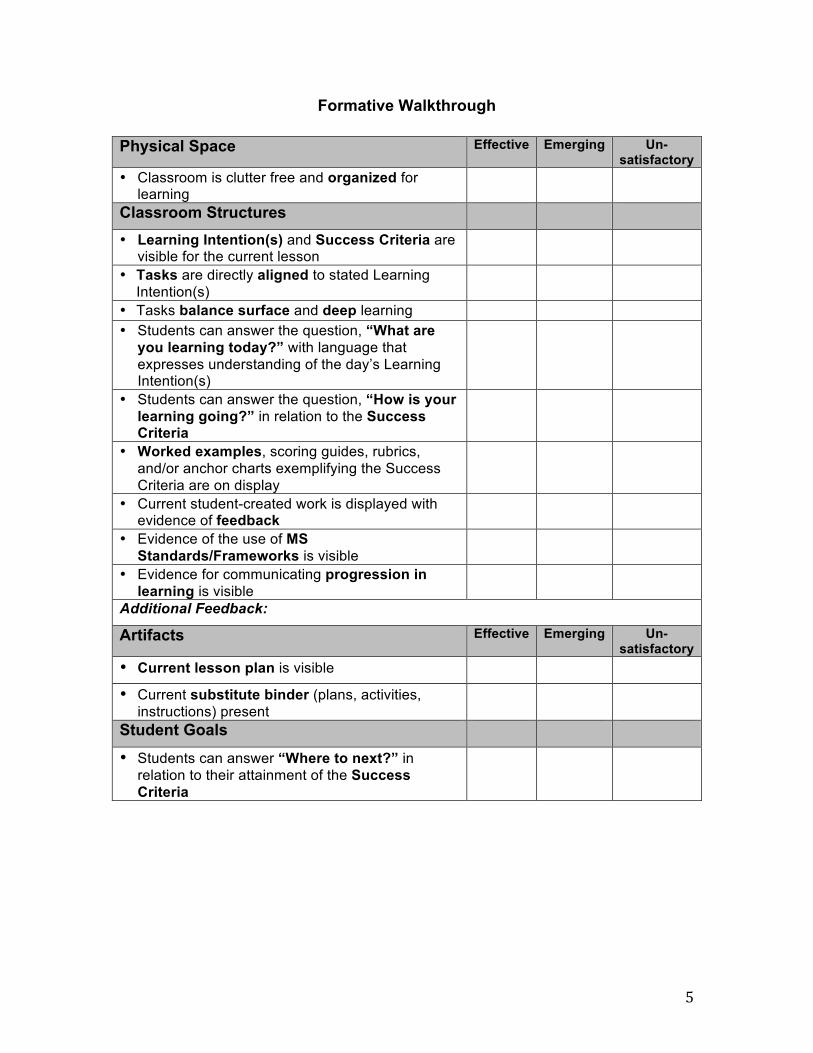
Formative Walkthrough Physical Space Effective Emerging Un-
satisfactory • Classroom is clutter free and organized for
learning
Classroom Structures • Learning Intention(s) and Success Criteria are
visible for the current lesson
• Tasks are directly aligned to stated Learning Intention(s)
• Tasks balance surface and deep learning
• Students can answer the question, “What are you learning today?” with language that expresses understanding of the day’s Learning Intention(s)
• Students can answer the question, “How is your learning going?” in relation to the Success Criteria
• Worked examples, scoring guides, rubrics, and/or anchor charts exemplifying the Success Criteria are on display
• Current student-created work is displayed with evidence of feedback
• Evidence of the use of MS Standards/Frameworks is visible
• Evidence for communicating progression in learning is visible
Additional Feedback: Artifacts Effective Emerging Un-
satisfactory • Current lesson plan is visible
• Current substitute binder (plans, activities, instructions) present
Student Goals • Students can answer “Where to next?” in
relation to their attainment of the Success Criteria
6
SECTIONAL REFLECTIONAL
Understandings for Practice in Your Setting
Directions: Looking back at what you learned in Section One, what are the one or two most significant understandings you gained? Please take a few moments and supply—in the space below—these key understandings.
My Section One Understandings
SECTIONAL REFLECTIONAL
Implications for Practice in Your Setting
Directions: As you reflect on what you learned from Section One, what do you think will specifically apply to your setting? Please take a few moments and supply—in the space below—any key implications for your practice.
My Section One Implications
7
Section II. Why PLC? Steps for Creating a Successful Learning Environment:
1. Categorize the content standards. Within the content frameworks, or pacing guide if one exists, identify which standards are “critical”, “important”, and “nice to know.” No more than 50% of standards should be identified as “critical” and not more than 20% as “important.” A red-light scheme can be helpful with red signifying “critical”, yellow “important”, and green the “nice to know” standards.
2. Vertically align 7-12 the “critical” standards for all content areas. Determine if there are gaps, overlaps, or omissions. What do we commit to all students having mastered when they exit the grade?
3. Create a Curriculum Map or Long-term Plan. Once standards are categorized, place them in an order that makes instructional sense. These units of standards normally last 3-4 ½ weeks. Make sure to place the “critical” and “important” standards in more than one unit to facilitate mastery. Also, any one unit should not contain more than 3 or so “critical” standards.
4. From the long-term plan, create a syllabus (short-term plan) for the course. This can help serve as an advance organizer. This should also guide the weekly plan.
5. Develop a system for formatively assessing the most critical skills as you teach to guide discussions in the PLCs. Ideally this scheme will help PLCs identify students that are “at mastery”, “close to mastery”, and “far below.” Thus specific strategies can be developed based on the needs of these three different groups of students. These decisions can be based on adjustments planned by the following types of formative assessment:
a. Pre-/Post- b. Near future c. In the moment
6. Create the Learning Intentions and Success Criteria that will guide the learning for students. Decide on the best activities, tasks, and strategies for teaching the Learning Intentions.
7. Clearly define for students what the Success Criteria are for the specific intended Learning Intentions. Utilize the Learning Intentions and Success Criteria to promote self- and peer-assessment, as well as high quality instructional feedback.
8. Continue to formatively assess the most critical skills as you teach to guide discussions in the PLCs. Ideally this scheme will help PLCs identify students that are “at mastery”, “close to mastery”, and “far below.” Thus specific strategies can be developed based on the needs of these three different groups of students. These decisions can be based on adjustments planned by the following types of formative assessment:
a. Pre-/Post- b. Near future c. In the moment
9. Develop a common assessment for summatively assessing the success of the teaching. Ideally, there is a “buffer” of a day or two between the Post-assessment so that students can be remediated on those skills that they are yet to be proficient on and those students already at mastery can be accelerated to content at a higher level.
10. All teachers and students should be able to answer 3 questions: Where am I going? How am I going? Where to next?
8
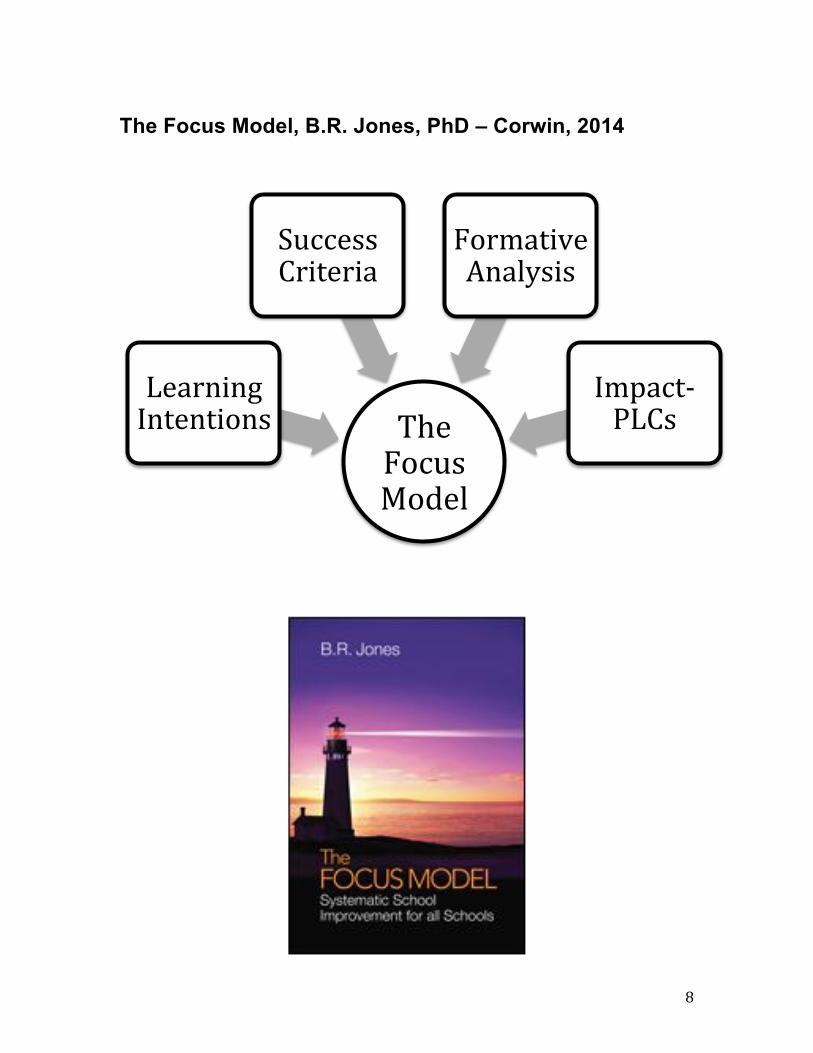
The Focus Model, B.R. Jones, PhD – Corwin, 2014
TheFocusModel
LearningIntentions
SuccessCriteria
FormativeAnalysis
Impact-PLCs
9
Activity #5 – Think, Pair, Share 1. Presently, how do the teachers in your school ‘know their impact’?
2. How might teachers and/or students use formative assessment data in your
school to improve learning?
3. What questions guide the learning in your school’s professional
conversations?
10
SECTIONAL REFLECTIONAL Understandings for Practice in Your Setting
Directions: Looking back at what you learned in Section Two, what are the one or two most significant understandings you gained? Please take a few moments and supply—in the space below—these key understandings.
My Section Two Understandings
SECTIONAL REFLECTIONAL
Implications for Practice in Your Setting
Directions: As you reflect on what you learned from Section Two, what do you think will specifically apply to your setting? Please take a few moments and supply—in the space below—any key implications for your practice.
My Section Two Implications
11
Activity #6 – Definitional Decisiveness
Describe in Your Own Words What “Achievement” and “Progress” Means:
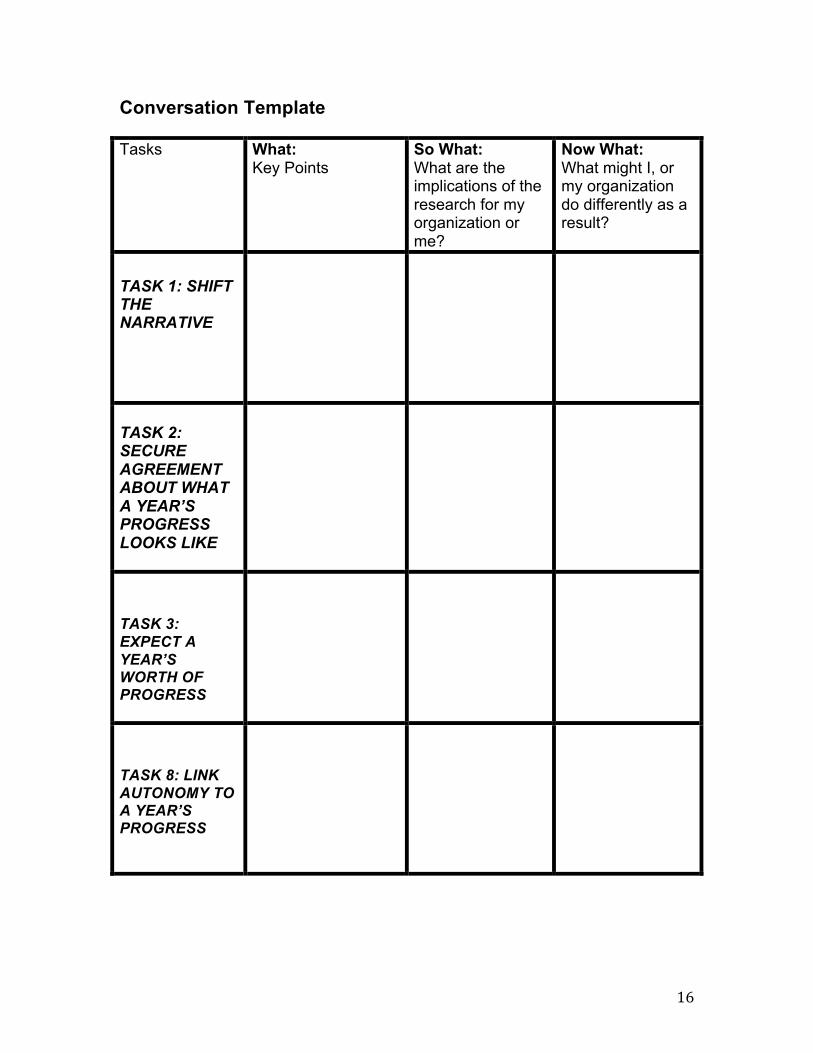
Activity #7 – Tantalizing Tasks to Take Progress More Seriously Jigsaw – Meet with four new colleagues whom you have not spoken to if possible. Divide the four tasks on pages 11 – 15 amongst you. Each take a task and complete the Conversation Template on page 16 for the task they have individually. Once all have finished analyzing their task, each group member will take time to share the key points and implications they took away from their reading.
TASK 1: SHIFT THE NARRATIVE
From ‘fixing the teacher’ to collaborative expertise The current debate is very much focused on the ‘teacher’, but such an approach places too much responsibility on one person. It falsely implies that if only we can ‘fix the teacher’, all will be well; it ignores the many other influences and conditions of success outside the control of the individual teacher. There is no way that a system will make an overall difference to student achievement by working one teacher at a time.
Instead, the onus needs to be on everyone working collectively to improve student achievement: the teachers, the school leaders, the other adults in the schools (such as teaching aides), the parents (and voters), the policy-makers and the students.
From standards and achievement to progression Perhaps most urgent is the need to reframe the narrative away from standards and achievement and to move it towards progression. This is not to say that high achievement and high standards are not desired, but the way to get there is through a narrative focused on progress. Many Western countries have an obsession with ‘value added’, and this is a powerful and worthwhile statistical method aimed to
12
evaluate progress. There are many value-added models, and they should be used as part of the arsenal to measure progress. However, too often they are used to make causal claims, to make claims related to one source such as ‘a teacher’ and are not triangulated with other evidence of progress. There are many other ways for teachers and school leaders to document progress in learning; and there are many other critical outcomes besides the usual academic measures that matter. As I argued in my previous paper, the measure of progress needs to be framed as ‘at least a year’s growth for a year’s input’ or ‘every child deserves at least a year’s growth for a year’s input’. Let’s move to the other tasks at hand… TASK 2: SECURE AGREEMENT ABOUT WHAT A YEAR’S PROGRESS LOOKS LIKE There needs to be debate and agreement among educators about what a year’s progress looks like. It may be easier in some subjects than others. For example, when I analyze many countries’ national or standardized tests in reading and numeracy, the typical growth effect-size per year is about 0.40 (higher in earlier years and lower in high schools). This average of 0.40 can be used, among other indicators, as an expected level of growth per year – with the usual cautions about context. So, in this sense, we can begin to know what an average year’s progress should look like. In subjects such as arts, music and physical education (where there is a history of fewer standardized measures calibrated over time), it is worth conducting standards-setting sessions with teachers as this can lead to decisions about expected yearly growth. For example, teachers could be asked to bring two anonymous pieces of student work showing growth over three-plus months. They would then be asked to place the work along a curriculum-year line and have a robust discussion about progression based on the teachers’ judgments of growth and whether this progress is sufficient. This can lead to healthy debates about ‘what it means to be good at –’ and the development of a common conception of progress among teachers. Indeed, this development of a common conception of progress is the key to accelerating progress. When teachers have different conceptions or expectations about what ‘challenge’ in the curriculum means, this can have a profound negative impact on students. If, for example, a teacher of a Year 6 class has a lower expectation of progress than a Year 5 teacher, it is highly likely that the students in the Year 6 class will not advance as much as in the Year 5 class – contributing to the lack of progress.
One of the major advantages of benefiting from the collective wisdom of all teachers and school leaders in and across schools is that this can reduce the
13
variability in teachers’ understanding of challenge and progression for students. For example, New Zealand secondary-school teachers were thrust into a major dilemma when the high-stakes examination system was dramatically changed. It took some years of disasters before appropriate moderation was introduced, with worked examples for all units of work (and a description of why a piece of work was rated Excellent rather than Merit, Merit rather than Achieved, and so on).
Now, despite the remarkable diversity across the country, it is possible to go into any secondary school in New Zealand and there is confidence in the comparability of how teachers evaluate challenge and progress – and there has been a steady increase in the percentage of students attaining the qualification. This is a major credit to teachers’, school leaders’ and system professionalism and their commitment to work together to resolve an important issue.
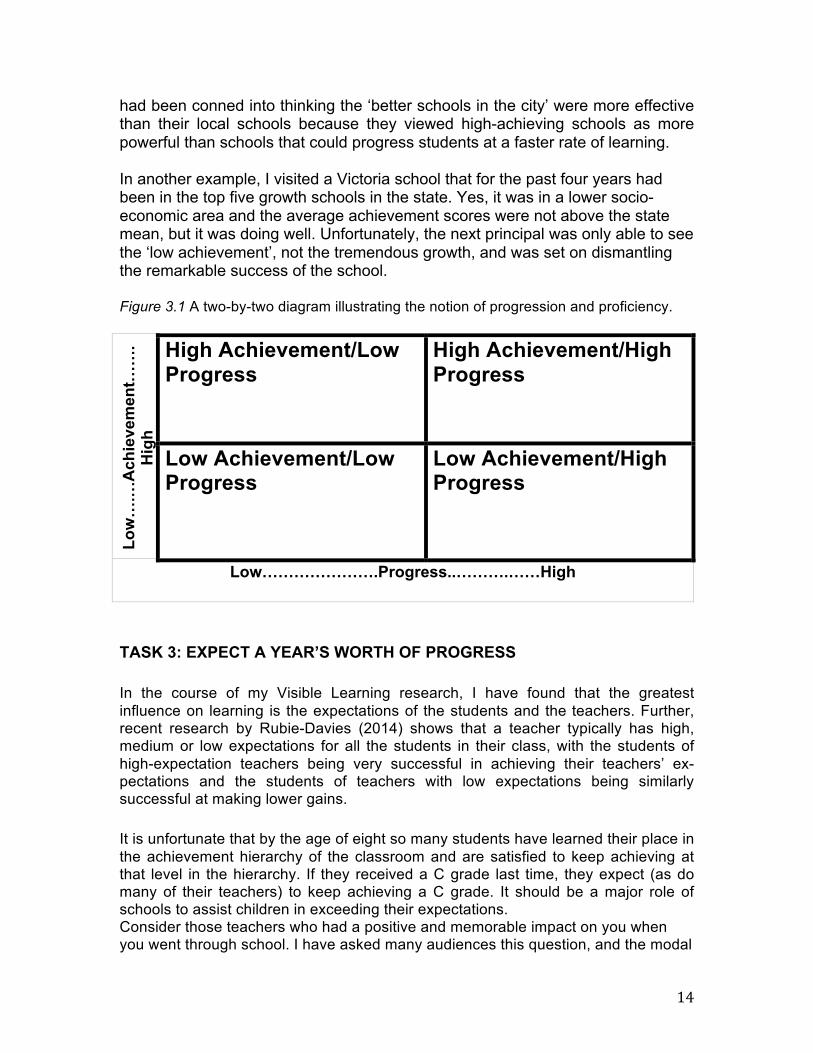
In the past few years, New Zealand has undertaken a similar shake-up in the primary-school years. The premise of the system is that the day-to-day decisions teachers make in their judgments about performance are the critical unit of interest. Teachers are asked to account for their ‘overall teacher judgments’ in the major domains – if they rely solely on tests, they fail; if they use no tests they fail – they must defend their day-to-day judgments about the interpretation of the meaning and consequences of evidence from multiple sources. The data show the remarkable inconsistency in these judgments. New Zealand now faces a decision: blame the data, hide it and go back to personal and unique judgments, or do the same as was done in the secondary schools and introduce moderation, worked examples and collaboration to decide what it means to progress across different levels of the curriculum. Figure 3.1 is one way to illustrate the importance of the progression notion. The y-axis depicts achievement, and the line in the middle is some agreed benchmark of achievement (e.g., at or above standard). The x-axis depicts progress, and the line in the middle is some agreed benchmark of progress (e.g., effect-size of .40, average within the school). Schools (and classes, and students) can then be placed into one of these quadrants. For example, across all secondary schools in Victoria (Australia), 27 per cent are cruising (high achievement but limited progress), 10 per cent are growing (high progress but limited achievement), 18 per cent are low progress and low achievement, and 45 per cent are in the optimal zone (more than average achievement and more than a year’s growth for a year’s input).
Students can be located on the same grid. This shows why a one-policy-fits-all approach is unlikely to work: schools, teachers and students in each cell are likely to have different trajectories to move into the optimal zone. In one jurisdiction where I analyzed all their school onto this matrix, it was discovered that the city schools where most country parents sent their children to board were in the ‘cruising’ zone, whereas their local schools were ‘growth’ schools. Parents
14
had been conned into thinking the ‘better schools in the city’ were more effective than their local schools because they viewed high-achieving schools as more powerful than schools that could progress students at a faster rate of learning. In another example, I visited a Victoria school that for the past four years had been in the top five growth schools in the state. Yes, it was in a lower socio-economic area and the average achievement scores were not above the state mean, but it was doing well. Unfortunately, the next principal was only able to see the ‘low achievement’, not the tremendous growth, and was set on dismantling the remarkable success of the school. Figure 3.1 A two-by-two diagram illustrating the notion of progression and proficiency.
Low…
.…A
chie
vem
ent……
.H
igh
High Achievement/Low Progress
High Achievement/High Progress
Low Achievement/Low Progress
Low Achievement/High Progress
Low………………….Progress..……….……High
TASK 3: EXPECT A YEAR’S WORTH OF PROGRESS
In the course of my Visible Learning research, I have found that the greatest influence on learning is the expectations of the students and the teachers. Further, recent research by Rubie-Davies (2014) shows that a teacher typically has high, medium or low expectations for all the students in their class, with the students of high-expectation teachers being very successful in achieving their teachers’ ex-pectations and the students of teachers with low expectations being similarly successful at making lower gains.
It is unfortunate that by the age of eight so many students have learned their place in the achievement hierarchy of the classroom and are satisfied to keep achieving at that level in the hierarchy. If they received a C grade last time, they expect (as do many of their teachers) to keep achieving a C grade. It should be a major role of schools to assist children in exceeding their expectations. Consider those teachers who had a positive and memorable impact on you when you went through school. I have asked many audiences this question, and the modal
15
answer is about two (and you had about forty to fifty through primary and secondary school, so this low number should bother our profession). Now, why did those two have such an impact? Typically it is because they wanted to turn you on to their passion (whether it was literature, math or music), and, through this passion, they saw something in you that you may not have seen in yourself. Through them you were able to learn and go beyond what you thought you could achieve. These teachers help us raise and exceed our expectations, which helps turn us on to learning.
TASK 8: LINK AUTONOMY TO A YEAR’S PROGRESS
It is a myth that all teachers are equal in their impact on student learning: every student knows this, every parent knows this, and every teacher knows this. But so much of our policy development, our rhetoric and our school discussions are based on this myth. The key is to challenge the myth without causing a negative backlash, to promote a profession that can grow in expertise and to capture the high ground of teaching as a profession that demands expertise.
Where teachers are enabling all students to gain at least a year’s growth for a year’s input, they should be given some autonomy, which they have earned. While there should never be freedom to teach ‘how you wish’ (any more than there is freedom to do surgery in any way you wish), such high-impact teachers should be studied to understand why they are so effective. My Visible Learning research has shown that such teachers have particular mindsets that are worth understanding and spreading.
But if there is less than a year’s growth, we need to question the autonomy these teachers have. Here is where the collective wisdom of the best in the school and community of schools needs to be used, where professional learning based on the understanding of effectiveness needs to be delivered, where adherence to best-available-impact evidence is to be used, where evidence-based curriculum progression maps are needed, and where quality evaluation of teacher effectiveness needs to be promoted and used. Yes, the essence of many teachers’ sense of professionalism is their autonomy to teach as they wish. But they do not have a right to such autonomy if they are not systematically teaching in a manner where the majority of their students gain at least a year’s progress for a year’s input.
The intention is not to create a binary system where some teachers can do whatever they want and others have little or no autonomy. Instead it is to create a system where leaders know their high-impact teachers so that they may create a coalition of the successful who can work together on reducing within-school variability. Further, the implication is not that we should identify teachers who are producing less than a year’s growth for their students and fire them, or identify the bottom 10 per cent and fire them (if such a policy were successful there would still be a bottom 10 per cent). Rather, we need to recognize effectiveness among teachers and build a profession that allows all to join the successful.
16
Conversation Template Tasks What:
Key Points So What: What are the implications of the research for my organization or me?
Now What: What might I, or my organization do differently as a result?
TASK 1: SHIFT THE NARRATIVE
TASK 2: SECURE AGREEMENT ABOUT WHAT A YEAR’S PROGRESS LOOKS LIKE
TASK 3: EXPECT A YEAR’S WORTH OF PROGRESS
TASK 8: LINK AUTONOMY TO A YEAR’S PROGRESS
17
SECTIONAL REFLECTIONAL
Understandings for Practice in Your Setting
Directions: Looking back at what you learned in Section Three, what are the one or two most significant understandings you gained? Please take a few moments and supply—in the space below—these key understandings.
My Section Three Understandings
SECTIONAL REFLECTIONAL
Implications for Practice in Your Setting
Directions: As you reflect on what you learned from Section Three, what do you think will specifically apply to your setting? Please take a few moments and supply—in the space below—any key implications for your practice.
My Section Three Implications
18
Bibliography
Biggs, J.B., and Collis, K.F. (1982) Evaluating the Quality of Learning-the SOLO Taxonomy (1st ed.) New York: Academic Press.
Hattie, J. (2015) What works best in education: The politics of collabo-
rative expertise, London: Pearson. Hattie, J. (2012). Visible learning for teachers: Maximizing impact on
learning. London: Routledge.
Jones, B.R. (2014). The Focus Model: Systematic school improvement for all schools. Thousand Oaks, CA: Corwin Press.
Popham, W.J. (2008). Transformative Assessment. Alexandria, VA:
ACSD.