Embed Size (px)
Citation preview

I-1
SECTION –I
INTRODUCTION
1.0 Introduction
1.1 General:
Chikan Dam is a medium earth fill dam as its height is 27.0 m and it is being
proposed across the local stream known as Chikan-Ki-Khol, which is located in the
village Chikan and Dam is named after village Chikan. The Chikan-Ki-Khol
originates from the local mountains and joins Pathrala Nadi downstream and meets
Somb Nadi near Dadupur and out falls in the main River Yamuna.
The project area is situated 24 km away from sub- divisional headquarter of
Bilaspur and 40 km away from district headquarter Yamunanagar.
Chikan Dam is a multipurpose Storage Dam having the potential for storage of
water and to regulate the peak flow thus thereby it shall directly serve as live
storage for irrigation, improving ground water table and prevent damages caused by
floods. Chikan Dam shall store water during monsoon period and then controlled
water will be released for irrigation purpose. Dams provide a range of economic,
environmental, and social benefits, including generation of employment, recreation,
fish farming and wild life habitat. Dams also help to prevent the soil erosion, loss of
life and property caused by flooding. The water shall be taken to the fields for
irrigation through RCC pressure pipes of P-1 class.
The Scope of the work shall include:
Feasibility report for availability of water, possibility of construction of Chikan Dam
and its distribution system for supply of irrigation water for irrigation of the fields.
SELECTION OF THE DAM SITE
Dam site is selected so that it should have maximum storage at minimum height so
that it is economical and abadi upstream is least disturbed and maximum benefits to
people living in watershed zone. It should also have firm embankments. Firmness of

I-2
embankments hills on both sides, geology of local area along of the axis of the dam
and dam axis have been examined by Geologist whose report is placed at
Annexure D. After detailed ground topographical survey and geologist report the
site of the Chikan Dam axis has been selected. The catchment area of the Dam is
3.79 sq. km. In the absence of the gauge discharge and the rainfall/runoff
observations at site, discharge observations made at Dadupur has been simulated
with the Chikan area and adopted for calculation of availability of water from the
Chikan dam. Rain Guage Station at Paonta Sahib and Tajewala has been used to
know the precipitation of the area.
1.2 Availability of Water:
1.2.1 Rainfall and Availability of Rainfall Data:
The catchment area of Chikan-Ki-Khol upto the proposed Chikan Dam is about 3.79
Sq. Km. Catchment area is shown at Fig. 2.1 it is a small catchment area, so rainfall
over the catchment area does not vary much. Bulk of the total annual rainfall occurs
during the four months of June, July, August and September. Physiographically the
project area is part of regional topography of Shiwalik formed by the projecting NW-
SE trending strike ridges of sandstone alternating with eroded softer sediments
(siltstone, clay stone etc...) Geologically, the area comprises the sub- mountainous
zone where lower Shiwalik are exposed in the shape of low hills. Based on the
topography and geomorphology, this region is grouped as moderately dissected
region.
As per the Thiesson Polygon given at Fig. 2.1, about 65.96% catchment area of the
proposed Chikan Dam lies in the polygon of Tajewala whereas about 34.04% lie in
the polygon of Paonta Sahib. In this way, averaged daily rainfall data has been
evaluated for the project catchment area and the same is given in table No. 2.2 to 2.9
and the abstract so prepared is given in table No. 2.10.
1.2.2 Evaluation of average daily and 10 daily rainfall data for the Project area:-
As per the Thiesson Polygon given at Fig. 2.1, about 65.96 % catchment area of the
proposed Chikan Dam lies in the polygon of Tajewala whereas about 30.04% lie in
the polygon of Paonta Sahib. In this way, average daily rainfall data has been

I-3
evaluated for the project catchment area and the same is given in table No. 2.2 to
2.9. These tables also show ten daily total of the average rainfall for the project
catchment area. Abstract of 10 daily rainfall for the project catchment area has been
prepared by referring to table Nos. 2.2 to 2.9 and the abstract so prepared is given
in table No. 2.10. Average and dependable monsoon rainfall have been worked in
Section-II, and the abstract is given as under:-
Sr. No. Dependability / Average Rainfall in (mm)
1 Average 1204.7
2 50% dependability 1177
3 67% dependability 1019
4 75% dependability 929
5 90% dependability 711
Dependable rainfall on ten daily basis has also been worked out for the catchment
area at 50%, 67%, 75% and 90% dependability and the results are given at table
No. 2.12.
1.2.3 Evaluation of 24 hour maximum point rainfall for various Return Periods and
SPS data:-
(a) Evaluation of 24 hour maximum point rainfall of various return periods from the
available 24 hour maximum rainfall data:-
One day annual maximum rainfall data for the Tajewala and Paonta Sahib RGS is
available for 45 years (from 1972 to 2016) and 55 years (from 1962 to 2016)
respectively. By applying Gumbel’s method to this available annual one day
maximum rainfall data, any 24 hour maximum point rainfall for the Tajewala RGS
project catchment area for 25 year, 50 year and 100 year return periods work out as
381 mm, 434 mm, and 486 mm respectively (Table No. 2.15) while for the Paonta
Sahib RGS project catchment area for 25 year, 50 year and 100 year return periods
work out as 322 mm, 363 mm, and 404 mm respectively (Table No. 2.17).
As already stated, polygon of Tajewala include about 65.96 % of the catchment
area while polygon of Paonta Sahib include about 34.04% of the catchment. Thus

I-4
using these percentages and using results of various return periods for the any 24
hour maximum point rainfall figures of Tajewala and Paonta Sahib, maximum point
rainfall figures have been evaluated for the whole catchment area of Chikan Dam
for 25 year, 50 year and 100 year return periods worked out as 361 mm, 410 mm
and 459 mm respectively and given at Table No. 2.18.
(b) Standard Project Storm (SPS): On specific consultancy, India Meteorological
Department (IMD) had proposed Standard Project Storm (SPS) figures for the
Ghaggar Basin in the year 1995, the copy of which is enclosed in section-II as
Annexure –C. As per this IMD report, SPS for any 24 hour has been worked out as
546 mm as areal storm rainfall. This has also given factors of 0.340, 0.40, 0.550
and 0.770 to convert any 24 hour areal SPS of 546 mm to convert SPS for 2 hour, 3
hour, 6 hour and 12 hour storm durations respectively.
1.2.4 Run off:-
(i) Run off Availability of run-off data for Somb and Pathrala Nadies at Dadupur:-
Neither there is any gauge discharge site at Dadupur to measure the inflows from
Somb and Pathrala to the Dadupur Pond. However, discharge released from
Dadupur pond into lower Somb (QLS) and discharge released to WJC (MLL) and
Shahbad Nalvi Feeder (QMLL) is measured at Dadupur. Discharge coming to the
Dadupur Pond via WJC (MLU) and HPGCL Hydel Channel is also not measured at
their outfall points to the Dadupur Pond. Discharge is only measured at HKB at the
WJC Link Channel (WJCLC) head ((QMLU). There are four off takes from WJCL and
WJC (MLU) out of which discharge for three is measured which are Jaidhary
distributors (QJD), Ditch channel (QDC) and silt ejector at RD 700 m of WJCLC (QSE).
However, the fourth off take, ie HPGCL Hydel Channel off takes from RD 900 m of
WJCLC and outfalls in to Dadupur pond without any consumptive use. Therefore,
discharge data from this Hydel channel is not considered necessary.
About 26 Sq. KM catchment area directly drains in to WJCLC and WJC(MLU) and
water from this additional catchment area also reach Dadupur. Thus, total

I-5
catchment area draining in to Dadupur pond workout to be 509 Sq. Km (483+26 =
509 sq. km.).
There are 13% losses from the WJC system from HKB to Munak head as has
already been agreed by the partner states and Central Water Commission (CWC).
Based on this, losses in WJCLC / WJC MLU/Hydel Channel proportionally work out
to be 2.27%. However, there are substantial losses in the Dadupur pond, therefore,
3.0% losses have been considered appropriate.
In view of above, inflow outflow equation at Dadupur for 509.05 sq. km catchment
area, i.e through Somb, Pathrala and the inlets to WJCLC/WJC (MLU) (QSp) is
given as under:
QSP + 0.97 (QMLU – QJD – QDC – QSE) = QMLL + QLS
Or, QSP = QMLL + QLS – 0.97 (QMLU – QJD – QDC –QSE) -----------A
Twenty one years (1996 to 2016) discharge data for June to September months
each year) for the variables on the right side of equation (A) above has been
provided by Executive Engineer Water Services Div., Jagadhri by getting it copied
from the records of Xen WS Div. Dadupur. The above procedure to workout
discharge reaching Dadupur from Somb, Pathrala and from inlets to
WJCLC/WJC(MLU) (totaling catchment area to 509.0 sq. km.) has been agreed by
HIWRD in a meeting dated 06-09-2016 held in the office room of Xen WS Div.
Dadupur which was attended by Executive Engineer WS Div. Jagadhri, Executive
Engineer WS Div. Dadupur and Experts from WAPCOS, the Minutes of which have
been issued by Executive Engineer WS Div., Jagadhri vide his office no. 7583-
89/2G Dated 06-09-2018. Average daily discharge reaching Dadupur through
Somb, Pathrala and from inlets to WJCLC/WJC (MLU) has accordingly been
worked out using equation at ‘A’ above for 21 years (1996 to 2016) for four
monsoon months (June, July, August and September) of each year and has been
tabulated in table 2.19 to 2.23) and by referring to table at Sr. No. 2.19 to 2.23,
abstract of ten daily discharge data in cusecs days reaching Dadupur from Somb,

I-6
Pathrala Nadies and from inlets to WJCLC / WJC(MLU) has been prepared and the
same is enclosed herewith as table 2.24.
Catchment area up to the proposed dam site is 3.79 sq. km. and the catchment
area of the Somb and Pathrala Nadies and the said inlets to WJCLC/MJC (MLL) up
to Dadupur is 509.0 sq. km. Thus each figure of the average ten daily discharge
shown in table No. 2.24 when multiplied with 3.79/ 509 will give ten daily discharge
data for the proposed Chikan Dam site and values are given at Table No. 2.25.
(ii) Evaluation of run-off data on ten daily basis at the proposed Chikan Dam site
(a) Evaluation of runoff data on ten daily bases for the dam site. (June to
September):-
Ten daily totals of average discharge data of Somb and Pathrala Nadies and inlets
to WJCLC/WJC (MLU) reaching Dadupur as given in table No. 2.19 to 2.23 have
been abstracted in table No. 2.24. All these figures of ten daily discharges given in
table No. 2.25 have further been multiplied with factor [3.79/509] and the results so
obtained have been tabulated in table No. 2.26 which give run off data on ten daily
basis for the proposed Chikan Dam site.
1.2.5 Dependable and average run off during filling period (June to Sept.) at the
Chikan Dam site.
1.2.5.1 Calculations for run off rainfall ratios on monthly basis and modification of
monthly runoff figures by restricting run off rainfall ratios to 0.60:
Runoff rainfall relationship has been derived at sub section 2.5.4. By using this
relationship, runoff rainfall ratios have been calculated in table 2.26 in its row (4) for
which necessary input of monthly rainfall and monthly run off data has been taken
from table no. 2.2 to 2.9 and table No. 2.25 respectively. Out of the 84 months,
runoff rainfall ratio for 40 months is higher than 0.60 and the same has been
restricted to 0.60 in row (4) of table 2.26. Runoff for these 40 months has been
modified accordingly whereas the runoff for other 44 months has been kept the
same as given in table 2.25 and also reproduced in row (2) of table 2.26.Final

I-7
runoffs so arrived at for all the 84 months have been given in row (6) of table 2.26.
Row(7) of table 2.26 shows four months added up runoffs (to be called filling period
total runoff) by using data in row (6) of the said table. Row (8) of this table allots
serial nos to the filling period total runoffs as given in row (7) of the said table when
arranged in descending order.
1.2.5.2 Calculations for dependable and average runoff for the filling period (June to
September) at the Chikan Dam site.
By using descending orders of the filling period runoff data for 21 years (1996 to
2016) as given in row (8) of table no. 2.26 and by using filling period (monsoon
period) runoff data in row (7) of the said table, dependability and average runoff
calculations have been carried out at sub section 2.5.5 which give the following
results.
Dependability Runoff in Cs days Runoff in ha-m Corresponding runoff rainfall ratios
50% 864 211.3 0.474 67% 565.52 138.3 0.358 75% 452 110.6 0.314 90% 335.6 82.1 0.305
Average 856 209.3 0.459
1.2.5.3. Estimated daily runoff data at the Chikan Dam Site:-
Each figure of daily runoff data reaching Dadupur from 509 Sq Km catchment area
and tabulated in table 2.19 to 2.23 (as described in Section II) has been multiplied
with CMF (combined multiplying factor) to derive corresponding daily discharge data
of the four monsoon months for the period 1986 to 2016 and the same is given from
table 2.28 to table 2.32.

I-8
1.2.6 Flood Forecasting:-
For construction of Storage Dam on any river, flood forecasting is very essential.
This is used for fixing capacity of the spillway structure and also free board of the
structure and its embankments.
1.2.6.1 Various flood forecasting methods: -
IS: 5477(Part-IV), 1971 provide following methods for flood forecasting and for
estimation of design flood:-
a) Application of suitable factor of safety to maximum observed flood;
b) Empirical flood formulae;
c) Envelope curves;
d) Frequency analysis and
e) Rational method of derivation of design flood from storm studies and application of
unit hydrograph principle.
1.2.6.2 Flood Forecasting by Unit Hydrograph Method:
This method involves the following steps:
Derivation of unit hydrograph
Derivation of rainfall loss rate under critical conditions;
Derivation of design storm of various return periods and
Derivation of design flood using unit hydrograph.
(a) Derivation of Unit Hydrograph: Though runoff data is available at Dadupur, yet it is
only daily runoff data and unit hydrograph cannot be derived from this data. In view of
this, synthetic unit hydrograph has been derived as per method outlined by Central
Water Commission as applicable to this region.
Quarter hour synthetic duration synthetic unit hydrograph has been derived as per
flood estimation report for upper Indo-Ganga plains (sub zone 1(e)) issued by
Hydrology Directorate (Small catchment areas) of CWC in 1984. Derivation of
synthetic unit hydrograph is enclosed herewith Annexure-A. For this purpose,
catchment area of the Somb Nadi tributary up to the proposed dam site catchment

I-9
has been marked on GT Sheet of 1:50000 scale and the same work out to be
3.79 Sq. KM. length of the longest stream has been assessed as 2.67 km. The peak
discharge of the unit hydrographs has been worked out as 11.96 cumecs and the
base width of this unit hydrograph has been worked as 5.00 hours.
(b) Derivation of rainfall loss rate under critical conditions’: As per the said CWC
report, rainfall loss rate of 3 mm/hour has been recommended for sub zone I (e), the
sub zone in which this catchment area lies. The loss for 0.25 hour unit duration will be
0.075 cm/1/4 hour.
(c) Derivation of design storm of various return periods: -
Any 24 hour maximum point rainfall for the entire catchment area up to the proposed
dam site has been worked out as 361 mm, 410 mm and 459 mm for for 25 year, 50
year, and 100 year return periods respectively at Sub section 2.4.5 and already
discussed at sub section 1.2.3 (a). Also any 24 hour areal SPS has been shown as
546 mm as detailed at sub section 2.6.2 (ii) (b) and also discussed at sub section
1.2.3 (b). Using this figure, maximum areal rainfall of 2 hour and 6 hour storm
durations have been evaluated at Annexure-B at clause B-3 to B-4 and abstracted at
sub section 2.6.2 (ii) (c) (Table 2.33) which is again reproduced as under:-
Table 1.2 (Rainfall figures in mm)
Return period (years) Maximum areal rain fall
6 hour storm duration 2 hour storm duration
25 year 243 168
50 year 276 191
100 year 309 214
SPS 300 186
Derivation of flood hydrograph in Annexure-B has shown that flood hydrograph given
by the 6 hour storm duration give higher flood volumes while Flood hydrographs
given by 2 hour storm duration give higher peak flows. Thus maximum areal rainfall
for both of the storm duration are used for further studies.

I-10
(d) Derivation of Design Flood Using Unit Hydrograph:
Software has been prepared for rainfall analysis, preparation of flood hydrograph and
flood routing and it is named as ‘DAMHYD’ (short form of DAM Hydrology). This
software evaluates the following parameters while preparing flood hydrographs:
i) Time Distribution of areal rainfall.
ii) Estimation of rainfall Excess.
iii) Estimation of flood peaks.
iv) Critical sequence of rainfall excess for computation of hydrographs.
v) Computation of hydrographs.
Manual for preparation of data file for this software is given in Annexure-B at Clause
B-6. Unit hydrograph ordinates and design storm figures of 243 mm, 276 mm, 309
mm and 300 mm for 25 year, 50 year, 100 year return periods and SPS respectively
have been given as input in the data file. Apart from 6 hour storm duration, data files
have also been prepared for 2 hour storm duration having storm figures of 168 mm,
191 mm, 214 mm and 186 mm for 25 year, 50 year, 100 year return periods and
SPS respectively. All these data files are given in Annexure-B at Clause B-6. Flood
hydrographs have been evaluated by using these data files in the said software and
detailed results have been given in Annexure-B.
Detailed calculation of flood hydrographs based on 6 hour storm duration have been
shown in table B.6.6 (a), B.6.6 (b), B.6.6 (c) and B.6.6 (d) and for 25 year, 50 year,
100 year return periods and SPF respectively. However, flood hydrographs based on
2 hour storm duration have been shown in table B.6.12 (a), B.6.12 (b), B.6.12(c) and
B.6.12 (d). Flood hydrographs of various return periods and SPF derived from 6 hour
storm duration have given higher flood volumes compared to those obtained from
flood hydrograph based on 2 hour storm durations. SPF and 50 year flood based on
6 hour storm duration also give higher peaks than those given by the flood
hydrographs based on 2 hour storm duration. However 100 year and 25 year return
period flood hydrographs based on 2 hour storm duration give marginally higher
peaks than those given by 6 hour storm duration. Since this is a storage reservoir,
therefore flood hydrographs of various return periods and SPF based on 6 hour

I-11
storm duration have been taken as design flood hydrographs. However, peak
discharges of the design flood hydrographs based on 6 hour and 2 hour storm
durations are abstracted as under for comparison purposes:
Table 1.3
Return Period (year) SPS/ PMP
Storm duration (hours)
Flood peaks (cumecs)
Flood volume (ha-m)
Table No. of the flood
Hydrograph. (1) (2) (3) (4) (5)
SPF 6 153.12 103.49 B.6.6 (d)
100Year 6 157.80 106.74 B.6.6 ( c)
50 year 6 140.63 94.81 B.6.6 (b)
25 year 6 123.46 82.88 B.6.6 (a)
SPF 2 144.04 68.70 B.6.12(d)
100Year 2 166.13 79.31 B.6.12(c)
50 year 2 147.98 70.59 B.6.12(b)
25 year 2 129.83 61.88 B.6.12(a)
1.2.6.3 Flood Frequency Analysis of flood peaks at Dadupur and its comparison with
the peaks derived from synthetic unit hydrograph method.
Annual flood peaks of discharge reaching Dadupur from Somb and Pathrala
(Combined) have been used in Gumbel’s Method analysis to derive flood peaks of
25 year, 50 year and 100 year return periods at sub section 2.6.5 and these worked
out to be 2317.21cumecs, 2646.48 cumecs and 2975.06 cumecs respectively.
Flood peaks of various return periods for Chikan Dam site derived from the above
flood peaks derived at Dadupur are higher by 25.88 %, 25.68 % and 25.55 %, for 25
year, 50 year and 100 year flood respectively from the flood peaks derived by CWC’s
Synthetic Unit Hydrograph Method for the Chikan Dam Site, because area is too
small and hydrograph is truly represented for small area. Thus, flood peaks derived
by CWC’s unit hydrograph method fairly agree with those derived from recorded
flood peaks. It is explaining that both the methods are fairly accurate.

I-12
1.3 Reservoir
1.3.1 General
Chikan Dam will be an earth core cum gravel shell type dam of 27.00 m height from
the deepest bed level of 394.0 m. Total reservoir area up to El. 419.50 m (which is
MWL for 100 year retun period for 6 hour storm duration routing) work out to be
26.74 ha and given at Sub-section 3.3.6 (a).
1.3.2 Reservoir Capacity
(i) Elevation Area Statement and Curve:
Contour survey of the reservoir area has been got done with total station and the
contour sheet of the reservoir area is enclosed at Plate No. II. Contour areas of the
reservoir area upto the dam axis have been worked out from this contour sheet from
El. 394 m to 429 m. The contour areas for all these contours have been given in ha-
m in col. (3) of Table no. 3.1 and with reference to Table no. 3.1, Elevation (m) V/s
Reservoir area (ha) has been drawn and the same is given at Fig. 3.1.
(ii) Elevation – Capacity Statement and curve for the Chikan Dam reservoir:
Based on the elevation v/s Reservoir area statement as given in table No. 3.1,
elevation v/s capacity statement has been computed in Table No. 3.2. The
elevations are in m and the capacity of the reservoir against each elevation is in ha-
m. Based on the data in table No. 3.2, elevation (m) v/s Capacity (ha-m) curve has
also been drawn and the same has been given at Fig. 3.2.
1.3.3 Flood Routing
Flood Routing Method and Flood Hydrographs for which flood routings to be
carried out:
Following food routing studies have been carried out by step by step method as given
in IS: 5477 (Part- IV) - 1971 for following flood hydrographs:-
Twenty five year return period flood (based on 6 hour storm duration) impinges
the reservoir when the reservoir is already at FRL.
I-13
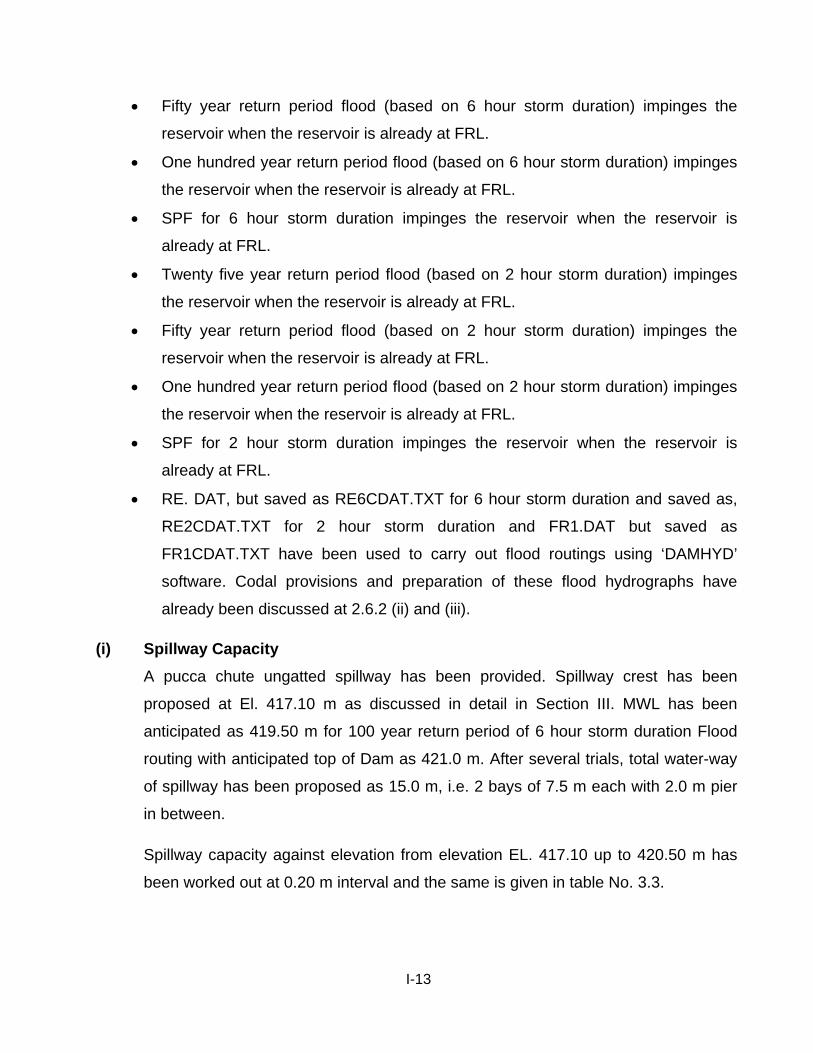
Fifty year return period flood (based on 6 hour storm duration) impinges the
reservoir when the reservoir is already at FRL.
One hundred year return period flood (based on 6 hour storm duration) impinges
the reservoir when the reservoir is already at FRL.
SPF for 6 hour storm duration impinges the reservoir when the reservoir is
already at FRL.
Twenty five year return period flood (based on 2 hour storm duration) impinges
the reservoir when the reservoir is already at FRL.
Fifty year return period flood (based on 2 hour storm duration) impinges the
reservoir when the reservoir is already at FRL.
One hundred year return period flood (based on 2 hour storm duration) impinges
the reservoir when the reservoir is already at FRL.
SPF for 2 hour storm duration impinges the reservoir when the reservoir is
already at FRL.
RE. DAT, but saved as RE6CDAT.TXT for 6 hour storm duration and saved as,
RE2CDAT.TXT for 2 hour storm duration and FR1.DAT but saved as
FR1CDAT.TXT have been used to carry out flood routings using ‘DAMHYD’
software. Codal provisions and preparation of these flood hydrographs have
already been discussed at 2.6.2 (ii) and (iii).
(i) Spillway Capacity
A pucca chute ungatted spillway has been provided. Spillway crest has been
proposed at El. 417.10 m as discussed in detail in Section III. MWL has been
anticipated as 419.50 m for 100 year return period of 6 hour storm duration Flood
routing with anticipated top of Dam as 421.0 m. After several trials, total water-way
of spillway has been proposed as 15.0 m, i.e. 2 bays of 7.5 m each with 2.0 m pier
in between.
Spillway capacity against elevation from elevation EL. 417.10 up to 420.50 m has
been worked out at 0.20 m interval and the same is given in table No. 3.3.

I-14
(ii) Reservoir capacity against incremental elevation of 0.20 m:
Reservoir capacity has already been worked out at Table 3.2 from El. 394.0 m to
429.0 m. However, for carrying out flood routing, reservoir capacities is required
starting from FRL at smaller intervals corresponding to the intervals against which
spillway capacity has been worked out at Table 3.3. Accordingly, capacity of the
reservoir has been interpolated from table No. 3.2 at every 0.20 m interval starting
from FRL (which has been fixed as 417.10 m at sub section 3.3.2) to El. 420.50 m
and the same is given at Table 3.4.
(iii) Flood Routing Software
‘DAMHYD’ software has been used for preparation of flood hydrographs as per the
method given by CWC in their report no. UGP/9/1984 as already discussed at sub
section 1.2.6.2. All these flood hydrographs mentioned at 1.3.3 have been given in
table No. B.6.6 (a) to (d) and tables B.6.12(a) to B.6.12(d) in Annexure B of section-
II and the same hydrographs are being used here using the same software for flood
routing propose. This software users step by step method of flood routing as per
relevant IS code and necessary input data file for this purposes i.e. (FR1.DAT) has
been prepared in table 3.5 for flood routing purpose and regenerating the same
flood hydrographs as discussed at (i) above by using data files RE6CDAT.TXT/
RE2CDAT.TXT. Flood routing tables prepared by the said software have been
given in table No. 3.7 to 3.10 and 3.12 to 3.15 and abstract of these flood routings
has been given in table No. 3.6 and 3.11, however, same is also reproduced as
under:
Flood freq. /
SPF/ PMF
Inflow peak
(cumecs)
Inflow vol.
(ha- m)
Outflow peak
(cumecs)
Max. water level
(m)
Routing time
(hours)
25 year (6 hr) 123.456 83.909 63.853 418.977 25.750
50 year (6 hr) 140.632 95.823 73.835 419.173 25.500
100 year (6 hr) 157.796 107.446 84.328 419.370 25.000
SPF (6 hr) 153.119 104.446 81.409 419.316 24.750
25 year (2 hr) 129.829 62.884 56.204 418.821 21.500

I-15
Flood freq. /
SPF/ PMF
Inflow peak
(cumecs)
Inflow vol.
(ha- m)
Outflow peak
(cumecs)
Max. water level
(m)
Routing time
(hours)
50 year (2 hr) 147.951 71.601 65.337 419.007 21.500
100 year (2 hr) 166.135 80.420 73.739 419.171 23.000
SPF (2 hr) 144.037 69.813 63.318 418.967 23.000
(iii) Discussion of flood routing results:
Examination of Table 3.6 and 3.11 shows that maximum water level (MWL) attained
is 419.370 m when 100 year return period based on 6 hour storm duration impinges
the reservoir already at FRL, accordingly MWL for 100 year return Period has been
fixed as 419.50 m which is 2.40 m above FRL. MWL of 419.50 m will be considered
for design of the dam. Reservoir area and capacity up to MWL of 419.50 m work out
to be 26.72 ha and 232.694 ha- m respectively. As per relevant IS Code and
Literature on the subject, minimum Free Board on the upstream side should be 1.50
above MWL attained during flood routing of 100 year return period, thus free board
has been provided as 1.5m above MWL attained during 100 year return period
routing fixing top level of the dam as 421.0 m.
MWL attained during the flood routing will be 419.316 m when SPF would impinge
the reservoir already at FRL of 419.316 m. Thus, MWL for SPF is 2.216 m above
FRL and it will return to FRL in 24.75 hours. Reservoir area up to SPF MWL will be
26.42 ha and reservoir capacity up to this MWL will be 227.77 ha- m. Maximum out
flow peak during this flood routing will be 81.409 cumecs and associated out flow
volume of water would be 104.446 ha- m.
MWL attained during 50 year flood routing is 419.173 m and built up property will
have to be acquired up to El. 419.173 m. MWL attained during 25 year flood routing
is 418.977 m and agricultural land will have to be acquired up to this elevation of
418.977 m with reservoir area of 25.84 ha upto this elevation.

I-16
1.3.4 Sedimentation Studies
(i) Rate of sedimentation of the reservoir and reduction in its capacity with
passage of time:-
Sedimentation studies for the Chikan Dam Reservoir have been conducted as per
procedure recommended in IS: 7477 (Part- I) - 1969, IS: 5477 (Part- II) 1969 and
Technical Report No. 19 issued by the Central Board of Irrigation and Power on life
of reservoirs. There has been no observation of sediment for this catchment area.
However, results of the compendium of silting of reservoirs in India issued by CWC
in April, 2015 has been adopted as applicable to the Himalayan Region (Indus,
Ganga and Brahmputra basins) which gives average rate of sedimentation of the
reservoir as 25.78 ha-m per 100 Sq. Km per year. Catchment area of this project is
3.79 Sq. Km. therefore by taking rate of sedimentation of the reservoir as 25.78 ha-
m/100 Sq. Km per year, annual sedimentation of this reservoir work out as
0.977 ha-m. In this way sediment that would get deposited in the reservoir in 10, 20,
30, 40, 50, 60, 70, 80, 90 and 100 years would be 9.80, 19.54, 29.31, 39.08, 48.85,
58.62, 68.39, 78.16, 87.93 and 97.70 ha- m respectively as per Sub section 3.4.2.3.
(ii) Prediction of Distribution of Sediment in the reservoir
Prediction of Distribution of Sediment in the reservoir has been made as per
empirical area reduction method as given in IS: 5477 (Part-2) 1994 for which
necessary software has been used. Input data for this software has been given in
table No. 3.18 and the computed prediction of sedimentation distribution in the
reservoir at the end of each 10 years of operation of the reservoir has been given in
table No. 3.19 to 3.28.
(iii) Dead storage and live storage capacities at the end of each block of 10 years
By referring to table Nos. 3.19 to 3.28, abstract of prediction of sediment distribution
in the reservoir and consequent fixing of reservoir parameters have been given in
table No. 3.29 and the same is also reproduced as under:
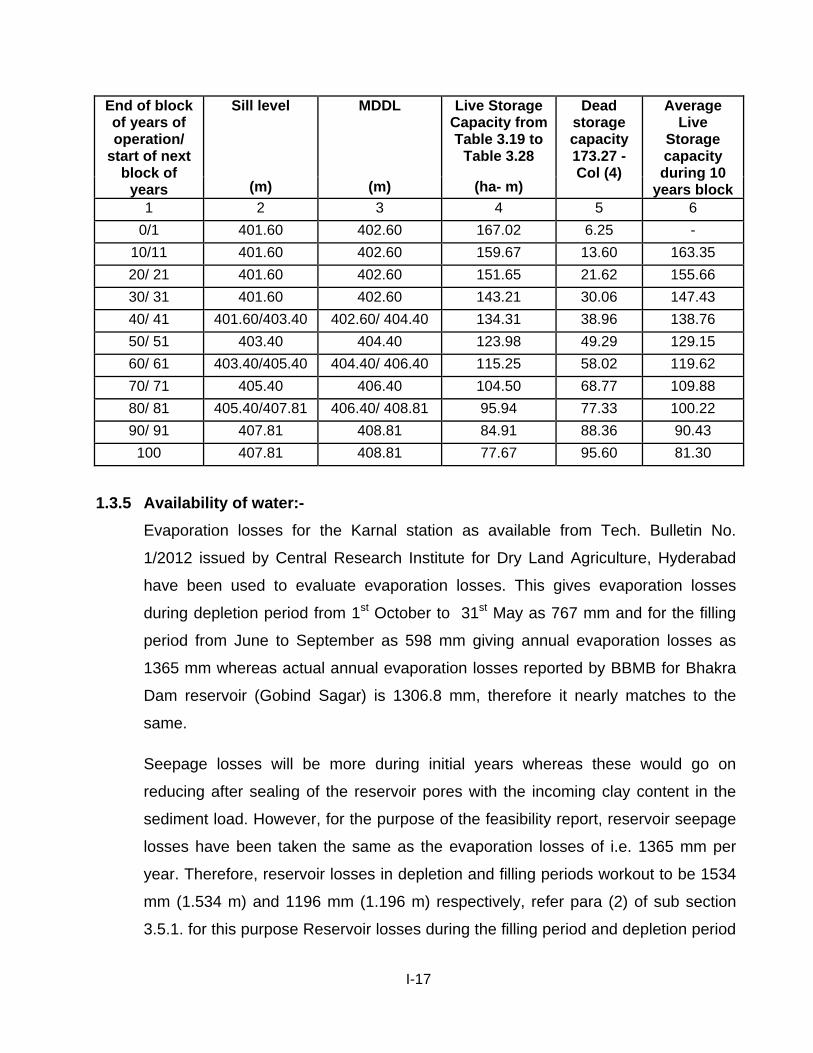
I-17
End of block of years of operation/
start of next block of
years
Sill level MDDL Live Storage Capacity from Table 3.19 to
Table 3.28
Dead storage capacity 173.27 - Col (4)
Average Live
Storage capacity during 10
years block (m) (m) (ha- m)
1 2 3 4 5 6
0/1 401.60 402.60 167.02 6.25 -
10/11 401.60 402.60 159.67 13.60 163.35
20/ 21 401.60 402.60 151.65 21.62 155.66
30/ 31 401.60 402.60 143.21 30.06 147.43
40/ 41 401.60/403.40 402.60/ 404.40 134.31 38.96 138.76
50/ 51 403.40 404.40 123.98 49.29 129.15
60/ 61 403.40/405.40 404.40/ 406.40 115.25 58.02 119.62
70/ 71 405.40 406.40 104.50 68.77 109.88
80/ 81 405.40/407.81 406.40/ 408.81 95.94 77.33 100.22
90/ 91 407.81 408.81 84.91 88.36 90.43
100 407.81 408.81 77.67 95.60 81.30
1.3.5 Availability of water:-
Evaporation losses for the Karnal station as available from Tech. Bulletin No.
1/2012 issued by Central Research Institute for Dry Land Agriculture, Hyderabad
have been used to evaluate evaporation losses. This gives evaporation losses
during depletion period from 1st October to 31st May as 767 mm and for the filling
period from June to September as 598 mm giving annual evaporation losses as
1365 mm whereas actual annual evaporation losses reported by BBMB for Bhakra
Dam reservoir (Gobind Sagar) is 1306.8 mm, therefore it nearly matches to the
same.
Seepage losses will be more during initial years whereas these would go on
reducing after sealing of the reservoir pores with the incoming clay content in the
sediment load. However, for the purpose of the feasibility report, reservoir seepage
losses have been taken the same as the evaporation losses of i.e. 1365 mm per
year. Therefore, reservoir losses in depletion and filling periods workout to be 1534
mm (1.534 m) and 1196 mm (1.196 m) respectively, refer para (2) of sub section
3.5.1. for this purpose Reservoir losses during the filling period and depletion period

I-18
for each block of 10 years at 50%, 67%, 75% and 90% dependabilities have been
worked out in table No. 3.31 to 3.34.
Availability of useable water after losses during the Filling period (1st June to 30th
September) and depletion period (1st October to 31st May) have been worked out in
ha-m and cusecs for all the four dependabilities in table No. 3.36, 3.37, 3.38 and
3.39 respectively. However, abstract of availability of water in cusecs with reference
to table No. 3.36 to 3.39 has also been given in table No. 3.40.
1.3.6 Life of Reservoir and effect of soil conservation measures
Life strictly is a term which may be used for system having two functional states
‘ON’ or ‘OFF’. Systems showing gradual degradation of performance and not
showing any sudden non- functional stage have no specific life period. Reservoirs
fall in the latter category.
(i) Economic Life:-
If, at any point of time, the benefits likely to accrue in further operation of the
reservoir compare unfavourably under the relevant economic criteria with the future
costs involved in operating and maintaining the system, but excluding any element
to cover the past costs incurred, the reservoir shall be said to have reached the end
of the economic life.
(ii) Feasible Service Time:-
For a specified purpose, the period or notional period for which the reservoir
provided or is / was expected to provide a part of planned benefit in respect of
storage in the reservoir being impaired by sedimentation. Customarily, it is
estimated as the time after which the new zero elevation of the reservoir would
equal the sill of the outlet relevant for the purpose.
(iii)Full Service Time:-
For a specified purpose, the period or notional period for which the reservoir
provided or is/was expected to provide a part of full planned benefit inspite of
sedimentation.

I-19
As per table 3.41 weighted average of availability of water from 50% dependability
to 75% dependability for 65 days of the filling period varies from 4.20 Cs to 6.26 Cs
from the Ist decade to the 10th decade of operation of the reservoir respectively and
weighted average of availability of water from 50% dependability to 75%
dependability for 97 days of the depletion period varies from 4.20 Cs to 2.65 Cs
from the Ist decade to the 10th decade of operation of the reservoir respectively.
Effect of Soil Conservation measures:-
Soil conservation may lead to reduction of sediment. This programme, would have
large beneficial effects due to the protected area. However, because of the different
areas benefitted, socio- economic implications etc., and it have not been included in
the economic analysis of this feasibility report, which is in line with the codal
provisions. Therefore, any change in trend of sediment yield, attributable to such
programmes, has not been considered in assessment of performance of the
reservoir.
1.4 Design Aspects
1.4.1 General:
Chikan Dam is proposed on Chikan-Ki-Khol, a tributary of Pathrala Nadi which is
entirely rain fed and originates from local mountains.
The catchment area of the tributary of Pathrala Nadi above the proposed chikan
Dam site is about 3.79 Sq. Km. Physiographically the project area is part of regional
topography of Shivalik formed by the projecting NW-SE trending strike ridges of
sandstone alternating with eroded softer sediments (siltstone, clay-stone etc..). The
hilly region comprises of light brown color sandy mud which was seen in the lower
part. At places, highly weathered closely jointed rock exposed in the form of
sandstone and mudstone is also observed which vary in thickness from 10 to 20 m.
At certain locations, the laminated clay was overlained by clay bed followed by
alluvial deposits of sand and mud.

I-20
A Zoned earth dam of maximum height of about 27.0 m above the deepest river bed
with top width of 6.0 m and 300.0 m in length is proposed on Chikan ki Khol at
Chikan and this place is about 24 Km from Bilaspur Town. The lake behind the
proposed dam would have a spread of about 22.74 hectares at FRL of 417.10 m.
1.4.2 River Diversion Works:- During construction, a gap of about 25 m will be
left in the channel of the river for passing monsoon flood water during first year of the
construction. In addition of this, two no. RCC pipes would also be embedded along
slopes of the gap for passing winter freshets and non- monsoon flows so that the
work is not hampered and these RCC pipes will be dismantled before closing of the
gap at the time of start of second year of construction after the passing of first year
monsoon.
Simultaneously, work of laying of two no. conduit pipes for outlet works would also
be taken up along with construction of low level entries to these outlet pipes which
would also function as diversion after closing of the gap after first monsoon. After
completion of the dam except some in completions, such as some miscellaneous
left out works, outer slope protection with turfing and outer finishing, etc. dam
reservoir will be made ready for filling from the second year’s monsoon after closing
the low level entries to the conduit pipes ( after 21 months from the start date).The
first filling of the reservoir during the first year would be kept quite low, therefore, the
said balance pending works can be completed during the second monsoon period
also.
1.4.3 Earth Dam
1.4.3.1 Treatment of Dam Foundation
(i) Stripping of foundation for shell Zones: For foundations on soils or non-rocky
strata, vegetation like bushes, grass roots, trees etc., would be completely
removed and the soil containing organic material or dissoluble salt, is also required
to be completely removed. The foundation surface will be moistened to the
required extent and adequately rolled before placing embankment material. For the
rocky strata, the surface will be cleaned of all loose fragments including

I-21
semidetached and over-hanging surface blocks of rock for establishing proper
bond with the embankment material. One metre of excavation of the foundation for
placing the shell material shall be made, but this depth will vary from place to place
as per site condition. The prevailing dip of the bedding is in the upstream direction
which is a favorable feature from the stand point of stability and seepage.
(ii) Core Trench:- To lengthen the path of percolation and to secure adequate contact
between the foundation and the core of the dam, a cut off trench has been provided
which will be filled back with compacted impervious soil. Preliminary geological
investigations suggest that either core trench can directly be tied to the bedrock or
bedrock can in tied with curtain grouting. Thus positive cutoff is proposed for this
dam. Bottom width of the cut-off trench has been proposed as 8.0 m and depth has
been kept as 8.0 m below stripped NSL with side slopes (H) : 1 (V) However, if on
detailed investigation it is found that positive out off is not possible, then upstream
impervious blanket would be provided as per codal provisions apart from curtain
grouting, if required.
(iii) Junction with Abutments, spillway structures and out-lets.
(a) Junction with abutments:- The upper bands and over laying material of the
abutments shall be removed to some distance into the abutment. These abutments
shall be suitably shaped and prepared in order to get good contact between the
impervious core of the embankment and the rock.
(b) Junction with control structure of spillway: The junction of the earth dam with
the control structure of the spillway shall be provided by stable key taking it
sufficiently inside the earth dam. The bond between the key and the earth work
shall be established by proper compaction of contact layers.
(c) Junction with outlet structure:- Proper bond between the earth work and the
outlet conduits shall be made by providing staunching rings at intervals so as to
increase the path of percolation along the contact by 20 to 30 %.

I-22
1.4.3.2 Dam Embankment
(i) General: The dam embankment is designed with centrally located impervious core
and shell zones of pervious material. The dam would be about 27.00 m high above
the lowest bed level. The crest of dam spillway is proposed at EI. 417.10 m. The
embankment would be approximately 300.0 m long at its top level of 421.00 m and
would have a top width of 6.0 m.
(ii) Axis of Dam: Three alternative locations for the axis of dam were studied by our
geological expert and the present selected Axis of the dam takes into account the
local topography, geology, layout of dam and appurtenant works and suitable
location for the spillway.
(iii) Section of Dam Embankment
a) Top width and settlement allowance: The top width of the dam has been fixed as
6.0 m except at special location where it can be more as per requirement. The top
level of the dam shall be suitably raised above the designed top level of the dam to
allow for post construction vertical deformation resulting from compression/
consolidation and or settlement of the embankment and foundation. The settlement
has been provided equal to 1% of the embankment height (from the bottom of core
trench) to the top design level of the dam and it work out to be 0.27 m where height
of the dam is maximum.
b) Free Board: -As already mentioned at sub-section 1.3, MWL attained during the
100 year return period routing (based on 6 hour storm duration) is estimated at
419.370 m and accordingly MWL has been fixed as 419.50 m. Thus by providing
minimum free board of 1.50 m over this MWL of 419.50 m, top of dam has been
fixed as 421.00 m. FRL for the dam has been fixed 417.10 m with reference to sub
Section 3.3.5 (iii) (a).
c) Overall Profile: - Typical cross section of the dam as proposed is shown in Plate
No. IV. It has an upstream slope 3:1 and downstream slope of 2.75:1 with two
intermediate berm at EL 408.00 m on upstream and downstream sides.

I-23
Top width of the impervious core has been kept as 3.0 m and bottom width of
impervious core has been provided as 16.0 m. at El 394.00 and 8.0 m at bottom,
however, it will vary to some extent as may be required as per site conditions and
as per height of the dam. The impervious core has been located centrally and
material to be used for impervious core has been given in sub section 4.3.2.3.
The casing or shell of the dam will be of river bed material consisting of sand,
gravels and cobbles and this material shall also be obtained from the terrace lying in
the reservoir area. Specifications for this material have also been specified in sub-
section 4.3.2.3.
Upstream Transition Filter has been provided on the upstream side of the
impervious core. The filter material will be provided in two layers and thickness of
each layer of this transition filter has been provided as 1.00 m. Graded downstream
contact filter has been provided on the downstream side of the impervious core in
two layers each having width of 1.00 m for collecting seepage from downstream
side of the clay core and transmitting seepage water to the horizontal filter. The filter
material in contact with the impervious core will consist of well graded sand and the
layers in contact with the shell material will be coarse filters. Technical requirement
of these filter materials are specified as sub-section 4.3.2.3.
Horizontal filter has been provided to collect the seepage from the downstream
vertical filters and from the body of the dam to carry it to the rock toe and toe drain.
The horizontal filter will also collect seepage from the foundation to minimize
possibility of piping along the dam seat.
Rock Toe has been provided to facilitate drainage of seepage water for protecting
the lower part of the downstream slope from tail water erosion. In the reaches
where the ground level at the dam toe is above the maximum tail water level plus
1.0 m, only conventional pitching shall be provided. The toe drain has been
proposed to collect the seepage from the horizontal filter, from body of the dam and
through the foundation and to discharge it away from the dam.

I-24
Hand placed Rip rap of 0.50 m thickness over 0.15 m thick filter is proposed to be
provided to protect the upstream slope of the dam and this riprap would consist of
natural stones or boulders to be laid in place by hand in a more or less definite
pattern. Technical requirement for the stones for use for rip rap is given in sub
section 4.3.2.3. Average annual rainfall in the area is less than 2000 mm, therefore,
only turfing has been proposed on the entire downstream face of the dam.
Stability analysis of the dam shall be carried out as per IS 7894-1975 at DPR stage
for the following loading conditions:-
(i) For upstream slope
1. Reservoir Full Condition (with & without earthquake forces).
2. Construction condition (without earthquake forces).
3. Sudden Drawdown condition (without earthquake forces)
(ii) Downstream slope
1. Steady seepage condition (with & without earthquake forces).
2. Construction condition (without earthquake forces).
1.4.4 Spillway:
1.4.4.1 Description: A chute spillway capable for passing regulated outflow of 84.328
cum/sec. (2978.0 cusecs) as given by 100 year return Period flood routing is
proposed on the right abutment. The spillway structure comprises of 2 bays of 7.5 m
each that is total 15.0 m and 2.0 m including width of piers and rectangular broad
crested weir with crest level of 417.10 m. at FRL. Bridge over the spillway will be
4.25 m wide water will be fed to the crest through an approach channel, which is
mainly curved in plan. On the left side of the approach channel, FO wall of CC M 15
has been proposed while of the right side, vertical RCC wall of varying height has
been proposed. The discharge carrier is a 119.40 m long chute, rectangular in
section and having longitudinal slope varies as 0.205, 0.235 & 0.135 as detailed at
sub-section 4.4.1.

I-25
An Indian Standard stilling Basin II with horizontal floor, chute blocks and detainted
end sill is provided at the end of the chute for dissipation of energy.
1.4.4.2 Location and Layout:
The proposed layout of the spillway is on the left abutment has been selected after
examining a number of alternatives. The alternate studies included the feasibility of
a short chute normal to the main dam axis. The proposed layout has the advantage
of economical excavation on alignment of the chute along a milder slope. The
alignment of the outfall channel avoids heavy excavation and high fills. However,
this layout shall be reviewed on receipt of geological investigation report at DPR
stage.
1.4.4.3 Selection of Type of Spillway:
Following consideration have been taken into account while deciding provision of
chute spillway for this dam.
(i) Safety consideration consistent with economy.
(ii) Hydrological and site conditions.
(iii) Type of dam-For earth and rock fill dams, chute and ogee spillways are commonly
provided.
(iv) Purpose of the dam and operating conditions.
(v) Conditions downstream of a dam.
(vi) Nature and amount of solid material brought by the river. Where big tress come as
floating material the chute or ogee spillway remains the common choice.
Chute ungatted spillway has been provided in the present case due to availability of
appropriate foundation. Length of the chute has been kept as 119.40 m and the
stilling basin will be sufficiently away from the toe of the dam.
1.4.4.4 Spillway Capacity:
The inflow design flood hydrograph i.e. 100 year return period based 6 hour storm
duration derived by unit hydrograph method has a peak of 84.328 cumecs with
25.00 hours base period and 107.712 ha-m volume. The design flood hydrograph

I-26
is 100 year return period, for details refer Annexure B to Section II (Hydrology) and
MWL has been fixed with this is 100 year return period as 419.50 m. Flood routing
of this flood carried out at Table 3.13 in section III give outflow discharges as 84.328
cumecs with MWL of 419.370m (say 419.50 m) and the spillway has been designed
for this outflow flood. Spillway capacity has already been discussed and worked out
at sub section 3.3.2.
1.4.4.5 Hydraulic Design of Spillway:
i) Design of Approach Channel: On the right side of the approach channel, FO wall of
CC M 15 has been proposed while of the left side, vertical RCC wall of varying height
has been proposed. Details of this design are given as sub section 4.4.5.1.
ii) Design of Control Structure: Spillway consisting of 2 bays of 7.5 m width each with
2.0 wide piers giving 7.5 m clear water way and 17.0 m gross water way has been
proposed. The crest has already been fixed as 417.10 m in section III. Other details
regarding design of the control structure are given at sub-section 4.4.5.2.
iii) Design of Discharge Channel (Chute): The chute profile follows the natural ground
slope as far as possible. However, soundness of the strata underneath the chute
shall only the established when results of the Geological investigations would be
available at DPR stage. Total length of the chute has been provided as 119.40 m on
horizontal plane. However, the slope of the chute has been kept from RD 12- RD 32
as 0.205, from RD 32- RD 49 as 0.235 & from RD 49-RD 119.40 as 0.135. Hydraulic
design of the chute is carried out for value of n as 0.008 and 0.018 as per
requirements of IS: 5186 – 1969 for stilling basin design and for providing free board
respectively. Preliminary hydraulic design for the chute has been given at sub-section
4.4.5.3
iv) Design of Stilling Basin: Design discharge for the stilling basin has been taken as
84.328 cumecs and depth of the outfall channel has been taken as 2.0 m. Tail water
level assumed out to be 396.0 m. Width of the chute at its tail as 12 m and width of
the stilling basin has also been kept as 12 m, this give discharge intensity (q) as 7.02
cumecs/m. Head loss (HL) has been evaluated to be 18.40 m. Hydraulic jump

I-27
calculations give pre jump depth (D1) as 0.323 m and post jump depth (D2) as
5.396 m. This gives incoming velocity before hydraulic jump as 21.73 m/sec which
give value of Froude No. as 12.20. Therefore, Indian Standard Stilling Basin – II with
dentated end sill and slopping inverted filter blocks with horizontal launching apron
has been proposed. For other details of the preliminary design of the stilling basin
sub-section 4.4.5.4 may be referred. Cistern length is 21.60 m and the cistern level
has been provided as 390.0 m after due calculations.
v) Design of outlet channel: Outlet channel starts from the stilling basin of the spillway
and discharges into the main river downstream. Approximate X-section on d/s of the
dentated end sill has been shown in Fig. 4.4.7, but it will be modified as per site
conditions and more details would be given at DPR stage.
1.4.4.6 Structural Design:
(i) Approach Channel: The left side wall of approach channel has been proposed as
vertical RCC (bottom with 1.0 m and top width 0.50 m) wall of varying height, but left
side wall would run as CC M- 15. F.O. wall flaring from vertical to 1:5:1 slope.
Thereafter flank wall with 1:5:1 inside slope has been proposed. The crest structure
consists of 1.00 m thick RCC M-30 laid over 500 mm thick M 15 lean cement
concrete. Joints have been sealed with appropriate seals/ water stops. The details
shall be worked out at the stage of DPR.
(ii) Abutment, Chute and Stilling Basin walls: The abutment and stilling basin walls
are cantilever type retaining walls. Chute walls height various as given in the table
Plate No. VI. These walls are RCC M30 retaining walls. However, joints have been
provided in the chute floor so that bending moment of the cantilever retaining walls
is not transferred to the chute floor.
(iii) Floors: The chute floor is proposed to be 0.30 m thick RCC M-30 with nominal
reinforcement over 0.15 m CC M15. It is safe against sliding along slopes due to
drag forces caused by velocity of flow plus sliding component of the weight of the
floor, slab. The floor slab shall be reinforced against temperature and shrinkage

I-28
stresses. The stilling basin floors are provided as 1.0m thick. Upper 0.50 m will be in
RCC M30 (nominal reinforcement) and lower 0.50 m thick will be in CC M 15.
Stilling basin floors will be laid in panels of usual dimensions. Conventional types of
keys, cut offs and joints have been provided as per IS: 5186. The chute and stilling
basin floors will be tied to the foundation rock by anchors to counteract the uplift
forces wherever necessary. The depth of the anchored rock plus self weight of the
floor will be adequate against uplift. The size of anchor bars will be safe in tension
and depth will be checked against bond stress. The details shall be worked out at
the stage of DPR.
1.4.4.7 Sub Surface Drainage: Subsurface drainage arrangement has not been provided
because it is a small dam. However, this aspect will be reviewed at DPR stage on
receipt of detailed Geological investigations report.
1.4.5 Intake Structure and Outlet Works
1.4.5.1 Description: The main purpose of the outlet works is to irrigate the local area and
shall be designed for discharge of 0.206 cumecs for maximum discharge as per
availability of water as outflow discharge given in table 3.40. Accordingly, one pipe
of 300 mm internal diameter has been designed to carry the above discharge.
However, this pipe can also carry the discharge of 7.30 cusecs (at 50%
dependability) during 91 to 100 years block when the reservoir water level will be
near MDDL of 402.60 m. The outlet conduits are proposed to be embedded under
dam embankment towards the right side, each for 0.206 cumecs (7.30 cs) so that
discharge could be passed through one conduit only and other conduit will be kept
standby for emergency uses. The various components of the outlet works are:-
a) Intake Structure
b) Outlets Conduits
c) Valve control chamber
d) Sump well

I-29
1.4.5.2 Layout
As pipeline is proposed to off take from the right side of the dam, location of the
outlet works is also proposed to be on the right side. The alignment of the outlet
conduits has been fixed so as to have minimum cost of excavation and minimum
length of conduits to be embedded under the dam embankment.
1.4.5.3 Capacity of intake structure and outlet works
As per the detailed calculations in section II and III of this feasibility report, the
availability of water from the Chikan Dam reservoir is given in table No. 3.41 which
may be referred to. It is proposed to fully utilize the available water for the maximum
availability of water at 50% dependability from 91st to 100th year of operation
workout to be 7.30 cusecs (0.206 cumecs). It will also help in emptying the reservoir
under emergency requirements.
1.4.5.4 Preliminary Design of Intake Structure
(i) Outlines Details
The intake structure for the outlet conduits consists of two submerged vertical intake
shafts with sill level of 401.60 m, one for each outlet conduit. The vertical intake
shafts can be completely closed from the top by two separate bulkheads which can
be lowered on the bell mouthed entrance of the vertical intake shafts by a suitable
crane, if needed. Its invert level in horizontal position starts from elevation 398.0 m.
Total length of the pipe upto the sluice wall chamber is 182 m plus 3.0 m upto the
outfall point in the sump well with longitudinal slope of the pipe line as 0.005, invert
level at the outfall point work out to be 397.633 m (398 – 0.005 x 185= 397.633 m).
However, invert level of the Chikan Minor pipe line has been kept as 394.55 m.
(ii) Preliminary Hydraulic & Structural design of Trash rack and intake
The trash rack for the intake vertical shafts has been designed with the assumption
that maximum inflow velocity from the trash rack bars shall be 0.75 m/sec. and with
the assumption that 50% of the openings are choked and 40% of the total area of
the trash rack is already blocked by trash rack bars. The top level of the trash rack

I-30
has been kept at 402.60 m corresponding to the initial minimum draw-down level
(MDDL) of 402.60 where as sill level has been kept as 401.60 m. Trash rack of type
1 as per IS 11388 – 1985 has been provided. Two no. top trash rack panels of
overall size of each panel shall be 1.160 m x 1.235 m. Two no. side panels of size
1.160 m x 1.0 m and four no. side panels of size 1.235 m x 1.0 m. Sill level for
installing trash rack will be raised to 403.40 m, 405.40 and 407.81 m from 41st, 61st
and 81st year of operation of the reservoir respectively. Other details are given in
sub-section 4.5.5.2.
1.4.5.5 Outlet Works (Outlet Conduits)
(i) Outlines: Two 0.30 m internal diameter steel cylinder pipes with concrete lining and
coating of class-2 as per IS 1916-1989 are proposed to be laid under the
embankment each for a discharge of 0.206 cumecs (7.30 cusecs) as discussed
earlier. To control discharge in the outlet conduits, two sluice values are provided on
each conduit in the sluice valve chamber, one valve is for regulation purpose and
the other to be stand by for emergency regulation. Sluice valve chamber is provided
at the d/s toe of the dam. However, 3.0 m additional length of conduit pipes has
been provided beyond the sluice valve chamber to discharge in to the sump well
and to keep sump well sufficiently away from the toe of the dam. Full supply level of
the sump level has been fixed as 398.008 m. For other details are given in sub-
section 4.5.6.1.
(ii) Hydraulic & Structural Design Considerations: The minimum draw – down level
(MDDL) of the reservoir has been kept as 402.60 m (i.e. above 40 year silt up level).
However, sill level will be periodically raised as discussed at 1.4.5.4 (ii) above. The
sump well level for the outlet conduits at their downstream end has been kept as
398.008 m for feeding the d/s pipeline. However, minimum reservoir level required
to pass discharge of 0.206 cumecs through one conduit has also been calculated.
To calculate this, head loss from the trash rack to the downstream end of the
conduits has been worked out for passing the design discharge of 0.206 cumecs
and the minimum working head required work out to be 0.440 m which require

I-31
reservoir level of 402.04 m for feeding sump up to El. 398.008 m against which
MDDL has been kept as 402.60 m, hence safe.
1.4.5.6 Type and size of control works
(i) Sluice valve chamber: Two No. sluice valve of 300 mm with internal diameter shall
be provided on the each conduit pipe, the one for regulation and the other for
emergency uses. All the four sluice valves will be installed in sluice valve chamber
which will have internal dimension of 3000 mm x 3000 mm. Surge Shaft will be
installed on each conduit pipe on upstream side of the upstream sluice valve to
check water hammer effect.
(ii) Sump Well: A sump well with internal dimensions of 3000 mm (along flow) x 2500
mm has been proposed with its bed level as 394.40 m. The maximum water level in
the sump well shall be 398.008 m as per outflow requirement, for giving maximum
head to the conveyance pipelines.
1.4.6 Mechanical Equipment, Electrical Features and Auxiliaries for Dam
Trash racks will be provided as per IS: 11388-1985 and this have already been
explained in the forgoing paragraphs. Each conduit of the outlet works is proposed to
be regulated by two sluice valves of internal diameter of 300 mm in the sluice valve
chamber. The upstream sluice valve shall serve as emergency sluice valve and the
downstream sluice valve is for regulating purpose.
14.6.1 Miscellaneous Metal work
Miscellaneous metal work shall include hand railings on the sides of spillway stairs,
ladders, water sanitary and air pipes. Provision shall also be made for floating barge,
lifting tackles and portable motor operated air compressor.
1.4.6.2 Electrical Features
Power for the Auxiliary equipment and lighting system for the dam during
construction is proposed to be supplied by a suitable overhead line from the nearby
substation. A diesel generator set of approximately 50 KVA capacity is also

I-32
proposed to cater to the emergency load in case of power failure. Outdoor flood
lighting is proposed for spillway area which would be achieved by powerful narrow
beam flood lights. The exterior lighting on the road way over the dam is proposed by
fluorescent tubes mounted inside specially shaped parapets on both sides. Mobile
phone handsets will be made available at important locations for coordination during
construction period.
1.4.7 Conveyance and Water Distribution System:
A 9.271 km long piped minor, namely Chikan Minor has been proposed from the
outlet works of the dam. However, Tibbi Sub piped minor will off-take from
RD 6.678 km of Chikan minor and it will tail at RD 1.990 Km in the ‘had bast’ of village
Tibbi.
Alignment of Chikan Piped Minor: Since availability of water from the Chikan Dam
reservoir is limited, for calculation of discharge of Chikan piped minor weighted average
discharge of 4.20 cs has been taken from table 3.40 for catering to irrigation needs of
the area. 50% dependable discharge of 4.60 cs and 20% extra for wet years i.e
4.60 x.12 = 5.52 cs (0.156 cumecs) has been planned from this reservoir for irrigation.
Discharge at the head of this minor is 5.52 cusecs (0.156 cumecs) and it changes to
4.83 cusecs (0.136 cumecs), 1.38 cusecs (0.040 cumecs) and 0.69 cusecs (0.020
cumecs) from Outlet No. 1 (RD 5.500 Km), Outlet No. 2 & 3 and offtake of Tibbi Sub
Minor (RD 6.678 Km), Outlet No. 4 (RD 8.485 Km) and Outlet No. 5 (RD 9.271 Km)
respectively. Since slope of the terrain is uneven, therefore, RCC pressure pipe (P-1) of
450 mm diameter has been proposed for the first 300 m. Thereafter, RCC pressure
pipe (P-1) of 400 mm has been proposed from RD 5.500 Km to RD 6.678 Km, 350 mm
diameter has been proposed from RD 6.678 Km to RD 8.485 Km and 300 mm has
been proposed from RD 8.485 to RD 9.271 Km (tail) respectively. There are 10 No.
Haudies on Chikan Minor. This includes 5 no haudies on blind minor and balance 5 no.
haudies are provided for outlets/off taking minor.

I-33
(i) Alignment of Tibbi Sub Piped Minor: A pipeline of 2.07 cusecs (0.0586 cumecs)
has been planned for this minor and it has been named as Tibbi Sub Piped Minor
which is proposed to off-take from the Chikan Piped Minor from its RD 6.678 Km and it
tails near village Tibbi at tail RD of 1.990 Km.
Discharge at the head of this minor is 2.07 cusecs (0.0586 cumecs) and it changes to
0.69 cusecs (0.020 cumecs) from Outlet No. 1 & 2 (RD 1.100 Km), Outlet No. 3 (RD
1.990 Km) respectively. Since slope of the terrain is uneven, therefore, RCC pressure
pipe (P-1) of 450 mm diameter has been proposed from RD 0 km to RD 1.100 km
Thereafter, RCC pressure pipe (P-1) of 350 mm has been proposed from
RD 1.100 Km to RD 1.990 Km (tail) respectively.
1.4.8 Planning of Irrigation
(i) Planning of Irrigation from the Chikan and Tibbi Sub Minor:
A discharge of cusecs can irrigate 1750 Acres of Command area. Outflow discharge
obtained for maximum weighted average discharge for 8 no. outlets (0.69 cs.) has
been taken to decide the Command Area. In this way, CCA has been calculated as
1750 Acres. So, approximately, CCA of 1750 Acres can be irrigated with this
discharge.
This CCA has been planned on the west of Chikan- khol. The proposed CCA of
1750 Acres fall in the following villages:
1) Chikan
2) Kalsia
3) Shahzadwala
4) Daulatpur
5) Dhakwala
6) Tibbi
(a) Chikan Piped Minor
CCA has been divided into five chaks. The outlet points and alignment of the
Chikan Piped Minor has been shown in Plate No. I and IX.

I-34
(b) Tibbi Sub Minor
CCA has been divided into Three chaks. The Outlet points and alignment of the
Tibbi Sub Piped Minor has been shown in Plate No. IX.
(ii) Haudies and Outlets
Detail of Haudies and outlets is given as under shows at Plate No. I and IX.
Sr. No.
Minor No. of Haudies No. of outlets
1. Chikan Minor 10 5
2. Tibbi Sub Minor 3 3
This includes 5 Nos. haudies on blind minor and the balance 5 No. haudies
are provided for outlets off-taking minor.
1.5 Environmental and Ecological Aspects
1.5.1 Basic Information:
The Chikan-Ki-Khol rises from the lower Shivaliks and meets Pathrala Nadi about
4 Km upstream of Dadupur after travelling about 20 Km. thereafter, it is meets Nadi
Yamuna upstream of Yamuna Nagar Saharanpur Railway bridge. This catchment
area lies in the hills and is covered with forests. No village will be submerged and
no population will be displaced.
Twenty five year return period flood level of 418.977 m would result in
submergence of 63.85 acres land along with 6.0 acres required for the dam and its
appurtenant works. This tributary of Pathrala Nadi carry large quantity of sediment
during monsoon period and rate of sedimentation of the reservoir has been taken
as 25.78 ha m/100 sq. km/year which is based on CWC document of April 2015.
Quantity of sediment deposition during each block of 10 years has been worked
out as 1.218 ha-m. This has been distributed in the reservoir for each block of 10
year up to 100 year and abstract of live and dead storage capacities is given in
section III in Table 3.29. Reduction in live storage would reduce availability of water

I-35
from the dam with the passage of time and the same is abstracted in Table 3.40.
Preliminary Geological Investigations report at Annexure- D shows that rock
formations farming rim of the reservoir would not pose any problem of slip and
slides. Pathrala Nadi causes floods year after year and construction of this dam
would reduce intensity of these floods.
Depth of ground water is going down and construction of this storage dam would
help in recharging of the ground water through its own reservoir.
1.5.2 Environmental Status:
There are no known sources of pollution upto the project site. Presently mining
lying closed, but any regulated sand mining in future will not likely to adversely
affect the environment.
This is non perennial Nadi, so the Nadi course itself is not viable breeding ground
for aquatic life. However, construction this dam can support aquatic life.
Construction of this dam would benefit the wild life and birds. Apart from land
required for the Chikan Dam and its appurtenant works, here will be submergence
of about 63.85 acre land in the reservoir up the level of 418.977 m attained during
25 year return period flood routing. This small submergence is not going to
submerge/destroy any rare/dying species of flora and fauna.
This project is basically being constructed to irrigate the local area and for
recharging groundwater and flood control. There is no endemic disease related
with water in the area. However, diseases like typhoid, Cholera, infective Hepatitis
and Diarrheal diseases, etc can easily be controlled though proper disinfection of
the treated water.
1.5.3 Environmental Impact:
Construction of this project will help in irrigating the local area along with raising the
Ground water level. Construction of this project will reduce floods. Quality of
ground water is good, so there is no fear of salinity of ground water after
construction of this project. The sediment load is heavy and annual sedimentation

I-36
of the reservoir is worked out to be about 25.78 ha-m / 100 sq km/year which is
likely to reduce live storage capacity of the reservoir. Necessary calculations have
been made on reduction of availability of water after every ten years of
sedimentation of the reservoir. Availability of water after taking in to account this
reduction of reservoir capacity has been abstract in Table No. 3.40. This problem
can partially be tackled by allowing mining from the reservoir area after each
monsoon season. Ground water is already going deep, so there is no scope of
water logging from this project, rather construction of this project would help in
recharging the already depleting ground water. This project will not submerge
mines, minerals, commercial timber and other natural resources to any appreciable
extent. As per the site conditions, no injurious minerals are likely to come under
submergence, but samples would be taken at the DPR stage to rule out presence
of such minerals.
This will be small water storage, so this is not likely to cause any transmission of
water borne diseases. Necessary steps will be taken to control growth of weeds
like Bolivia, water hyacinth, etc. This is small project, so it will not have any visible
impact on climate of the area.
Sedimentation of the reservoir will also be checked by taking measures like
preventing over grazing and cultivation of foreshore areas. This small reservoir will
not have any appreciable effect on seismicity of the area due to water load. Most of
the work will be executed through deployment of machinery, so there will not be
noticeable impact of population pressure on the project and nearby areas.
Workforce employed for the project will be provided with LPG and kerosene, so the
workforce will not cut trees for firewood.
1.5.4 Statutory Clearances:
The proposed Chikan Dam is going to be constructed on Chikan-Khol which is a
tributary of Patharal Nadi which itself is a tributary of Yamuna River. Share of water
from river is governed by the inter-state agreement of May, 1994 between 5 basin
states (now six states after formation of Uttrakhand State). Though Pathrala Nadi

I-37
feeds the Pathrala dam at Dadupur whose water is already being used by Haryana,
yet its clearance from Ministry of Water Resources & GR, Govt. of India through
CWC from interstate angle will be necessary. Client Department is requested to get
these issues thrashed out at their level in advance. It is clarified that clearance of
this project from the interstate angle will be the responsibility of the client
Department.
Client Department will take care to get clearance with respect to Forest preservation
Act, 1980 and Preservation of Land Act (PLA) – 1900 from the Forest Department.
Similarly, client Department will also get the environmental clearance at their own
level. Other clearances such as clearance from the Haryana Pollution Control Board
and clearance for shifting of utilities like roads, power lines, water supply lines,
communication cables, etc. from the concerned Departments will also be taken care
of by the client Department. Land Acquisition will be taken up by the client
Department well in time.
1.6 Cost and Tentative Estimates:
1.6.1 General Abstract of Cost:-
As per General Abstract of tentative cost based on Preliminary drawings for
planning purpose is given at 6.2(A), the total tentative estimated cost of the project
works out as Rs 24.12 crores, out of which Rs 2.01 crores is cost of land acquisition
including indirect charges and also including other overheads such as III T&P and
audit and accounts charges.
Apart from this, two more Project Costs have also been calculated, one by
excluding the Forest Diversion Cost as it is the payment from one department to
another department of Govt. of Haryana and by excluding it, cost of project works
out to be Rs. 19.56 Crores (Refer General Abstract of tentative cost given at 6.2(B))
and second by excluding the Forest Diversion and Establishment cost and in this
case project cost works out to be Rs. 17.80 Crores (Refer General Abstract of
tentative cost given at 6.2(C)).
I-38
1.6.2 Base year of the Estimated Cost:
The base year of the estimated cost of this project given in the general abstract of
cost is 2016. The estimated cost shall need suitable price escalation to make it
representative for the construction years as may be applicable from year to year.
1.6.3 Basis of quantities and rates for the tentative estimates: Basis of quantities and
rates for the tentative estimates under various major, minor and sub heads are as
under:-
A- Preliminary: This sub head However cost of Preparation of plans, detailed
design & project report and estimates (DPR), cost of Preparation of plans, detailed
Engineering Drawings and cost of Project Management Consultancy and
Construction Supervisions has not been included here as it get included in II-
Establishment.
B-Land: Collector rates for this village for ‘baren’ land have been collected from
revenue authorities of Yamuna WAPCOS take Rs. 14.00 lacs per acre and gross
rate of land works out to be Rs. 30.52 lacs per acre Including all over heads such
as payment of solarium, price escalation after notification and crop compensation,
etc. and the same have been adopted for tentative estimates. Only 6.5 Acre land is
proposed to be acquired while rest of the land to be used i.e. 70.5 Acres, belongs to
the Govt. and it has been taken free of cost. However’s HIWRD will be required to
provide equivalent land to the Forest Department for allowing diversion of forest
land. It is understood that HIWRD has enough surplus land for this purpose and
cost of this has also not been included in the cost of the project.
C-works: Construction of Chikan Dam Embankment, spillway, intake structure and
outlet works, other appurtenant works and Chikan Dam Piped Minor and Tibbi sub
piped Minors are included under this sub head. Its principle quantities have been
worked out from the preliminary drawings and present day rates have been used for
preparation of estimate. Rates of earth work, stone work and other related items
have been analyzed as per HSR with latest zonal premium and with the prevailing
tender premium.

I-39
1.7 Benefits and Financial Aspects:
1.7.1 General
Chikan Dam is a Intermediate storage dam with reference to its height and it is
basically being constructed for the following purposes:-
(i) Irrigation (Flow irrigation and Ground Water Recharge)
(ii) Flood Control
(iii) Fish farming
(iv) Recreation/Tourism
1.7.2 Irrigation Benefits:
a) Flow Irrigation Benefits: Due to construction of the dam, we shall be able to
supply water of about 4.20 cusecs for 162 days in a year which will command CCA
of 1750 Acres of the area. For the first 30 years of operation of the reservoir,
Irrigation area @ 62% of CCA work out to be 1085 Acres. The area in the Rabi shall
be 651 acres (60% of 1085 Acres) and Kharif shall be 434 acres (40% of 1085
acres). Benefits from Kharif and Rabi crops have been worked out as Rs. 27.58 lacs
and 54.00 lacs respectively. Per acre benefits from this Rabi and Kharif crops have
been taken from HIWRD being used in their NABARD funded projects.
However after 30 years of operation of the reservoir availability of water during the
depletion period would decline gradually from 4.20 to 2.65 cusecs. Whereas
availability of water during the filling period from 4th to the 10th decade will increase
from 4.20 to 6.26 cusecs which indicate that overall, volume wise, availability of
water will only marginally reduce, but more water would be available for Kharif crops
than the Rabi crops. Thus overall benefits from project will only marginally decline
with sedimentation of the reservoir after 30 years of its operation. However, Rabi
crops would start getting less water after 30 years of sedimentation with the
corresponding increase in Kharif irrigation.

I-40
b) Ground Water Recharge: Central Ground Water Board publication shows that
30% of the water that would be applied for irrigation will recharge the ground water
on the average. As stated above, presently the irrigation is being done by tubewells
only. Ground water recharge benefits will thus be proposed 30% addition and as
such 30% of the irrigation benefits for this project have been taken as ground water
benefits which works out to be Rs. 24.47 lacs.
Gross irrigation benefits for this project works out to be Rs. 106.05 Lakh.
1.7.3 Flood Control: For benefit-cost ratio, the total benefits have been considered as
33% of the Irrigation Benefits which works out to be Rs. 34.99 Lacs. However, more
detailed assessment will be made at DPR stage. By construction of the dam, the
soil erosion will be checked and the eroded land can be reclaimed in due course
which is also included in this estimated flood control benefits.
1.7.4 Fish farming: Fish Farming in the Chikan dam reservoir is expected to be quite
beneficial as it is very near to Yamunanagar and Ambala. Fisheries in the reservoir
would be developed by fisheries department and shall result in revenue earning.
Expected net revenue for fish farming in the reservoir has been taken into account
while calculating BC ratio of the project. As informed by Fishery Department,
Haryana the ponds/reservoirs in case of dams are leased out to Societies/Private
Parties. The lease money is about Rs. 20,000/- per Acre per year and this we have
taken for calculating benefits from Fish Farming. Total benefits works out to be Rs.
6.28 Lakh/-.
1.7.5 Recreation/Tourism: Construction of the dam shall invite different type of birds and
specially the cranes. As such the area can be developed by tourism department at
later date by providing tourist attraction such as bird life centuries, picnic spots,
gardens etc. as this area is very close to Chhachhrauli and Yamunanagar.
However, benefits from tourism have not been quantified.
I-41
1.7.6 Benefit Cost Ratio: B.C ratio at 5.25% rate of interest, 1% depreciation; these
project will be funded by NABARD and as informed by HIWRD, present rate of
interest charged by NABARD for HIWRD is 5.25%. Assets, interest on Capital has
been taken as 5.25% , Rs. 1175/ha as administrative charges work out to be as
under:
a. B.C. ratio with Total cost of Project of Rs. 2412 Lakh = 0.94:1
b. B.C. ratio by excluding payment to forest department for diversion i.e.
for remaining project cost of Rs. 1956 Lakh = 1.15 :1
c. B.C. ratio by excluding payment to forest department for diversion and
excluding establishment charges (as existing establishment will execute
this project) i.e. for remaining project cost of Rs. 1780 Lakh = 1.26:1
1.8 Recommendations:
On the basis of the details worked out in Section-II to VII and briefs given in
Section-I, following tentative recommendations are made on this Feasibility Report:
1. Chikan Dam is proposed to be located on a tributary of Pathrala Nadi at longitude of
77°-29’-22.5” E and latitude of 30°-22’-50” N as a 27.00 m high zoned earth dam.
2. Gross storage capacity of this dam up to FRL El. 417.10 m will be 173.27 ha-m
submerging 25.843 ha. (63.86 Acre) land up to 25 year flood elevation of 418.977
m. Another 6.0 acres land would also be needed to be acquired for the dam and its
appurtenant works apart from 3.0 acre of Land for Chikan Dam piped minors. Out of
the total 76.5 Acres of Land, 6.0 is under private ownership and the remaining land
belongs to Forest Department. The balance 67.5 acre land of the forest department
has been proposed to be taken free of cost. HIWRD would provide 70.5 Acres to
the forest department from the surplus land available with the HIWRD and no cost
of this land has been added to the project cost. Client department is requested to
bring this fact specifically to the notice of the Haryana Government.
3. Rate of sedimentation of the reservoir has been taken as 25.78 ha-m/100 sq
km/year as per compendium on silting of reservoirs issued by CWC in April, 2015
and this rate of sedimentation would reduce live storage capacity of the reservoir
I-42
from 167.02 ha-m during the Ist block of 10 year to 77.67 ha-m during the 100th
block of 10 years.
4. Proportionate availability of water yields for the monsoon period (June to Sept.) on
the basis of runoff record at Chikan works out to be 211.3 ha-m, 138.3 ha- m, 110.6
ha- m and 82.1 ha- m at 50%, 60%, 75% and 90% dependabilities respectively.
5. As per table 3.41 weighted average of the availability of water from 50%
dependability to 75% dependability for 65 days of the filling period varies from 4.20
cs to 6.26 Cs from the Ist decade to the 10th decade of operation of the reservoir
respectively. Similarly weighted average of the availability of water from 50%
dependability to 75% dependability for 97 days of the depletion period varies from
4.20 cs to 2.65 Cs from the Ist decade to the 10th decade of operation of the
reservoir respectively
6. Ground water of the area is depleting fast and construction of Chikan Dam will be
helpful in recharging the ground water.
7. Chikan- Khol outfall in Pathrala Nadi which is a tributary of River Yamuna, which is
an inter-state river, so clearance of this project from the Ministry of Water Resource
& G R, Govt. of India through CWC will be necessary from inter-state angle and this
will have to be tackled by the client Department at its own level.
8. Statutory Environmental and Forest clearances of this project will also be necessary
and these clearances would also have to be tackled by the client Department at its
own level.
9. All inter departmental issues will also have to be tackled by the client department at
its own level.
10. Tentative cost of the project is worked out in three ways as under
(i) Tentative cost of the project by taking 67.5 acre government land free of cost
and also not passing HIWRD for the 67.5 Acre land that would be needed to be
given to the forest department for the forest clearance = Rs. 24.12 crores

I-43
(ii) Cost of the project by also excluding payment to the forest department @of Rs.
16.0 lac per hectare apart from taking Govt. / HIWRD land free of cost as
proposed at (i) above = Rs 19.56 crores
(iii) Cost of the project by also excluding establishment charges apart from taking
Govt./HIWRD land free of cost and also excluding forest department payments =
Rs. 17.80 crores.
11. Chikan Dam piped minors has been proposed to irrigate the Gross Command Area
(GCA) of about 2190 acres (with CCA as 1750 Acres) covering 6 villages (Chikan,
Kalsia, Shahzadwala , Daulatpur, Dhakwala, Tibbi) using RCC pressure pipe of
class P-1 having diameter varying from 450 mm , 400, 350 and 300 mm with
maximum carrying capacity of 7.30 cusecs at the head.
12. B.C ratio at 5.25 % rate of interest these project will be funded by NABARD and as
informed by HIWRD, present rate of interest charged by NABARD for RIDF project
is 5.25%. as such, interest on Capital has been taken as 5.25%.), 1% depreciation
and Rs. 1175/ha as administrative charges work out to be as under:
d. B.C. ratio with Total cost of Project of Rs. 2412 Lakh = 0.94:1
e. B.C. ratio by excluding payment to forest department for diversion i.e.
for remaining project cost of Rs.1956 Lakh = 1.15:1
f. B.C. ratio by excluding payment to forest department for diversion and
excluding establishment charges (as existing establishment will execute
this project) i.e. for remaining project cost of Rs. 1780Lakh = 1.26:1
13. The above recommendation is B.C Ratio by including the Forest clearance cost and
establishment charges work out to be 0.94 %, whereas by excluding Forest
Department payments, B.C ratio work out to be 1.15%. Thus it is recommended that
the client Department may take decision to implement this project.

I-44
14. With the assumption that HIWRD would provide 67.5 Acre land to the forest
department free of cost from its surplus based pool .It is accordingly recommended
that the project is fit for preparing DPR.