Embed Size (px)
Citation preview

Section 9 of Ordinance 2271
Exhibit I
New Economic Opportunities Analysis, Appendix E of the Bend Comprehensive Plan

Bend Economic
Oppor tun i t ies Ana lys is Bend’s Growth to 2028
August 31, 2016

ACKNOWLEDGEMENTS City of Bend Growth Management Department Brian Rankin Wendy Robinson
Damian Syrnyk Karen Swirsky
Consultant Team ECONorthwest Bob Parker Beth Goodman
Angelo Planning Group Joe Dills Mary Dorman Becky Hewitt
Advisory Committees Residential Lands Technical Advisory Committee Kristina Barragan David Ford Stuart Hicks Andy High Allen Johnson Thomas Kemper** Katrina Langenderfer Lynne McConnell Michael O'Neil
Kurt Petrich Gary Everett Don Senecal Sidney Snyder Kirk Schueler Stacey Stemach Mike Tiller, Bend-La Pine
Schools
Laura Fritz, Bend Planning Commission (PC)
Steve Jorgensen, Bend Park & Recreation District (BPRD)*
Gordon Howard, Oregon Department of Land Conservation and Development (DLCD)*
Employment Lands Technical Advisory Committee Ken Brinich Peter Christoff Ann Marie Colucci Todd Dunkelberg Brian Fratzke Christopher Heaps Patrick Kesgard William Kuhn
Robert Lebre Dustin Locke Wesley Price** Damon Runberg Cindy Tisher Jennifer Von Rohr Ron White Joan Vinci, PC
Wallace Corwin, Bend Economic Development Advisory Board
Jade Mayer, Bend Budget Committee
Tom Hogue, DLCD*
Boundary Technical Advisory CommitteeToby Bayard Susan Brody Peter Carlson Paul Dewey John Dotson Ellen Grover Steve Hultberg Brian Meece Charlie Miller
Mike Riley John Russell Ron Ross Sharon Smith Gary Timm Rod Tomcho Robin Vora Dale Van Valkenburg Ruth Williamson
Thomas Kemper** Wesley Price** Rockland Dunn, PC Scott Edelman, DLCD* Jim Bryant, Oregon Dept.
of Transportation* Nick Lelack, Deschutes
County*
*Denotes Ex-Officio, non-voting members ** Member of Residential / Employment TAC in Phase 1, participating in Boundary TAC in Phase 2

Bend Economic Opportunities Analysis August 31, 2016
TABLE OF CONTENTS Table of Contents ..................................................................................................................... 3
Executive Summary .................................................................................................................. i
Chapter 1. Introduction ............................................................................................................ 3
Role of the EOA ..................................................................................................................... 3
Framework for an Economic Opportunities Analysis ............................................................... 5
Prior Economic Opportunities Analyses and Remand Tasks .................................................. 6
Updates to the 2008 Economic Opportunities Analysis ........................................................... 7
Chapter 2. Economic development vision and supporting policies ..................................... 8
Vision for economic development ........................................................................................... 8
Related Plans and Documents ..............................................................................................11
Chapter 3. Factors Affecting Future Economic Growth in Bend .........................................15
National, State, Regional, and Local Trends ..........................................................................15
Chapter 4. Employment Growth and Target Industries in Bend ..........................................22
Employment Forecast ............................................................................................................22
Employment Forecast by Site Size ........................................................................................25
Target Industries ...................................................................................................................29
Site Needs for Target Industries ............................................................................................29
Chapter 5. Employment Land Sufficiency and Site Needs ...................................................48
Buildable Employment Land Inventory and Land Capacity ....................................................48
Capacity of Employment Land in the Bend UGB to Accommodate New Employment ...........51
Conclusions ...........................................................................................................................65
Appendix A. National, State, Regional, County, and Local Trends Affecting Future Economic Growth ...................................................................................................................66
State, Regional, and Local Trends .........................................................................................66
Bend’s Competitive Advantages ............................................................................................89
Appendix B. Employment Projections ...................................................................................94
Methods ................................................................................................................................94
Employment Projections ........................................................................................................96
Appendix C. Remand Directives .......................................................................................... 106
Appendix D. Methods for Justification of a Redevelopment Assumption for Employment Lands ..................................................................................................................................... 109

Bend Economic Opportunities Analysis August 31, 2016
Background ......................................................................................................................... 109
What does the Remand require? ......................................................................................... 110
Study Areas ......................................................................................................................... 110
Methods .............................................................................................................................. 112
Findings ............................................................................................................................... 116

Bend Economic Opportunities Analysis August 31, 2016 Page 1 of 122
EXECUTIVE SUMMARY An Economic Opportunities Analysis (EOA) is a technical analysis that projects trends, but it is also an aspirational economic development tool that identifies the land needs to achieve the type of employment that the community desires. Thus, it is important to have a vision for what type of city Bend wants to be in the future.
Over the past decade, Bend has continued to fulfill its promise as a forward-looking community by developing several broad policies and visions that will guide growth in the city and region, including the General Plan and Bend 2030. These are complemented by planning documents such as the Juniper Ridge Concept Plan, Economic Sector Targeting report, and others. Key elements of the vision include:
• Targeted Industries. Identify “target industries” that match community attributes and provide job opportunities over the long term.
• Living Wage Jobs. Increase employment in its targeted industries, too many jobs may be in the retail services and other relatively low-paying sectors.
• Available Industrial and Commercial Lands. Ensure that there is enough land to accommodate future jobs and businesses.
• Diversified Economy. Continue to diversify from a wood products and tourism-oriented economy to a more resilient economy that provides professional service, high-skill manufacturing, high-tech, and other living wage jobs.
• Sustainable Industries. Attract and retain businesses that maintain the high-quality natural environment.
• Establish a university and research center. Such an institution could have a dramatic positive impact on the workforce by training the next generation of Central Oregonians and visiting students to participate in a diversified economy.
Bend’s role as a social and cultural center is an important consideration as a driver of economic growth. Bend’s high quality cultural and natural amenities are repeatedly cited by business owners and employees as reasons to relocate to or remain in Bend.
Bend forecasts that employment will grow by 22,891 employees (about 61%) over the 20 year period between 2008 and 2028, at an average annual growth rate of 2.4%. Employment in Bend increased by 948 between 2008 and 2013; thus, the City forecasts 21,943 new employees between 2013 and 2028. Based on site requirements of target employers, Bend will need 726 sites less than five acres and 32 sites greater than five acres to accommodate new employment forecast for the 2013-2028 period.
Bend has about 1,000 acres of vacant employment land (Bend Buildable Land Inventory, 2016). More than one-quarter of Bend’s vacant employment land is in sites smaller than 5 acres, about one-third is on sites 5 to 50 acres, and more than one-third is in sites larger than 50 acres.
Bend has capacity to accommodate about 13,623 employees within the Urban Growth Boundary under existing policies. Under current policies, Bend needs land to accommodate an additional 8,317 employees on 267 sites smaller than five acres and 13 sites greater than five

Bend Economic Opportunities Analysis August 31, 2016 Page 2 of 122
acres. It also concludes that 25% of Bend’s total employment land supply meets the Goal 9 definition of short-term supply.
The Bend Urbanization Report (2016) documents land use efficiency measures (e.g., policies that increase density or redevelopment) that the City plans to implement to reduce the deficit of employment land. Bend can accommodate an estimated 1,045 additional jobs through increases in land use efficiency.
Bend will need to accommodate 7,215 employees through expansion of the City’s urban growth boundary. The Bend Urbanization Report concludes that 67% of Bend’s employment growth will be accommodated within the UGB on vacant lands and through the efficiency measures.
Bend Economic Opportunities Analysis August 31, 2016 Page 3 of 122
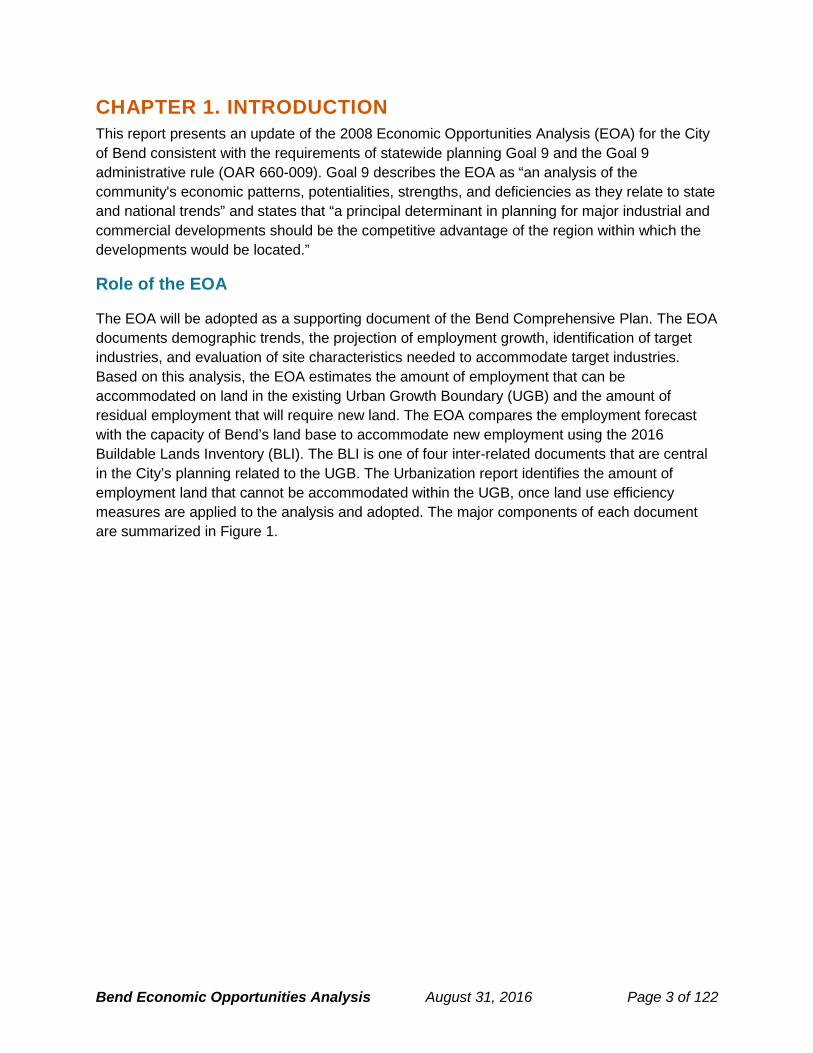
CHAPTER 1. INTRODUCTION This report presents an update of the 2008 Economic Opportunities Analysis (EOA) for the City of Bend consistent with the requirements of statewide planning Goal 9 and the Goal 9 administrative rule (OAR 660-009). Goal 9 describes the EOA as “an analysis of the community's economic patterns, potentialities, strengths, and deficiencies as they relate to state and national trends” and states that “a principal determinant in planning for major industrial and commercial developments should be the competitive advantage of the region within which the developments would be located.”
Role of the EOA
The EOA will be adopted as a supporting document of the Bend Comprehensive Plan. The EOA documents demographic trends, the projection of employment growth, identification of target industries, and evaluation of site characteristics needed to accommodate target industries. Based on this analysis, the EOA estimates the amount of employment that can be accommodated on land in the existing Urban Growth Boundary (UGB) and the amount of residual employment that will require new land. The EOA compares the employment forecast with the capacity of Bend’s land base to accommodate new employment using the 2016 Buildable Lands Inventory (BLI). The BLI is one of four inter-related documents that are central in the City’s planning related to the UGB. The Urbanization report identifies the amount of employment land that cannot be accommodated within the UGB, once land use efficiency measures are applied to the analysis and adopted. The major components of each document are summarized in Figure 1.

Bend Economic Opportunities Analysis August 31, 2016 Page 4 of 122
Figure 1. Four Key Planning document for Bend’s UGB Planning
Document Buildable Land Inventory (BLI)
Housing Needs Analysis (HNA)
Economic Opportunities Analysis (EOA) Urbanization Report (UR)
Purpose Identify buildable residential & employment land by category
Address the requirements for planning for needed housing, including analysis of national, state, and local demographic and economic trends, and recommendations for a mix and density of needed housing types
Document historical housing and demographic trends, the projection of employment growth, identification of target industries, and evaluation of site characteristics needed to accommodate target industries
Analysis of where and how Bend’s future growth will be accommodated, both inside the existing Urban Growth Boundary (UGB) and in expansion areas
Primary Legal Standards1
ORS 197.296 OAR 660, Divisions 8 and 9
Statewide Planning Goal 10: Housing ORS 197.296 and 197.303 OAR 660, Division 8
Statewide Planning Goal 9: Economic Development OAR 660, Division 9
Statewide Planning Goal 14: Urbanization ORS 197.298 OAR 660, Division 24
Key Subject Matter
Development status categories and definitions Methodology for assigning categories and conducting inventory Inventory results: acres by plan designation and development status
Projection of population and total housing growth Housing market and development trends Demographic characteristics and trends Analysis of affordability Estimate of needed housing (mix and density) Comparison of housing capacity to need
Existing policy and vision National, state, local trends Employment projections Target industries Site needs and characteristics Special site needs Redevelopment analysis Comparison of employment capacity to need and characteristics
Methodology for capacity estimates Pre-policy (“base case”) capacity estimate for current UGB Efficiency measures (EMs) proposed Current UGB capacity with EMs UGB alternatives evaluation methodology and results Proposed UGB expansion and summary of Goal 14 evaluation results
1 OAR = Oregon Administrative Rules; ORS = Oregon Revised Statutes

Bend Economic Opportunities Analysis August 31, 2016 Page 5 of 122
Framework for an Economic Opportunities Analysis
This EOA is built around the requirements contained in Oregon’s Statewide Planning Goals 9 and 14 and Oregon Administrative Rules (OAR), Division 9.
Goal 9: Economic Development, aspires to “provide adequate opportunities throughout the state for a variety of economic activities vital to the health, welfare, and prosperity of Oregon’s citizens.” It requires city comprehensive plans to “contribute to a stable and healthy economy” by analyzing economic “patterns, strengths, and weaknesses”, contain economic development policies, and provide at least an adequate supply of economic lands.
Goal 14: Urbanization, seeks to “provide for an orderly and efficient transition from rural to urban land use, to accommodate urban population and urban employment inside urban growth boundaries, to ensure efficient use of land, and to provide for livable communities.” Goal 14 directs cities to establish urban growth boundaries which contain urban levels of development and prevent urbanization of nearby rural lands. Goal 14 requires cities to establish UGBs based on residential land needs to serve a 20-year population as well as provide opportunities for employment, parks, schools, public facilities, and necessary public infrastructure. Prior to expanding a UGB a city must demonstrate that “needs cannot reasonably be accommodated on land already inside the urban growth boundary.”
The analysis in this report is designed to conform to the requirements for an Economic Opportunities Analysis in OAR 660-009 as amended.
1. Economic Opportunities Analysis (OAR 660-009-0015). The Economic Opportunities Analysis requires communities to identify the major categories of industrial or other employment uses that could reasonably be expected to locate or expand in the planning area based on information about national, state, regional, county or local trends; identify the number of sites by type reasonably expected to be needed to accommodate projected employment growth based on the site characteristics typical of expected uses; include an inventory of vacant and developed lands within the planning area designated for industrial or other employment use; and estimate the types and amounts of industrial and other employment uses likely to occur in the planning area. Local governments are also encouraged to assess community economic development potential through a visioning or some other public input based process in conjunction with state agencies.
2. Industrial and commercial development policies (OAR 660-009-0020). Cities with a population over 2,500 are required to develop commercial and industrial development policies based on the EOA. Local comprehensive plans must state the overall objectives for economic development in the planning area and identify categories or particular types of industrial and other employment uses desired by the community. Local comprehensive plans must also include policies that commit the city or county to designate an adequate number of employment sites of suitable

Bend Economic Opportunities Analysis August 31, 2016 Page 6 of 122
sizes, types and locations. The plan must also include policies to provide necessary public facilities and transportation facilities for the planning area.
3. Designation of lands for industrial and commercial uses (OAR 660-009-0025). Cities and counties must adopt measures to implement policies adopted pursuant to OAR 660-009-0020. Appropriate implementation measures include amendments to plan and zone map designations, land use regulations, public facility plans, and transportation system plans. More specifically, plans must identify the approximate number, acreage and characteristics of sites needed to accommodate industrial and other employment uses to implement plan policies, and must designate serviceable land suitable to meet identified site needs.
This report is an Economic Opportunities Analysis, the first key element required by Goal 9. This EOA includes an analysis of national, state, regional, and county trends as well as an employment forecast that leads to identification of needed development sites. It also includes an inventory of buildable commercial and industrial land in the Bend UGB. It partially addresses the requirements of Goal 14 to determine if future needs can be accommodated on land already inside the UGB. Further evaluation of the capacity of lands within the UGB to accommodate employment and the impact of “land use efficiency” measures is presented in the Bend Urbanization Report.
This report primarily reflects a “pre-policy” evaluation of employment land need in Bend for the 2008-2028 period. In this context, pre-policy means that it reflects base conditions and assumptions and does not include evaluations of land use efficiency measures as required by OAR 660-024-0050 and the Remand. It provides an evidentiary basis for the analysis contained in this report. Chapter 6 identifies other analysis necessary to comply with OAR 660-024 and the Remand. This additional analysis is presented in Bend Urbanization Report (2016), which addresses Goal 14 requirements and other issues in the Remand that are not addressed in this report. This report presents key results from analysis in the Bend Urbanization Report, which accounts for the analysis of the impact on land use efficiency measures on employment land sufficiency.
Prior Economic Opportunities Analyses and Remand Tasks
This EOA examines Bend’s recent employment and land development trends and projects future employment and employment land needs. This is an update of the 2008 EOA that (1) addresses issues identified in the Remand, (2) addresses economic activity that occurred between 2008 and 2013, and (3) reflects input received from the Bend Employment Technical Advisory Committee (Employment TAC) and the Urban Growth Boundary Steering Committee (USC).
The EOA update is a technical document compliant with Goal 9 and OAR 660-009 that supports the 2016 Urban Growth Boundary (UGB) expansion. This EOA uses the 2008 EOA adopted by the City of Bend as a foundation because the key findings of the 2008 EOA were found to meet Goal 9 by the Land Conservation and Development Commission (LCDC). The information and conclusions of the updated EOA are the basis for determination of employment land sufficiency for the 2008-2028 period. This EOA collects the most recent work on economic land need for

Bend Economic Opportunities Analysis August 31, 2016 Page 7 of 122
the City of Bend, addresses issues identified in the 2010 Remand Order, and incorporates direction from the Employment Technical Advisory Committee (TAC) and the Bend Urban Growth Boundary Steering Committee (USC). The issues identified as requiring changes in the 2008 EOA in the January 2010 Director’s Report and Order are described in Appendix C.
An important consideration for the EOA update is that it must address issues identified in the Remand and partial acknowledgement of a decision made in December 2008. A key issue is the planning horizon for the project. The EOA uses the 2008-2028 timeframe, but updates key elements of the EOA to reflect changes that have occurred since 2008. The updated EOA relies on the 2008-2028 employment forecast and the 2008 buildable land inventory that was acknowledged by the Land Conservation and Development Commission’s (LCDC) remand order. The EOA updates the 2008 buildable land inventory to 2014 to reflect development that occurred in Bend between 2008 and 2014. The EOA also analyzes changes in employment between 2008 and 2013 to deduct employment that already occurred from the 2008-2028 forecast.
Updates to the 2008 Economic Opportunities Analysis
This EOA incorporates key information from the 2008 adopted EOA, such as the forecast of new employment for the 2008-2028 period. This analysis addresses the Remand issues identified for the 2008 EOA, as described in Appendix C.
This EOA uses two periods of time for historical analysis and for the forecast of employment need:
• Planning Period. Goal 9 and OAR 660-009 requires the City to ensure a 20-year supply of buildable land for economic development and employment growth. For this EOA, the 20-year period begins in 2008 and ends in 2028.
• Extended Trend Period. The EOA was originally developed with data available up to 2008. This EOA extends the trend data to include data available between 2008 and 2013. This additional data provides information about changes in Bend’s economy since 2008.

Bend Economic Opportunities Analysis August 31, 2016 Page 8 of 122
CHAPTER 2. ECONOMIC DEVELOPMENT VISION AND SUPPORTING POLICIES Sound economic development planning originates from a clear vision and is implemented through goals, strategies and actions. Goal 9 focuses on one element of an economic development strategy: land use. Specifically, one objective of Goal 9 is for cities to “provide for at least an adequate supply of sites of suitable sizes, types, locations, and service levels for a variety of industrial and commercial uses consistent with plan policies.”
The EOA is not a statement of Bend’s economic development vision or policies, it builds from and informs the vision and policy direction of the City. This chapter summarizes Bend’s economic development vision and key policies related to economic development. It provides a comprehensive summary of community visioning efforts, including visioning efforts lead by the City of Bend and other efforts that were not lead by the City of Bend.
Vision for economic development
An EOA is a technical analysis that projects trends, but it is also an aspirational economic development tool that identifies the land needs to achieve the type of employment that the community desires. Thus, it is important to have a vision for what type of city Bend wants to be in the future. Bend has completed a number of visioning and planning exercises that clarify how it wants to grow. The following sections summarize the key points from these efforts and identify how they serve as guideposts in this EOA.
Over the past decade, Bend has continued to fulfill its promise as a forward-looking community by developing several broad policies and visions that will guide growth in the city and region, including the General Plan and Bend 2030. These are complemented by planning documents such as the Juniper Ridge Concept Plan, Economic Sector Targeting report, and others.
Bend 2030 The report “Bend 2030: A Visioning Project by and for the People of Bend Oregon,” articulates a vision for the future of the community.2 These goals do not represent formal policies or goals that have been adopted by the City of Bend; rather, they express the community’s values based on a visioning process. Bend 2030 is being implemented by a nonprofit organization (called Bend 2030). This visioning was conducted in 2006. The vision identifies six primary goals:
• A Well-Planned City • A Vibrant Economy • A Quality Environment • Safe, Healthy People • A Strong Community • A Creative, Learning Culture
2 See www.bend2030.org

Bend Economic Opportunities Analysis August 31, 2016 Page 9 of 122
Within those six broad goals, Bend 2030 identifies more specific objectives. The following objectives identified in Bend 2030 are most relevant to the EOA:
• Targeted Industries. The city has identified a number of “target industries” in which it can excel and provide job opportunities over the long term.
• Living Wage Jobs. If Bend is unable to sufficiently increase employment in its targeted industries, too many jobs may be in the retail services and other relatively low-paying sectors.
• Available Industrial and Commercial Lands. This objective is perfectly aligned to the purpose of this report – to ensure that there is enough land to accommodate future jobs and businesses, and the buildings and land they will occupy.
• Diversified Economy. This objective overlaps considerably with “targeted industries.” Bend must continue to diversity from a wood products and tourism-oriented economy to a more diversified one that provides professional service, high-skill manufacturing, high-tech, and other living wage jobs.
• Sustainable Industries. Bend seeks to attract and retain businesses that maintain the high-quality natural environment.
• Establish a university and research center. There is broad support in the community for a high-quality university in Bend. Such an institution could have a dramatic positive impact on the workforce by training the next generation of Central Oregonians and visiting students to participate in a diversified economy.
Bend’s General Economic Objectives State law requires a city to adopt policies stating Bend’s community economic development objectives (OAR 660-009-0020). While this EOA does not, nor is it intended to, fully comply with the requirements of OAR 660-009-0020,3 this EOA partially addresses this objective by bringing together concepts in Chapter 6 of the Bend Comprehensive Plan (Economic Development), statements in recent economic visioning projects, Bend’s economic advantages, and Bend’s recent economic growth trends.
The following expression of Bend’s economic development objectives is from the “Bend 2030, A Visioning Project by and for the People of Bend, Oregon”. This narrative is considered in the EOA, and is implemented through policies of the Comprehensive Plan, and represents the City’s general economic development objectives.
“Bend has a diversified economy that provides healthy work environments and sufficient living wage jobs to support our local population. Our economic vision has attracted people, resources, and investment focused on diverse industries that offer economic opportunity, longevity in the global market, and a clean and sustainable environment. Bend is a leader in ‘green’ building materials and technology, and sustainable energy. An established university and research center in Bend promote creativity, innovation, and entrepreneurship that empower and advance a skilled and competitive local
3 The policies adopted as part of the revised Economic Element of the Bend Comprehensive Plan will fully comply with the requirements of OAR 660-009-0020.

Bend Economic Opportunities Analysis August 31, 2016 Page 10 of 122
workforce. Our access to the global marketplace is efficient and viable due to enhancements of local and regional communications and transportation systems including air, rail, highways, and alternative modes of travel.”
The city is required to identify particular types of desirable employment to develop during the planning period as part of the general economic objective. The following list reflects desirable employment uses identified in the “2030 Vision” as well as employment types Bend is well positioned to continue to grow into the future:
1. Employment in downtown Bend – opportunities for businesses, shops, restaurants, and housing should be expanded while preserving downtown’s unique character.
2. Employment in targeted industries – the “2030 Vision” suggests expanding employment opportunities in industries identified as “target industries” by the “2005 Economic Sector Targeting” exercise. Target industries include:
a. Leisure and hospitality uses b. Higher education c. Health care d. Secondary wood products e. Aviation-aerospace f. Renewable energy resources g. Recreation equipment h. Specialty manufacturing i. Information technologies
3. Employment in tourism – the “2030 Vision” supports building year-round tourism through
developing a diverse mix of arts, entertainment, sports, and natural and cultural attractions. Projects to improve employment in the tourism industry include constructing a new performing arts center and museum of fine arts.
4. Employment in higher education – higher education enables and provides diverse employment options. The “2030 Vision” supports the Central Oregon Community college and a new University. The University should ideally provide an attractive learning environment, include a research emphasis, offer graduate programs and scholarship opportunities, and serve existing residents while attracting a diverse student body.
5. Small neighborhood centers – small service-oriented employment centers should be located so the city’s residents can walk or bike to employment opportunities, public gathering places, parks, recreational facilities, and other services.
6. Mixed-use development – these uses should be located along key corridors and in designated centers, or as buffering uses.
7. Opportunity for all economic levels – the “2030 Vision” promotes economic and housing opportunities for all income levels so that all groups are able to live here.
8. In addition to economic uses stated in the “2030 Vision” and “2005 Economic Sector Targeting” work, the following economic uses are desirable and suitable to expand during the planning period based on the findings of the EOA:
a. Regional employment centers for public agencies, health care providers, and retail uses

Bend Economic Opportunities Analysis August 31, 2016 Page 11 of 122
b. Employment in professional office and service uses c. Employment in leisure and hospitality uses
Related Plans and Documents
Several plans and studies inform the EOA and the City’s economic development vision. This section summarizes key elements of those plans and studies.
General Plan The Bend Area General Plan (the name will be changed to the Bend Comprehensive Plan with UGB adoption), as with the Bend 2030 Vision, is intended to guide the city’s long-term land use and transportation planning. The narrative aspect of the General Plan – particularly Chapter 6, “The Economy and Lands for Economic Growth” - offers a perspective similar to both Bend 2030 and the Employment Land Study (ELS) on Bend’s employment future.
The General Plan underwent a major update in 1998 and has since been revised periodically. The plan plays a major role in shaping Bend’s “employment geography” by guiding the size and shape of the city’s various employment districts, including commercial, industrial, and mixed-employment zones. The use and disposition of each zone is further detailed in the city’s Development Code, which implements the General Plan. Amendments to the Bend Comprehensive Plan associated with the Remand contain specific policies related to the aforementioned vision statements, and key findings of this EOA.
Juniper Ridge Concept Plan The Juniper Ridge Concept Plan represents an initial attempt by Bend to shape its vision for the 1,500-acre publicly owned parcel on the city’s north border (495 acres of which, is included in the current UGB). Since the inception of the Juniper Ridge planning process, it has been clear that because of its size, location, and city ownership, the site had the potential to play a major role in Bend’s economic future, by providing the area for future businesses to locate. The specifics contained in the Concept Plan will almost certainly undergo major and minor changes over its long implementation period, but the city hopes to stay true to the plan’s underlying visions and aspirations. The Concept Plan has not been officially adopted by the City, but provides a vision for the site. Because it has not been adopted, the EOA does not rely on any of the information for the land need and technical elements required by OAR 660-009-0015.
Based on direction from the Bend City Council, the Plan proposes that the site’s development be driven by several primary uses:
• Light-Industrial Research Park
• Educational Research and Technology Campus
• Mixed-use areas
• Residential areas

Bend Economic Opportunities Analysis August 31, 2016 Page 12 of 122
Primarily due to the first two uses listed above, Juniper Ridge is seen as a key part of Bend’s economic development strategy, as it will provide land on which the city’s targeted industries can grow.
Approximately one third of Juniper Ridge’s total area – 494 acres called Juniper Ridge Phase 1 – is currently within Bend’s UGB and designated light industrial in the General Plan. About 306 acres of this area is within the Juniper Ridge Employment Sub-District, which is intended to promote economical, sustainable, and reasonable growth by allowing a mix of light industrial uses, offices for research and development, corporate and regional headquarters and accessory uses to serve the needs of these primary uses. The types and placement of the employment uses allowed in the Employment Sub-District are generally consistent with the conceptual master plan. At this time there are two businesses located in Juniper Ridge: Les Schwab corporate office, and Suterra.
About 194 additional acres are within the UGB and long-range plans for this area have not yet been developed. The General Plan designation for this area is Light Industrial.
Infrastructure planning for the portion of Juniper Ridge within the UGB is underway.4 The City has plans for infrastructure upgrades needed within the Employment Sub-District, for transportation, water, and sewer. Funding for some infrastructure improvements, especially the transportation improvements for the 194 additional acres within the UGB, has not yet been identified. The remaining 194 acres of land at Juniper Ridge is proposed to remain Light Industrial, including a large-lot industrial site, but may require more planning to determine an appropriate zone and develop infrastructure plans and identify funding sources for needed infrastructure.
Development at Juniper Ridge, however, is constrained by transportation and wastewater infrastructure. Key constraints include a trip cap imposed on the site by ODOT and lack of wastewater facilities. The City is actively working on both of these infrastructure constraints. With respect to wastewater capacity, development will be limited until the Northeast Interceptor is developed. The project is currently scheduled for years 11-20 in the recently adopted (December 2014) City of Bend Collection System Master Plan. Decisions on wastewater rates in 2016 and early 2017 may lead to advancing this project sooner than the adopted master plan.
The remaining approximately 1,000 acres is referred to in this document as Juniper Ridge Phase 2, despite the fact that the project may have many more phases before completion. The areas outside the UGB are not included in the buildable land inventory and are not considered suitable employment lands for the purpose of this EOA.
4 For more detail about Juniper Ridge planning and infrastructure, see the memorandum “Juniper Ridge: background, location, zoning, infrastructure, and related issues” dated April 24, 2015.

Bend Economic Opportunities Analysis August 31, 2016 Page 13 of 122
Deschutes County Coordinated Population Forecast The Deschutes County Coordinated Population Forecast was finalized in 2004 by county and city staff, project consultants, and a broad range of stakeholders.5 The population projections identified in their findings are used in this report as a factor considered in the employment projections, the Residential Lands Study, and the other studies undertaken by Bend and Deschutes County referenced below.
Economic Sector Targeting In 2005, city staff and a broad group of economic stakeholders took part in an Economic Sector Targeting process, which included several daylong workshops and ultimately a report. Through this analysis, the city identified nine different industry sectors in which it should concentrate its efforts to retain existing businesses and attract new ones. The sectors were chosen due to a number of different criteria, including an existing industry cluster already in Bend; significant growth opportunity; living wage job potential; and likelihood for sustainable business practices. The group developed a set of nine targeted industries, including industries such as higher education, health care, renewable energy resources, and aviation-aerospace. The full list of target industries is discussed in more detail in Chapter 4.
Due to the city’s clear policy direction on targeted industries, and anticipated ongoing effort to attract them, the EOA’s projections reflect greater employment increases within these sectors as reflected in the employment projections approved by the Remand.
The focus on targeted industries also has implications for the type of land and other public infrastructure that the city will need to supply in the future. For example, information technology firms will be more likely to locate in commercial, rather than industrial land.
Visit Bend Business Plan6 Bend receives 2.4 million visits annually. According to Visit Bend, this travel and tourism activity generated an estimated 8,500 jobs in the region and provided the City with $3.7 million in transient room tax revenue in 2014. The vast majority of this tourist activity occurs during the summer.
Visit Bend, a Bend-area tourism advocate, outlined a series of strategic objectives to support the tourism industry in their budget for the 2015 fiscal year. Among the most important issues to address, Visit Bend identified the seasonal variation in tourism and the decline in business that it causes during the off-season: “Despite the sustained growth in Bend’s tourism industry, our destination continues to face an unhealthy drop in business during the shoulder seasons and winter months.”
In order to reduce the industry’s seasonality, and work to address other goals in support of Bend tourism, the report listed metrics to track how well the industry has improved, and identified multiple strategic actions for the upcoming year. For example, metrics included the rate of 5 http://www.deschutes.org/cd/page/coordinated-population-forecast-2025
6 http://issuu.com/visitbendor/docs/visit-bend-business-plan-2015-webre

Bend Economic Opportunities Analysis August 31, 2016 Page 14 of 122
citywide lodging occupancy, the number of visitor guide requests, and volume of transient room tax collections, among others. The report also identified strategic actions, such as increased investment in Bend’s brand, improved connections with news media, and more citywide events and conventions. Visit Bend is also working to increase the region’s offerings of non-outdoor recreation attractions, with a focus on cultural amenities.
Supporting Studies Other planning efforts inform the EOA, including planning for housing growth and infrastructure systems, such as:
• Bend Housing Needs Analysis – 2016. This report forecasts Bend’s housing growth through 2028, describing likely changes in the types of housing needed in Bend.
• Water System Master Plan - 2011 Update (Optimization Study). This report covers level of service goals, present and future deficiencies, assessment of fire flow capacity in the system and the results of a comprehensive analysis using an optimized decision support process to evaluate alternatives that address system deficiencies now and in the future. The results of this study are a recommended set of system improvements to meet the needs of Bend’s water system for at least 20 years.
• Water Management and Conservation Plan – 2011. The purpose of the Plan is to guide the development, financing, and implementation of water management and conservation programs and policies to ensure sustainable use of publicly owned water resources while the City plans for its future water needs.
• Collection System Master Plan – 2014. The Wastewater Collection System Master Plan (CSMP) is a 20-year critical planning document that establishes a clear vision for Bend's community's sewer collection system, a vital framework beneath the City. The CSMP identifies both short term and long-term system improvements that are needed to address existing condition, existing capacity, and future capacity issues.
• Water Reclamation Facility Plan. This plan outlines several cost-effective solutions for increasing the plant’s ability to meet projected wastewater flows through the year 2030.
• Stormwater Master Plan. In 2014. Bend approved the City's first formal Stormwater Master Plan. The Stormwater Master Plan serves as the oversight plan for addressing stormwater quantity and quality issues. In addition to providing an overall strategy for addressing stormwater concerns, it provides a delineation of drainage areas and runoff quantities throughout Bend, and programmatic goals for addressing quantity and quality concerns.
• Bend Urban Area Transportation Plan. This plan guides development of Bend’s transportation system to meet the forecast needs of the Bend community to 2032 and beyond. The plan provides a policy and plan framework to allow Bend to design a balanced transportation system over time.
Bend Economic Opportunities Analysis August 31, 2016 Page 15 of 122
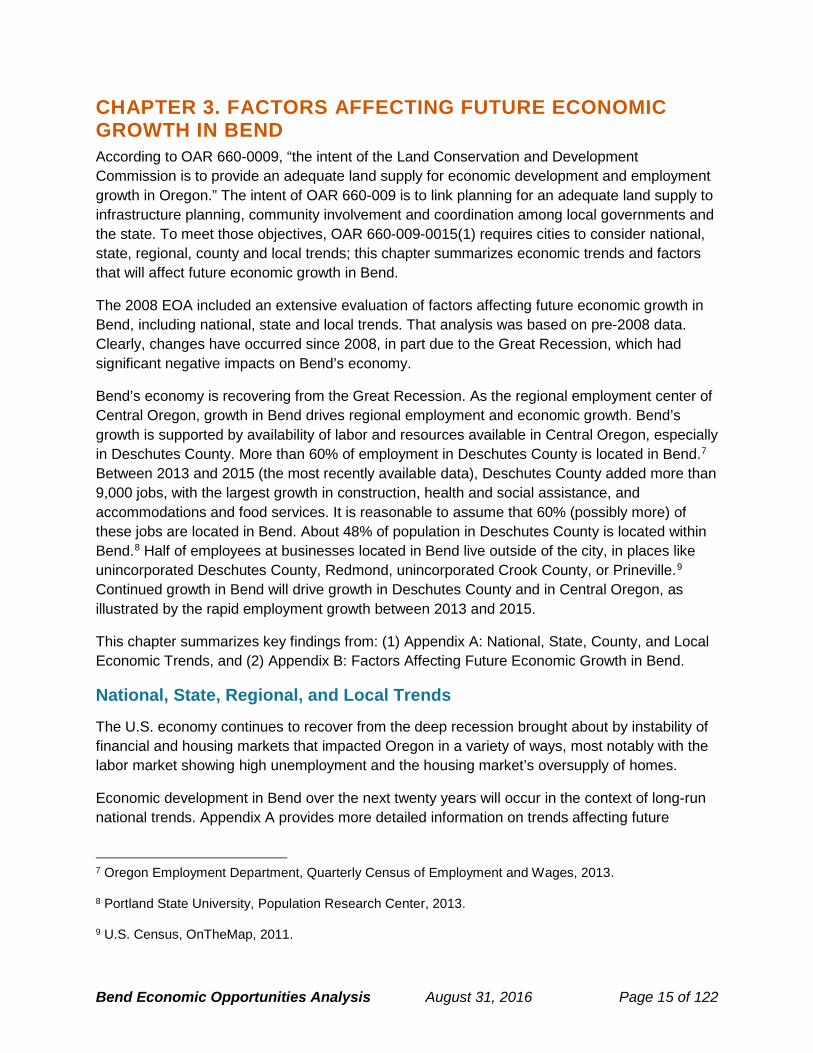
CHAPTER 3. FACTORS AFFECTING FUTURE ECONOMIC GROWTH IN BEND According to OAR 660-0009, “the intent of the Land Conservation and Development Commission is to provide an adequate land supply for economic development and employment growth in Oregon.” The intent of OAR 660-009 is to link planning for an adequate land supply to infrastructure planning, community involvement and coordination among local governments and the state. To meet those objectives, OAR 660-009-0015(1) requires cities to consider national, state, regional, county and local trends; this chapter summarizes economic trends and factors that will affect future economic growth in Bend.
The 2008 EOA included an extensive evaluation of factors affecting future economic growth in Bend, including national, state and local trends. That analysis was based on pre-2008 data. Clearly, changes have occurred since 2008, in part due to the Great Recession, which had significant negative impacts on Bend’s economy.
Bend’s economy is recovering from the Great Recession. As the regional employment center of Central Oregon, growth in Bend drives regional employment and economic growth. Bend’s growth is supported by availability of labor and resources available in Central Oregon, especially in Deschutes County. More than 60% of employment in Deschutes County is located in Bend.7 Between 2013 and 2015 (the most recently available data), Deschutes County added more than 9,000 jobs, with the largest growth in construction, health and social assistance, and accommodations and food services. It is reasonable to assume that 60% (possibly more) of these jobs are located in Bend. About 48% of population in Deschutes County is located within Bend.8 Half of employees at businesses located in Bend live outside of the city, in places like unincorporated Deschutes County, Redmond, unincorporated Crook County, or Prineville.9 Continued growth in Bend will drive growth in Deschutes County and in Central Oregon, as illustrated by the rapid employment growth between 2013 and 2015.
This chapter summarizes key findings from: (1) Appendix A: National, State, County, and Local Economic Trends, and (2) Appendix B: Factors Affecting Future Economic Growth in Bend.
National, State, Regional, and Local Trends
The U.S. economy continues to recover from the deep recession brought about by instability of financial and housing markets that impacted Oregon in a variety of ways, most notably with the labor market showing high unemployment and the housing market’s oversupply of homes.
Economic development in Bend over the next twenty years will occur in the context of long-run national trends. Appendix A provides more detailed information on trends affecting future
7 Oregon Employment Department, Quarterly Census of Employment and Wages, 2013.
8 Portland State University, Population Research Center, 2013.
9 U.S. Census, OnTheMap, 2011.

Bend Economic Opportunities Analysis August 31, 2016 Page 16 of 122
economic growth and is intended to support the analysis required by OAR 660-009-0015(1). The most important of these trends are summarized in Table 1 and include:
Table 1. Implications of national, state, and regional economic and demographic trends on economic growth in Bend
National, State, and Regional Economic Trends
Implications for economic growth in Bend
Moderate growth rates and recovery from the national recession
According to the National Bureau of Economic Research, "The Great Recession" ended in 2009, but sluggish growth continued to affect businesses and workers alike for several years after. 10
Unemployment at the national level has gradually declined since the height of the recession.11 Unemployment rates in Oregon and Deschutes County are typically higher than those of the nation as a whole. 12
The federal government’s economic forecast projects a moderate pace of economic growth, with gradual increases in employment and real GDP (roughly 3% through the end of 2016). Economic growth in Oregon typically lags behind national growth. 13
Economic growth in Bend – in measures such as employment growth, unemployment rates, and wage growth - will be markedly improved from previous years (i.e. since 2007).
Between 2013 and 2015 employment in Deschutes County grew by more than 9,100 jobs, a 14% increase. The sectors with the largest growth were construction, health and social assistance, and accommodations and food services. Given that 60% of Deschutes County’s jobs are located in Bend, it is reasonable to assume that percentage (possibly more) of new employment was in Bend.
The rate of employment growth in Bend will depend, in part, on the rate of employment growth in Oregon and the nation. Bend’s primary competitive advantages, location, access to regional transportation infrastructure, quality of life, and access to educated and skilled labor from within the region make Bend attractive to companies that want to grow, expand, or locate in the Central Oregon.
10 “US Business Cycle Expansions and Contractions,” The National Bureau of Economic Research, http://www.nber.org/cycles.html. 11 Nelson D. Schwartz, “US Economy Adds 223,000 Jobs; Unemployment at 5.3%,” The New York Times, July 2, 2015, http://www.nytimes.com/2015/07/03/business/economy/jobs-report-hiring-unemployment-june.html?_r=0. 12 “Local Area Unemployment Statistics,” State of Oregon Employment Department, https://www.qualityinfo.org/ed-uesti/?at=1&t1=0000000000,4101000000~unemprate~y~2000~2015. 13 “The Budget and Economic Outlook: 2015 to 2025,” January 2015, Congressional Budget Office, https://www.cbo.gov/sites/default/files/cbofiles/attachments/49892-Outlook2015.pdf.

Bend Economic Opportunities Analysis August 31, 2016 Page 17 of 122
National, State, and Regional Economic Trends
Implications for economic growth in Bend
Growth of service-oriented sectors
Increased worker productivity and the international outsourcing of routine tasks led to declines in employment in the major goods-producing industries. Projections from the Bureau of Labor Statistics indicate that U.S. employment growth will continue to be strongest in healthcare and social assistance, professional and business services, and other service industries. Construction employment will grow with the economy, but manufacturing employment will decline. These trends are also expected to affect the composition of Oregon’s economy, though Oregon’s manufacturing employment may grow in the short-run. 14
The changes in employment in Deschutes County have followed similar trends as changes in national and state employment. For example, since 2001, employment in Deschutes County Health Care and Social Assistance increased its share of total employment by 4.4%, while Manufacturing’s share decreased by -3.8% as a result in decreases in wood products manufacturing.
The Oregon Employment Department forecasts that the sectors likely to have the most employment growth in Deschutes County over the 2012 to 2022 period are: Construction, Health Care, Local and State Government, Retail Trade, Professional and Business Services, and Accommodation and Food Services. These sectors represent employment opportunities for Bend.
Lack of diversity in Oregon’s economy
Oregon’s economy has diversified since the 1960’s, but Oregon continues to rank low in economic diversity among states.
These rankings suggest that Oregon is still heavily dependent on a limited number of industries. Relatively low economic diversity increases the risk of economic volatility as measured by changes in output or employment.
Data from the Bureau of Labor Statistics shows that employment in Deschutes County in 2013 was concentrated in a few sectors: Health Care and Social Assistance (15%), Retail Trade (15%), Accommodations and Food Services (13%), and Government (13%). Between 2013 and 2015, the sectors with the most growth in Deschutes County were: construction, health and social assistance, and accommodations and food services.
Employment in the Government and Health Care sectors tends to be stable and pays above Bend’s average wage of $37,755. Employment in Accommodations and Food Services and Retail Trade pays below Bend’s average wage and employment may be volatile.
Industries that have grown recently in Bend include bioscience, aviation and aerospace, outdoor recreation, software, specialty manufacturing, data center storage, and brewing. Each of these industries presents an opportunity for industrial growth in Bend.15
14 “Employment Projections – 2012-2022,” Bureau of Labor Statistics, December 19, 2013, http://www.bls.gov/news.release/pdf/ecopro.pdf. and “Oregon Economic and Revenue Forecast,” Office of Economic Analysis, May 2015, http://www.oregon.gov/DAS/OEA/docs/economic/forecast0515.pdf. 15 Bureau of Labor Statistics, Quarterly Census of Employment and Wages, 2013, http://www.bls.gov/cew/datatoc.htm (Hereafter BLS, QCEW). and Economic Development Central Oregon, Business and Economic Data, https://www.edcoinfo.com/business-and-economic-data/.

Bend Economic Opportunities Analysis August 31, 2016 Page 18 of 122
National, State, and Regional Economic Trends
Implications for economic growth in Bend
Importance of small businesses in Oregon’s economy
Small business, with 100 or fewer employees, account for 66% of private-sector employment in Oregon. Workers of small businesses typically have had lower wages than the state average.16
In 2013 average size for a private business in Deschutes County is 8.5 employees per business, compared to the State average of 11.2 employees per private business. 17
Growth of small businesses presents opportunities for economic growth in Bend.
Availability of trained and skilled labor
Businesses in Oregon are generally able to fill jobs, either from available workers living within the State or by attracting skilled workers from outside of the State.
Availability of labor depends, in part, on population growth and in-migration. Oregon added more than 980,000 new residents and about 475,000 new jobs between 1990 and 2008. The population-employment ratio for the State was about 1.6 residents per job over the 18-year period.18
Availability of labor also depends on workers’ willingness to commute. Workers in Oregon typically have a commute that is 30 minutes or shorter. 19
Availability of skilled workers depends, in part, on education attainment. About 30% of Oregon’s workers have a Bachelor’s degree or higher. 20
Employment in Bend grew at about 1.6% annually over the 2001 to 2013 period, while population grew at about 3% annually from 2000 to 2013. 21
About 76% of workers at businesses located in Bend lived in Deschutes County, and 50% lived within Bend city limits. Firms in Bend attracted workers from as far away as Multnomah County.22
Bend’s residents who were 25 years and over were more likely to have a Bachelor’s degree or higher (41%) than the county (34%) and state average (31%). Availability of these workers helps support the types of target industries that require a skilled, educated workforce discussed in Chapter 4. 23
16 Bureau of Labor Statistics, Quarterly Census of Employment and Wages, 2014 Q1, http://www.bls.gov/cew/apps/data_views/data_views.htm#tab=Tables/. 17 Bureau of Labor Statistics, Quarterly Census of Employment and Wages. 18 Oregon Employment Department, Quarterly Census of Employment and Wages. 19 US Census Bureau, 2013 American Community Survey, 1-Year Estimates, Table B08303. 20 US Census Bureau, 2013 American Community Survey, 1-Year Estimates, Table B15003. 21 Bureau of Labor Statistics, Quarterly Census of Employment and Wages. 22 US Census Bureau, On the Map, 2011, http://onthemap.ces.census.gov. 23 US Census Bureau, 2013 American Community Survey, 1-Year Estimates, Table B15003.

Bend Economic Opportunities Analysis August 31, 2016 Page 19 of 122
National, State, and Regional Economic Trends
Implications for economic growth in Bend
Aging of the population
The number of people age 65 and older will more than double between 2010 and 2050, while the number of people under age 65 will grow by only 30%. 24 The economic effects of this demographic change include a slowing of the growth of the labor force, an increase in the demand for healthcare services, and an increase in the percent of the federal budget dedicated to Social Security and Medicare.
People are retiring later than previous generations and continuing to work past 65 years old. This trend is seen both at the national and State levels. 25 Even given this trend, the need for workers to replace retiring baby boomers will outpace job growth. Management occupations and teachers will have the greatest need for replacement workers because these occupations have older-than-average workforces.
The changes in the Bend’s age structure are similar to those of the State, with the most growth observed in people 45 years and older. Bend’s population is generally younger than the State’s. The median age in Bend in 2013 was 36.6 years, compared to 42.3 in Deschutes County, and 39.1 in the state as a whole.26
The State projects that the share of the population over the age of 60 in Deschutes County will increase by 10% between 2015 and 2035. 27
Firms in Bend will need to replace workers as they retire. Demand for replacement workers is likely to outpace job growth in Bend, consistent with State trends.
Increases in energy prices
Although energy prices are currently low by historical standards, over the long-term, energy prices are forecast to return to relatively high levels, such as those seen in the 2006 to 2008 period, possibly increasing further over the planning period.28
In 2015, low energy prices have decreased the costs of commuting. Over the long-term, if energy prices increase, these higher prices will likely affect the mode of commuting before affecting workers’ willingness to commute. For example, commuters may choose to purchase a more energy-efficient car, use the bus, or carpool.
Very large increases in energy prices may affect workers’ willingness to commute, especially workers living the furthest from Bend or workers with lower paying jobs.
24 “The Next Four Decades; The Older Population in the United States 2010 to 2050,” US Census Bureau, May 2010, https://www.census.gov/prod/2010pubs/p25-1138.pdf. 25 “Americans Settling on Older Retirement Age,” Rebecca Riffkin, Gallup, April 29, 2015, http://www.gallup.com/poll/182939/americans-settling-older-retirement-age.aspx. 26 U.S. Census Bureau, 2013 American Community Survey, 1-Year Estimates, Table B01002. 27 Oregon Office of Economic Analysis, Demographic Forecast, “Long-term Oregon State’s County Population Forecast (2010-2050),” http://www.oregon.gov/DAS/oea/Pages/demographic.aspx#Long_Term_County_Forecast” 28 “Annual Energy Outlook 2015; With Projections to 2040,” US Energy Information Administration, April 2015, http://www.eia.gov/forecasts/aeo/pdf/0383(2015).pdf.

Bend Economic Opportunities Analysis August 31, 2016 Page 20 of 122
National, State, and Regional Economic Trends
Implications for economic growth in Bend
Comparatively low wages
The income of a region affects the workforce and the types of businesses attracted to the region. Average income affects workers and businesses in different ways. Workers may be attracted to a region with higher average wage or high wage jobs. Businesses, however, may prefer to locate in regions with lower wages, where the cost of doing business may be lower.
Since the early 1980’s, Oregon’s per capita personal income has been consistently lower than the U.S. average. In 2013, Oregon’s per capita wage was 89% of the national average.29
Per capita personal income in Deschutes County ($40,245 in 2014 dollars) was lower than that of the Portland MSA ($44,603), Oregon ($40,645), and the Nation as a whole ($45,660) in 2014. 30
Income in Oregon has historically been below national averages. There are four basic reasons that income has been lower in Oregon and Deschutes County than in the U.S.: (1) wages for similar jobs are lower; (2) the occupational mix of employment is weighted towards lower paying occupations; (3) a higher proportion of the population has transfer payments (e.g. social security payments for retirees), which are typically lower than earnings; and (4) lower labor force participation among working age residents. To a certain degree, these factors are all true for both Oregon and Deschutes County, and result in lower income.
The lower wages in Bend may be attractive to firms that typically pay lower wages, such as call centers or firms that outsource professional services such as accounting or technical support.
Education as a determinant of wages
The majority of the fastest growing occupations will require an academic degree, and on average they will yield higher incomes than occupations that do not require an academic degree. The fastest growing occupations requiring an academic degree will be: computer software application engineers, elementary school teachers, and accountants and auditors. Occupations that do not require an academic degree (e.g., retail sales person, food preparation workers, and home care aides) will grow, accounting for about half of all jobs by 2018. These occupations typically have lower pay than occupations requiring an academic degree.31
Bend’s residents who were 25 years and over were more likely to have a Bachelor’s degree or higher (41%) than the county (34%) and state average (31%) in 2013. 32
Wages in Bend are relatively low compared to Oregon as a whole, and this is largely a result of the composition of the regional economy, rather than the availability of workers with an academic degree. Increasing the relatively low wages in the region is dependent on changing the composition of the regional economy, through growing or attracting businesses with higher paying occupations.
29 Bureau of Economic Analysis, Regional Data, GDP & Personal Income, Local Area Personal Income and Employment, Table CA1-3. 30 Bureau of Economic Analysis, Regional Data, GDP & Personal Income, Local Area Personal Income and Employment, Table CA1-3. Adjusted for inflation using the BLS CPI Calculator at http://www.bls.gov/data/inflation_calculator.htm. 31 Bureau of Labor Statistics, “Employment Projections: 2008-2018 News Release,” Thursday, December 10, 2009, http://www.bls.gov/news.release/archives/ecopro_12102009.htm. 32 US Census Bureau, 2013 American Community Survey, 1-Year Estimates, Table B15003.

Bend Economic Opportunities Analysis August 31, 2016 Page 21 of 122
National, State, and Regional Economic Trends
Implications for economic growth in Bend
Importance of high quality natural resources
The relationship between natural resources and local economies has changed as the economy has shifted away from resource extraction. Increases in the population and in households’ incomes, plus changes in tastes and preferences, have dramatically increased demands for outdoor recreation, scenic vistas, clean water, and other resource-related amenities. Such amenities contribute to a region’s quality of life and play an important role in attracting both households and firms.
The region’s high quality natural resources present economic growth opportunities for Bend, ranging from food and beverage production to the tourism industry.
Summary of Bend’s Competitive Advantages Bend’s competitive advantages include a well-educated and growing population, a desirable location for employees—a scenic environment with unique access to outdoor recreation—and for businesses—proximity to major state highways and airports. Furthermore, Bend has competitive property tax rates and effective infrastructure systems and planning efforts that are on track to accommodate increasing usage.
As the economy and population of Central Oregon continue to grow, aspects of Bend’s role as the “central city” or regional center within Central Oregon will intensify. For example, because of the existing business network and suppliers, firms’ executive decision-making functions will be more likely to locate in the city.
This role will continue to be important to the quantity and types of jobs that Bend attracts. Downtown Bend is the cultural, culinary, and specialty retail hub of the region. Bend hosts the region’s largest medical facility (St. Charles Medical Center and associated medical organizations), the largest news media organization (the Bend Bulletin), and numerous governmental agencies, from federal (U.S. Forest service), to regional (Deschutes County), to local (City of Bend) – all of which are major employers. Within the private sector, Bend is also the home address for many of the region’s largest and most influential employers – either as the headquarters or the main employment location – including: Mt. Bachelor; Les Schwab; Bend Research; Nosler Inc.; GL Solutions; Navis; and IBEX.
The importance of Bend as a social and cultural center is an important consideration as a driver of economic growth. Bend’s high quality cultural and natural amenities are repeatedly cited by business owners and employees as reasons to relocate to or remain in Bend. This will prove especially important in some industry sectors, such as Information-Technology, in which well-paid managers and their employers can choose between communities, and land and building space costs play a less significant factor in business success.

Bend Economic Opportunities Analysis August 31, 2016 Page 22 of 122
CHAPTER 4. EMPLOYMENT GROWTH AND TARGET INDUSTRIES IN BEND OAR 660-009 requires cities to maintain a 20-year inventory of sites designated for employment. To provide for at least a 20-year supply of commercial and industrial sites consistent with local community development objectives, Bend needs an estimate of the amount of commercial and industrial land that will be needed to accommodate forecast employment over the planning period. Demand for commercial and industrial land will be driven by development in target industries, the expansion and relocation of existing businesses, and new businesses locating in Bend.
Employment Forecast
Appendix B describes the methods and assumptions used to develop the 2008-2028 employment forecast. This section presents the 2008-2028 forecast and describes changes in employment that occurred between 2008 and 2013.33
Before presenting the updated information, it is important to note that the 2008 to 2028 employment forecast was upheld in the Remand. As such, the City is not required to revisit the 20-year forecast. The information provided in this section analyzes how much and what type of employment growth occurred in Bend between 2008 and 2013.
The foundation of the economic opportunities analysis (EOA) is the forecast of employment growth. In the Remand, Bend was found to have met the requirements of Goal 9, with the forecast of 22,891 new non-shift employees from 2008 to 2028. This serves as the foundation for the updated land need estimates.
Employment Changes in Bend This section presents information about Bend’s employment base in 201334, compared to 2008. Table 2 shows the forecast of growth by major employment categories for Bend for 2008 to 2028 that was originally developed for the 2008 EOA. The forecast shows that employment will grow by 22,891 employees (about 61%) over the 20 year period between 2008 and 2028, at an average annual growth rate of 2.4%.
33 2013 is the most recent year that employment data is available upon which to base the updates.
34 We use 2013 employment data, rather than 2014 employment data, because it is the best available data for Bend. The employment data used is the Oregon Employment Department’s Quarterly Census of Employment and Wages.

Bend Economic Opportunities Analysis August 31, 2016 Page 23 of 122
Table 2. Employment Forecast by Employment Category, total non-shift employment, Bend 2008 to 2028
Source: Bend EOA, 2008, Table 26; 2028 Employment forecast: Bend EOA, 2008, Table 25. 2008 data based on Oregon Employment Department 2006 geo-coded data for City of Bend Note: While the employment in this table is based on covered employment data from the Oregon Employment Department, the 2008 covered employment data was adjusted, using the methods described in the EOA, to show total employment for non-shiftworkers.
Since the forecast for the 2008 EOA was developed, Bend’s economy has changed, in large part as a result of the recent recession. Table 3 shows change in employment in Bend between 2008 and 2013. Overall, employment grew by 948 employees, at an average annual growth rate of 0.5%. Industrial employment decreased by about 2,500 employees and retail employment decreased by more than 550 employees. The majority of employment growth was in Office, Services, and Medical, which added more than 2,400 jobs.
Table 3. Employment Forecast by Employment Category, total non-shift employment, Bend 2008 to 2013
Source: Bend EOA, 2008, Table 26. 2008 data based on Oregon Employment Department 2006 geo-coded data for City of Bend 2013 data based on Oregon Employment Department 2013 Quarter 3 geo-coded data for City of Bend Note: While the employment in this table is based on covered employment data from the Oregon Employment Department, the 2008 and 2013 covered employment data was adjusted, as using the methods described in the EOA, to show total employment for non-shiftworkers.

Bend Economic Opportunities Analysis August 31, 2016 Page 24 of 122
Using the 2013 total non-shift employment figure of 38,664 and the 2028 acknowledged forecast of 60,607 yields an estimated increase of 21,943 new employees between 2013 and 2028. This equates to an average annual growth rate of 3.0% over that period. Table 2 shows that the acknowledged 2008 to 2028 forecast of 22,891 new employees resulted in an average annual growth rate of 2.4%. In short, employment growth between 2008 and 2013 occurred at a much slower pace than the average growth rate forecast by the City.
Table 4 compares employment in Bend in 2013 to the forecast for employment growth by 2028, from the 2008 EOA.
Table 4. Employment Forecast by Employment Category, non-shift workers, Bend 2013 to 2028
Source: 2028 Employment forecast: Bend EOA, 2008, Table 25. 2013 data based on Oregon Employment Department 2013 Quarter 3 geo-coded data for City of Bend Note: While the employment in this table is based on covered employment data from the Oregon Employment Department, the 2013 covered employment data was adjusted, as using the methods described in the EOA, to show total employment for non-shiftworkers.
Analysis of employment growth for Deschutes County between 2013 and 2015 shows that employment in the County grew by more than 9,000 employees over the two-year period, at an average annual growth rate of 7%. The sectors with the largest growth were: construction, health and social assistance, and accommodations and food services. If 60% of those employees located in Bend, consistent with historical trends, then Bend added 5,400 new employees between 2013 and 2015. This rapid employment growth supports the employment forecast in Table 4.
Figure 2 shows a comparison of total non-shift employment by employment category in 2008 and 2013 and the forecast of employment growth in Bend for 2028.

Bend Economic Opportunities Analysis August 31, 2016 Page 25 of 122
Figure 2. Comparison of Changes in Employment by Employment Categories in 2008, 2013, and 2028 Forecast, non-shift workers, Bend
Source: Bend EOA, 2008, Table 26. 2008 data based on Oregon Employment Department 2006 geo-coded data for City of Bend 2013 data based on Oregon Employment Department 2013 Quarter 3 geo-coded data for City of Bend Note: While the employment in this figure is based on covered employment data from the Oregon Employment Department, the 2008 and 2013 covered employment data was adjusted, as using the methods described in Appendix B, to show total employment for non-shiftworkers.
Employment Forecast by Site Size
OAR 660-009-0015(2) requires cities to identify “required site types.” Specifically, the rule states:
“The economic opportunities analysis must identify the number of sites by type reasonably expected to be needed to accommodate the expected employment growth based on the site characteristics typical of expected uses. Cities and counties are encouraged to examine existing firms in the planning area to identify the types of sites that may be needed for expansion. Industrial or other employment uses with compatible site characteristics may be grouped together into common site categories.”
This section describes the process for identifying the number of sites needed by type in Bend. The estimate of site needs is based on the employment forecast and historical development patterns, to illustrate the rough number and type of sites of various sizes needed to accommodate the forecast of employment growth. The forecast of land needed to accommodate growth and ability to accommodate that growth within the UGB is completed with use of the Envision Tomorrow modeling tool, as discussed in Chapter 5.

Bend Economic Opportunities Analysis August 31, 2016 Page 26 of 122
The process of identifying site needs based on historical development patterns builds from the employment forecast (Table 4) to the forecast of needed sites by size of site. Table 5 shows the distribution of existing employment (in 2013) by the employment categories and site size. To maintain consistency with the Envision Tomorrow model output and the Urbanization Report, the employment categories in Table 4 have been simplified and combined as follows:
• Retail & Leisure and Hospitality = Retail and Hospitality • Office/Srv/Medical & Other/Misc = Office • Heavy and General Industrial = Industrial • Government = Public
Table 5. Distribution of existing employment by site size, Bend 2013
Source: Oregon Employment Department 2013 Quarter 3 geo-coded data for City of Bend and developed land in the Bend BLI, 2016
The next step in the process was to allocate employment growth by site size (Table 6). This allocation used the percentages in Table 5 to distribute employment growth in Table 4 to employment categories and site sizes.
Table 6. Forecast of employment growth by site size, Bend 2013-2028
Source: Bend employment forecast in Table 5
Table 7 shows the average employees per site by site size for tax lots with employment in 2013 using data from the Quarterly Census of Employment and Wages (QCEW) and tax lot data. The results show that sites less than five acres averaged 23 employees and sites five to 50 acres averaged 134 employees. Average employment on sites of 50 acres or more cannot be disclosed for confidentiality reasons.

Bend Economic Opportunities Analysis August 31, 2016 Page 27 of 122
Table 7. Average employees per site, Bend 2013
Source: Oregon Employment Department 2013 Quarter 3 geo-coded data for City of Bend and developed land in the Bend BLI, 2016 Note: The average number of employees more than 50 acres cannot be disclosed for confidentiality purposes. The average number of employees on sites 50-acres or more is substantially more than the average number of employees on sites 5 to 49 acres in size.
The average employees per site in Table 7 are then used to estimate the number of needed sites by employment type and size to accommodate new employment between 2013 and 2028. Needed sites are estimated by dividing the employment by category and site size in Table 6 by the average employees per site in Table 7. Note that sites larger than 50 acres are not included in this analysis—the Remand approved the need for two large-lot industrial employment sites over fifty acres. Thus, analysis of special site needs over 50 acres is not necessary using this methodology.
Table 8 shows the number of sites needed to accommodate employment growth between 2013 and 2028 by site size. The results show that Bend will need 726 sites less than five acres and 32 sites greater than five acres for a total of 758 sites.
Table 8. Sites needed to accommodate employment growth by site size, Bend 2013-2028
Source: Bend employment forecast in Table 4, average employees per site in Table 7.
Table 9 allocates the needed sites in Table 8 to broad categories of plan designation based on the approximate percentage of employment for each employment category. For example, 89% of retail and hospitality employment in Bend is located in Commercial and Mixed Use plan designations. As a result, Table 9 allocates 89% of sites needed to Commercial and Mixed Use, with 179 sites smaller than 5 acres and 13 sites between 5 and 49.9 acres. The remaining 24 sites are allocated to Industrial and Mixed Employment, where about 11% of Bend’s retail and hospitality employment is located.

Bend Economic Opportunities Analysis August 31, 2016 Page 28 of 122
Table 9. Sites needed to accommodate employment growth by comprehensive plan designation category and site size, Bend 2013-2028
Source: Site needs forecast in Table 8 and distribution of employment by plan designation from Oregon Employment Department 2006 Covered Employment and analysis by City of Bend.

Bend Economic Opportunities Analysis August 31, 2016 Page 29 of 122
Target Industries
In 2005, spurred by the realization that Bend’s economy was in the midst of an ongoing series of changes, the City Council and other city leaders convened an Economic Sector Targeting workshop. The nine primary targeted economic sectors identified by the workshop are shown in Table 10.
Table 10. Targeted Economic Sectors
Source: City of Bend Economic Sector Targeting Report, 2005
Note that the industry groups identified by the Economic Sector Targeting work do not necessarily follow the NAICS categorization system. Economic development professionals refer to industry groups such as these, which can cross into numerous different NAICS sectors, as “clusters.”
In determining which industries to target, the group gave preference to “traded-sector” industries. “Traded sector” refers to industries or businesses that sell their services or products beyond the local market area. Because of their regional or even global market areas, these types of industries have much greater potential and are less vulnerable to downswings in the local economy. For example, Bend’s aviation companies sell airplanes and aviation parts to customers around the country and are thus traded-sector companies. Conversely, a chain of auto repair stores serves a very local market and will depend much more on local economic conditions for success. The Regional and Bend Target sectors are all traded sector industries, while the “Economic Base Sustain and Grow” sectors are more local.
Bend can be expected to continue to grow faster than the rest of the region within certain industries – particularly, industries identified by the Economic Sector Targeting and OED that are knowledge-based or have an existing base of operations in Bend.
Site Needs for Target Industries
Chapter 4 described target industries (described in this chapter as economic opportunities) for Bend, based on the city’s economic advantages and evaluation of the types of industries that fit with Bend’s vision for growth of traded-sector industries. These target industries focus on manufacturing, including secondary wood products, renewable energy, aviation – aerospace, recreation equipment, and specialty manufacturing, as well as information technology. This section focuses on the site needs for these target industries, as well as established industries, such as medical services. It also considers land needs from the broad range of commercial and industrial businesses, from small retail or service businesses to large-scale manufacturers.
Economic Base Regional Targets Bend TargetsSustain and GrowHospitality Aviation - Aerospace
Higher Education Recreation Equipment
Health Care Specialty ManufacturingInformation Technologies
Secondary Wood Products
Renewable Energy Resources

Bend Economic Opportunities Analysis August 31, 2016 Page 30 of 122
This section addresses the requirements of OAR 660-009-0015(2) on required site types:
Identification of Required Site Types. The economic opportunities analysis must identify the number of sites by type reasonably expected to be needed to accommodate the expected employment growth based on the site characteristics typical of expected uses. Cities and counties are encouraged to examine existing firms in the planning area to identify the types of sites that may be needed for expansion. Industrial or other employment uses with compatible site characteristics may be grouped together into common site categories.
The analysis that follows aggregates employment that has compatible site characteristics into common site categories.
Typical site needs of larger employers Businesses considering locating in Oregon and in Bend will consider many factors before selecting a location (e.g., access to markets, availability of skilled workers, and availability of suitable land).
One of the key factors that businesses consider when making decisions about where to locate is the availability of vacant, large, and flat parcels of land. Table 11 shows examples of traded-sector firms that considered locating in Oregon and Southern Washington since 1997. Table 11 shows that firms looking for office or flex space required sites from 30 acres up to more than 100 acres. Manufacturing firms required sites from 25 acres to 250 acres in size.
These firms worked with Business Oregon to find suitable sites in Oregon. Some of the firms chose to locate in Oregon and some chose to locate elsewhere. One of the key factors that influenced decisions to locate elsewhere was availability of large parcels of land with infrastructure services (e.g., transportation access, wastewater, etc.).

Bend Economic Opportunities Analysis August 31, 2016 Page 31 of 122
Table 11. Examples of firms that considered locating in Oregon and Southern Washington between 1997 and 2010
Source: Business Oregon
Table 12 shows examples of manufacturers of clean energy technologies that announced plans to build new manufacturing plants in 2009 or 2010. More than one-third of these firms considered locating in Oregon. The site size requirements of these firms ranged from 50 to nearly 500 acres, with an average site size of around 100 acres. These firms are within one of the potential growth industries identified in Chapter 4, renewable energy manufacturing.
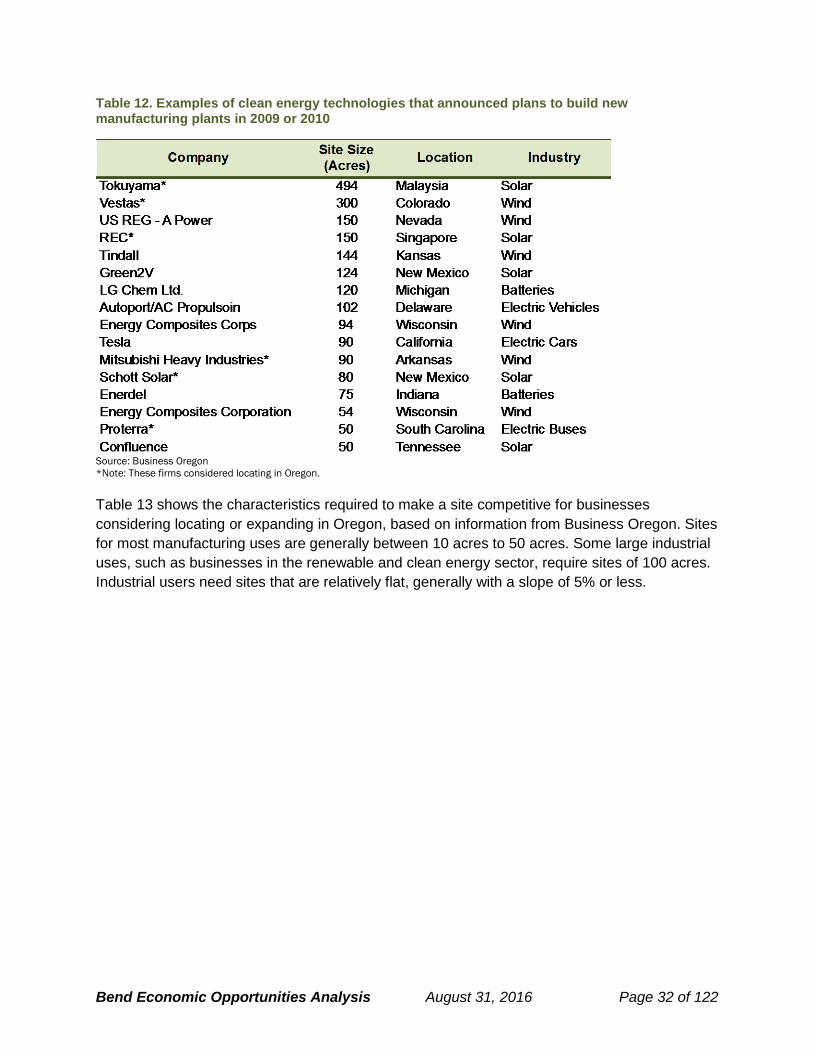
Bend Economic Opportunities Analysis August 31, 2016 Page 32 of 122
Table 12. Examples of clean energy technologies that announced plans to build new manufacturing plants in 2009 or 2010
Source: Business Oregon *Note: These firms considered locating in Oregon.
Table 13 shows the characteristics required to make a site competitive for businesses considering locating or expanding in Oregon, based on information from Business Oregon. Sites for most manufacturing uses are generally between 10 acres to 50 acres. Some large industrial uses, such as businesses in the renewable and clean energy sector, require sites of 100 acres. Industrial users need sites that are relatively flat, generally with a slope of 5% or less.

Bend Economic Opportunities Analysis August 31, 2016 Page 33 of 122
Table 13. Site characteristics of common business types in Oregon
Source: Business Oregon *Note: Site size is the competitive acreage that would meet the site selection requirements of the majority of industries in this sector
Some industrial and large-scale commercial businesses may prefer to locate in an industrial or business park. Business parks are developments with multiple buildings, designed to accommodate a range of uses, from heavy industry to light industry to office uses. Most industrial parks, a subset of business parks, have large-scale manufacturing, distribution, and other industrial uses, with relatively little office space.
To provide context for business park type development, Table 14 shows examples of business park sites in the Portland Metro area. Business parks in the Portland area generally range in size from 25 acres to 75 or 100 acres in size. Some of the business parks are primarily industrial (e.g., Beaverton Creek, Columbia Commerce Park, or Southshore Corporate Park), some are primarily commercial (e.g., Creekside Corporate Park or Nimbus Corporate Center), and some are office and flex space (e.g., Cornell Oaks Corporate Center).

Bend Economic Opportunities Analysis August 31, 2016 Page 34 of 122
Table 14. Examples of business park sites, Portland Metro area
Source: Metro UGR, Appendix 5 Multi-tenant (business park)/Large lot analysis
In addition, the Portland Metro area has identified the following types of major employment sites, ranging from 25 acres to more than 500 acres:35
• General industrial. The Portland region has 21 general industrial major employment sites, ranging in size from 25 acres to 164 acres and averaging 53 acres. Firms on these sites range from beverage manufacturers to construction product manufacturers to specialty manufacturing enterprises.
• Warehouse and distribution. The Portland region has 15 warehouse and distribution major employment sites, ranging in size from 25 acres to 452 acres and averaging 74 acres. Firms on these sites range from wholesalers to general warehouse and distribution to company-specific distributors.
• Flex. The Portland region has 14 flex major employment sites, ranging in size from 25 acres to 522 acres and averaging 112 acres. Firms on these sites include small and large semiconductor manufacturing and other high tech manufacturing.
35 These examples are documented in the Portland Metro 2009-2030 Urban Growth Report, Appendix 4
Bend Economic Opportunities Analysis August 31, 2016 Page 35 of 122
Site Needs of Target Industries OAR 660-009-0015(2) requires the EOA identify the number of sites, by type, reasonably expected to be needed for the 20-year planning period. Types of needed sites are based on the site characteristics typical of expected uses. The Goal 9 rule provides flexibility in how jurisdictions conduct and organize this analysis. The Administrative Rule defines site characteristics as follows in OAR 660-009-0005(11):
(11) "Site Characteristics" means the attributes of a site necessary for a particular industrial or other employment use to operate. Site characteristics include, but are not limited to, a minimum acreage or site configuration including shape and topography, visibility, specific types or levels of public facilities, services or energy infrastructure, or proximity to a particular transportation or freight facility such as rail, marine ports and airports, multimodal freight or transshipment facilities, and major transportation routes.
Friends of Yamhill County v. City of Newberg, 62 Or LUBA 5 (2010), established a two-prong test for establishing relevant "site characteristics" as follows: (1) that the attribute be "typical of the industrial or employment use;" and (2) that it have "some meaningful connection with the operation of the industrial or employment use." The first of those prongs, that the attributes be "typical," appears expressly in OAR 660-009-0015(2), which refers to "site characteristics typical of expected uses." In upholding LUBA’s two prong test, the Court of Appeals agreed, “[t]hat ’necessary’ site characteristics are those attributes that are reasonably necessary to the successful operation of particular industrial or employment uses, in the sense that they bear some important relationship to that operation.” Friends of Yamhill County v. City of Newberg, 240 Or App 738, 747 (2011).
Table 15 presents the site characteristics needed for the operation of major traded-sector industries, as well as for clusters of commercial and mixed-use development. Table 15 groups potential growth industries by site category (e.g., large industrial and flex). Any of the potential growth industries, however, may occur at a variety of sizes. For example, renewable energy companies could range from large solar panel manufacturers to small manufacturers of specialty renewable energy products and could use sites from five acres to over 250 acres. The opportunity sites in each potential growth industry will vary by size of the firms and the firm’s activities.
Table 16 presents site infrastructure requirements necessary for the operations of potential growth industries. There are some common service requirements, regardless of the type of industry. For example, nearly all firms need access to roads, telecommunications, water and wastewater, and electricity. Some potential growth industries have specific service requirements for their operations. For example, food processors generally need access to large amounts of water and wastewater capacity or data centers need access to a large amount of electricity and redundant electricity sources.

Bend Economic Opportunities Analysis August 31, 2016 Page 36 of 122
Table 15. Summary of site characteristics for target industries and clusters of commercial development
Site Category Example Industries (Target Industries in bold)
Typical Site Size (acres) Topology Parcel
configuration Land Use Buffers Visibility
Large Industrial and Flex
Renewable Energy Information Technology
50 to 250 0% to 5% slope
Preference for single parcels or parcels with two owners
Compatible with industrial or agricultural uses
No
Medium Industrial and Flex
Specialty Manufacturing Aviation - Aerospace Secondary Wood Products Recreation Equipment Renewable Energy Information Technology
10 to 75 0% to 5% slope
Preference for single parcels or parcels with two owners
Compatible with industrial or agricultural uses
No
Small Industrial Specialty Manufacturing Aviation - Aerospace Secondary Wood Products Recreation Equipment Renewable Energy Information Technology
Less than 10
Less than 10% slope
Preference for single parcels or parcels with two owners
Compatible with some commercial, industrial, or agricultural uses
No
Large Commercial /Office
Mixed use Regional and community retail Big box retail Higher Education
10 to 50 Less than 10% slope
Preference for single parcels or parcels with two owners
Compatible with commercial and mixed uses
Yes
Medium Commercial /Office
Information Technology Large medical offices Mixed use Hospitality Higher Education Neighborhood retail Other services
5 to 20 Less than 15% slope
Preference for single parcels or parcels with three owners
Compatible with commercial and mixed uses
Yes
Small Commercial /Office
Small medical offices Retail and services
Less than 2 Less than 15% slope
Preference for single parcels or parcels with three owners
Compatible with commercial, mixed uses, and residential
Yes
Source: ECONorthwest research, City of Bend analysis, and Business Oregon Industrial Development Competitiveness Matrix

Bend Economic Opportunities Analysis August 31, 2016 Page 37 of 122
Table 16. Summary of site infrastructure needs for potential growth industries and clusters of commercial development
Site Category Transportation Rail Transit, Ped, Bike
Water and Sewer
Meter Size (inches)
Gas (annual therms)
Electrical Demand (annual KWhr) Telecom
Large Industrial and Flex
Direct access to an arterial; less than 10 miles from Highway 97 or Highway 20
Preferred Preferred 4 to 10 High Pressure Preferred
10,000 – 80,000 10,000 – 100,000 + Secondary system dependency may be required
High speed Internet and phones Higher capacity Internet access may be required
Medium Industrial and Flex
Direct access to an arterial; less than 10 miles from Highway 97 or Highway 20
Preferred Preferred 3 to 6 High Pressure Preferred
10,000 – 80,000 10,000 – 100,000 + Secondary system dependency may be required
High speed Internet and phones Higher capacity Internet access may be required
Small Industrial Access to a major collector
Not required
Preferred 0.75 to 2 10,000 – 30,000 10,000 to 30,000 High speed Internet and phones Higher capacity Internet access may be required
Large Commercial Direct access to an arterial or major collector
Not required
Preferred 2 to 4 Standard commercial usage
10,000 – 100,000 + Secondary system dependency may be required
High speed Internet and phones Higher capacity Internet access may be required
Medium Commercial
Direct access to an arterial or major collector
Not required
Preferred 1 to 3 Standard commercial usage
Standard commercial usage
High speed Internet and phones
Small Commercial Access to a major collector
Not required
Preferred 1.5 or smaller
Standard commercial usage
Standard commercial usage
High speed Internet and phones
Source: ECONorthwest research, City of Bend analysis, and Business Oregon Industrial Development Competitiveness Matrix
Bend Economic Opportunities Analysis August 31, 2016 Page 38 of 122
Characteristics of sites needed for manufacturing Bend’s target industries are manufacturing. Bend’s large-scale manufacturing target industries are renewable energy and information technology (large data centers). Bend’s medium-scale manufacturing target industries are renewable energy, secondary wood products, aviation – aerospace, recreation equipment, specialty manufacturing, and information technology (mid-sized data centers), all of which are high-tech or general manufacturing. This section presents the needed characteristics for large-scale manufacturing and medium-scale manufacturing.
The following summarizes the site characteristics for manufacturing and provides an overview of the two-prong test established for site characteristics under Friends of Yamhill County v. City of Newberg.
Large-scale manufacturing 1. Site size. Sites for manufacturing firms range in size from 50 to 250 acres. Some
medium-scale and smaller manufacturing firms may prefer to locate in a manufacturing or flex business park, which range in size from about 25 acres to several hundred acres.
o Attribute is "typical of the industrial or employment use" - OAR 660-009-0005(11) specifically cites “a minimum acreage” as a site characteristic. Business Oregon finds that competitively-sized Regionally to Nationally Scaled Clean-Tech Manufacturers have sites 50 acres and larger. Large clean industry developments in 2010 occurred on sites ranging from 50 acres to nearly 500 acres. Data centers and other information technology businesses locating in Oregon located on sites ranging from 30 to more than 100 acres. Some businesses will prefer to locate in manufacturing to flex business parks. Business parks are typically at least 25 acres in size to allow for development of multiple buildings and associated parking. In the Portland area, these parks generally range in size from about 25 acres to 50 acres, with a few examples of parks around 75, 100, or 300 acres.
o Attribute has "some meaningful connection with the operation of the industrial or employment use" – Site size is important to general industrial users. The site needs to be large enough to accommodate the needed built space, as well as to accommodate storage space or space for future expansion. In addition, the site needs to be large enough to accommodate not only the general industrial uses, but also parking, on-site circulation, connections to public transportation, rail connections, and other access to the transportation network.
2. Land ownership. Sites with two or fewer owners are necessary to reduce the cost and uncertainty of land assembly.
o Attribute is "typical of the industrial or employment use" - OAR 660-009-0005(11) specifically cites the “site configuration” as a site characteristic. Developing an industrial building on a site with more than two owners requires negotiating land assembly and purchase from multiple owners. Land assembly is difficult and often costly for a number of reasons. People own land for a variety of reasons,

Bend Economic Opportunities Analysis August 31, 2016 Page 39 of 122
such as the desire to develop the land, keep the land undeveloped, or sell the land for a profit. Getting landowners to sell land can be difficult, especially if the ownership is legally disputed, as is the case with some inheritances. If a landowner is a willing seller, they may have an unrealistic expectation of their land’s value, in the context of comparable land values. In addition, one parcel of land may have multiple owners, compounding the issues described above. Developers attempting land assembly often have difficulty assembling a site at a cost that makes development economically viable. When assembling land, developers often find that owners of key sites are not willing sellers, have unrealistic expectations of the value of their land, or cannot get agreement among multiple owners to sell the land. As a result, developers of industrial buildings typically choose to develop sites with one or two owners.
o Attribute has "some meaningful connection with the operation of the industrial or employment use" – The cost of land assembly, in financial terms and in terms of extra time needed for site assembly, can make developing an industrial site with multiple land owners financially infeasible.
3. Automotive and freight access. Manufacturing buildings generally are located on arterial or major collector streets. Traffic from the industrial development should not be routed through residential neighborhoods. Freight traffic should have unimpeded access to an arterial or state highway.
o Attribute is "typical of the industrial or employment use" - OAR 660-009-0005(11) specifically cites the “proximity to a particular transportation or freight facility such as rail, marine ports and airports, multimodal freight or transshipment facilities, and major transportation routes” as a site characteristic. Business Oregon finds that manufacturing and industrial firms need to be located relatively close to an interstate highway or principal arterial road, generally within 20 miles or less.
o Attribute has "some meaningful connection with the operation of the industrial or employment use" – This site characteristic helps to minimize the amount of traffic on local streets, minimize freight traffic in residential neighborhoods, improve mobility, minimize adverse effects on urban land use and travel patterns, and provide for efficient long distance travel, which are all necessary for effective industrial operations.
4. Topography. Manufacturing sites should be relatively flat, with slopes of not more than 5%.
o Attribute is "typical of the industrial or employment use" - OAR 660-009-0005(11) specifically cites “site configuration including shape and topography” as a site characteristic. Business Oregon finds that competitive sites generally have a slope of 5% or less.
o Attribute has "some meaningful connection with the operation of the industrial or employment use" – Industrial buildings require level floor plates to reduce costs

Bend Economic Opportunities Analysis August 31, 2016 Page 40 of 122
and offer maximum flexibility, as well as level areas to provide for freight access and pedestrian walkways that meet ADA standards. The real estate development literature describes the increases in development costs and other difficulties associated with industrial development on a sloped site.
5. Access to services. City services should be directly accessible to the site, including sanitary sewer, and municipal water.
o Attribute is "typical of the industrial or employment use" - OAR 660-009-0005(11) specifically cites the “specific types or levels of public facilities, services or energy infrastructure” as a site characteristic. Business Oregon finds that competitive sites must have access to urban services, including water, wastewater, natural gas, electricity, and major telecommunications facilities.
o Attribute has "some meaningful connection with the operation of the industrial or employment use" – Industrial buildings require access to municipal water, municipal sanitary sewer, and electricity/gas. Developing a site with direct access to municipal services is substantially more cost-effective than extending municipal services to an unserviced site.36
6. Surrounding land uses. Industrial buildings are directly compatible with other industrial uses, commercial uses, and agricultural uses. Bend’s Development Code and other policies address issues of compatibility between uses, such as requirements for building setbacks, screening, fencing, visual buffering, and landscaping.
o Attribute is "typical of the industrial or employment use" - OAR 660-009-0025(6) strongly encourages cities to manage encroachment and intrusion of incompatible uses with employment uses. Industrial uses are generally compatible with other industrial uses, commercial uses, and some public uses. Industrial uses may be compatible with agricultural uses, provided that the industrial use does not encroach on the agricultural uses.
o Attribute has "some meaningful connection with the operation of the industrial or employment use" - Industrial uses are able to operate efficiency where they are not in conflicts with adjacent land uses that could disrupt industrial business activity. Noise or odor conflicts may make some industrial uses incompatible with nearby residential uses.
Commercial/Office and Industrial Flex 1. Site size. Sites for general manufacturing or high-tech manufacturing firms range in size
from 10 to 25 acres. Some medium-scale and smaller manufacturing firms may prefer to locate in a manufacturing or flex business park, which range in size from about 25 acres or several hundred acres.
36 Miles, Mike E., Haney, Richard L., Bernes, Gayle, “Real Estate Development: Principles and Process,” The Urban Land Institute, 1997.

Bend Economic Opportunities Analysis August 31, 2016 Page 41 of 122
o Attribute is "typical of the industrial or employment use" - OAR 660-009-0005(11) specifically cites “a minimum acreage” as a site characteristic. Business Oregon finds that competitively-sized general manufacturing firms have sites 10 acres in size. Competitive sites for heavy manufacturing, high-tech manufacturing, or campus industrial manufacturing require 25-acre sites. Some businesses will prefer to locate in manufacturing to flex business parks. Business parks are typically at least 25 acres in size to allow for development of multiple buildings and associated parking. In the Portland area, these parks generally range in size from about 25 acres to 50 acres, with a few examples of parks around 75, 100, or 300 acres. Major employment sites with general industrial uses in the Portland Metro area range in size from 25 to 160 acres and average about 50 acres in size. Businesses parks will need to be at least 25 to 50 acres and possibly as large as 75 to 100 acres.
o Attribute has "some meaningful connection with the operation of the industrial or employment use" – Site size is important to general industrial users. The site needs to be large enough to accommodate the needed built space, as well as to accommodate storage space or space for future expansion. In addition, the site needs to be large enough to accommodate not only the general industrial uses, but also parking, on-site circulation, connections to public transportation, rail connections, and other access to the transportation network.
2. Land ownership. Sites with two or fewer owners are necessary to reduce the cost and uncertainty of land assembly.
o Attribute is "typical of the industrial or employment use" - OAR 660-009-0005(11) specifically cites the “site configuration” as a site characteristic. Developing an industrial building on a site with more than two owners requires negotiating land assembly and purchase from multiple owners. Land assembly is difficult and often costly for a number of reasons. People own land for a variety of reasons, such as the desire to develop the land, keep the land undeveloped, or sell the land for a profit. Getting landowners to sell land can be difficult, especially if the ownership is legally disputed, as is the case with some inheritances. If a landowner is a willing seller, they may have an unrealistic expectation of their land’s value, in the context of comparable land values. In addition, one parcel of land may have multiple owners, compounding the issues described above. As a result, developers of industrial buildings typically choose to develop sites with one or two owners.
o Attribute has "some meaningful connection with the operation of the industrial or employment use" – The cost of land assembly, in financial terms and in terms of extra time needed for site assembly, can make developing an industrial site with multiple land owners financially infeasible.

Bend Economic Opportunities Analysis August 31, 2016 Page 42 of 122
3. Automotive access. Manufacturing buildings generally are located on arterial or major collector streets. Traffic from the industrial development should not be routed through residential neighborhoods. The ideal site would have direct access to an arterial or state highway.
o Attribute is "typical of the industrial or employment use" - OAR 660-009-0005(11) specifically cites the “proximity to a particular transportation or freight facility such as rail, marine ports and airports, multimodal freight or transshipment facilities, and major transportation routes” as a site characteristic. Business Oregon finds that manufacturing and industrial firms need to be located relatively close to an interstate highway or principle arterial road, generally within 20 miles or less.
o Attribute has "some meaningful connection with the operation of the industrial or employment use" – This site characteristic helps to minimize the amount of traffic on local streets, minimize freight traffic in residential neighborhoods, improve mobility, minimize adverse effects on urban land use and travel patterns, and provide for efficient long distance travel, which are all necessary for effective industrial operations.
4. Topography. Manufacturing sites should be relatively flat, with slopes of not more than 5%.
o Attribute is "typical of the industrial or employment use" - OAR 660-009-0005(11) specifically cites “site configuration including shape and topography” as a site characteristic. Business Oregon finds that competitive sites generally have a slope of 5% or less, except high tech manufacturing and campus industrial, which have a slope of 7% or less.
o Attribute has "some meaningful connection with the operation of the industrial or employment use" – Industrial buildings require level floorplates to reduce costs and offer maximum flexibility, as well as level areas to provide for freight access and pedestrian walkways that meet ADA standards. The real estate development literature describes the increases in development costs and other difficulties associated with industrial development on a sloped site.
5. Access to services. City services should be directly accessible to the site, including sanitary sewer, and municipal water.
o Attribute is "typical of the industrial or employment use" - OAR 660-009-0005(11) specifically cites the “specific types or levels of public facilities, services or energy infrastructure” as a site characteristic. Business Oregon finds that competitive sites must have access to urban services, including water, wastewater, natural gas, electricity, and major telecommunications facilities.
o Attribute has "some meaningful connection with the operation of the industrial or employment use" – Industrial buildings require access to municipal water, municipal sanitary sewer, and electricity/gas. Developing a site with direct access

Bend Economic Opportunities Analysis August 31, 2016 Page 43 of 122
to municipal services is substantially more cost-effective than extending municipal services to an unserviced site.37
6. Surrounding land uses. Industrial buildings are directly compatible with other industrial uses, commercial uses, and agricultural uses. Bend’s Development Code and other policies address issues of compatibility between uses, such as requirements for building setbacks, screening, fencing, visual buffering, and landscaping.
o Attribute is "typical of the industrial or employment use" - OAR 660-009-0025(6) strongly encourages cities to manage encroachment and intrusion of incompatible uses with employment uses. Industrial uses are generally compatible with other industrial uses, commercial uses, and some public uses. Industrial uses may be compatible with agricultural uses, provided that the industrial use does not encroach on the agricultural uses.
o Attribute has "some meaningful connection with the operation of the industrial or employment use" - Industrial uses are able to operate efficiency where they are not in conflicts with adjacent land uses that could disrupt industrial business activity. Noise or odor conflicts may make some industrial uses incompatible with nearby residential uses.
General Retail and Office Uses 1. Site size. Sites for general retail and office firms range in size from 0.1 to 10 acres.
o Attribute is "typical of the industrial or employment use" - OAR 660-009-0005(11) specifically cites “a minimum acreage” as a site characteristic. General retail and office uses do not have a minimum acreage beyond what is dictated in local zoning codes.
o Attribute has "some meaningful connection with the operation of the industrial or employment use" – The City needs to provide a range of small site sizes. Needed site size is contingent on the type of business.
2. Land ownership. Sites with two or fewer owners are necessary to reduce the cost and uncertainty of land assembly.
o Attribute is "typical of the industrial or employment use" - OAR 660-009-0005(11) specifically cites the “site configuration” as a site characteristic. Developing a commercial building on a site with more than two owners requires negotiating land assembly and purchase from multiple owners. Land assembly is difficult and often costly for a number of reasons. People own land for a variety of reasons, such as the desire to develop the land, keep the land undeveloped, or sell the land for a profit. Getting landowners to sell land can be difficult, especially if the ownership is legally disputed, as is the case with some inheritances. If a
37 Miles, Mike E., Haney, Richard L., Bernes, Gayle, “Real Estate Development: Principles and Process,” The Urban Land Institute, 1997.

Bend Economic Opportunities Analysis August 31, 2016 Page 44 of 122
landowner is a willing seller, they may have an unrealistic expectation of their land’s value, in the context of comparable land values. In addition, one parcel of land may have multiple owners, compounding the issues described above. As a result, developers of retail and office buildings typically choose to develop sites with one to three owners.
o Attribute has "some meaningful connection with the operation of the retail or office use" – The cost of land assembly, in financial terms and in terms of extra time needed for site assembly, can make developing a retail or office site with multiple land owners financially infeasible.
3. Automotive access. Retail and office buildings should be located on arterial or collector streets. The ideal site would have direct access to an arterial or collector.
o Attribute is "typical of the industrial or employment use" - This site characteristic helps to minimize the amount of traffic on local streets, minimize commercial traffic in residential neighborhoods, improve mobility, minimize adverse effects on urban land use and travel patterns, and provide for efficient long distance travel, which are all necessary for effective commercial operations. A location with access to an arterial or state highway will have greater visibility, which is important to businesses that depend on in-person customer access.
o Attribute has "some meaningful connection with the operation of the industrial or employment use" – Many retail and office uses depend on auto access and visibility for their business.
4. Topography. General retail and office sites should be relatively flat, with slopes of not more than 15%.
o Attribute is "typical of the industrial or employment use" - OAR 660-009-0005(11) specifically cites “site configuration including shape and topography” as a site characteristic. Business Oregon finds that competitive sites retail sites generally have a slope of 15% or less.
o Attribute has "some meaningful connection with the operation of the industrial or employment use" – commercial buildings require level floorplates to reduce costs and offer maximum flexibility, as well as level areas to provide for freight access and pedestrian walkways that meet ADA standards. The real estate development literature describes the increases in development costs and other difficulties associated with commercial development on a sloped site.
5. Access to services. City services should be directly accessible to the site, including sanitary sewer, and municipal water.
o Attribute is "typical of the industrial or employment use" - OAR 660-009-0005(11) specifically cites the “specific types or levels of public facilities, services or energy infrastructure” as a site characteristic. Business Oregon finds that competitive

Bend Economic Opportunities Analysis August 31, 2016 Page 45 of 122
commercial sites must have access to urban services, including water, wastewater, natural gas, electricity, and major telecommunications facilities.
o Attribute has "some meaningful connection with the operation of the industrial or employment use" – retail and office buildings require access to municipal water, municipal sanitary sewer, and electricity/gas. Developing a site with direct access to municipal services is substantially more cost-effective than extending municipal services to an unserviced site.
6. Surrounding land uses. General retail and office buildings are directly compatible with other commercial uses, mixed uses, and residential uses. Bend’s Development Code and other policies address issues of compatibility between uses, such as requirements for building setbacks, screening, fencing, visual buffering, and landscaping.
o Attribute is "typical of the industrial or employment use" - OAR 660-009-0025(6) strongly encourages cities to manage encroachment and intrusion of incompatible uses with employment uses. General retail and office uses are generally compatible with other commercial uses, mixed uses, and residential uses.
o Attribute has "some meaningful connection with the operation of the industrial or employment use" - Commercial uses are able to operate efficiency where they are not in conflicts with adjacent land uses that could disrupt industrial business activity.
Special Site Needs: Aspirations for Bend’s Economy and Corresponding Land Needs The Goal 9 rule includes provisions for meeting unique site needs for industries that are an integral component of a city’s economic development strategy. The uses and sites described below represent Bend’s aspirations for employment above the anticipated employment described in the employment projections.
The State’s rule encourages jurisdictions to accommodate special site uses for economic growth. OAR 660-009-0025(8) states “cities and counties that adopt objectives or policies providing for uses with special site needs must adopt policies and land use regulations providing for those special site needs. Special site needs include, but are not limited to large acreage sites, special site configurations, direct access to transportation facilities, prime industrial lands…” These sites must be identified and protected for those specific uses and from incompatible uses.
Through discussions with the Stakeholders, Planning Commission, and public testimony, the 2008 EOA identified the following uses for aspirational employment and special sites. (1) a site for a new hospital; (2) a university district; and (3) two large lot industrial sites. The following discussion revises the “special site needs” for Bend based on changes that have occurred since 2008.38 The City is only proceeding with the large-lot industrial special site needs and university
38 The 2008 EOA identified a need for a hospital site and a new university campus. Because of recent events, the City has determined it no longer needs sites for these uses.

Bend Economic Opportunities Analysis August 31, 2016 Page 46 of 122
site need. The need for a university district is being met inside the current UGB because Oregon State University has selected a site within the UGB. The need for a new hospital site is not being carried forward because the St. Charles Medical Center has decided to expand the existing hospital within the UGB.
Large Industrial Sites The 2008 EOA identified a need for two, 56-acre industrial sites: one for targeted economic sector uses, and another for a heavy industrial site user. The Remand acknowledged this need, which is included as a special site need for the 2015 EOA.39
This land is not included in the general estimate for land need presented above and is in addition to existing land needs. These sites are not included in Bend’s employment projections because the industries Bend seeks for these sites are generally not present in Bend.
The Sector Targeting work calls for attracting secondary wood products, renewable energy resources, aviation, recreation equipment and specialty manufacturing, and information technologies. While the estimated needed economic lands may suit some of these sectors, two sites with a dedicated size of at least 50 acres each to be reserved for these uses are needed for large site users such as secondary wood products, aviation, renewable energy resources, and information technology. Stakeholders concluded that they have been approached by industries seeking large sites for these uses, but since none are in the current supply, the firms looked to other communities.
These sites are needed in addition to predicted industrial land needs because the total amount of industrial acreage is relatively small (at least 100 acres), and placing at least 100 acres to be held in two large lots would consume nearly all of the needed 20-year supply. These sites are also needed because they will create the land base needed to attract Bend’s targeted sectors.
The specific location of these sites has been identified as part of the “Alternatives Analysis” required by OAR 660-024. The large lot sites are at Juniper Ridge, within the existing UGB, and at the Department of State Lands Site, in the UGB expansion area.
Policies to protect these special large-lot industrial sites for their intended uses are required and will be included in Chapter 6 (Economy) and Chapter 11 (Growth Management) of Bend’s Comprehensive Plan. The policies require that any sites included in the UGB to meet the special large-lot industrial site need will be protected with specific plan and/or code provisions. The regulations will be consistent with the Regional Large Lot Industrial Land provisions for Crook, Deschutes and Jefferson Counties.
Juniper Ridge is the largest area designated for industrial uses in Bend. The base case assumes that all of Juniper Ridge will remain in an industrial plan designation and that it will accommodate future employment growth consistent with its designation. It can also
39 The Remand states “The Commission concludes that the City has made an adequate showing under ORS 197.298(3)(a) that there is a specific identified land need for a future university campus, a site for a future medical center, and for two 50-acre large lot industrial sites.” Pg 131-132

Bend Economic Opportunities Analysis August 31, 2016 Page 47 of 122
accommodate one of the large lot industrial site needs due to its large size and the city ownership that allows it to be held to wait for a large lot user.
Bend Economic Opportunities Analysis August 31, 2016 Page 48 of 122
CHAPTER 5. EMPLOYMENT LAND SUFFICIENCY AND SITE NEEDS This chapter provides an evaluation of land sufficiency in Bend. The analysis compares the land supply (as reported in the 2016 Buildable Lands Inventory) expressed in terms of capacity to accommodate new employees, with the updated 2013-2028 employment forecast. The land sufficiency analysis is followed by a discussion of the characteristics of needed sites to accommodate targeted industries. The chapter concludes with a discussion of short-term land supply.
Buildable Employment Land Inventory and Land Capacity
The BLI is adopted as a supporting document of the Bend Comprehensive Plan. In simplest terms, the BLI documents the urban land supply of Bend, and estimates the growth capacity for housing and jobs. It is a key factual base for growth management policy in Bend. The BLI also serves a very specific role, required by law, in analyzing and documenting specific categories of buildable land, and, estimating capacity for growth that is ultimately used to determine how much land is needed within UGB.
The full methods and results of the BLI are presented as a separate document (Bend Buildable Lands Inventory, 2016) and include an inventory of all lands (residential, employment, etc.) in the Bend UGB.
Commercial and Industrial Buildable Land Inventory Results Table 17 shows employment land by plan designation and lot size. In 2014, Bend had over 1,000 acres of vacant land designated for employment uses. About 29% acres of Bend’s vacant land is in sites smaller than 5 acres, 36% is on sites 5 to 50 acres, and 35% is in four sites larger than 50 acres.
Map 1 shows the BLI status of employment land (vacant and developed) in Bend.

Bend Economic Opportunities Analysis August 31, 2016 Page 49 of 122
Table 17. Vacant Employment Land by Employment Category and Lot Size, Bend UGB 2016
Source: Bend Buildable Lands Inventory, 2015 Note: RM and RH lands are part of the Medical District Overlay Zone (MDOZ)
Employment Category Smaller than 5 acres
5 to 49.99 acres
50.00 ac or more Total Percent of
Total
Commercial / Mixed Use 168 112 - 280 26%Industrial / Mixed Employment 127 193 370 690 65%Public Facilities 7 79 - 86 8% Total 302 384 370 1,056 100% Percent of Total 29% 36% 35% 100%
Commercial / Mixed Use 111 14 - 125 51%Industrial / Mixed Employment 99 14 2 115 47%Public Facilities 3 4 - 7 3% Total 213 32 2 247 100% Percent of Total 86% 13% 1% 100%
Number of Tax Lots
Acres by Lot Size

Bend Economic Opportunities Analysis August 31, 2016 Page 50 of 122
Map 1. Employment BLI Status
Source: Bend Buildable Lands Inventory, 2016

Bend Economic Opportunities Analysis August 31, 2016 Page 51 of 122
Capacity of Employment Land in the Bend UGB to Accommodate New Employment
This section combines work in the previous sections to calculate the sufficiency of employment lands in Bend to accommodate forecast employment growth for the 2013-2028 period. The issue of providing for a variety of locations, sizes, and types is addressed. Short-term demand and supply for economic lands is also discussed. For the purpose of this analysis, the term “demand” refers to land needs before being subtracted from existing supplies. The term “need” refers to land needs after subtracting out existing land supplies.
Methods used in the analysis For the revised EOA, Bend used a scenario planning tool called “Envision Tomorrow” to estimate the capacity of employment land. This is a significant change from the methods used in the 2008 EOA. Envision Tomorrow can be used to project the impact of current policies and trends on capacity as well as a range of other metrics, and compare against alternative policy choices. A “base case” scenario was developed based on current plan designations and average employment densities discussed in this document. In short, on vacant land, “development types” representing plan designations and calibrated to match the employment densities listed in the following section, were applied to all buildable acres. A redevelopment rate calibrated to match the estimate of redevelopment potential was applied to developed land. The assumptions and methodologies used to translate buildable area into jobs in Envision Tomorrow are described in greater detail in the Bend Urbanization Report (2016). This section summarizes the key assumptions and output used in Envision Tomorrow for the “base case”, i.e. the pre-policy projection of current trends, and the results of the efficiency measures (post-policy capacity).
Employment land capacity and deficiency As stated above, the Envision Tomorrow model estimates the capacity of vacant and redevelopable land to accommodate new employment. Table 18 shows the residual employment need for the 2013-2028 period by broad land use category. The results show that Bend does not have enough land in its UGB to accommodate all employment types with the exception of public employment. There is an overall deficit of land for 8,317 employees.

Bend Economic Opportunities Analysis August 31, 2016 Page 52 of 122
Table 18. Base Case Employment Capacity Compared to Employment Needs by Employment Category, Bend UGB 2014
Source: Bend Urbanization Report (2016) Notes: [1] The employment need categories have been generalized for simplicity in comparing against capacity as measured in Envision Tomorrow. [2] Public jobs do not include school-based employment in actual school facilities which tend to be located in residential areas. Schools are addressed as a separate land need. The surplus of capacity for public jobs inside the UGB does not subtract from the need for employment capacity of other types, since land designated Public Facilities (where most of the public employment capacity comes from) generally will not provide opportunities for private-sector retail, office, or industrial development.
Table 19 estimates the number of sites needed to accommodate the residual employment need from Table 18. The distribution (e.g., percentage) of employment by employment category and site size from Table 5 was used allocate residual employment need to employment categories and site sizes. The average employees per site from Table 7 was used to estimate the number of needed sites. For example, 2,926 Retail & Hospitality employees expected to locate on sites smaller than five acres divided by an average of 23 employees per site for sites smaller than five acres yields a need of 128 sites smaller than five acres for Retail & Hospitality employees.
The results show that Bend has a deficit of 267 sites smaller than five acres and 13 sites between 5 and 50 acres under the Base Case Scenario.
Table 19. Vacant Employment Land by General Plan Designation and lot size, Base Case Scenario, Bend UGB 2014
Source: Residual Employment Need from the Bend Urbanization Report (2016), Distribution of Employment in Bend (Table 5) and Average Employees per Site (Table 7)

Bend Economic Opportunities Analysis August 31, 2016 Page 53 of 122
Efficiency Measures (Post-Policy Capacity) The Bend Urbanization Report presents an analysis of land use efficiency measures considered and agreed on through the project. The land use efficiency measures include policies, plan and zoning map amendments and code amendments that increase the efficient use of land within the Bend UGB.
The package of land use efficiency measures that will be adopted with the proposed UGB amendments related to the EOA include: new mixed-use zones, revisions to parking standards, allowing more intense development in the Mixed Employment zone, identifying commercial and industrial areas for zone or comprehensive plan map changes, and other policy changes.
Table 20 shows the change in jobs capacity as a result of the efficiency measures. Even with this additional capacity, Bend has a residual employment need that cannot be met within the UGB.
Table 20. Employment Capacity with Efficiency Measures Compared to Employment Needs by Employment Category, Bend, 2014-2028
Source: ECONorthwest
Short-term land supply
Remand and State Requirements The Remand requires the City provide more evidence to demonstrate that it complies with the requirement to maintain a short-term land supply as required by OAR 660-009-0015(3)(a)(C):
“For cities and counties within a Metropolitan Planning Organization, the inventory must also include the approximate total acreage and percentage of sites within each plan or zoning district that comprise the short-term supply of land.”
Bend is within a Metropolitan Planning Organization (MPO) and is therefore required to conduct the analysis. OAR 660-009-0005(10) defines short-term land supply as follows:
"Short-term Supply of Land" means suitable land that is ready for construction within one year of an application for a building permit or request for service extension. Engineering feasibility is sufficient to qualify land for the short-term supply of land. Funding availability is not required. "Competitive Short-term Supply" means the short-term supply of land provides a range of site sizes and

Bend Economic Opportunities Analysis August 31, 2016 Page 54 of 122
locations to accommodate the market needs of a variety of industrial and other employment uses.
The Remand provides the following guidance with respect to meeting the requirements of OAR 660-009-0015(3)(a)(C):
Under OAR 660-009-0015(3)(a)(C), the EOA Inventory of Industrial and Other Employment Lands for cities and counties within a Metropolitan Planning Organization, must include the approximate total acreage and percentage of sites within each plan or zoning district that comprise the short-term supply of land.
This short-term supply analysis required for jurisdictions within MPOs is in addition to the EOA inventory requirements applicable to all comprehensive plans for areas within urban growth boundaries. OAR 660-009-0015(3)(a)
Furthermore, division 9 requires that comprehensive plans for cities such as Bend “include detailed strategies for preparing the total land supply for development and for replacing the short-term supply of land as it is developed.” OAR 660-009-0020(2).
The Commission concludes that the Goal 9 rule requires the City to include policies for maintaining a short-term supply.
The City must plan for required infrastructure and have identified the funding mechanisms. State law requires the city to describe development constraints or infrastructure needs on vacant lands and determine the amount of vacant acreage by plan designation that qualifies as short-term supply. OAR 660-009-0005(9) establishes the definition of “serviceable” as:
“the city or county has determined that public facilities and transportation facilities, as defined by OAR chapter 660, division 011 and division 012, currently have adequate capacity for development planned in the service area where the site is located or can be upgraded to have adequate capacity within the 20-year planning period.”
Since all vacant land is theoretically “serviceable” because a city could state it “can be upgraded”, Bend staff created a working definition so that a site is “serviceable” if adopted water, sewer, and transportation master plans are currently written to serve the property. That is, all land within the current UGB is considered serviceable in the Goal 9 context.
Operationalizing short term supply analysis It is worth parsing the elements of the rule to better understand the requirements. The first issue is temporal in nature: “land that is ready for construction within one year of an application for a building permit or request for service extension.” Thus, the definition establishes a one year threshold. The second is the concept of “engineering feasibility.” The rule doesn’t provide guidance on how to operationalize “engineering feasibility.” For the purpose of this analysis, the consulting team defines engineering feasibility as the ability to provide the needed backbone infrastructure to the site within one year. On site infrastructure is not part of engineering

Bend Economic Opportunities Analysis August 31, 2016 Page 55 of 122
feasibility. The final issue is related to funding. The City is not required to demonstrate that it has the funds available to develop the infrastructure.
The analysis includes evaluation of water, wastewater, stormwater, and transportation infrastructure. Whether a specific site meets the standards for short term supply was determined by analysis of functional plans and capital improvement programs. For the purpose of this analysis, we used the end of 2017 in the evaluation.
City Functional Planning Efforts The evaluation of short-term land supply is directly related to infrastructure plans (called “functional” plans). For the purpose of this analysis the relevant functional plans are water, wastewater, stormwater, and transportation.
Since the Remand was issued in 2010, the City has completed substantial of planning work for infrastructure. These plans include:
• Water System Master Plan - 2011 Update (Optimization Study). This plan covers level of service goals, present and future deficiencies, assessment of fire flow capacity in the system and the results of a comprehensive analysis using an optimized decision support process to evaluate alternatives that address system deficiencies now and in the future. The results of this study are a recommended set of system improvements to meet water needs within Bend’s water service area for at least 20 years.
• Water Management and Conservation Plan – 2011. The purpose of this Plan is to guide the development, financing, and implementation of water management and conservation programs and policies to ensure sustainable use of publicly owned water resources while the City plans for its future water needs.
• Collection System Master Plan – 2014. The Wastewater Collection System Master Plan (CSMP) is a 20-year critical planning document that establishes a clear vision for the City’s sewer collection system. The CSMP identifies both short term and long-term system improvements that are needed to address existing condition, existing capacity, and future capacity issues.
• Water Reclamation Facility Plan. This plan outlines several cost-effective solutions for increasing the plant’s ability to meet projected wastewater flows through the year 2030.
• Stormwater Master Plan. In 2014, the City Council approved the City's first formal Stormwater Master Plan that serves as the oversight plan for addressing stormwater quantity and quality issues. In addition, this Plan provides a delineation of drainage areas and runoff quantities throughout Bend, and programmatic goals for addressing quantity and quality concerns.
• Bend Urban Area Transportation Plan – 2011. The purpose of the Bend Urban Area TSP is to help guide the development of a transportation system that will meet the forecast needs of the Bend community. This plan provides a policy and plan framework that will continue to enable Bend to design a balanced transportation system for the near-term and the next twenty years.
• NE Bend Transportation Study – 2009. The NE Bend Transportation Study is an umbrella effort to coordinate transportation system planning, land use planning, and

Bend Economic Opportunities Analysis August 31, 2016 Page 56 of 122
project development work underway in the north‐east part of the City of Bend. The study was initiated by specific direction given from the City of Bend City Council and the Oregon Transportation Commission (OTC) to investigate strategies that support better use of the local (i.e., non‐highway) transportation system for shorter distance travel and decrease local trip reliance on the state highways.
Analysis and Findings This section evaluates Bend’s ability to provide a short-term supply of employment lands. It evaluates key services—water, wastewater, stormwater and transportation—and concludes with a summary of land by plan designation that meets the short-term supply standard as stated in OAR 660-009-0015(3)(a)(C).
Water To better understand the extent to which water capacity and systems will support employment growth, the City commissioned Murray, Smith & Associates (MSA) to analyze whether the existing system would accommodate a 25% increase in employment given planned system enhancements. The analysis builds on the capacity analysis performed for the City of Bend’s Water System Master Plan (WMP) completed in 2011. The updated hydraulic model developed for the WMP was used as a tool to identify capacity constraints and bottlenecks associated with a twenty-five (25) percent increase in employment above existing conditions. In summary, the analysis answers the question of whether 25% of Bend’s land could be provided water service making it available as short-term supply with the assumption that 25% of the forecast employment growth would consume 25% of the land.
The City’s water service area includes the City’s current urban growth boundary (UGB), which includes most of the City of Bend, as well as the Tetherow Development and Juniper Ridge Development Phases 1 and 2. Two private water utilities, Avion Water Company and Roats Water System, Inc., serve the portions of the area within the UGB not served by the City’s water system. Seventy-five to eighty percent of the UGB is served by the City of Bend.
As described above, the City has recently completed system plans for water distribution and conservation. The Water System Master Plan Update Optimization Study (February 2011) is a detailed analysis of water supply and demand and includes a 10-year capital improvement plan to accommodate expected growth and system improvements to accommodate forecast growth. The Water Management and Conservation Plan (June 2011) is intended to guide the development, financing, and implementation of water management and conservation programs and policies for Bend.
To forecast system demand, the City used data from the 2008 buildable lands inventory and other sources. The plan forecasts that average daily demand (ADD) will increase from 14.3 million gallons in 2010 to 29.1 in 2030. Maximum daily demand (MDD) is projected to increase from 32.2 million gallons to 65.1 million gallons. The plan concludes that the water supply provided by the City’s existing water rights, however, currently can be relied upon only to provide approximately 51.8 mgd of supply during periods of high demand. Consequently, the City will need to fully exercise its existing water rights and may need additional water supply to meet its projected 2030 MDD.
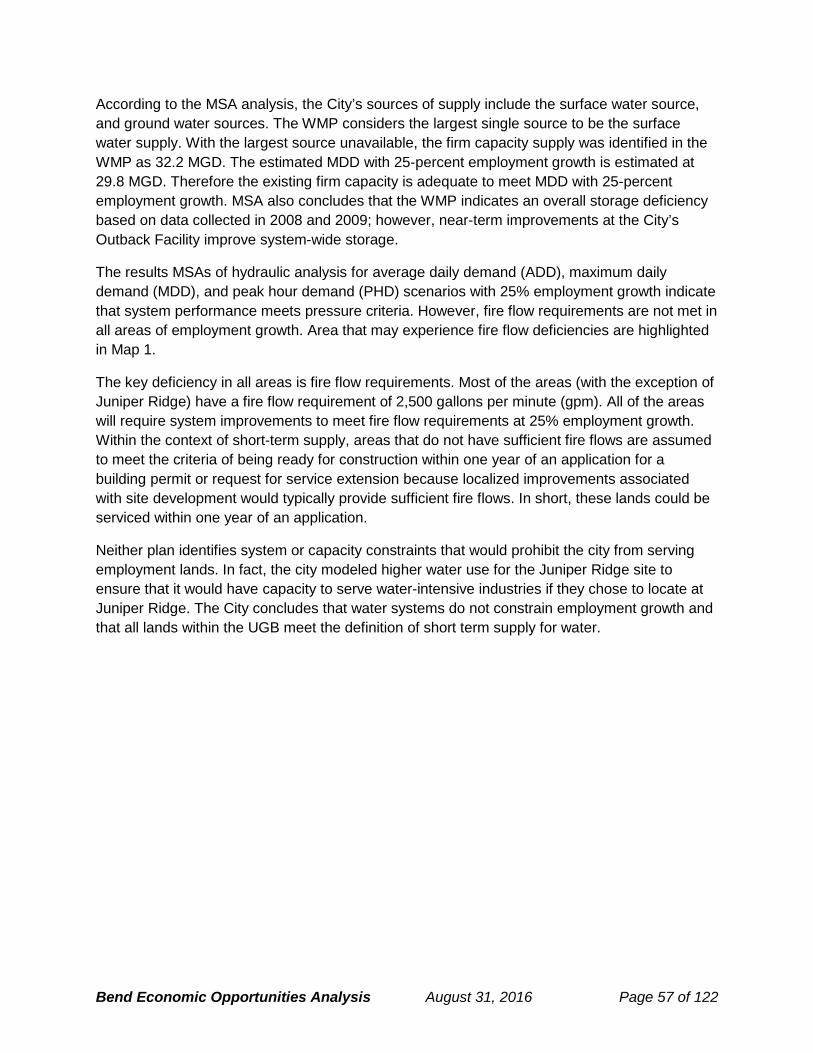
Bend Economic Opportunities Analysis August 31, 2016 Page 57 of 122
According to the MSA analysis, the City’s sources of supply include the surface water source, and ground water sources. The WMP considers the largest single source to be the surface water supply. With the largest source unavailable, the firm capacity supply was identified in the WMP as 32.2 MGD. The estimated MDD with 25-percent employment growth is estimated at 29.8 MGD. Therefore the existing firm capacity is adequate to meet MDD with 25-percent employment growth. MSA also concludes that the WMP indicates an overall storage deficiency based on data collected in 2008 and 2009; however, near-term improvements at the City’s Outback Facility improve system-wide storage.
The results MSAs of hydraulic analysis for average daily demand (ADD), maximum daily demand (MDD), and peak hour demand (PHD) scenarios with 25% employment growth indicate that system performance meets pressure criteria. However, fire flow requirements are not met in all areas of employment growth. Area that may experience fire flow deficiencies are highlighted in Map 1.
The key deficiency in all areas is fire flow requirements. Most of the areas (with the exception of Juniper Ridge) have a fire flow requirement of 2,500 gallons per minute (gpm). All of the areas will require system improvements to meet fire flow requirements at 25% employment growth. Within the context of short-term supply, areas that do not have sufficient fire flows are assumed to meet the criteria of being ready for construction within one year of an application for a building permit or request for service extension because localized improvements associated with site development would typically provide sufficient fire flows. In short, these lands could be serviced within one year of an application.
Neither plan identifies system or capacity constraints that would prohibit the city from serving employment lands. In fact, the city modeled higher water use for the Juniper Ridge site to ensure that it would have capacity to serve water-intensive industries if they chose to locate at Juniper Ridge. The City concludes that water systems do not constrain employment growth and that all lands within the UGB meet the definition of short term supply for water.
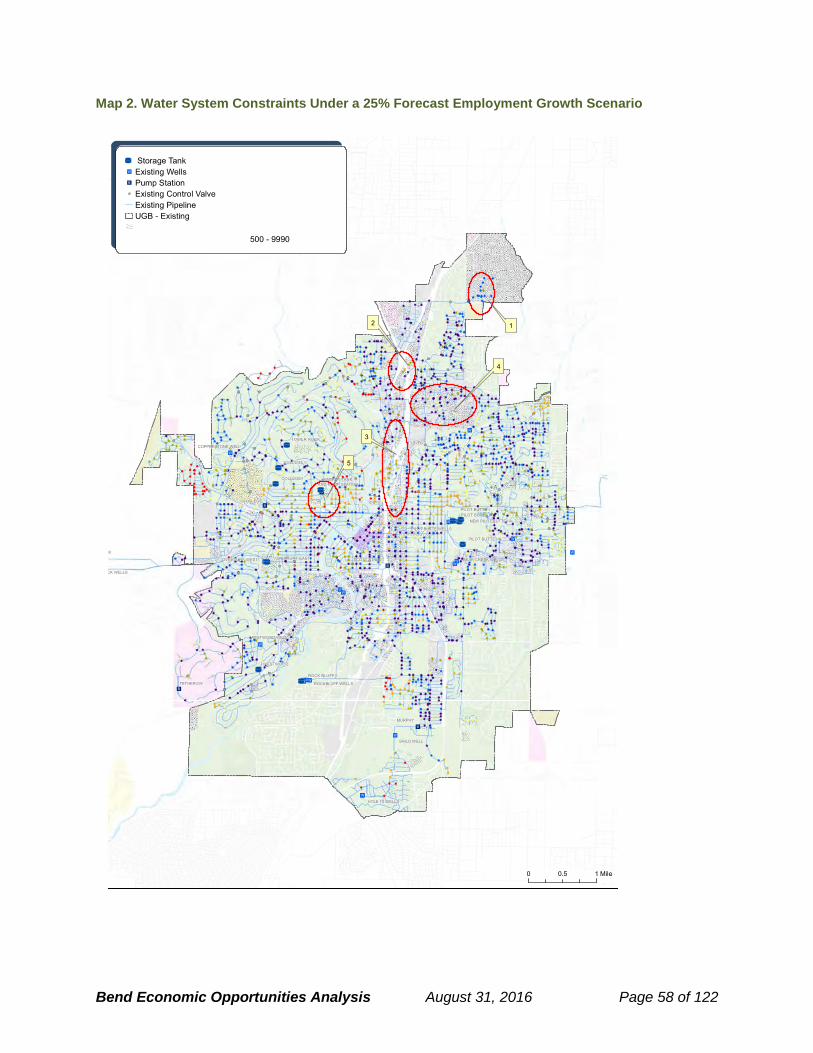
Bend Economic Opportunities Analysis August 31, 2016 Page 58 of 122
Map 2. Water System Constraints Under a 25% Forecast Employment Growth Scenario

Bend Economic Opportunities Analysis August 31, 2016 Page 59 of 122
Wastewater To better understand the extent to which wastewater capacity and systems will support employment growth, the City commissioned Murray, Smith & Associates to analyze whether the existing system would accommodate a 25% increase in employment given planned system enhancements. The analysis builds on the capacity analysis performed for the City of Bend’s Collection System Master Plan (CSMP) completed in 2014. The hydraulic model developed for the CSMP was used as a tool to identify capacity constraints and bottlenecks associated with a twenty-five (25) percent increase in employment above existing conditions. In summary, the analysis answers the question of whether 25% of Bend’s land could be provided wastewater service making it available as short-term supply with the assumption that 25% of the forecast employment growth would consume 25% of the land.
To reflect system improvements in progress and the anticipated timeframe for the UGB project, the analysis assumed that programmed improvements for 2016 and 2017 were in place. These improvements are identified in the capital improvement section of the CSMP and are scheduled for completion by December 31, 2017 (this includes three key improvements identified in the CIP – the North Area improvements, Colorado Lift Station, and Southeast Interceptor Phase I).
Table 20 shows the employment assumptions by zoning district used in the system modeling. The forecast figures are derived from Table 6, but do not include employment that will locate in residential zones (about 500 additional employees).
Table 20. 25% of Employment Forecast and Acres Serviced by Wastewater Collection Systems, by Zoning District, 2016-2036
Source: Murray Smith &Associates Note: employment forecast does not include employment that is forecast to locate in non-employment zones
The key conclusion of the analysis is that the wastewater system generally has capacity for 25% employment growth without the risk of overflow. The analysis also identifies several critical

Bend Economic Opportunities Analysis August 31, 2016 Page 60 of 122
capacity constraints which are shown in Map 3. These are described in more detail in the following sections.
North Area Constraints in the north area are related to available lift station capacity and gravity pipeline capacity prior to construction of the Northeast Interceptor. The area has capacity to serve near-term employment growth but has limitations with gravity sewer lines between Empire Avenue and Marsh Orchard Drive and between Town Drive and Wishing Well Lane.
The construction of the Northeast Interceptor (currently scheduled for approximately 2019) will address these constraints in the long-term.
Central Corridor The central corridor has limited ability to serve long-term growth due to available trunk sewer capacity prior to construction of the Southeast Interceptor Phase 2 and flow diversions from the south and southwest sub-basins to the interceptor anticipated for construction in 2022. This area can accommodate some near-term growth, but capacity constraints exist at the following locations:
• Old Mill Lift Station • Gravity lines between Studio Road and 6th Street and from Seward Avenue to Webster
Avenue • Gravity lines on Butler Market Road
South and Southeast The south and southeast areas are limited to serve long-term growth due to available trunk sewer capacity prior to construction of the Southeast Interceptor Phase 2. This area can accommodate some near-term growth, but capacity constraints exist at the following locations:
• Gravity sewer downstream of Purcell Boulevard, parallel to Cliff Drive • Shallow gravity sewer on Centennial Street between Paiute Way and Stratford Court.
To summarize, the conclusion that the system can generally accommodate growth indicates that the additional 25% employment growth creates some system deficiencies based on the City standards; however it does not cause system overflows. Note that the model results are dependent on distributed growth. If all or most the employment growth were concentrated in one location such as the north area, greater system deficiencies would occur.
Moreover, it is important to note that all three areas identified with capacity constraints will experience bottlenecks even without the 25% employment growth. The key findings from previous analyses relative to the bottlenecks are that growth may be limited prior to construction of the Southeast Interceptor Phase 2 in 2022 and the Northeast Interceptor in 2019.

Bend Economic Opportunities Analysis August 31, 2016 Page 61 of 122
Map 3. Wastewater System Constraints Under a 25% Forecast Employment Growth Scenario

Bend Economic Opportunities Analysis August 31, 2016 Page 62 of 122
Stormwater The City recently updated its stormwater system plan (November 2014). The Stormwater Public Facilities Plan (Stormwater PFP) describes the City’s existing stormwater facilities and plans for future facilities needed over a 20-year planning period.
The City relies mainly on a dispersed drainage system, relying on infiltrating and injecting stormwater close to the source of its creation using low impact development practices. This type of system relies less on “grey” infrastructure (e.g., pipes and canals) and more on so-called “low-impact development” methods that allow stormwater to be handled at or near the source. The City’s stormwater facility system is composed mainly of dry wells and drill holes, both of which are underground injection controls. In the central portion of the City, however, the City maintains a separate piped system that carries stormwater to the Deschutes River.
The plan identifies future storm drainage projects which focus on achieving design standards of designing to a 25-year storm with safe passage for the 100-year 24-hour storm. As new areas develop, the City will continue its dispersed system of handling the design storm on site as part of the project through the use of surface, regional or underground injection control disposal. New outfalls to the Deschutes River are not consistent with the City’s General Plan and are not anticipated.
The plan does not identify any major system deficiencies and the low-impact development standards suggest that stormwater improvements will not be a limitation on future employment growth.
Transportation Bend has long maintained transportation system plans. The Bend Urban Area Transportation System Plan (TSP) was updated in 2011. A special study of the Northeastern area of Bend (the NE Bend Transportation Study) was completed in 2009. The purpose of these plans and studies is to help guide the development of a transportation system that will meet the forecast needs of Bend.
The TSP concludes that several roadways throughout the urban area will approach, or exceed, their capacities under the “no-build” conditions during the peak hour. Many of the collector and arterial streets in the Bend urban area will be modernized or widened during the twenty-year planning period. The TSP identifies about 300 miles of city maintained streets and identifies approximately 15 miles of streets will be near or over capacity by the end of the planning horizon.
A key issue is addressing mobility standards. This is affected by the fact that multiple jurisdictions manage the transportation system. With respect to city-maintained facilities, the Bend city code has provisions that allow the City Manager some discretion in altering mobility standards. While relaxed mobility standards have implications for the functioning of the overall system, the flexible standards suggest that transportation on the city-maintained system will not prohibit development. In short, the conclusion is that city transportation capacity is not a limiting factor due to the ability to relax mobility standards for City streets.

Bend Economic Opportunities Analysis August 31, 2016 Page 63 of 122
Management of State facilities is more complex—particularly for the Northeast area. The NE Bend Transportation Study was an effort aimed at better understanding system limitations and to develop strategies to reduce trip reliance on state highways. Key outcomes of the project are (1) a recommended list of system improvements, (2) alternative mobility standards for state facilities, and (3) recommended transportation demand and system management strategies.
Changes to mobility standards are subject to Oregon Transportation Commission (OTC) review, a requirement would preclude a classification of short term supply for affected lands. This affects the entire northern area of the city and one site on S 3rd Street. Moreover, this directly affects lands in the North Triangle and Juniper Ridge. Growth at Juniper Ridge will have a significant impact on the Cooley/97 intersection – enough to require that the intersection be completely redesigned and reconstructed – a $40 million project.40
To address transportation issues at Juniper Ridge, the City and ODOT entered into Intergovernmental Agreement (IGA) No. 27115 to link the need for transportation through the north end of Bend to the amount of trips that could result from development at Juniper Ridge over time. Table 21 outlines the mitigation improvements tied to PM peak hour trips for each phase of development. The agreement essentially places a cap on PM peak hour trips for the site based on specific improvements.
Table 21. Mitigation Improvements, from Table 2.7.2030.B of IGA between Bend and ODOT
At this time, Juniper Ridge has capacity for 700 additional PM peak hour trips. This could be increased by implementing Transportation Demand Management (TDM) measures, but for the purpose of this analysis we rely on the figures in Table 21. To estimate the amount of land that could be developed under high and low traffic employment uses at Juniper Ridge, an analysis of trip generation using the Institute of Transportation Engineers (ITE) Trip Generation Report was
40 More detail about Juniper Ridge can be found on the City website: http://www.bendoregon.gov/index.aspx?page=615. Details pertaining to the UGB review can be found in a memorandum from Brian Rankin to the UGB Steering Committee: http://www.bendoregon.gov/modules/showdocument.aspx?documentid=22403

Bend Economic Opportunities Analysis August 31, 2016 Page 64 of 122
completed. The analysis tested various industrial uses (e.g., light, heavy, warehousing, distribution) and office uses (e.g., single tenant offices, corporate headquarters, R&D center). Depending on the use, and without TDM strategies, between 20 and 100 acres could develop at Juniper Ridge under the trip cap. For the purpose of the short-term supply analysis, 50 acres at Juniper Ridge are assumed meet the definition of short-term supply.
In summary, Bend can accommodate 25% employment growth with the existing transportation system. Limitations exist in some areas such as Juniper Ridge that could preclude full build out, but other options exist for siting employment.
Summary Table 22 presents a summary of total land supply and short-term land supply by plan designation for the current Bend UGB. The results show that 62% of employment land meets the definition of short-term supply. Juniper Ridge is the key area where service deficiencies limit development, but these limitations may be mitigated through TDM strategies to reduce trip generation.
Table 22. Total and short-term land supply for employment, Bend UGB, 2016
Source: Analysis by ECONorthwest
Plan Designation Total Land Supply
Short-Term Land Supply
Percent of Total Land
SupplyCommercial / Mixed Use 280 280 100%
CB - - -CC 12 12 100%CG 104 104 100%CL 75 75 100%MR 40 40 100%PO 49 49 100%
Industrial / Mixed Employment 690 267 39%IG 8 8 100%IL 601 178 30%ME 81 81 100%
Public Facilities 86 86 100%PF 86 86 100%
Total 1,056 634 60%

Bend Economic Opportunities Analysis August 31, 2016 Page 65 of 122
Based on this analysis, the City concludes that it meets the OAR 600-009-0025(3)(a) that the city provide at least 25 percent of the total land supply within the urban growth boundary designated for industrial and other employment uses as short-term supply. Additionally, the City will include policies in the Comprehensive Plan to monitor and maintain the acreage of employment lands that qualify as competitive short-term supply. The policy framework in Chapter 6 (Employment) includes:
• Identification of obstacles that prevent lands from qualifying as competitive short-term supply, and
• Efforts, plans, and potential funding mechanisms to prepare lands to qualify as competitive short-term supply.
Conclusions
The conclusions of the economic opportunities analysis for the Base Case (without Efficiency Measures) are:
• Bend does not have sufficient employment land to accommodate forecast employment growth. The analysis shows that Bend does not have enough land in its UGB to accommodate all employment types with the exception of public employment. There is an overall deficit of land for 8,317 employees.
• Bend has a deficit of employment sites. The analysis shows that Bend has a deficit of 267 sites smaller than five acres and 13 sites between 5 and 50 acres.
• Bend meets the requirement to provide 25% of its total employment land supply as short-term supply. The analysis shows that nearly 60% of employment land meets the definition of short term supply. Juniper Ridge is the key area where service deficiencies limit development.
The Bend Urbanization Report (2016) proposes efficiency measures to accommodate the deficit of land for 8,180 employees. These efficiency measures include:
• New mixed use zones to accommodate commercial and residential development • Changes to existing mixed use zones, such as: reductions in parking requirements,
changes to allow more intense development the Mixed Employment zone, and minimum residential density standards in some mixed use zones.
• Identification of key opportunity sites as areas to increase development density and capacity for employment, as well as residential, uses. Plan amendments and/or zone changes are proposed for specific opportunity sites.
Table 17 in the Bend Urbanization Report shows that the employment need decreases to a land deficit for 7,215 employees (down from a base case deficit of 8,317 employees) as a result of these efficiency measures. The Bend Urbanization Report concludes that 67% of Bend’s employment growth will be accommodated within the UGB on vacant lands and through the efficiency measures.

Bend Economic Opportunities Analysis August 31, 2016 Page 66 of 122
APPENDIX A. NATIONAL, STATE, REGIONAL, COUNTY, AND LOCAL TRENDS AFFECTING FUTURE ECONOMIC GROWTH Economic development in Bend over the next twenty years will occur in the context of long-run national trends. Appendix A provides more detailed information on trends affective future economic growth and is intended to support the analysis required by OAR 660-009-0015(1). The most important of these trends include:
• At the largest scale, the effects of “globalization” – the increasingly free movement of jobs, capital, and products throughout the world – are being felt in communities across the United States. One effect of globalization is that low-skill manufacturing jobs will increasingly take place elsewhere, where wages are far lower. Thus, in order to compete and earn living-wage salaries, American workers must pursue higher-skilled jobs in “knowledge based” industries. While some of these jobs will continue to be in manufacturing industries, the largest job growth will take place in new industries such as information technology, professional services, and other sectors.
• Economic growth will continue at a moderate pace. Annual growth rates (in real GDP) are projected to be roughly 3 percent through 2017. The Congressional Budget Office (CBO) estimates that unemployment rates will continue to decline but remain above 6.0 percent until late 2016.
• The aging of the baby boom generation, accompanied by increases in life expectancy. The number of people age 65 and older will more than double by 2050. This trend can be seen in Oregon, where the share of workers 65 years and older grew 2.9 percent of the workforce in 2000 to 4.1 percent of the workforce in 2010, an increase of 41 percent.
• The need for workers to replace retiring baby boomers will outpace job growth. According to the Bureau of Labor Statistics, net replacement needs will be 33.7 million job openings over the 2010-2020 period, compared with growth in employment of 21.1 million jobs.
• Education will be an important determinant of wages and household income. According to the Bureau of Labor Statistics, a majority of the fastest growing occupations will require an academic degree, and on average they will yield higher incomes than occupations that do not require an academic degree.
State, Regional, and Local Trends
State, regional, and local trends will all affect economic development in Bend. This section presents data for Bend and the surrounding areas that will affect the city’s growth over the planning period.
Overall Employment Growth According to the Oregon Employment Department, Oregon’s employment peaked in the first quarter of 2008 (at more than 1.74 million jobs) and hit its lowest point in the first quarter of 2010 (at about 1.59 million jobs), losing 146,000 jobs over the two-year period. However, Oregon added about 52,000 jobs between 2010 and December 2012. After hovering around

Bend Economic Opportunities Analysis August 31, 2016 Page 67 of 122
1.5% in the early stages of the recovery, growth kicked into higher gear in late 2013. Since then, the state has added jobs to the tune of about 3% annually; similar to what Oregon experienced during the housing boom years preceding the Great Recession, and about a full percentage point faster than the nation.
The Oregon Office of Economic Analysis (OEA) points out that, in addition to job growth, other economic indicators have shown recent improvement. These trends point to a deeper, more robust economic recovery and a return to more normal labor market dynamics. For example, new business filings in Oregon are increasing. OEA sees firm creation as a positive sign, as entrepreneurs and start-ups often drive innovation and the development of new technology.
As in 2008, employment is still forecast to grow over the next decade. According to data from the Bureau of Labor Statistics and the Oregon Employment Department total employment in Deschutes County grew by about 21% from 2001 to 2013, and total covered employment throughout Central Oregon (Deschutes, Crook and Jefferson Counties) is forecast to grow by about 16% over the period from 2012 to 2022.
Labor Trends
Growing Population Table A- 1 shows population change from 1990 to 2013 for Oregon, Deschutes County, and Bend. Bend’s population grew at the fastest annual rate since 1990, increasing by an average of 6% per year, almost tripling over the 23-year period. In 2013, Bend’s population was about 78,000 people, compared to 163,000 in the county as a whole and 3,919,000 throughout the state.
Table A- 1. Population, Oregon, Deschutes County, Bend, 1990-2013
Source: Population Research Center, Portland State University, http://www.pdx.edu/prc/.
Figure A- 1 compares the average annual growth rates for population, household size, and family size for the nation, Oregon, Deschutes County, and Bend, from 2000-2013. Population grew faster than household size for all geographies except for Oregon.
From 2000 to 2013, Bend’s population grew at a 3.8% average annual growth rate, compared to 3.1% in Deschutes County, 1.2% in Oregon, and 1.0 percent in the nation as a whole. Oregon’s

Bend Economic Opportunities Analysis August 31, 2016 Page 68 of 122
household size increased at a 2.9% average annual growth rate, compared to 0.8% in Bend, 0.1% in Deschutes County, and 0.2% in the nation.
Figure A- 1. Average Annual Population Growth Rate, United States, Oregon, Deschutes County, Bend, 2000-2013
Source: US Census, Portland State University Population Research Center.
Aging Population
Figure A- 2 shows the distribution of age groups in Oregon, Deschutes County, and Bend in 2013. Bend has a larger share of 20 to 39 year olds, about 30% of the city’s population, compared, to about 25% for Deschutes County as a whole, and about 27% in Oregon.
Since, 2000 60-to-69-year-old age group has grown the fastest, increasing by 138%, and increasing its share of the overall population by 15%. The next-fastest group was the 50-to-59-year-old group, who increased by 104%, and increasing their share of the population by 20%. People in these age groups will eventually retire, meaning they will both leave the workforce and require changes in their housing and care.

Bend Economic Opportunities Analysis August 31, 2016 Page 69 of 122
Figure A- 2. Population by Age, Oregon, Deschutes County, Bend, 2013
Source: Census Bureau, 2013 American Community Survey.
In-Migration
Continued in-migration from other states will drive growth in Oregon. Key trends are that:
• Population in the county and the Bend urban area will continue to grow at a higher rate than the rest of the state
• The majority of population growth will come from people moving into the area
• The baby-boomer generation’s children and grandchildren will make up the biggest percentage of the population and the workforce”
These conclusions remain relevant. About 5.3 percent of Oregon’s population lives in the Central Oregon counties of Crook, Deschutes, and Jefferson. OEA forecasts that Central Oregon’s share of the population will increase to about 5.7 percent by the year 2040. The population in Deschutes County alone may grow by 45% over the period from 2014 to 2040, outpacing the rate of 31% for the state as a whole, according to data from OEA and Portland State University’s Population Research Center.
According to a U.S. Census study, Oregon had net interstate in-migration (more people moved to Oregon than moved from Oregon) during the period 1990-2010. Oregon had an annual

Bend Economic Opportunities Analysis August 31, 2016 Page 70 of 122
average of about 15,600 more in-migrants than out-migrants during the period 2010-2013. Net migration will lead to over 71,000 new residents between 2015 and 2040, while births alone will add only about 54,000.
Income
The 2008 EOA found that, while in general Bend’s income composition was similar to that of the county, the state, and the nation, Bend’s median income was slightly lower than the national level. “The 2006 American Community Survey shows the City of Bend is similar to the U.S., State of Oregon, and Deschutes County. 2006 median income for Bend is $58,225, which is slightly higher than the $55,414 for Deschutes County, $55,923 for Oregon, and slightly lower than $58,526 for the U.S. Per capita income for the City of Bend is $26,140, which is slightly higher than the county, state, and nation” (2008 EOA).
Since the 2008 EOA, Bend’s average income has diminished slightly. In 2013, Bend’s median income of $48,014, was above that of Deschutes County ($46,791), but below that of Oregon ($50,251), and the nation ($52,250). The decrease from 2008 to 2013 may indicate a lag in the post-recession recovery, rather than a permanent shift downward for Bend-area wages.
Statewide, wages fell during the recession, but increased after 2010. The Oregon Office of Economic Analysis in March 2015 had most recently observed a 7% annual increase in wages statewide, and per worker average wages increased 3% in 2015. OEA noted that growth in income, wages, and population picked up in 2014, and all grew more rapidly than the nation. However, after accounting for inflation, average wages had only increased less than half of one percent since 2000.
Personal income statewide is projected to grow by 5.1% in 2015, and 5.8% in 2016, according to the Oregon Employment Department. The Office of Economic Analysis also forecasts that wage growth will continue to increase as the labor market tightens, and it may tighten the fastest in Central Oregon, where employment growth is expected to occur faster than in any other metro area. In other words, the decrease in Bend’s median household income since 2008 may illustrate its disproportionate shock from the recession; as the region’s labor market continues to recover, so too will its typical wages. 41
Figure A- 3 shows household income by income group for Bend from 1990 to 2013. In 2013, the largest household income group in Bend was the $50,000 to $74,999 group, which made up 16% of all households. About 26% of households earned less than $25,000, and about 20% of households earned more than $100,000.
41 “Oregon Economic and Revenue Forecast,” Oregon Office of Economic Analysis, March 2015, http://www.oregon.gov/DAS/OEA/docs/economic/forecast0315.pdf.

Bend Economic Opportunities Analysis August 31, 2016 Page 71 of 122
Figure A- 3. Household income by income group, Bend, 2013
Source: Census Bureau, 2013 American Community Survey.
Figure A- 4 shows household income by income by income group for Bend in 2013. About 34% of households earn incomes that put them in the lower income category, 15% earn lower-middle incomes, 19% earn upper-middle incomes, and 33% earn higher incomes.

Bend Economic Opportunities Analysis August 31, 2016 Page 72 of 122
Figure A- 4. Household income by income group, Bend, 2013
Source: Census Bureau, 2013 American Community Survey.
Figure A- 5 shows per capita personal income in the U.S., Oregon, and Deschutes County, from 1980 to 2013 in base 2014 dollars. Real per capita income increased for all geographies since 1980. In 2013, incomes in the U.S. as a whole ($45,660 in 2014 Dollars) were higher than in Oregon ($40,645), and Deschutes County ($40,245).
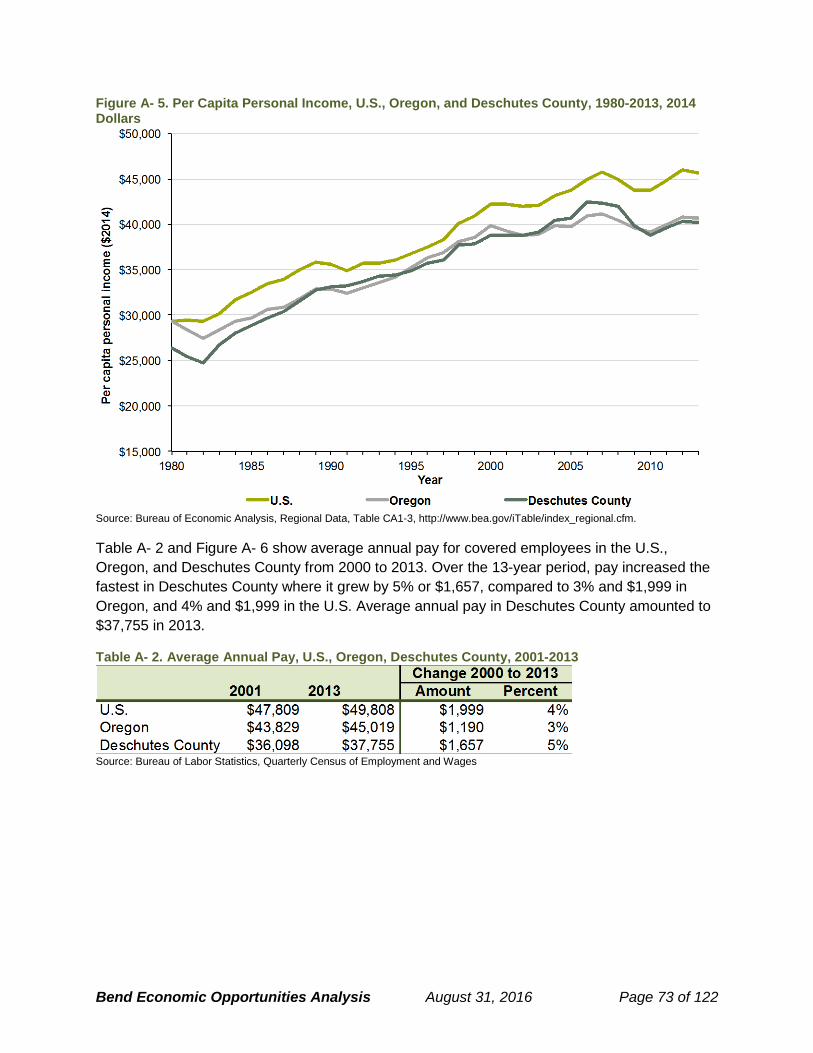
Bend Economic Opportunities Analysis August 31, 2016 Page 73 of 122
Figure A- 5. Per Capita Personal Income, U.S., Oregon, and Deschutes County, 1980-2013, 2014 Dollars
Source: Bureau of Economic Analysis, Regional Data, Table CA1-3, http://www.bea.gov/iTable/index_regional.cfm.
Table A- 2 and Figure A- 6 show average annual pay for covered employees in the U.S., Oregon, and Deschutes County from 2000 to 2013. Over the 13-year period, pay increased the fastest in Deschutes County where it grew by 5% or $1,657, compared to 3% and $1,999 in Oregon, and 4% and $1,999 in the U.S. Average annual pay in Deschutes County amounted to $37,755 in 2013.
Table A- 2. Average Annual Pay, U.S., Oregon, Deschutes County, 2001-2013
Source: Bureau of Labor Statistics, Quarterly Census of Employment and Wages

Bend Economic Opportunities Analysis August 31, 2016 Page 74 of 122
Figure A- 6. Average Annual Pay, U.S., Oregon, Deschutes County, 2001-2013, 2013 Dollars
Source: Bureau of Labor Statistics, Quarterly Census of Employment and Wages.
Figure A- 7 shows wages by industry for Deschutes County from 2001 to 2013. The Private Non-Classified industries grew the fastest, increasing by about 74%. In 2013, the Natural Resources and Mining and Utilities industries were both more than double the average wage for covered employees overall. In contrast, wages for Arts Entertainment and Recreation and Accommodation and Food Services were about 50% below the average wage overall.

Bend Economic Opportunities Analysis August 31, 2016 Page 75 of 122
Figure A- 7. Wages and number of employees by industry, Deschutes County, 2013
Source: Bureau of Labor Statistics, Quarterly Census of Employment and Wages.
Figure A- 8 shows the percent of residents in poverty for Oregon, Deschutes County, and Bend. Bend has the lowest share of impoverished residents (13.9%) compared to Deschutes County (16.0%), and the state as a whole (16.7%).

Bend Economic Opportunities Analysis August 31, 2016 Page 76 of 122
Figure A- 8. Percent below poverty line, Oregon, Deschutes County, Bend, 2013
Source: Census Bureau, 2013 American Community Survey.
Educational Attainment
In 2008, the Bend EOA concluded that: “Bend’s relatively high percentage of college educated workers will tend to generate high paying jobs, be more responsive to economic changes over time, increase average incomes of the entire workforce, and may generate positive social benefits like reduced crime rates and higher real estate prices.” As in 2008, Bend in 2013 still has a higher share of college-educated residents than the county and the state. In 2009, Bend had more adults with a bachelor’s degree or higher (about 40%) than Deschutes County (about 35%) and Oregon (about 30%). Furthermore, in line with the assessment from 2008, Bend also has a lower rate of poverty than the county and the state.
Figure A- 9 educational attainment for the population older than 25 years in Oregon, Deschutes County, and Bend in 2013. Bend has the highest share of adults with a bachelor’s degree or higher (about 40%), compared to about 35% and 30% in Deschutes County and Oregon respectively.

Bend Economic Opportunities Analysis August 31, 2016 Page 77 of 122
Figure A- 9. Educational attainment, Population Age 25 and Over, Oregon, Deschutes County, Bend, 2013
Source: Census Bureau, 2013 American Community Survey.
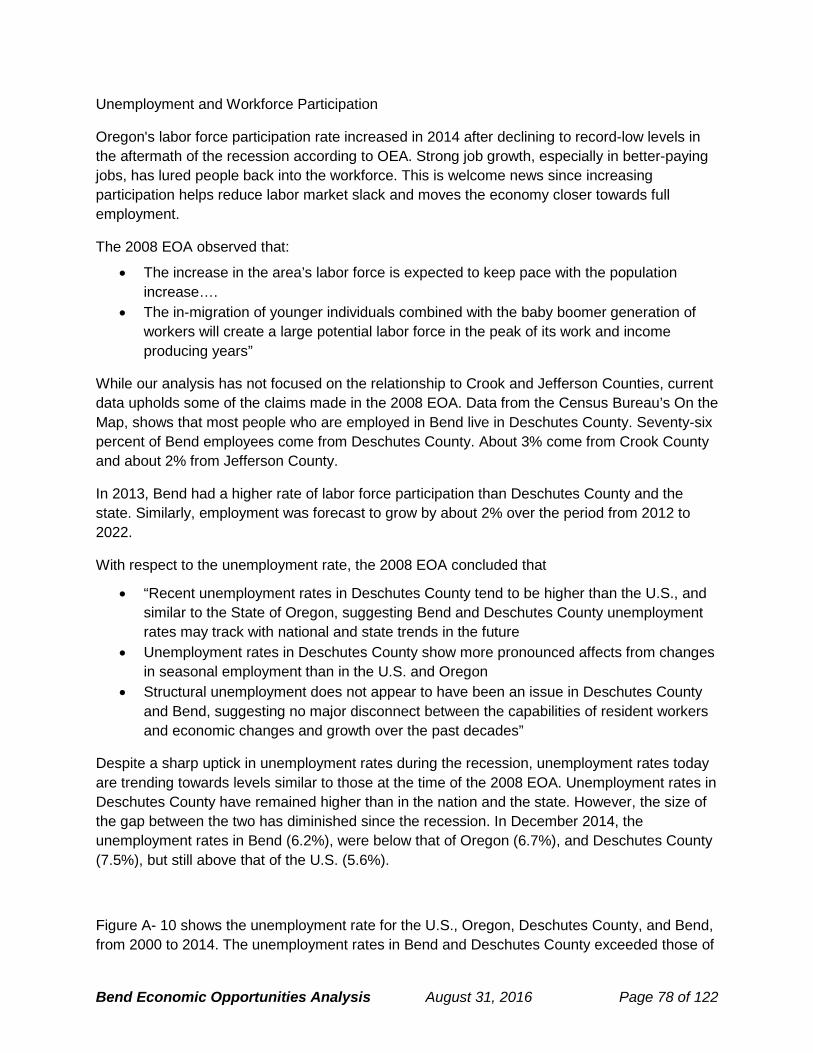
Bend Economic Opportunities Analysis August 31, 2016 Page 78 of 122
Unemployment and Workforce Participation
Oregon's labor force participation rate increased in 2014 after declining to record-low levels in the aftermath of the recession according to OEA. Strong job growth, especially in better-paying jobs, has lured people back into the workforce. This is welcome news since increasing participation helps reduce labor market slack and moves the economy closer towards full employment.
The 2008 EOA observed that:
• The increase in the area’s labor force is expected to keep pace with the population increase….
• The in-migration of younger individuals combined with the baby boomer generation of workers will create a large potential labor force in the peak of its work and income producing years”
While our analysis has not focused on the relationship to Crook and Jefferson Counties, current data upholds some of the claims made in the 2008 EOA. Data from the Census Bureau’s On the Map, shows that most people who are employed in Bend live in Deschutes County. Seventy-six percent of Bend employees come from Deschutes County. About 3% come from Crook County and about 2% from Jefferson County.
In 2013, Bend had a higher rate of labor force participation than Deschutes County and the state. Similarly, employment was forecast to grow by about 2% over the period from 2012 to 2022.
With respect to the unemployment rate, the 2008 EOA concluded that
• “Recent unemployment rates in Deschutes County tend to be higher than the U.S., and similar to the State of Oregon, suggesting Bend and Deschutes County unemployment rates may track with national and state trends in the future
• Unemployment rates in Deschutes County show more pronounced affects from changes in seasonal employment than in the U.S. and Oregon
• Structural unemployment does not appear to have been an issue in Deschutes County and Bend, suggesting no major disconnect between the capabilities of resident workers and economic changes and growth over the past decades”
Despite a sharp uptick in unemployment rates during the recession, unemployment rates today are trending towards levels similar to those at the time of the 2008 EOA. Unemployment rates in Deschutes County have remained higher than in the nation and the state. However, the size of the gap between the two has diminished since the recession. In December 2014, the unemployment rates in Bend (6.2%), were below that of Oregon (6.7%), and Deschutes County (7.5%), but still above that of the U.S. (5.6%).
Figure A- 10 shows the unemployment rate for the U.S., Oregon, Deschutes County, and Bend, from 2000 to 2014. The unemployment rates in Bend and Deschutes County exceeded those of

Bend Economic Opportunities Analysis August 31, 2016 Page 79 of 122
Oregon and the U.S. during the peak of the recession. The rates reached as high as about 15% in Bend and over 16% in Deschutes County. In December 2014, the unemployment rates in Bend (6.2%), were below that of Oregon (6.7%), and Deschutes County (7.5%), but above that of the U.S. (5.6%).
Figure A- 10. Unemployment Rate, United States, Oregon, Deschutes County, Bend, 2000-2014
Source: Bureau of Labor Statistics.

Bend Economic Opportunities Analysis August 31, 2016 Page 80 of 122
Figure A- 11 shows the rate of labor force participation for Oregon, Deschutes County, and Bend in the 2011-2013 period, for the population 16 years and older. Bend has a higher rate of participation (68%), compared to the county (61%) and state (62%) as a whole.
Figure A- 11 Labor force participation, population 16 years and older, Oregon, Deschutes County, Bend, 2011-2013
Source: Census Bureau, 2011-2013 American Community Survey, Table B23001.

Bend Economic Opportunities Analysis August 31, 2016 Page 81 of 122
Commuting Patterns
Figure A- 12 shows commute times for workers in Oregon, Deschutes County, and Bend in 2013. More than half of bend residents (about 57%) have a commute of less than 15 minutes, compared to about 47% in Deschutes County, and about 33% in the state as a whole.
Figure A- 12. Commute Time, Oregon, Deschutes County, Bend, 2013
Source: Census Bureau, 2013 American Community Survey.

Bend Economic Opportunities Analysis August 31, 2016 Page 82 of 122
Map A- 1 shows the commute inflow and outflow for Bend in 2011. In 2011, about 18,800 people commuted from outside the city to work within it. About 7,900 resided within the city, but went outside for work, and about 19,000 both lived and worked in the city.
Map A- 1. Commute inflow and outflow, Bend, 2011
Source: U.S. Census OnTheMap http://onthemap.ces.census.gov

Bend Economic Opportunities Analysis August 31, 2016 Page 83 of 122
Table A- 3 shows where workers who have jobs in Bend live. About 76% of employees in Bend live within Deschutes County. About 50% of Bend employees also live in the city and 7% live in Redmond, the next-largest home destination.
Table A- 3. Home Destinations, Bend employees, 2011
Source: U.S. Census OnTheMap http://onthemap.ces.census.gov

Bend Economic Opportunities Analysis August 31, 2016 Page 84 of 122
Table A- 4 shows where people who live in Bend go to work. About 84% of Bend residents work in Deschutes County. About 2% work in Lane County and about 2% work in Multnomah County. About 71% of Bend residents also work in the city and 6% work in Redmond.
Table A- 4. Employment destinations, Bend residents, 2011
Source: U.S. Census OnTheMap http://onthemap.ces.census.gov
Changes in employment
Over the past few decades, employment in the U.S. has shifted from manufacturing and resource-intensive industries to service-oriented sectors of the economy. Increased worker productivity and the international outsourcing of routine tasks have led to declines in employment in the major goods-producing industries.
In the 1970s, Oregon started to transition away from reliance on traditional resource-extraction industries. An important indicator of this transition is the shift within Oregon’s manufacturing sector, with a decline in the level of employment in the Lumber & Wood Products industry42 and concurrent growth of employment in high-technology manufacturing industries (Industrial Machinery, Electronic Equipment, and Instruments).43
42 Lumber and Wood Products manufacturing is in Standard Industrial Classification (SIC) 24
43 SIC 35, 36, 38

Bend Economic Opportunities Analysis August 31, 2016 Page 85 of 122
As Oregon has transitioned away from natural resource-based industries, the composition of Oregon’s employment has shifted from natural resource based manufacturing and other industries to service industries. The share of Oregon’s total employment in Service industries increased from its 1970s average of 19% to 30% in 2000, while employment in Manufacturing declined from an average of 18% of total employment in the 1970s to an average of 12% in 2000.
Table A- 5 and Table A- 6 present data that show changes in covered employment for the Deschutes County between 1980 and 2013. 44 The changes in sectors and industries are shown in two tables: (1) between 1980 and 2000 and (2) between 2001 and 2013. The analysis is divided in this way because of changes in industry and sector classification that made it difficult to compare information about employment collected after 2001 with information collected prior to 2000.
Employment data in this section is summarized by sector, each of which includes several individual industries. For example, the Retail Trade sector includes General Merchandise Stores, Motor Vehicle and Parts Dealers, Food and Beverage Stores, and other retail industries.
Table A- 5 shows employment by industry, using SIC industry classifications, in Deschutes County from 1980 to 2000. Over the analysis period, the Services Division grew at the fastest annual rate (14%), the Retail Trade Division grew at 11% per year on average, the Construction Division grew at 10%, and the Wholesale Trade Division grew at 8%. The share of total jobs in the Services Division increased by 2% and the share of jobs in the Manufacturing Division fell by 6%. In 2000 Services jobs made up 27% of all covered jobs, and Retail and Trade made up 24% of all area jobs.
Table A- 5. Covered employment by SIC industry categories, Deschutes County, 2001-2013
Source: Bureau of Labor Statistics, Quarterly Census of Employment and Wages.
Table A- 6 shows covered employment for NAICS industry classifications, in Deschutes County from 2001 to 2013. In 2013, 15% of all jobs were in Retail, 15% were in Health and Social Assistance, and 13% were in Accommodations and Food Services. Education and Health and Social Assistance grew at the fastest annual rates, growing at 5.3% and 4.6% respectively.
44 Covered employment refers to jobs covered by unemployment insurance, which includes most wage and salary jobs but does not include sole proprietors, seasonal farm workers, and other classes of employees.

Bend Economic Opportunities Analysis August 31, 2016 Page 86 of 122
Table A- 6. Covered employment by NAICS industry, Deschutes County, 2001-2013
Source: Bureau of Labor Statistics, Quarterly Census of Employment and Wages.
The composition of Oregon’s employment has shifted from natural resource based manufacturing and other industries to service industries.
The 2008 EOA concluded that:
• “The construction industry makes up a significant portion of the county’s jobs and payroll, and downturns broader housing industry will have a negative affect local construction jobs
• In the midst of the housing and construction slowdown, Deschutes County’s diversified economy has continued to add jobs, albeit at a slower rate
• Continued diversification of the local economy will tend to create a more stable local economy as individual industries experience rapid gains or losses”
• The industrial sector in Bend is much more diverse than in the past • The continued erosion of jobs in lumber and wood products will be replaced by other
jobs in durable and non-durable manufacturing • High technology manufacturing and research and development firms create a new trend
for industrial space that function and look more like office development • The growth in retail and service jobs will be driven by several factors: population
increase, demographic mix, and tourism
Table A- 7 shows changes in covered employment in Deschutes County between 2007 and 2013. Deschutes County lost a total of 6,000 jobs during this period, with the largest losses in construction, manufacturing, retail, and administrative support. Jobs in Health Care and Social

Bend Economic Opportunities Analysis August 31, 2016 Page 87 of 122
assistance, Accommodations and Food Services had the largest growth over the six year period.
Table A- 7. Covered employment by industry, Deschutes County, 2007-2013
Source: Oregon Employment Department, City of Bend, in 2008 EOA; Bureau of Labor Statistics, Quarterly Census of Wages, 2013.
Table A- 8 shows the change in covered employment in Deschutes County between 2013 and 2015. Over this two-year period, the county added more than 9,100 additional jobs, a 14% increase. The sectors with the largest growth were construction, health and social assistance, and accommodations and food services. By 2015, Deschutes County had 3,100 more jobs than in 2007.
Table A- 8. Covered employment by NAICS industry, Deschutes County, 2013-2015
Source: Bureau of Labor Statistics, Quarterly Census of Employment and Wages.
Bend Economic Opportunities Analysis August 31, 2016 Page 88 of 122
Regional business clusters Bend exists within the Central Oregon regional economy. Regional business activity and trends will affect the types of businesses that are attracted to the region and choose to locate in the city. This section presents information about regional employment clusters in Central Oregon.
One way to assess the types of businesses that are likely to have future growth in an area is to examine relative concentration and employment growth of existing businesses. This method of analysis can help determine relationships and linkages within industries, also called industrial clusters. Sectors that are highly concentrated (meaning there are more than the “average” number of businesses in a sector in a given area) and have had high employment growth are likely to be successful industrial clusters. Sectors with either high concentration of businesses or high employment growth may be part of an emerging cluster, with potential for future growth.
Error! Reference source not found. shows industries with strong employment clusters in Deschutes County in 2012—meaning that they rank in the top 25th percentile of counties with clusters of that industry. The largest cluster is that of Hospitality and Tourism, which includes accommodations and related services, tourist attractions, cultural education, and other tourist-related services. In Deschutes County, this industry accounts for more than 2,900 employees.
Other clusters with substantial employment in Deschutes County are: Communications Equipment and Services (about 830 employees), Wood Products (551 employees), Information Technology and Analytical Instruments (504 employees), Automotive (325 employees), and Lighting and Electrical Equipment (285 employees).
Natural Resources and Manufacturing Since 1970, Oregon started to transition away from reliance on traditional resource-extraction industries. A significant indicator of this transition is the decline in the level of employment in the Lumber & Wood Products industry and concurrent growth of employment in other manufacturing industries. At the time of the 2008 EOA, job losses were forecast in manufacturing. The 2008 EOA wrote that “[m]anufacturing will likely rebound over the forecast period, but is not expected to return to its employment level prior to the recent recession. Job losses should continue in many resource-based manufacturing sectors, though at a decreasing rate.”
However in 2012, the Oregon Employment Department forecast that employment in manufacturing would increase by 21% over the period from 2010 to 2020. Employment increases would occur at that rate in both durable and nondurable goods subsectors (Employment Projections by Industry & Occupation 2010-2020). Similarly manufacturing employment statewide will grow by about 15%.
In contrast to the conclusions in 2008, Wood Product manufacturing in Central Oregon is also forecast to grow by over 22% from 2012 to 2022, while manufacturing will grow by a total of 19%.
Professional Services, Education, and Health Care As in 2008 the Oregon Employment Department still forecasts that the bulk (63%) of growth will come from sectors such as Education and Health Services (22% of total employment growth);

Bend Economic Opportunities Analysis August 31, 2016 Page 89 of 122
Trade, Transportation, and Utilities (17%); Leisure and Hospitality (13%); and Professional and Business Services (11%). Over the period from 2012 to 2022 in the Central Oregon counties of Crook, Deschutes, and Jefferson, employment in Private Education and Health Services and Professional and Business Service are both expected to increase by about 24% and increase their share of total employment by 1.0% and 0.6% respectively.
Employment levels in several industries are at all-time highs: private education, health care, food manufacturing – all of which emerged relatively unscathed from the recession – and professional and business services. The latter, combined with heath care and leisure and hospitality, account for more than half of the state's total jobs gains over the past year.
Retail As the 2008 EOA found, population will drive increases in retail jobs. The Oregon Employment Department forecasts that Retail sector employment in Central Oregon will grow by about 1,210 employees, or 12% over the 2012-2022 period. However, because this pace falls below that of overall employment growth, the share of total jobs in retail will actually fall by about 0.6%.
Key summary and implications for economic development within Bend In general the outlook for Bend in 2015 is similar to that of 2008. Bend still has a relatively well-educated workforce, an expectation for growth in population and employment in the future. Some small changes however, have occurred. For example, the construction and manufacturing industries have shrunk, while employment in health and social service industries increased. Despite changes in the levels of employment since 2007, forecasts for growth by industry will follow similar trends as those expected at the time of the 2008 EOA.
Bend’s Competitive Advantages
Economic development opportunities in Bend will be affected by local conditions as well as the national, state, and regional economic conditions addressed above. Economic conditions in Bend relative to these conditions in other parts of the region form the city’s competitive advantage for economic development, and these competitive advantages have implications for the types of firms most likely to locate and expand in the area.
There is little that cities can do to influence national and state conditions that affect economic development, but they can have some level of influence on the local factors that affect economic development. Bend’s primary competitive advantages are: location, access to transportation, quality of life, and access to educated and skilled labor from within the region. These factors make Bend attractive to residents and businesses that want a high quality of life where they live and work.
The local factors that form Bend’s competitive advantage are summarized below.
Location Bend is located in Deschutes County at the intersection of Highways 97 and 20, roughly 3.25 hours southeast of Portland, and 2.5 hours southeast of Salem. Bend lies near the center of

Bend Economic Opportunities Analysis August 31, 2016 Page 90 of 122
Oregon. Businesses in the city have access to natural resources from surrounding rural areas, including the Deschutes River, the Cascade Mountains and the Oregon High Desert.
Availability of transportation facilities Businesses and residents in Bend have access to a variety of transportation modes and systems, but the most important are Highways 97 and 20. Highway 97 connects Bend with cities throughout Central Oregon. Highway 20 connects bend with the Willamette Valley and 1-5, which provides a route for Bend businesses to connect to markets in Portland, Seattle, San Francisco and Los Angeles. Through highway and rail routes to Portland, Bend provides access to the Port of Portland from which ships can transport cargo to international markets in Asia.
The Bend Municipal Airport is roughly 5 miles southwest, or about a 15-minute drive from downtown Bend. Less than 30 minutes north of Bend, the Redmond Municipal Airport which provides daily flights to international airports like those in Portland, Seattle, San Francisco, and Los Angeles. The nearest international airport, the Portland International Airport, is about a 3-hour drive away.
The BNSF Railway Company and Union Pacific provide freight service that connects Bend to the other cities in Central Oregon, Portland, and cities in the US interior. The Prineville Railway Freight Depot, which is about 40 miles away from Bend, provides large freight loading equipment, such as ramps and cranes and large amounts of warehouse and outdoor freight storage.
Existing Employment Base In 2013, Deschutes County had nearly 6,600 employment establishments with a total of about 63,200 workers. The county’s largest employment sectors were Retail (9,605 jobs), Health and Social Assistance (9,524), Government (8,494), Accommodations & Food Services (8,262) and Manufacturing (4,209).
The Oregon Employment Department projects that the industries that will grow the most from 2012 to 2022 in Deschutes County are: Health Care and Social Assistance, which is expected to add 2,460 jobs, Professional and Business Services (1,690), and Accommodation and Food Services (1,750).
Labor Market The availability of labor is critical for economic development. Availability of labor depends not only on the number of workers, but their quality, skills, wages, and experience as well.
Businesses in Bend have access to highly educated skilled workers, nearby college students, and unskilled workers. About 41% of Bend residents over 25 years have a bachelor’s degree or higher.
Roughly 50% of Bend’s workers commute from outside the city. The commuting patterns show that businesses in Bend are able to attract skilled and unskilled workers living within the city as well as from the surrounding region.

Bend Economic Opportunities Analysis August 31, 2016 Page 91 of 122
Outdoor Recreation Bend provides a launching point for outdoor recreation destinations such as the Cascade Mountains and the Oregon High Desert. Bend is about a 30-minute drive from Mt. Bachelor, 2 hours from the John Day Fossil Beds National Monument, and 2 hours from Crater Lake National Park. The Deschutes River, which provides rafting and fishing opportunities, runs through the city.
Public facilities and services The provision of public facilities and services can impact a firm’s decision to locate within a region. Businesses also take into account factors such as the regional availability and cost of labor, transportation, raw materials, and capital. Once a business has chosen to locate within a region, they consider the factors that local governments can most directly affect: tax rates, the cost and quality of public services, and regulatory policies. Economists generally agree that these factors do affect economic development, but the effects on economic development have only a modest impact on the level and type of economic development in the community.
Tax Policy The tax policy of a jurisdiction is a consideration in economic development policy. In Fiscal Year 2014 to 2015, the property tax rate in Bend for the City was $2.80 per $1,000 of assessed value. Bend’s property tax rate was near the middle of the range for Deschutes County, lower than Redmond ($4.41), but above Sisters ($2.64), and La Pine ($1.98).45
Water The City of Bend provides water to approximately 22,000 service connections. The City collects surface water from the Bridge Creek site, 13 miles outside of the city in the Cascade Mountains, and from 25 wells that pump water from the Deschutes Aquifer. Both these water sources provide water of excellent quality, which requires “very little” treatment before delivery.
The City’s 2011 water plan update projected that the city’s average daily water demand would increase by about 70% over the period from 2008 to 2018. To accommodate the increasing demand, the plan update recommended $197 million in improvements to the current water infrastructure, including the addition of more groundwater wells, more water storage capacity, pipe improvements, pumping station expansions, and increasing the surface water supply, among others.46
Wastewater The City of Bend is the sole provider of wastewater services and no special districts within the city provide such services. The City’s wastewater system includes nine primary sewer basins
45 http://www.deschutes.org/sites/default/files/fileattachments/assessor039s_office/page/676/sal_report_-_sal4a_detail_of_taxing_district_levies.pdf
46 “Water System Master Plan Update,” Murray, Smith, & Associates, Inc, and Optimatics, The City of Bend, February 2011, http://www.ci.bend.or.us/Modules/ShowDocument.aspx?documentID=3201.
Bend Economic Opportunities Analysis August 31, 2016 Page 92 of 122
that cover about 35 square miles. The collection system includes a network of manholes, gravity pipes, lift stations, vacuum mains, and force mains that convey sewage to a centralized location.
The most-recent Collection System Master Plan (CSMP) projects that the average dry weather wastewater flow will nearly double over the next 20 years from 6.2 to about 11.5 million gallons per day. Wet weather flows will also increase, but by less, about 30%, from 8.9 to 12.0 million gallons per day.
Residential uses make up about 79% of the 6.2 million gallons per day average dry weather flow, while non-residential uses, including businesses and schools, make up about 21%. The Deschutes Brewery contributes a significant amount of the wastewater flow, making up about 12% of non-residential dry weather flow.
The wastewater master plan expects notable usage increases from four specific events: expansion of the Saint Charles Medical Center, the OSU-Cascades Campus, about 1,000 additional residential units in the Central Business District, and additional 1,200 residential units in the Transit Corridors.
Sewer infrastructure is expected to need expansive improvements over the 20-year period as Bend grows. In 2014, the CSMP recommended $90M investment in infrastructure improvements that will include additional lift stations, mechanical replacements, and increasing the overall hydraulic capacity, among others additions. 47
Stormwater Bend benefits from volcanic geography that provides absorptive ground. This porous ground has allowed Bend to rely primarily on dry wells and drill holes that drain runoff into the ground beneath the city. While a partial piped system does exist, which flows into the Deschutes River, much of the city’s stormwater runoff goes into the ground, rather than entering a citywide piping system that redirects all stormwater to a central location. The city currently has about 4,600 dry wells and 1,000 drill holes in the city that receive stormwater in this way.
Bend’s reliance on groundwater for drinking water means that stormwater infrastructure needs to protect the quality of residents’ drinking water, as well as natural waterways. To this end, regulations prevent the injection of stormwater into the ground within 500 feet of a drinking water well.
Dispersed stormwater disposal through dry wells allows the city to avoid concentrating stormwater in one location, and provides a method of stormwater management that is less costly than a citywide piped system. However, Bend’s increasing growth, and in particular its density, will place limits on the potential dispersion via dry wells and drill holes. For that reason, the 2014 Stormwater Master Plan has recommended various stormwater infrastructure upgrades including: expansion of a piped stormwater system with water-holding and treatment
47 “Collection System Master Plan,” City of Bend, December 2014, http://www.ci.bend.or.us/modules/showdocument.aspx?documentid=18059.

Bend Economic Opportunities Analysis August 31, 2016 Page 93 of 122
capacity, greater implementation of low impact development (LID), additional drainage facilities like bioswales, and more usage of GIS data to analyze stormwater conditions.48
Outlook for growth in Bend
Demand for commercial and industrial land will be driven by the expansion and relocation of existing businesses and new businesses locating in Bend. The level of this business expansion activity can be measured by employment growth in Bend. This section presents a projection of future employment levels in Central Oregon for the purpose of estimating demand for commercial and industrial land.
Table A- 9 shows the projected growth in employment by selected industrial sectors for the Central Oregon counties (Crook, Deschutes, and Jefferson). The Oregon Employment Department forecasts that employment in Central Oregon will increase by about 16% between 2012 and 2022, or by 12,140 employees. The construction industry will undergo the most rapid growth, increasing by 26% between 2012 and 2022, followed by Health Care and Social Assistance (25%), and Nondurable Goods manufacturing (25%).
48 “Stormwater Master Plan,” City of Bend, July 2014, http://www.ci.bend.or.us/modules/showdocument.aspx?documentid=17875.

Bend Economic Opportunities Analysis August 31, 2016 Page 94 of 122
Table A- 9. Industry Employment Forecast, Central Oregon Region (Crook, Deschutes, and Jefferson Counties), 2012-202
Source: State of Oregon Employment Department, “Employment Projections by Industry and Occupation 2012-2022 Central Oregon (Crook, Deschutes, Jefferson).”
APPENDIX B. EMPLOYMENT PROJECTIONS Appendix B summarizes the methodologies used to develop the employment projections and the 2008-2028 projection.
Methods
This Section contains an overview of the methodology used to generate the employment forecast. The methodology closely follows the approach prescribed by the Department of Land Conservation and Development in the EOA Guidebook. However, because economic development goals and the data available about each community vary throughout the state, there are several variations in the methodology. The DLCD recognizes that variation in methodology is appropriate. 1. Analyze existing policy and visions; national, state, county, and local trends; and other
forces likely to have an impact on Bend’s economic future 2. Forecast 20-year employment growth, 2008-2028:
a. Begin with OED 2006 employment data for the City of Bend, disaggregated to detailed industry sectors
b. Create 20-year projected growth rates for individual industry sectors: i. Begin with OED Deschutes County 2006-2016 projections

Bend Economic Opportunities Analysis August 31, 2016 Page 95 of 122
ii. Grow 2006 industry employment to 2008 by adding Bend’s slightly accelerated population growth rates (0.11 percent faster than Deschutes County) to the ten-year industry growth rates predicted by OED)
iii. Adjust employment upward (11.5 percent) to account for self-employed, contract workers, and “non-covered” employees not included in OED employment projections
iv. For land need estimates, decrease employment projections by estimating the percentages of non-shift workers in each industry
v. Grow employment from 2008 to 2015 at the 10-year adjusted employment growth rate by industry
vi. Adjust targeted industry sectors upwards by 10 percent to reflect increased growth in these sectors
vii. Grow employment from 2015 to 2025 by the City of Bend Coordinated Population Forecast Average Annual Rate of Growth at reduced rate to account for less predicted population and employment growth in this time period
viii. Apply a 1.7 percent AARG to grow 2025 employment to 2028 end of the planning period
3. Inventory Current Employment Land Supply: a. Inventory all lands with a General Plan designation for economic use and public facility
use b. Categorize all lots according to zoning designation and development category
i. General Plan designations: A variety of commercial, industrial, professional office, mixed employment, public facilities zones, detailed later
ii. Development category: Developed, Vacant, Unbuildable c. Generate inventories of Developed, Vacant and Unbuildable land within each General
Plan designation

Bend Economic Opportunities Analysis August 31, 2016 Page 96 of 122
Employment Projections
The purpose of making employment projections is twofold: (1, to anticipate future employment patterns, and (2) to estimate future economic land needs. The following describes some of the technical approaches in making employment projections and the process of converting these into land need estimates.
This EOA groups NAICS sectors into broader categories to facilitate a conversion of employment forecasts to land need. These categories are as follows:
• Employment Category. This is a generalization and simplification of more specific NAICS sectors and specific industries. The categories include:
o Industrial General and Industrial Heavy o Retail General and Large Retailers o Office/Services o Leisure and Hospitality o Other o Government o Medical (also called MDOZ referencing the city’s Medical District Overlay Zone)
• These categories are composed of employment sectors described below. In some cases, employment categories split what would traditionally be “one” employment sector. For example, Retail Trade is one employment sector, but this EOA separates the sector into two employment categories based on the three-digit NAICS coding: Retail General and Large Retailers. This allows more specific land need estimates to be created; for example, to determine land needs for large retailers seeking large sites and smaller retailers requiring smaller sites. The three-digit NAICS descriptions are shown in the tables below to describe specific industries in each employment category.
• Employment Sector. These are smaller, specific categories that describe the two-digit NAICS categories show in Tables 19-23. These include:
o Retail Trade o Agriculture, Forestry, Fishing and Hunting o Mining o Utilities o Construction o Manufacturing o Wholesale Trade o Transportation and Warehousing o Information o Finance and Insurance o Real Estate and Rental and Leasing o Professional, Scientific, and Technical Services o Management of Companies and Enterprises o Administrative and Support, Waste Management, and Remediation Services o Education Services o Health Care and Social Assistance
The following tables show:
• Employment categories above the employment sectors in the left-most column

Bend Economic Opportunities Analysis August 31, 2016 Page 97 of 122
• NAICS 2 Digit Code describing the employment sector. For example, the NAICS 2 Digit Codes for Large Retail and General Retail are 44-45
• NAICS 3 Digit Codes and their corresponding NAICS Title in the right-most column. These provide industry level detail so that a reader can easily examine the types of industries included in each employment category.
Table B- 1. Retail Employment Category, Sectors, and Industries
Source: City of Bend.
Staff researched the spatial distribution of geo-coded employment data by 3 digit NAICS throughout the City of Bend to determine where large and general retailers tend to congregate. Staff found that in general, retailers engaging in motor vehicles, building materials, gasoline station, and general merchandise stores tend to concentrate in areas designated Commercial General by the City’s General Plan. General Retail uses above tend to locate in the numerous other commercial General Plan designations. Staff then grouped retail employment into the two categories above to facilitate more fine-tuned land need estimates.
Employment CategoryNAICS 2
Digit CodeNAICS 3
Digit Code NAICS TitleRetailLarge Retail - retail trade 44-45
441 Motor Vehicle and Parts Dealers444 Building Material & Garden Supply Stores447 Gasoline Stations452 General Merchandise Stores
General Retail - retail trade 44-45442 Furniture and Home Furnishings Stores443 Electronics and Appliance Stores445 Food and Beverage Stores446 Health and Personal Care Stores448 Clothing and Clothing Accessories Stores451 Sporting Goods/Hobby/Book/Music Stores453 Miscellaneous Store Retailers454 Nonstore Retailers

Bend Economic Opportunities Analysis August 31, 2016 Page 98 of 122
Table B- 2. Industrial Employment Category, Sectors, and Industries
Source: City of Bend
Staff performed a similar analysis of the spatial distribution of industrial uses to determine where more intensive or heavy industrial uses are located in Bend. These uses tend to be located in areas designated Industrial General by the Bend General Plan. Other industrial uses tend to be
Employment CategoryNAICS 2
Digit CodeNAICS 3
Digit Code NAICS TitleIndustrial
Industrial HeavyAgriculture, forestry, fishing and hunting 11
111 Crop Production112 Animal Production113 Forestry and Logging114 Fishing; Hunting and Trapping115 Agriculture & Forestry Support Activities
Mining 21211 Oil and Gas Extraction212 Mining (except Oil and Gas)
Utilities 22221 Utilities
Construction 23237 Heavy and Civil Engineering Construction
Manufacturing 31-33311 Food Manufacturing312 Beverage & Tobacco Product Manufacturing314 Textile Product Mills315 Apparel Manufacturing316 Leather and Allied Product Manufacturing321 Wood Product Manufacturing325 Chemical Manufacturing326 Plastics & Rubber Products Manufacturing327 Nonmetallic Mineral Product Manufacturing331 Primary Metal Manufacturing332 Fabricated Metal Product Manufacturing333 Machinery Manufacturing334 Computer and Electronic Product Manufacturing335 Electrical Equipment and Appliances336 Transportation Equipment Manufacturing337 Furniture and Related Product Manufacturing339 Miscellaneous Manufacturing
Industrial GeneralConstruction 23
236 Construction of Buildings238 Specialty Trade Contractors
Manufacturing 31-33323 Printing and Related Support Activities
Wholesale Trade 42423 Merchant Wholesalers; Durable Goods424 Merchant Wholesalers; Nondurable Goods
425 Electronic Markets and Agents/BrokersTransportation and warehousing 48-49
481 Air Transportation484 Truck Transportation485 Transit and Ground Passenger Transport488 Support Activities for Transportation491 Postal Service492 Couriers and Messengers493 Warehousing and Storage

Bend Economic Opportunities Analysis August 31, 2016 Page 99 of 122
located in the areas designated Industrial Light, Industrial Park, and Mixed Employment. It is noteworthy that these uses are distributed throughout commercial districts as well as industrial and mixed employment districts.
Table B- 3. Office/Services Employment Category, Sectors, and Industries
The uses in Table B- 3 tend to be located in commercial areas, with fewer appearing in industrial and mixed use zones. Health care and social services are concentrated within the City’s Medical District Overlay Zone, which is zoned Residential Urban Medium Density.
Employment CategoryNAICS 2
Digit CodeNAICS 3
Digit Code NAICS TitleOffice/ServicesInformation 51
511 Publishing Industries512 Motion Picture & Sound Recording Industries515 Broadcasting (except Internet)516 Internet Publishing and Broadcasting517 Telecommunications518 ISPs; Search Portals; & Data Processing
Finance and Insurance 52522 Credit Intermediation & Related Activities523 Financial Investment & Related Activities524 Insurance Carriers & Related Activities
525 Funds; Trusts & Other Financial VehiclesReal Estate and Rental and Leasing 53
531 Real Estate532 Rental and Leasing Services
533 Leasers; Nonfinancial Intangible AssetsProfessional, Scientific, and Technical Services 54
541 Professional and Technical ServicesManagement of Companies and Enterprises 55
551 Management of Companies and EnterprisesAdministrative and Support, Waste Management and Remediation Services 56
561 Administrative and Support Services562 Waste Management and Remediation Services
Education Services 61611 Educational Services
Health Care and Social Assistance 62621 Ambulatory Health Care Services622 Hospitals623 Nursing and Residential Care Facilities624 Social Assistance

Bend Economic Opportunities Analysis August 31, 2016 Page 100 of 122
Table B- 4. Government Employment Category, Sectors, and Industries
The Government Employment category was created by isolating non-private ownership codes in the 2006 geo-coded employment data for Bend. Note Government includes a wide variety of employment types corresponding to the broad services provided by public entities. Industrial uses such as utilities and construction yards, the postal service, warehousing and similar uses require land zoned for industrial uses, while other governmental functions are well served in commercial centers. Employment in these sectors is classified as Government to estimate the full range of land needs for public uses later in this report.
Table B- 5 shows the Leisure and Hospitality Category and NAICS sectors included in this group. Employment in this category is generally described as Arts, Entertainment, and Recreation, Accommodation and Food Services by NAICS. The sectors illustrate the types of economic activities included in these NAICS categories. The Other category includes those uses that fall outside the NAICS sectors in previous tables.
Employment CategoryNAICS 2
Digit CodeNAICS 3
Digit Code NAICS TitleGovernmentIndustrial Heavy
11, 21, 23 113 Forestry and Logging221 Utilities237 Heavy and Civil Engineering Construction
Industrial General32, 49, 48 323 Printing and Related Support Activities
1_49 Postal Service485 Transit and Ground Passenger Transport493 Warehousing and Storage
Office/Services 51-62611 Educational Services624 Social Assistance519 Other Information Services524 Insurance Carriers & Related Activities561 Administrative and Support Services611 Educational Services
Leisure and Hospitality 71712 Museums; Parks and Historical Sites713 Amusement; Gambling & Recreation Industries
Government 92921 Executive; Legislative; & Gen Government922 Justice; Public Order; and Safety Act ivies923 Administration of Human Resource Programs924 Administration of Environmental Programs925 Community and Housing Program Administration926 Administration of Economic Programs928 National Security & International Affairs921 Executive; Legislative; & Gen Government922 Justice; Public Order; and Safety Act ivies924 Administration of Environmental Programs

Bend Economic Opportunities Analysis August 31, 2016 Page 101 of 122
Table B- 5. Leisure and Hospitality, Other Employment Category, Sectors, and Industries
Source: City of Bend
The employment forecasts in Table B- 6 estimate total employment for the 2008 through 2028 planning period. These estimates include non-covered employees which are typically excluded from OED projections. Total employment also includes shift workers. Employment projections contained in tables after Table B- 6 will not match employment in Table B- 8, and subsequent employment tables, because subsequent tables do not include shift workers. Shift workers are excluded from subsequent tables because land need estimates should be based on the day shift (typically the largest shift) instead of all employees working at a given business. Including all workers in land need estimates would overestimate land needs since not all workers in some businesses are present at one time. The methodology used to calculate total employment in Table B- 6 is the same as in the subsequent tables; except subsequent tables exclude shift workers.
Employment CategoryNAICS 2
Digit CodeNAICS 3
Digit Code NAICS Title
Leisure and HospitalityArts, Entertainment, and Recreation 71
711 Performing Arts and Spectator Sports712 Museums; Parks and Historical Sites713 Amusement; Gambling & Recreation Industries
Accommodation and Food services 72721 Accommodation722 Food Services and Drinking Places
OtherOther Services (except Public Administration) 81
811 Repair and Maintenance812 Personal and Laundry Services813 Membership Organizations & Associations814 Private Households
Miscellaneous/Unknown 99999 Unclassified

Bend Economic Opportunities Analysis August 31, 2016 Page 102 of 122
Table B- 6. Total Estimated 2008 and 2028 Employment: Simplified
Source: OED geo-coded employment data for Bend with analysis by City of Bend
Note: Employment reflects additions of non-covered employees excluded from OED employment projections and include ALL EMPLOYEES. Subsequent tables estimating employment reflect only non-shift workers. Non-shift employment is less than total employment.
Table B- 6 illustrates a few broad trends that will emerge in the following analysis. First, the highest numbers of new employees are expected to be engaged in activities that will likely require commercial space versus industrial space. Note that Office/Services, Large and General Retail, and Leisure and Hospitality are the three employment categories that add the most employees during the planning period. Over 4,500 jobs in the Industrial category are expected to be added as well; followed by the addition of 3,596 jobs in the Medical category.
The following employment projections in Table B- 8 present a refinement of the projections in Table B- 6 by considering only employees working during the largest day shift. According to Thomas M Beers, an economist in the Division of Labor Force Statistics, Bureau of Labor Statistics, “the “9-to-5” workday does not appear to be in jeopardy of fading from its prominence in U.S. workplaces; yet the data do suggest that the rigidity of those hours continues to relax”. His analysis suggests that approximately 16.8 percent of all full-time wage and salary workers worked alternative shifts; with different industries exhibiting wide variation in the levels of shift work (Beers).
Since subsequent land need estimates based on employment growth are derived by applying employment densities to employment estimates, it is essential to remove shift employees from gross employment figures and employment densities to calculate accurate land need estimates.
The EOA projects Bend’s non-shift total employment using the following methodology, shown in the summary Table B- 7. Following is a summary of the process:
Major Employment Categories
2008 Bend Employment
2028 Bend Employment
New Employees (2008-2028)
IndustrialIndustrial Heavy 4,587 6,231 1,644Industrial General 5,849 8,709 2,860
RetailLarge Retail 4,354 7,329 2,975General Retail 4,065 6,633 2,568
Office/Services 11,210 18,799 7,590
Leisure and Hospitality 5,617 9,364 3,747
Medical (MDOZ) 5,021 8,617 3,596
Other/Miscellaneous 1,178 1,733 555
Government 3,960 6,374 2,414
Total 45,840 73,789 27,950

Bend Economic Opportunities Analysis August 31, 2016 Page 103 of 122
• Begin with OED 2006 geo-coded employment data for the City of Bend, disaggregated to employment sectors. 2006 data is the most recent year available for which OED has detailed employment data for the City of Bend. More recent data is only tracked at the three-county regional level. The accuracy of the geo-coded (which means location specific, usually in the form of an address point representing employment) data from OED in 2006 is far superior to the accuracy of the 2004 data used in the 2007 Leland EOA. The accuracy of the OED data was enhanced by matching the address points to the City’s GIS address files and by placing employment data based on field checks, phone calls to businesses, and by using local knowledge of employer locations.
• Produce 20-year projected growth rates for individual employment categories: o The baseline employment growth projections are OED Deschutes County 2006-2016
employment growth projections by sector. Reviewed in the Section above, these projections are adjusted to account for Bend’s unique employment characteristics. The approach used in this EOA relies on employment growth rates for Deschutes County rather than the Region 10 employment growth rates. This is an improvement over the Leland EOA since the influence of Jefferson and Crook Counties is not included in the Deschutes County growth data. Also, since Bend represents the majority of employment in Deschutes County, using the Deschutes County employment growth projections will result in more accurate projections.
o Factor 1. As was done in the 2007 Leland EOA, employment projections are slightly increased to account for Bend’s slightly higher rate of population growth as compared with the County’s. In the period 2006-2016, the Deschutes County Coordinated Population Forecast shows Bend’s population is anticipated to grow at a rate 0.11 percent times faster than Deschutes County over this decade. This 0.11 percent factor is applied over the decade, not each year. This is appropriate since employment growth tracks with population growth as show in Section 3.
o Grow employment at the sector specific average annual growth rates plus Factor 1 for two years to determine 2008 baseline employment.
o Factor 2. Increase 2008 baseline employment by sector by 11.5 percent to account for non-covered employees excluded from OED employment forecasts. This increase is applied to all categories except Government, since most public sector employees are covered employees. See Appendix B for a more detailed discussion of how the 11.5 percent factor was determined. This figure was accepted by the City of Bend Planning Commission and UGB TAC for purposes of this analysis.
o Factor 3. Reduce employment estimates by applying percentages of non-shift workers to total employment. These percentages were obtained from research by Thomas M. Beers in his article “Flexible schedules and shift work: replacing the ‘9-to-5’ workday?”. Note these factors were applied to specific sub-sectors and cannot be aggregated into the broader employment categories reported in this table. Generally, employment sectors such as leisure and hospitality have the highest rates of shift workers (approximately 40-50 percent shift workers), while other sectors such as office/services have between approximately 5-20 percent of employees working shifts.
o Grow the 2008 non-shift total employment by the adjusted by sector growth rates for seven years to arrive at year 2015 employment by sector.
o Factor 4. As the 2007 Leland EOA suggests, targeted sectors are increased upwards to reflect increased growth in these sectors. As discussed extensively above, Bend has created a set of Targeted Sectors, in which it hopes to encourage higher-than-average growth; existing trends suggest that this is a good strategy with reasonable chances for success. Thus, employment growth within the Retail, office/Services, and Leisure and Hospitality categories are accelerated by a factor of 1.10 (or 10

Bend Economic Opportunities Analysis August 31, 2016 Page 104 of 122
percent) over this decade –long time frame. Although Government is not a targeted sector, it is also adjusted upwards to reflect continued aggregation of government jobs in Bend (Leland, 39).
o Grow 2015 employment to 2025 by the 1.84 percent average annual rate of growth. This growth rate is the 2015-2025 Average Annual Rate of Growth (AARG) for Bend detailed in the Deschutes County Coordinated Population Forecast.
o Grow 2025 employment to 2028 by an AARG of 1.70 to match Bend’s population growth. This rate is the same growth rate used to estimate Bend’s population growth between 2025 and 2028 for the residential lands estimate.
Table B- 7. Bend Employment Projections and Methodology Overview: 2008-2028
Source: City of Bend based on OED 2006 Geo-coded data for City of Bend.
1 This table is for illustration purposes only. The “10-year AARG”, “2008 Covered Emp”, “2015 Emp.” column totals are derived by totaling the employment growth of individual industries, not the employment categories shown above. See Appendix A for a table of industries and their totals.
2 Rates of “Non-shift Workers” were applied to industries, not employment categories. See Appendix A for specific rates of “Non-shift Workers” applied to each industry.
Table B- 6 shows some of the broad conclusions that can be drawn from this analysis of Bend’s 20-year employment growth. In the New Employees (2008-2028) column, note that by far the largest amount of growth comes in the Office/Services category, as suggested by the trends reviewed earlier and the Economic Sector Targeting work. Retail, Leisure and Hospitality, and Medical categories have also added considerable numbers of employees. Note that heavy industrial uses are expected to employ fewer people than the general industrial uses.
Table B- 8 introduces an assumption that 10 percent of employees in the planning period will be employed on lands currently used for employment purposes. This infill/refill factor is consistent with DLCD guidelines as discussed in more detail in Section 8.
Major Employment Categories
2006 Bend Emp.
10-year AARG1
Factor 1
2008 Covered
Emp1Factor
2
2008 Total Emp.
Factor 3. 2008 Non-shift
Emp.22015
Emp.1Factor
42015 Emp.
2025 Emp.
2028 Bend Emp.
IndustrialIndustrial Heavy 4,032 1.0% 0.11% 4,114 11.5% 4,587 3,807 4,104 NA 4,104 4,925 5,180
Industrial General 5,004 2.3% 0.11% 5,245 11.5% 5,849 5,370 6,340 NA 6,340 7,608 8,002
RetailLarge Retail 3,698 2.6% 0.11% 3,905 11.5% 4,354 3,474 4,212 10% 4,633 5,560 5,849
General Retail 3,482 2.2% 0.11% 3,646 11.5% 4,065 3,244 3,812 10% 4,193 5,032 5,293
Office/Services 9,535 2.6% 0.11% 10,053 11.5% 11,210 9,879 11,925 10% 13,117 15,741 16,557
Leisure and Hospitality 4,783 2.8% 0.11% 5,038 11.5% 5,617 3,306 3,985 10% 4,383 5,260 5,532
Medical 4,240 2.3% 0.11% 4,503 11.5% 5,021 4,100 5,069 10% 5,574 6,689 7,036
Other/Misc. 1,011 2.0% 0.11% 1,056 11.5% 1,178 1,051 1,225 NA 1,225 1,470 1,547
Government 3,798 2.2% 0.11% 3,960 NA 3,960 3,485 4,041 10% 4,445 5,334 5,611Total 39,583 41,520 45,840 37,716 44,712 48,015 57,618 60,607

Bend Economic Opportunities Analysis August 31, 2016 Page 105 of 122
Table B- 8. Employment Change & New Employees Requiring Land: 2008-2028
Source: City of Bend based on OED 2006 Geo-coded data for City of Bend.
The City of Bend should anticipate approximately 22,891 new non-shift employees during the planning period. After subtracting 10 percent with the assumption that 10 percent of new employees will be employed on existing “developed” or “redevelopable” employment lands, land needs should be calculated based on 20,602 future new non-shift employees.
Table B- 9 illustrates jobs to population ratios for the recent past and the planning period. Comparisons between the two tables should be made with caution since Table B- 7 does not include all workers and Table B- 8 includes all workers (both covered and uncovered worker), and because Table B- 7 is a county-wide ratio while Table B- 8 is only the City of Bend. Considering that total employment is estimated to be 11.5 percent higher than covered employment, projected jobs to population ratios are similar to job to population ratios in Deschutes County in the 1990s.
Table B- 9. Jobs to Population Ratios: 2008 and 2028
Source: City of Bend employment forecasts and Deschutes County Coordinated Population Forecast for Bend
Major Employment Categories
2008 Non-shift Emp.
2028 Bend Non-shift Emp.
New Employees (2008-2028)
Infill/Refill Factor
New Employees Requiring New Land
IndustrialIndustrial Heavy 3,807 5,180 1,373 10% 1,236
Industrial General 5,370 8,002 2,632 10% 2,369
RetailLarge Retail 3,474 5,849 2,374 10% 2,137
General Retail 3,244 5,293 2,049 10% 1,844
Office/Services 9,879 16,557 6,678 10% 6,010
Leisure and Hospitality 3,306 5,532 2,226 10% 2,004
Medical 4,100 7,036 2,936 10% 2,642
Other/Misc. 1,051 1,547 496 10% 446
Government 3,485 5,611 2,126 10% 1,913Total 37,716 60,607 22,891 20,602
YearBend coordinated
Population ForecastsBend Total Employment
ForecastsRatio of Jobs to
Population2008 76,551 45,840 60%2028 115,063 73,789 64%
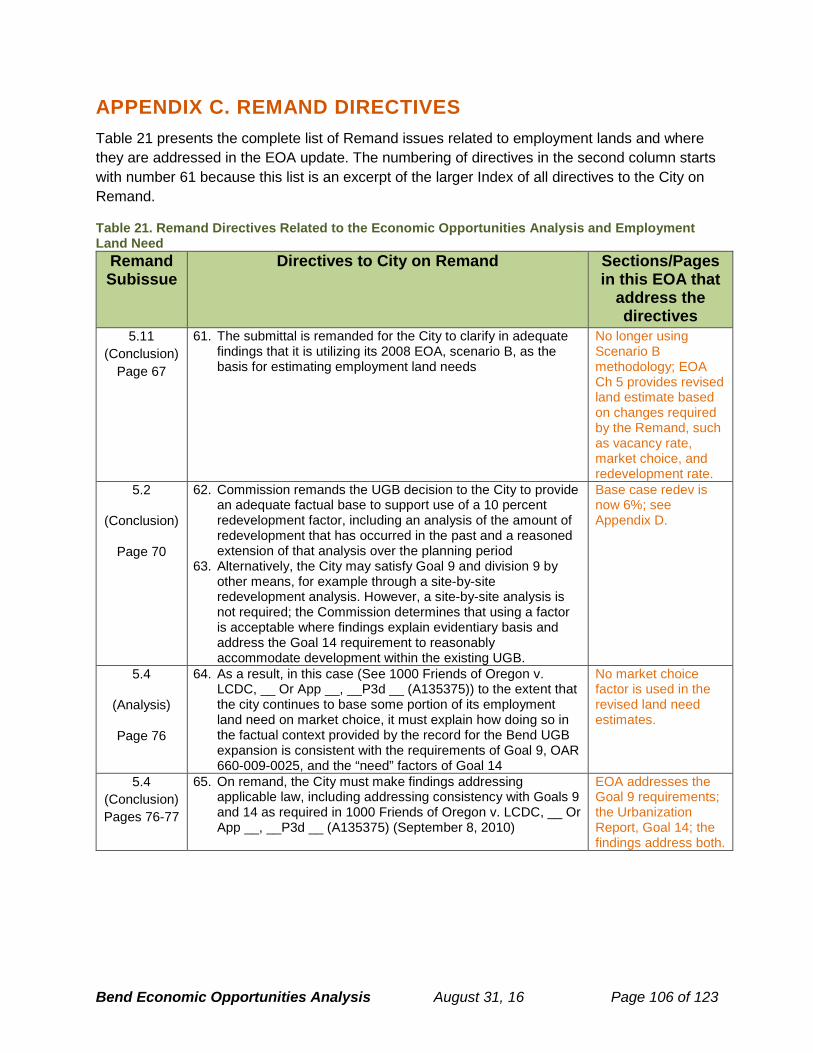
Bend Economic Opportunities Analysis August 31, 16 Page 106 of 123
APPENDIX C. REMAND DIRECTIVES Table 21 presents the complete list of Remand issues related to employment lands and where they are addressed in the EOA update. The numbering of directives in the second column starts with number 61 because this list is an excerpt of the larger Index of all directives to the City on Remand.
Table 21. Remand Directives Related to the Economic Opportunities Analysis and Employment Land Need
Remand Subissue
Directives to City on Remand Sections/Pages in this EOA that
address the directives
5.11 (Conclusion)
Page 67
61. The submittal is remanded for the City to clarify in adequate findings that it is utilizing its 2008 EOA, scenario B, as the basis for estimating employment land needs
No longer using Scenario B methodology; EOA Ch 5 provides revised land estimate based on changes required by the Remand, such as vacancy rate, market choice, and redevelopment rate.
5.2
(Conclusion)
Page 70
62. Commission remands the UGB decision to the City to provide an adequate factual base to support use of a 10 percent redevelopment factor, including an analysis of the amount of redevelopment that has occurred in the past and a reasoned extension of that analysis over the planning period
63. Alternatively, the City may satisfy Goal 9 and division 9 by other means, for example through a site-by-site redevelopment analysis. However, a site-by-site analysis is not required; the Commission determines that using a factor is acceptable where findings explain evidentiary basis and address the Goal 14 requirement to reasonably accommodate development within the existing UGB.
Base case redev is now 6%; see Appendix D.
5.4
(Analysis)
Page 76
64. As a result, in this case (See 1000 Friends of Oregon v. LCDC, __ Or App __, __P3d __ (A135375)) to the extent that the city continues to base some portion of its employment land need on market choice, it must explain how doing so in the factual context provided by the record for the Bend UGB expansion is consistent with the requirements of Goal 9, OAR 660-009-0025, and the “need” factors of Goal 14
No market choice factor is used in the revised land need estimates.
5.4 (Conclusion) Pages 76-77
65. On remand, the City must make findings addressing applicable law, including addressing consistency with Goals 9 and 14 as required in 1000 Friends of Oregon v. LCDC, __ Or App __, __P3d __ (A135375) (September 8, 2010)
EOA addresses the Goal 9 requirements; the Urbanization Report, Goal 14; the findings address both.

Bend Economic Opportunities Analysis August 31, 2016 Page 107 of 122
Remand Subissue
Directives to City on Remand Sections/Pages in this EOA that
address the directives
5.5
(Analysis)
Page 77
66. Under OAR 660-009-0015(3)(a)(C), the EOA Inventory of Industrial and Other Employment Lands for cities and counties within a Metropolitan Planning Organization, must include the approximate total acreage and percentage of sites within each plan or zoning district that comprise the short-term supply of land.
67. This short-term supply analysis required for jurisdictions within MPOs is in addition to the EOA inventory requirements applicable to all comprehensive plans for areas within urban growth boundaries. OAR 660-009-0015(3)(a)
68. Furthermore, division 9 requires that comprehensive plans for cities such as Bend “include detailed strategies for preparing the total land supply for development and for replacing the short-term supply of land as it is developed.” OAR 660-009-0020(2).
Short-term supply is addressed in Chapter 5 of the EOA.
5.5 (Conclusion)
Page 78
69. The Commission concludes that the Goal 9 rule requires the City to include policies for maintaining a short-term supply.
70. The City must plan for required infrastructure and have identified the funding mechanisms.
Short-term supply is addressed in Chapter 5 of the EOA.
5.6
(Analysis)
Page 80
71. (t)he City must establish a basis in reason connecting the inference that the planning period will present higher vacancy rates for industrial and office than historic and current conditions to the trend data from which it is derived.
72. the City may pursue a mechanism to make industrial and commercial rents affordable under the competitive short-term supply, but not by inflating the long-term need beyond what may be supported by substantial evidence in trend data or reasoned inferences there from.
The revised EOA does not include a separate vacancy factor for employment lands. The EOA assumes that the 2006 employment densities are reflective of the vacancy rates at that time: 9% for office space and 2.9% for industrial space.
5.6 (Conclusion)
Page 80
73. The Commission concluded that under division 9, the long-term vacancy factor should be based on past and projected future trends over the planning period.
The revised EOA does not include a separate vacancy factor for employment lands. The EOA assumes that the 2006 employment densities are reflective of the vacancy rates at that time: 9% for office space and 2.9% for industrial space.
5.8 (Analysis) Page 84
74. The City agreed that on remand it would move the analysis and calculation to the residential/other lands analysis and calculation.
See HNA

Bend Economic Opportunities Analysis August 31, 2016 Page 108 of 122
Remand Subissue
Directives to City on Remand Sections/Pages in this EOA that
address the directives
5.8 (Conclusion)
Page 84
75. The Commission remands the submittal to incorporate analysis of land needs for employment uses within residential zones in the City’s housing needs analysis.
See HNA

Bend Economic Opportunities Analysis August 31, 16 Page 109 of 123
APPENDIX D. METHODS FOR JUSTIFICATION OF A REDEVELOPMENT ASSUMPTION FOR EMPLOYMENT LANDS The project team discussed redevelopment assumptions over the course of several meetings with the Employment Technical Advisory Committee (TAC) in the fall of 2014. That process involved a systematic analysis of redevelopment potential for study areas identified by the TAC using the Envision Tomorrow model. Because the methods were described in several memoranda to the Employment TAC, this Appendix documents the methods, analysis, and findings the project team used to develop an assumption for redevelopment of employment lands in Bend for the 2008-2028 period.
BACKGROUND All developed employment land has the potential to redevelop, at some point in the future. Redevelopment potential can be thought of as a continuum—from more redevelopment potential to less redevelopment potential over the 2008 to 2028 period. The factors that affect redevelopment are complicated and include property location, surrounding uses, current use, land and improvement values and other factors. The analysis identifying potentially redevelopable land presented in this Appendix provides the factual basis for the base case redevelopment assumptions.
Broadly, two approaches exist to establish a redevelopment assumption. One approach is to address redevelopment from the demand side by making assumptions about the percentage of new employment that may locate in areas with existing development; the other approach is from the supply side by identifying parcels or districts with redevelopment potential.
The city used a demand-based approach in the 2008 Economic Opportunities Analysis (EOA), assuming that 10% of new employment would be accommodated on redevelopable land. Demand side approaches typically use historic redevelopment rates to support assumptions. While the Remand did not dispute the method, it did clearly state that the city did not provide enough evidence to support the 10% assumption. A supply side analysis looks at land and builds a redevelopment assumption based on land characteristics such as improvement-to-land value ratio.
Before discussing the remand requirements, it is useful to review the state guidance on redevelopment of employment lands. State administrative rules implementing Statewide Planning Goal 9 (OAR 660-009-0005(1)) provide the following definition for the purposes of conducting an EOA:
(1) "Developed Land" means non-vacant land that is likely to be redeveloped during the planning period.
Thus “developed land” equates to land “likely to be redeveloped” when evaluating land supply for an EOA. The EOA update operationalizes this definition as land with existing development (i.e., land identified in the buildable lands inventory or BLI as “developed”) but with the potential that existing development will be converted to more intensive uses during the planning period,

Bend Economic Opportunities Analysis August 31, 2016 Page 110 of 122
as a result of present or expected market forces. Redevelopable land is a subset of developed land, which corresponds with the definition of “developed land” as stated in OAR 660-009-0005(1). Goal 9 does not provide explicit guidance on how to evaluate redevelopable lands beyond this definition.
WHAT DOES THE REMAND REQUIRE? The Remand (Issue 5.2) articulated two potential approaches to addressing redevelopment:
Commission remands the UGB decision to the City to provide an adequate factual base to support use of a 10 percent redevelopment factor, including an analysis of the amount of redevelopment that has occurred in the past and a reasoned extension of that analysis over the planning period.
Alternatively, the City may satisfy Goal 9 and division 9 by other means, for example through a site-by-site redevelopment analysis. However, a site-by-site analysis is not required; the Commission determines that using a factor is acceptable where findings explain evidentiary basis and address the Goal 14 requirement to reasonably accommodate development within the existing UGB.
Data provided in the 2008 EOA suggest that Bend had not experienced a lot of redevelopment of employment lands. Analysis of development activity between 2008 and 2014 drew similar conclusions. To satisfy the Remand requirements, the 2015 update of the Bend EOA used the second approach—a site-by-site analysis that evaluates redevelopment potential using the Envision Tomorrow tool. While the site-by-site aggregated to “district” approach required more effort, it is a more appropriate approach for Bend. This approach allowed the city to approach redevelopment as more than just a legal mandate; it allowed consideration of urban form and infrastructure as a key determinant of city strategy on redevelopment. Moreover, the Envision Tomorrow model provided an opportunity to take a finer grained approach to assessing redevelopment potential—one that uses urban form as a guiding principle.
STUDY AREAS At the September 2014 Employment TAC meeting, the TAC identified areas where redevelopment is likely over the 2008-2028 period. These study areas are shown on Map 1.49 Note that while the areas identified in Map 1 represent specific districts identified as having redevelopment potential, redevelopment can occur on any land within the UGB. It is important to note these areas do not represent all economic lands in the UGB, rather areas which are mostly developed. In addition to the areas shown in Map D-1, the redevelopment analysis considered all other lands designated for employment uses in the Bend UGB.
49 The study areas are a more comprehensive set of areas that were subsequently refined into opportunity areas.

Bend Economic Opportunities Analysis August 31, 2016 Page 111 of 122
Map D-1. Areas to Evaluate for Redevelopment Potential

Bend Economic Opportunities Analysis August 31, 2016 Page 112 of 122
METHODS Based on a literature review, there is no preferred model or method to identify redevelopment opportunities (or estimate a redevelopment rate). The EOA update used a multi-step approach to evaluating redevelopment potential. The approach was as follows:
Step 1: conduct initial assessment of redevelopment potential for study areas
Step 2: prioritize redevelopment study areas
Step 3: identify strategies to encourage redevelopment in high priority study areas
Step 4: use Envision Tomorrow tool to refine redevelopment rate assumption and provide documentation that supports the assumption used in the revised Economic Opportunities Analysis
Step 5: Ground truth Envision Tomorrow results
Step 6: refine strategies to encourage redevelopment, including plan map amendments, code amendments, incentives and other approaches (e.g., land use efficiency measures)
The remainder of this Appendix describes the Envision Tomorrow model, the model results, and the redevelopment assumptions applied in the EOA.
The Envision Tomorrow Model
This section summarizes the approach to developing a feasibility model to identify optimal uses, building forms, and price points for the 12 study areas as well as all land in employment designations outside the study areas.
The scenarios build on analyses completed by Leland Associates, ECONorthwest and Fregonese Associates to identify probable rates of redevelopment on currently developed non-residential lands based on development of building types currently allowed by city regulations and supported by the market.
Envision Tomorrow Envision Tomorrow (ET) is an open-access scenario planning package that allows users to analyze how their community's current growth pattern and future decisions impacting growth will impact a range of measures from public health, fiscal resiliency and environmental sustainability. The Fregonese team used the Envision Tomorrow suite of tools to identify potential redevelopment locations, feasible building types, and potential funding tools to help leverage development in underutilized and emerging market areas. Fregonese staff modeled a series of development scenarios that tested the feasibility of different building types based on 2014 rent and construction levels to determine the residual land value, or the amount a developer could pay for a property while achieving an internal rate of return of 10%.
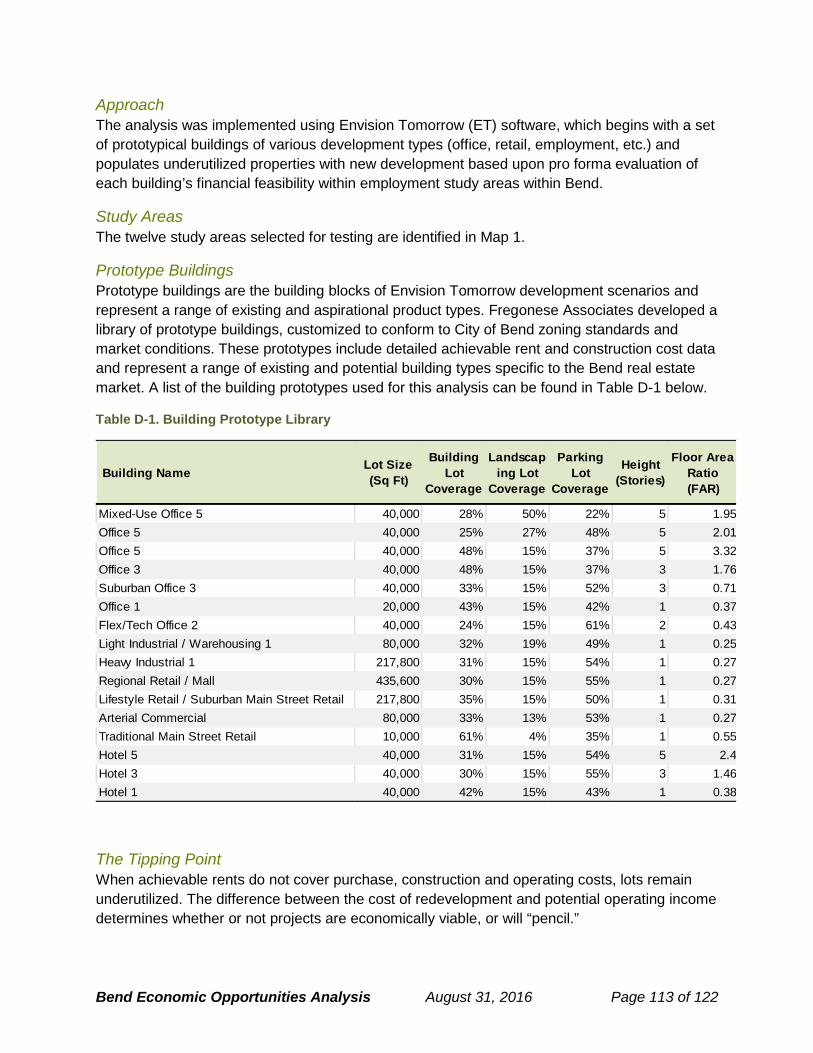
Bend Economic Opportunities Analysis August 31, 2016 Page 113 of 122
Approach The analysis was implemented using Envision Tomorrow (ET) software, which begins with a set of prototypical buildings of various development types (office, retail, employment, etc.) and populates underutilized properties with new development based upon pro forma evaluation of each building’s financial feasibility within employment study areas within Bend.
Study Areas The twelve study areas selected for testing are identified in Map 1.
Prototype Buildings Prototype buildings are the building blocks of Envision Tomorrow development scenarios and represent a range of existing and aspirational product types. Fregonese Associates developed a library of prototype buildings, customized to conform to City of Bend zoning standards and market conditions. These prototypes include detailed achievable rent and construction cost data and represent a range of existing and potential building types specific to the Bend real estate market. A list of the building prototypes used for this analysis can be found in Table D-1 below.
Table D-1. Building Prototype Library
The Tipping Point When achievable rents do not cover purchase, construction and operating costs, lots remain underutilized. The difference between the cost of redevelopment and potential operating income determines whether or not projects are economically viable, or will “pencil.”
Building Name Lot Size (Sq Ft)
Building Lot
Coverage
Landscaping Lot
Coverage
Parking Lot
Coverage
Height (Stories)
Floor Area Ratio (FAR)
Mixed-Use Office 5 40,000 28% 50% 22% 5 1.95Office 5 40,000 25% 27% 48% 5 2.01Office 5 40,000 48% 15% 37% 5 3.32Office 3 40,000 48% 15% 37% 3 1.76Suburban Office 3 40,000 33% 15% 52% 3 0.71Office 1 20,000 43% 15% 42% 1 0.37Flex/Tech Office 2 40,000 24% 15% 61% 2 0.43Light Industrial / Warehousing 1 80,000 32% 19% 49% 1 0.25Heavy Industrial 1 217,800 31% 15% 54% 1 0.27Regional Retail / Mall 435,600 30% 15% 55% 1 0.27Lifestyle Retail / Suburban Main Street Retail 217,800 35% 15% 50% 1 0.31Arterial Commercial 80,000 33% 13% 53% 1 0.27Traditional Main Street Retail 10,000 61% 4% 35% 1 0.55Hotel 5 40,000 31% 15% 54% 5 2.4Hotel 3 40,000 30% 15% 55% 3 1.46Hotel 1 40,000 42% 15% 43% 1 0.38

Bend Economic Opportunities Analysis August 31, 2016 Page 114 of 122
Achievable Rents For each of the 12 study areas, the project team assembled current market rents for retail, office, and industrial product types from RS Means and the commercial real estate service Costar using data acquired during August 2014. Cost and rent assumptions were discussed with TAC member to validate their reasonableness.
1. Construction Cost (HARD COSTS ONLY):
All costs are listed on a per square foot basis (Table D-2).
Table D-2. Construction Costs
For Retail and Office products there will be a tenant improvement (TI cost) that is likely to be $10 per square foot or more on top of the hard costs listed above. Costs are listed on a per square foot basis.
2. Rent assumptions (All product types based on a triple-net lease)
Rents listed in Table D-3 are annualized on a per square foot basis.
Table D-3. Achievable Rent Assumptions

Bend Economic Opportunities Analysis August 31, 2016 Page 115 of 122
Process
1. Assign Building Prototypes to Zone Districts
Table D-4 shows which building types are allowed by the regulations found in Bend’s zoning ordinance.
Table D- 4. Building Types and Zones
2. Determine Residual Land Value
After inputting the cost and rent variables the goal seek function within MS Excel was utilized to set an IRR of 10% through adjustment of the acquisition cost. The resultant value then determines the residual land value. In many cases specific building types were shown to have a negative residual land value. In other words, it is not economically feasible to build them (e.g., redevelop the site) without financial subsidy worth at least as much as the market value of the land and improvements.
3. Identify Lands for Analysis
For building prototypes with a positive residual land value, the Envision Tomorrow tool was used to select and assign building types to parcels within GIS. Lands were first identified by testing for zoning and parcel size and then assigned with a building prototype that could “afford” the total land and improvement value of the property. In cases where multiple buildings were feasible, the team chose the prototype with the highest residual land value that could be utilized.
4. Summarize by Study Area
Using the spatial analysis functions within GIS and ET the redevelopment rates and representative numbers of employees were summarized and reported based on the previously identified study areas.

Bend Economic Opportunities Analysis August 31, 2016 Page 116 of 122
FINDINGS The Envision Tomorrow model results identified potential for 1,358 additional jobs through redevelopment under the Base Case assumptions (e.g., no policy changes or efficiency measures). Fifty-six percent of the redevelopment potential (763 jobs) exist within one of the 12 employment redevelopment study areas (North Studio Road).
The 2008 Economic Opportunities Analysis forecast a total increase of 22,891 non-shift employees for the 2008-2028 planning period. The model output suggests a base case potential for 1,359 new employees. This equates to 5.9% of total forecast employment. The 2008 EOA assumed 10%.
Based on these results the base case analysis used a redevelopment rate assumption of 6%. Note that this analysis did not model the potential impact of land use efficiency measures and new incentives designed to encourage redevelopment of employment lands—including the impact of strategies described in the Central 3rd Street Multimodal Mixed Use Area (MMA) and the Central Westside Plan area. That analysis is presented in the Urbanization Report.
This section summarizes findings from the analysis of redevelopment potential. It provides general data on employment lands (e.g., amount of employment, industry, acres, etc.) for all lands and specific redevelopment study areas. It also summarizes the results of the Envision Tomorrow residual land value modeling (see Tables 9, 10 and 11).
To provide context, the analysis started with brief overview of employment citywide. According to Quarterly Census of Employment and Wage (QCEW) data, Bend had 53,084 covered employees in 2013 (Table D-5). The data show that nearly half (48%) of employment is located in one of the study areas identified on Map 1.

Bend Economic Opportunities Analysis August 31, 2016 Page 117 of 122
Table D-5. Covered employment by plan designation and location (2013)
Note: the high level of employment in the RH (residential high density) designation is due to the Medical District (MDOZ) overlay.
Map D-2 shows the location of employment plan designations and redevelopment study areas.
Plan Designation Firms Emp % of Emp Firms Emp % of EmpCommercial
CB - Central Business 272 3,206 6% 0%CC 185 1,966 4% 165 1,766 7%CG 564 8,169 15% 310 3,929 15%CL 407 5,063 10% 223 2,763 11% Subtotal 1,428 18,404 35% 698 8,458 33%
Industrial IG 113 1,639 3% 113 1,639 6%IL 516 6,766 13% 435 5,555 22% Subtotal 629 8,405 16% 548 7,194 28%
Mixed EmploymentME 222 3,171 6% 74 614 2%MR 261 3,131 6% 7 48 0%
Subtotal 483 6,302 12% 81 662 3%Public Facilities (PF) 79 4,135 8% 0%ResidentialRH 222 10,102 19% 114 9,242 36%RL 127 286 1% 0%RM 219 1,192 2% 0%RS 954 4,232 8% 2 59 0%
Subtotal 1,522 15,812 30% 116 9,301 36%TOTAL 4,142 53,084 100% 1,443 25,615 100%
All Areas Study Areas

Bend Economic Opportunities Analysis August 31, 2016 Page 118 of 122
Map D-2 Employment plan designations and study areas

Bend Economic Opportunities Analysis August 31, 2016 Page 119 of 122
Table D-6 summarizes key characteristics of the 12 study areas shown in Map 2, including number of tax lots, total acres in the study area, acres in tax lots that have employment, total employment, and employment per acre (for tax lots that have employment).
Table D-6. Study Area Summary Data (2013)
The Employment TAC requested more information on the plan designations and employment in the study areas. Table D-7 shows acres and percent of acres by study area and plan designation. The figure below shows the titles for the abbreviations in Table D-7.
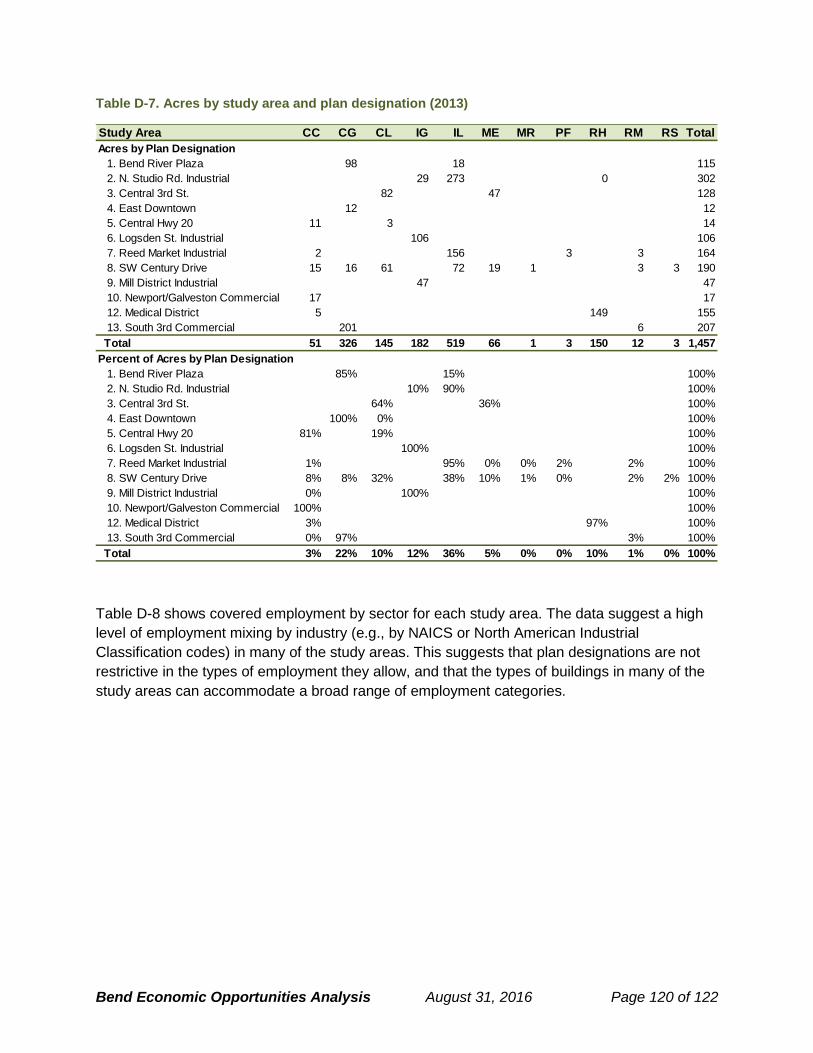
Bend Economic Opportunities Analysis August 31, 2016 Page 120 of 122
Table D-7. Acres by study area and plan designation (2013)
Table D-8 shows covered employment by sector for each study area. The data suggest a high level of employment mixing by industry (e.g., by NAICS or North American Industrial Classification codes) in many of the study areas. This suggests that plan designations are not restrictive in the types of employment they allow, and that the types of buildings in many of the study areas can accommodate a broad range of employment categories.
Study Area CC CG CL IG IL ME MR PF RH RM RS TotalAcres by Plan Designation
1. Bend River Plaza 98 18 1152. N. Studio Rd. Industrial 29 273 0 3023. Central 3rd St. 82 47 1284. East Downtown 12 125. Central Hwy 20 11 3 146. Logsden St. Industrial 106 1067. Reed Market Industrial 2 156 3 3 1648. SW Century Drive 15 16 61 72 19 1 3 3 1909. Mill District Industrial 47 4710. Newport/Galveston Commercial 17 1712. Medical District 5 149 15513. South 3rd Commercial 201 6 207
Total 51 326 145 182 519 66 1 3 150 12 3 1,457Percent of Acres by Plan Designation
1. Bend River Plaza 85% 15% 100%2. N. Studio Rd. Industrial 10% 90% 100%3. Central 3rd St. 64% 36% 100%4. East Downtown 100% 0% 100%5. Central Hwy 20 81% 19% 100%6. Logsden St. Industrial 100% 100%7. Reed Market Industrial 1% 95% 0% 0% 2% 2% 100%8. SW Century Drive 8% 8% 32% 38% 10% 1% 0% 2% 2% 100%9. Mill District Industrial 0% 100% 100%10. Newport/Galveston Commercial 100% 100%12. Medical District 3% 97% 100%13. South 3rd Commercial 0% 97% 3% 100%
Total 3% 22% 10% 12% 36% 5% 0% 0% 10% 1% 0% 100%

Bend Economic Opportunities Analysis August 31, 2016 Page 121 of 122
Table D-8. Covered employment by study area and sector (2013)
Envision Tomorrow Results
This section presents results from the Envision Tomorrow model. The results represent a “base case” scenario that assumes that the city would take no specific measures to encourage redevelopment in employment zones.
After inputting the cost and rent variables, Envision Tomorrow modeled an IRR of 10% through adjustment of the acquisition cost. The resultant acquisition cost value then determines the residual land value. Negative residual land values suggest the parcel will not redevelop; positive residual land values indicate redevelopment potential.
The project team analyzed the 12 study areas as well as all other lands outside the study areas with employment plan designations. The model outputs are acres redeveloped and jobs. In the context of the statewide planning program, we are only interested in redevelopment that leads to additional employment capacity (e.g. has higher employee per acre ratios).
# Study Area RetailLodging
and food ServicesHealth
careOther
commercialManufact
uring IndustrialGrand Total
Employment1 Bend River Plaza 616 317 484 39 86 15 - 1,557 2 Studio Road Industrial 67 115 547 405 1,068 477 2,679 3 Central 3rd Street 689 504 386 124 219 81 226 2,229 4 East Downtown 102 25 18 145 5 Central Hwy 20 72 60 64 306 11 513 6 Logsden St. Industrial 118 17 121 13 189 170 226 854 7 Reed Market Industrial 132 14 171 17 258 331 271 1,194 9 Core Pine 23 35 65 25 148 9 SW Century Drive 261 283 1,151 478 258 911 358 3,700 10 Newport/Galveston Commercial 236 276 61 87 10 28 698 11 Medical District 4 224 307 8,828 213 3 9,579 12 South 3rd Street Commercial 1,237 503 230 142 141 26 38 2,317
Total 3,432 2,313 3,647 10,059 1,843 2,698 1,621 25,613 Percent of Employment by Sector
1 Bend River Plaza 40% 20% 31% 3% 6% 1% 0% 100%2 Studio Road Industrial 3% 4% 20% 0% 15% 40% 18% 100%3 Central 3rd Street 31% 23% 17% 6% 10% 4% 10% 100%4 East Downtown 0% 0% 70% 17% 12% 0% 0% 100%5 Central Hwy 20 14% 12% 12% 60% 2% 0% 0% 100%6 Logsden St. Industrial 14% 2% 14% 2% 22% 20% 26% 100%7 Reed Market Industrial 11% 1% 14% 1% 22% 28% 23% 100%9 Core Pine 0% 0% 16% 0% 24% 44% 17% 100%9 SW Century Drive 7% 8% 31% 13% 7% 25% 10% 100%10 Newport/Galveston Commercial 34% 40% 9% 12% 1% 4% 0% 100%11 Medical District 0% 2% 3% 92% 2% 0% 0% 100%12 South 3rd Street Commercial 53% 22% 10% 6% 6% 1% 2% 100%
Total 13% 9% 14% 39% 7% 11% 6% 100%

Bend Economic Opportunities Analysis August 31, 2016 Page 122 of 122
Table D-9 shows the results for the 12 study areas. The results suggest relatively low redevelopment potential overall—763 jobs, or a 3% increase from 2013 employment. The model output only resulted in redevelopment potential in three study areas: N. Studio Road, SW Century Drive, and S. 3rd Street.
Table D-9. Envision Tomorrow results for employment study area redevelopment
Table D-10 presents a summary of the Envision Model results for lands outside the 12 study areas. Consistent with the model output for the study areas, the results suggest relatively low redevelopment potential—596 jobs or a 3.5% increase over 2013 employment. The results suggest that the CG (general commercial) and ME (mixed-employment) designations have the most potential.
Table D-10. Envision Tomorrow results for redevelopment of employment lands outside study areas
Study Area Name
Total Acres
Covered Employment Emp/Acre
Redeveloped Acres
Additional Employment
CapacityTotal Emp w/Redev
Emp/Acre w/Redev
% Increase over 2013
Emp1 Bend River Plaza 115.2 1,557 13.5 0.0 0 1,557 13.5 0.0%2 N. Studio Road 301.9 2,679 8.9 10.5 484 3,163 10.5 18.1%3 Central 3rd Street 128.4 2,229 17.4 0.0 0 2,229 17.4 0.0%4 East Downtown 12.3 145 11.8 0.0 0 145 11.8 0.0%5 Central Hwy 20 14.0 513 36.7 0.0 0 513 36.7 0.0%6 Logsden Street 105.9 854 8.1 0.0 0 854 8.1 0.0%7 Reed Market 164.0 1,195 7.3 0.0 0 1,195 7.3 0.0%8 SW Century Drive 190.0 3,700 19.5 5.4 250 3,950 20.8 6.8%9 Mill District 47.3 148 3.1 0.0 0 148 3.1 0.0%10 Newport/Galvest 17.1 698 40.9 0.0 0 698 40.9 0.0%11 Medical District 154.5 9,579 62.0 0.0 0 9,579 62.0 0.0%12 S. 3rd Street 206.8 2,318 11.2 0.6 29 2,347 11.3 1.3%
Total/Avg 1457.4 25,615 17.6 16.6 763 26,378 18.1 3.0%
Existing Conditions, 2013 Envision Tomorrow Model Output
Plan Designation
Total Acres
Covered Employment Emp/Acre
Redeveloped Acres
Additional Employment
CapacityTotal Emp w/Redev
Emp/Acre w/Redev
% Increase over 2013
EmpCB 40 3,206 79.8 5.5 93 3,299 82.1 2.9%CC 29 200 7.0 0.0 - 200 7.0 0.0%CG 327 4,240 13.0 5.1 234 4,474 13.7 5.5%CL 199 2,300 11.5 0.6 10 2,310 11.6 0.4%IG 4 - 0.0 0.0 - - 0.0 0.0%IL 269 1,211 4.5 1.0 46 1,257 4.7 3.8%ME 268 2,557 9.6 6.1 213 2,770 10.4 8.3%MR 220 3,083 14.0 0.0 - 3,083 14.0 0.0% Total 1,356 16,797 12.4 18.3 596 17,393 12.8 3.5%
Existing Conditions, 2013 Envision Tomorrow Model Output
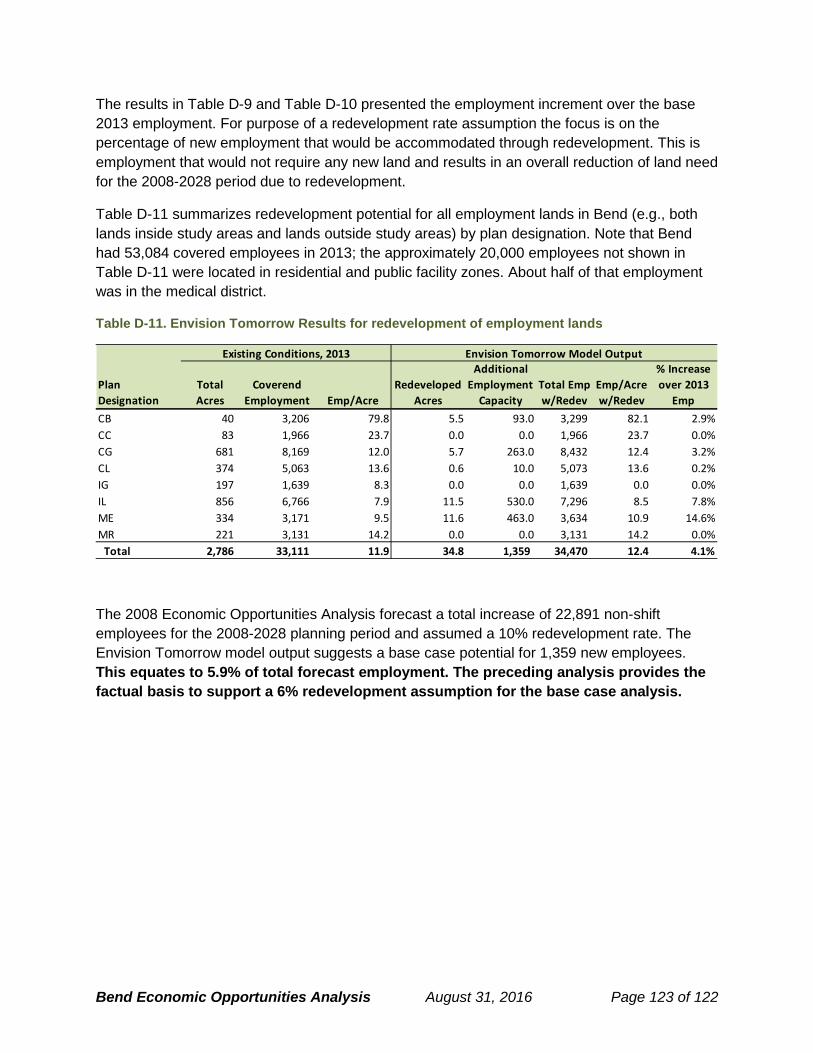
Bend Economic Opportunities Analysis August 31, 2016 Page 123 of 122
The results in Table D-9 and Table D-10 presented the employment increment over the base 2013 employment. For purpose of a redevelopment rate assumption the focus is on the percentage of new employment that would be accommodated through redevelopment. This is employment that would not require any new land and results in an overall reduction of land need for the 2008-2028 period due to redevelopment.
Table D-11 summarizes redevelopment potential for all employment lands in Bend (e.g., both lands inside study areas and lands outside study areas) by plan designation. Note that Bend had 53,084 covered employees in 2013; the approximately 20,000 employees not shown in Table D-11 were located in residential and public facility zones. About half of that employment was in the medical district.
Table D-11. Envision Tomorrow Results for redevelopment of employment lands
The 2008 Economic Opportunities Analysis forecast a total increase of 22,891 non-shift employees for the 2008-2028 planning period and assumed a 10% redevelopment rate. The Envision Tomorrow model output suggests a base case potential for 1,359 new employees. This equates to 5.9% of total forecast employment. The preceding analysis provides the factual basis to support a 6% redevelopment assumption for the base case analysis.
Plan Designation
Total Acres
Coverend Employment Emp/Acre
Redeveloped Acres
Additional Employment
CapacityTotal Emp w/Redev
Emp/Acre w/Redev
% Increase over 2013
EmpCB 40 3,206 79.8 5.5 93.0 3,299 82.1 2.9%CC 83 1,966 23.7 0.0 0.0 1,966 23.7 0.0%CG 681 8,169 12.0 5.7 263.0 8,432 12.4 3.2%CL 374 5,063 13.6 0.6 10.0 5,073 13.6 0.2%IG 197 1,639 8.3 0.0 0.0 1,639 0.0 0.0%IL 856 6,766 7.9 11.5 530.0 7,296 8.5 7.8%ME 334 3,171 9.5 11.6 463.0 3,634 10.9 14.6%MR 221 3,131 14.2 0.0 0.0 3,131 14.2 0.0% Total 2,786 33,111 11.9 34.8 1,359 34,470 12.4 4.1%
Existing Conditions, 2013 Envision Tomorrow Model Output