Embed Size (px)
Citation preview
Section 8.3 Absolute Value Functions
8.3 Lecture Guide: Absolute Value Functions
Objective 1: Sketch the graph of an absolute value function.
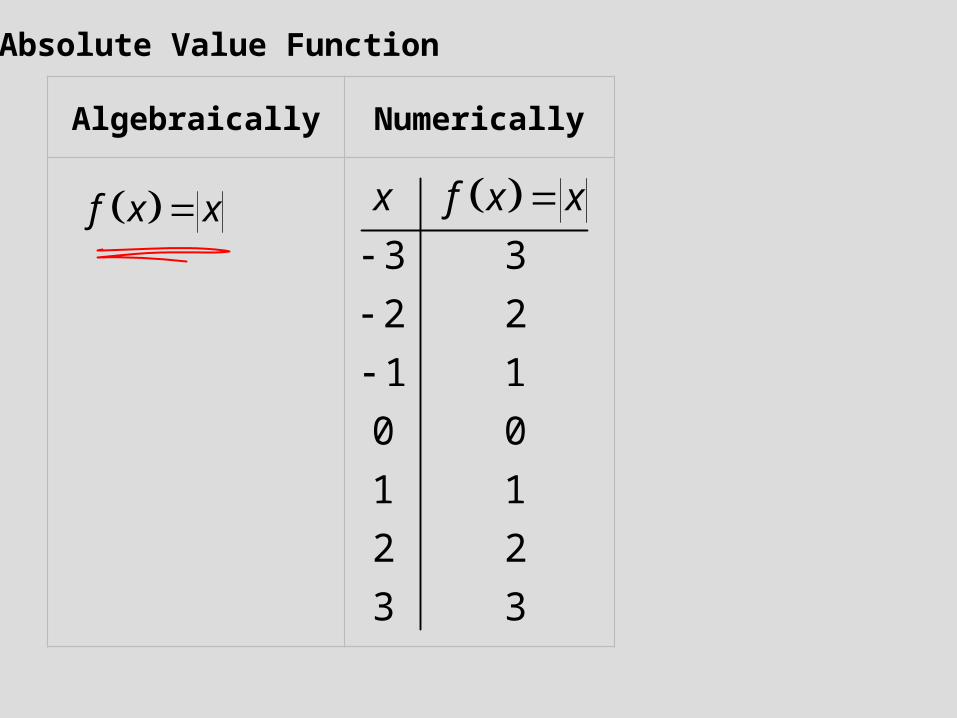
Algebraically Numerically
f x x 3 3
2 2
1 1
0 0
1 1
2 2
3 3
x f x x
Absolute Value Function
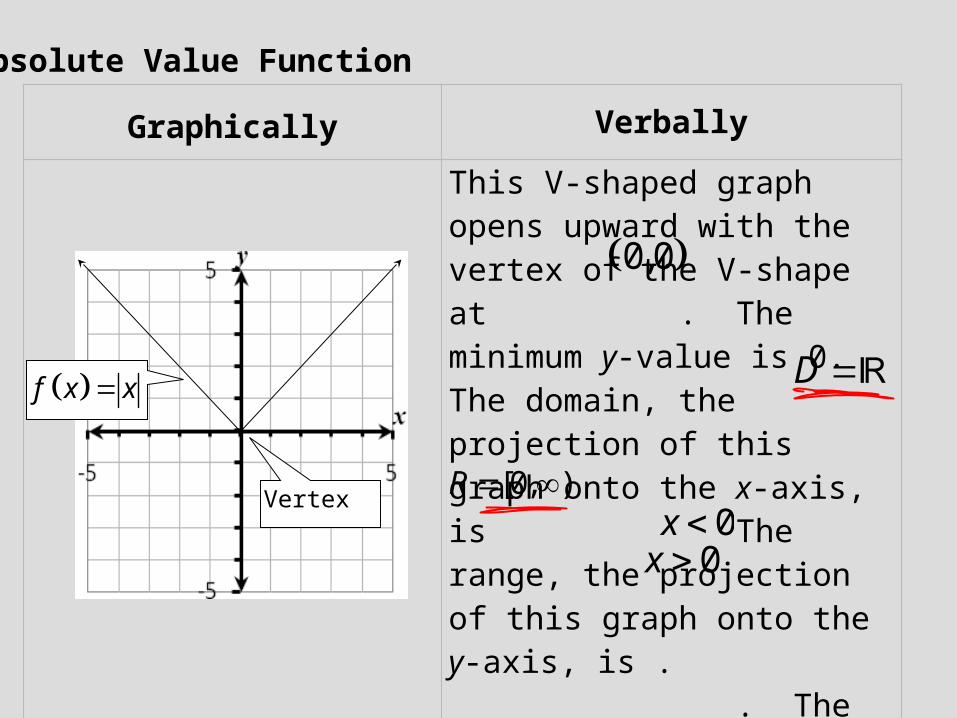
Graphically Verbally
This V-shaped graph opens upward with the vertex of the V-shape at . The minimum y-value is 0. The domain, the projection of this graph onto the x-axis, is The range, the projection of this graph onto the y-axis, is . . The function is decreasing for and increasing for
Vertex
f x x
0,0
.D
0x 0.x
Absolute Value Function
[0, )R
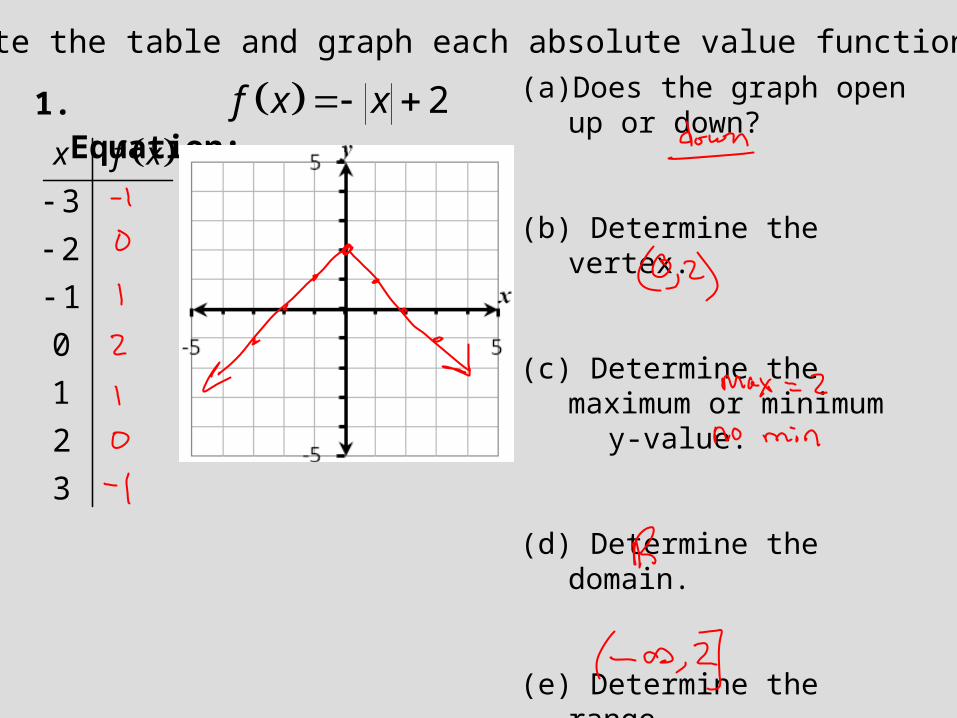
Complete the table and graph each absolute value function.
1. Equation:
3
2
1
0
1
2
3
x f x
(a) Does the graph open up or down?
(b) Determine the vertex.
(c) Determine the maximum or minimum
y-value.
(d) Determine the domain.
(e) Determine the range.
2f x x
Complete the table and graph each absolute value function.
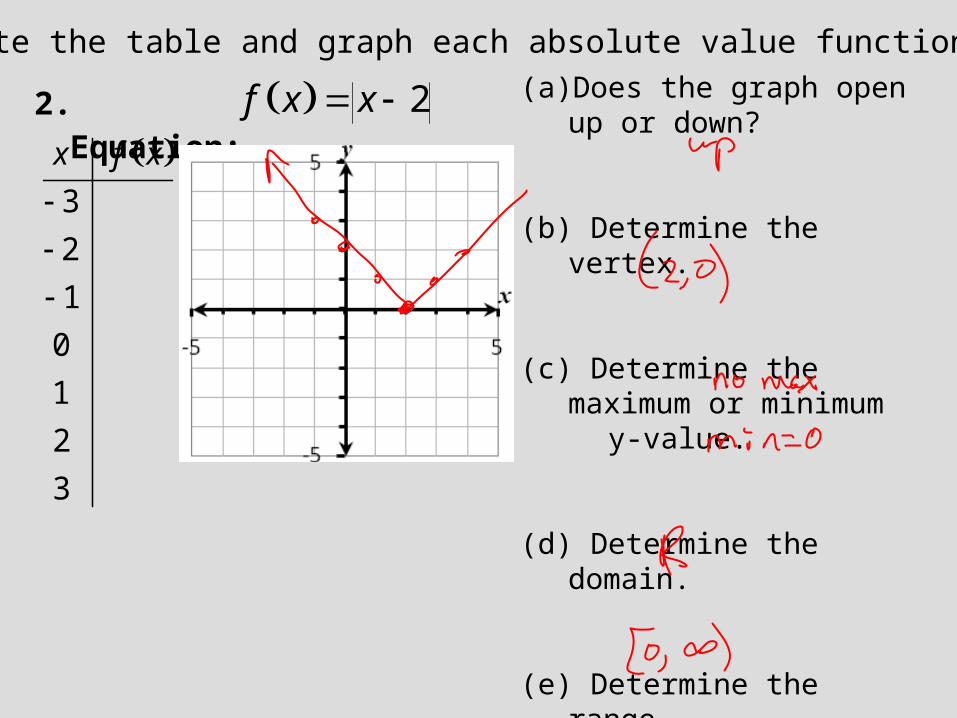
2. Equation:
3
2
1
0
1
2
3
x f x
2f x x (a) Does the graph open up or down?
(b) Determine the vertex.
(c) Determine the maximum or minimum
y-value.
(d) Determine the domain.
(e) Determine the range.
Complete the table and graph each absolute value function.
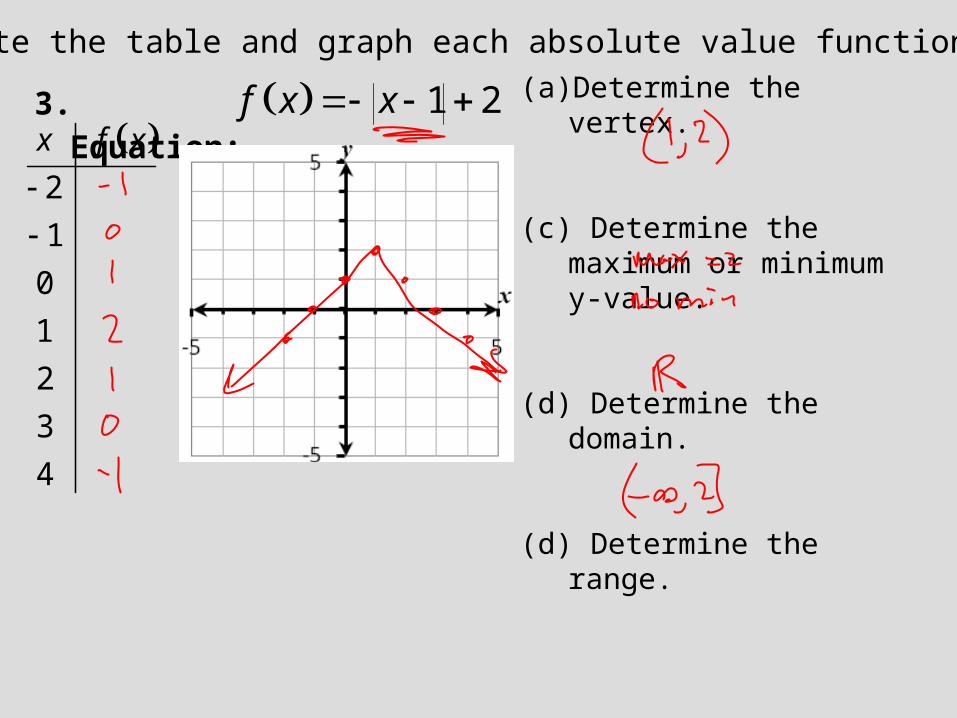
3. Equation: (a) Determine the vertex.
(c) Determine the maximum or minimum y-value.
(d) Determine the domain.
(d) Determine the range.
1 2f x x
2
1
0
1
2
3
4
x f x
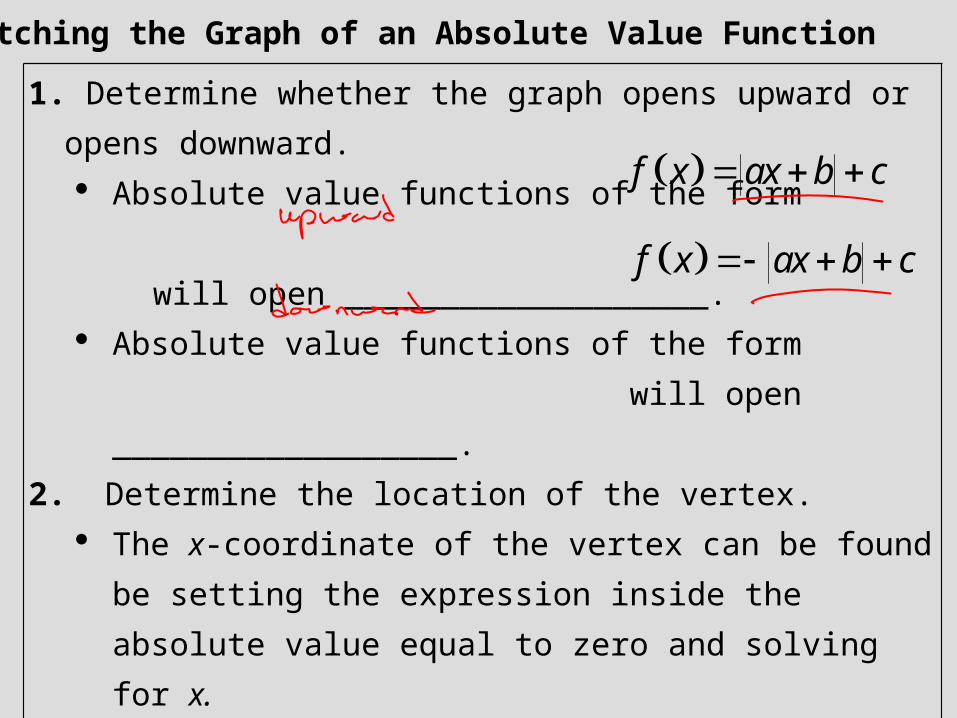
Sketching the Graph of an Absolute Value Function
1. Determine whether the graph opens upward or opens downward. Absolute value functions of the form will open ___________________. Absolute value functions of the form
will open __________________.2. Determine the location of the vertex.
The x-coordinate of the vertex can be found be setting the expression inside the absolute value equal to zero and solving for x.
The y-coordinate of the vertex can be found by evaluating the function at this x-coordinate.
3. Complete a table of values using x-values on both sides of the vertex.
f x ax b c
f x ax b c
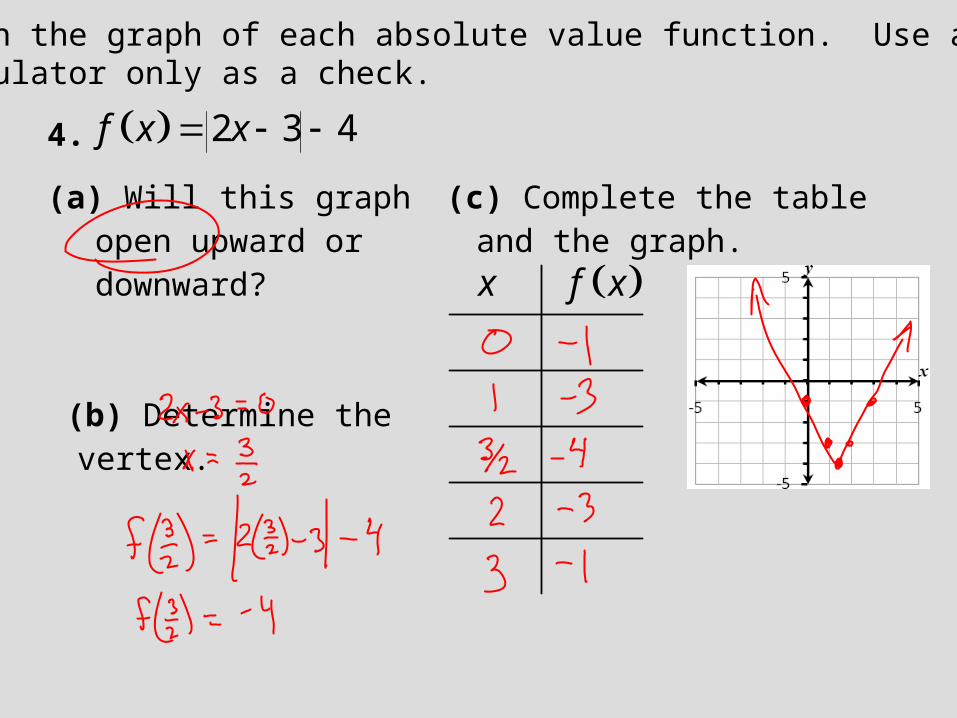
Sketch the graph of each absolute value function. Use a calculator only as a check.
4.
(a) Will this graph open upward or downward?
(b) Determine the vertex.
(c) Complete the table and the graph.
2 3 4f x x
x f x
Sketch the graph of each absolute value function. Use a calculator only as a check.
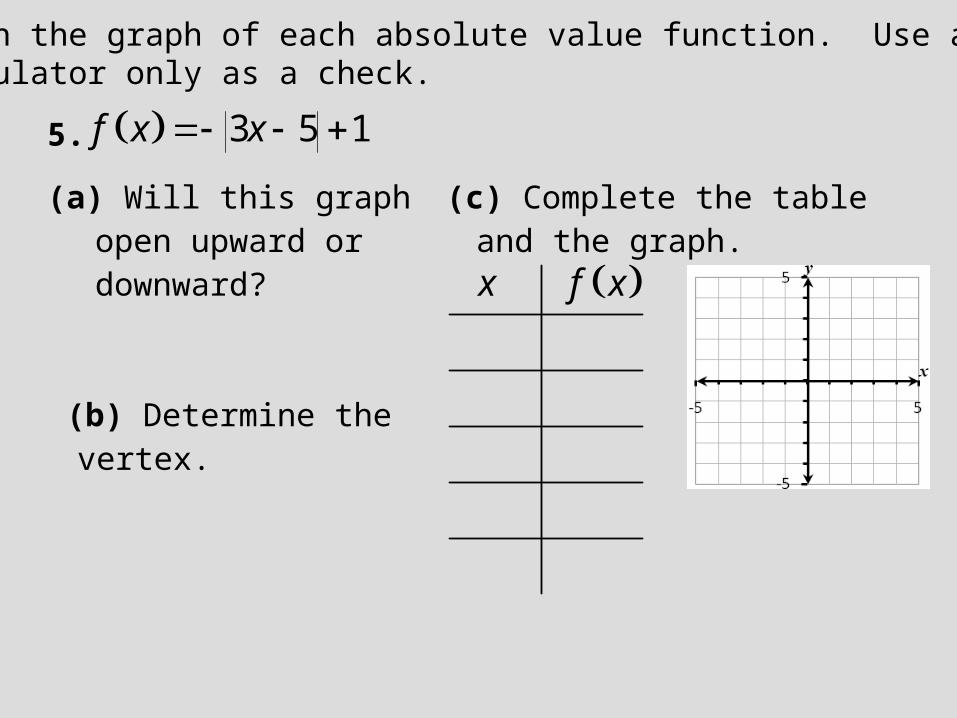
5.
(a) Will this graph open upward or downward?
(b) Determine the vertex.
(c) Complete the table and the graph.
x f x
3 5 1f x x
Objective 2. Determine the intercepts of the graph of an absolute value function.
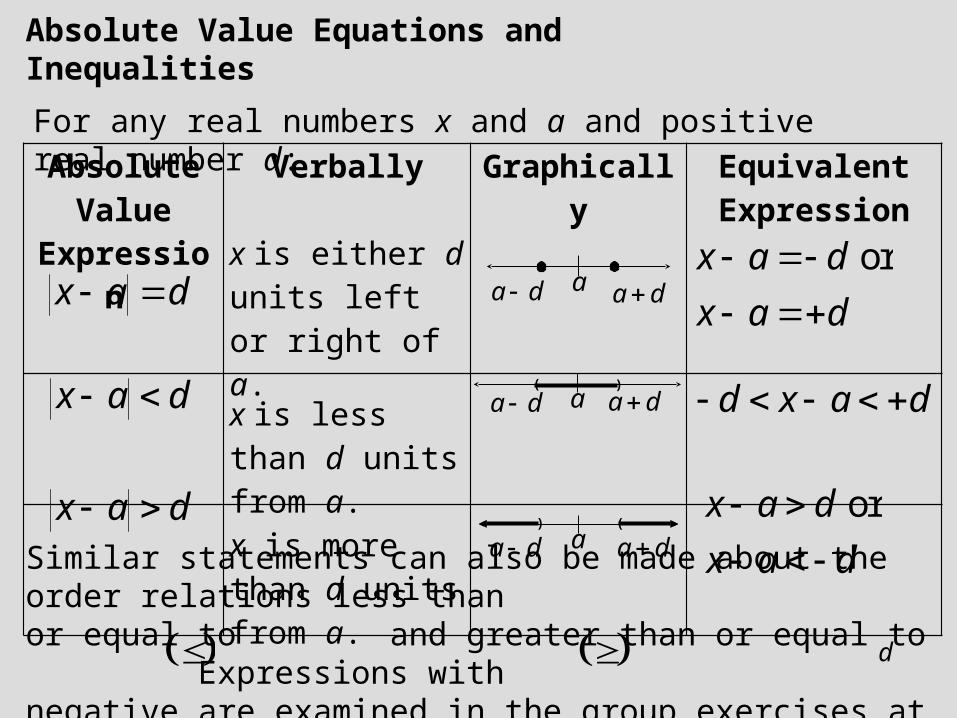
Similar statements can also be made about the order relations less than or equal to and greater than or equal to Expressions with negative are examined in the group exercises at the end of this section.
Absolute Value Equations and Inequalities
Absolute Value
Expression
Verbally
x is either d units left or right of a.
Graphically Equivalent Expression
x is less than d units from a.
x is more than d units from a.
x a d orx a d
x a d
x a d d x a d
x a d
a d a a d
orx a d
x a d
( )
()
For any real numbers x and a and positive real number d:
a d
a d
a
a
a d
a d
. d
Solve each equation and inequality.
6. 2 1 5x

Solve each equation and inequality.
7. 76x
Solve each equation and inequality.
8. 4 10x
Solve each equation and inequality.
9. 92 3x
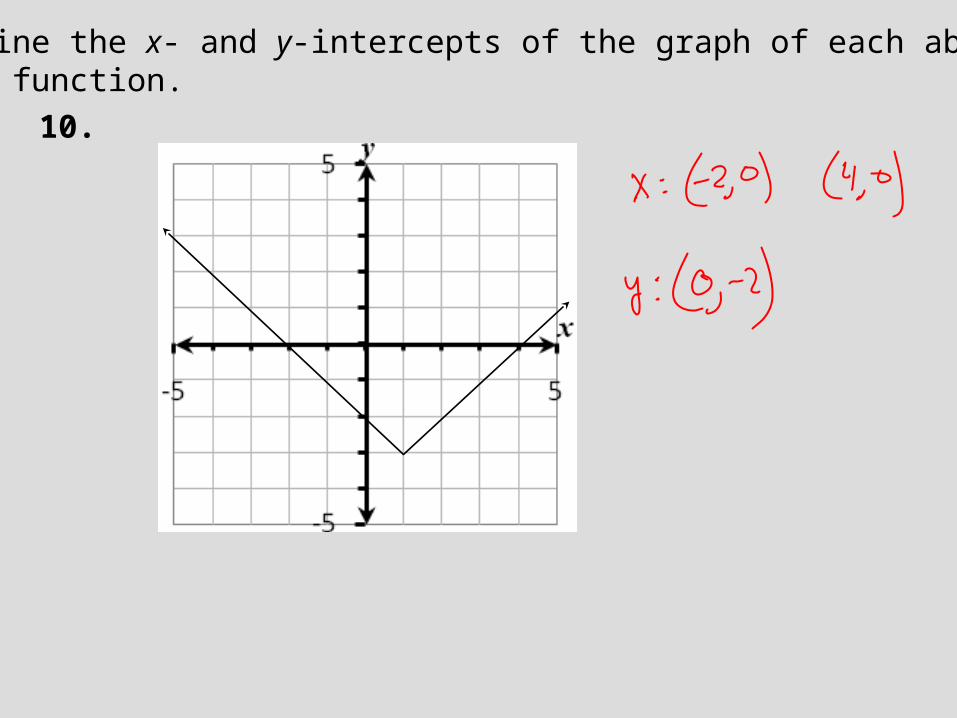
Determine the x- and y-intercepts of the graph of each absolute value function. 10.
3 4
2 2
1 0
0 2
1 4
2 2
3 0
x y
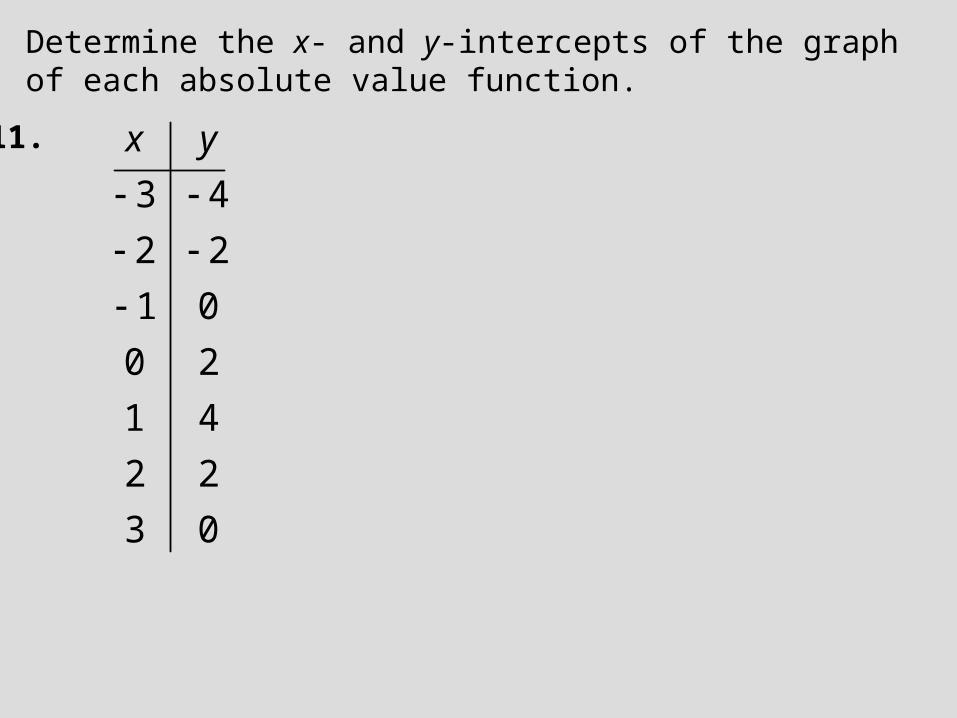
11.
Determine the x- and y-intercepts of the graph of each absolute value function.
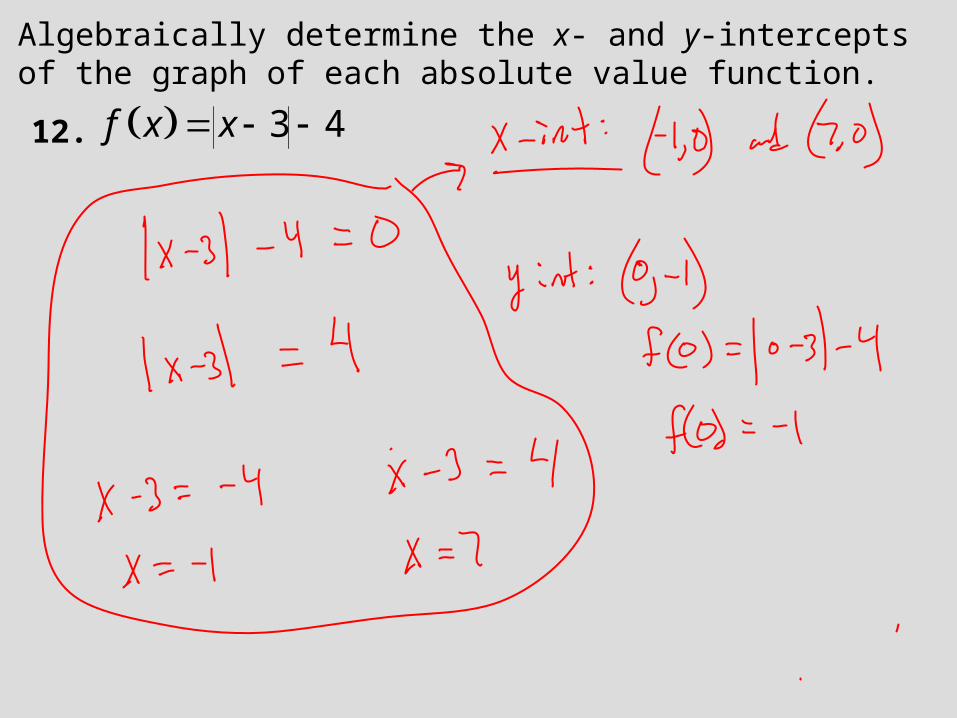
Algebraically determine the x- and y-intercepts of the graph of each absolute value function.
12. 3 4f x x
Algebraically determine the x- and y-intercepts of the graph of each absolute value function.
13. 2 5f x x
Objective 3. Determine the x-values for which an absolute value is positive and the x-values for which an absolute value function is negative.
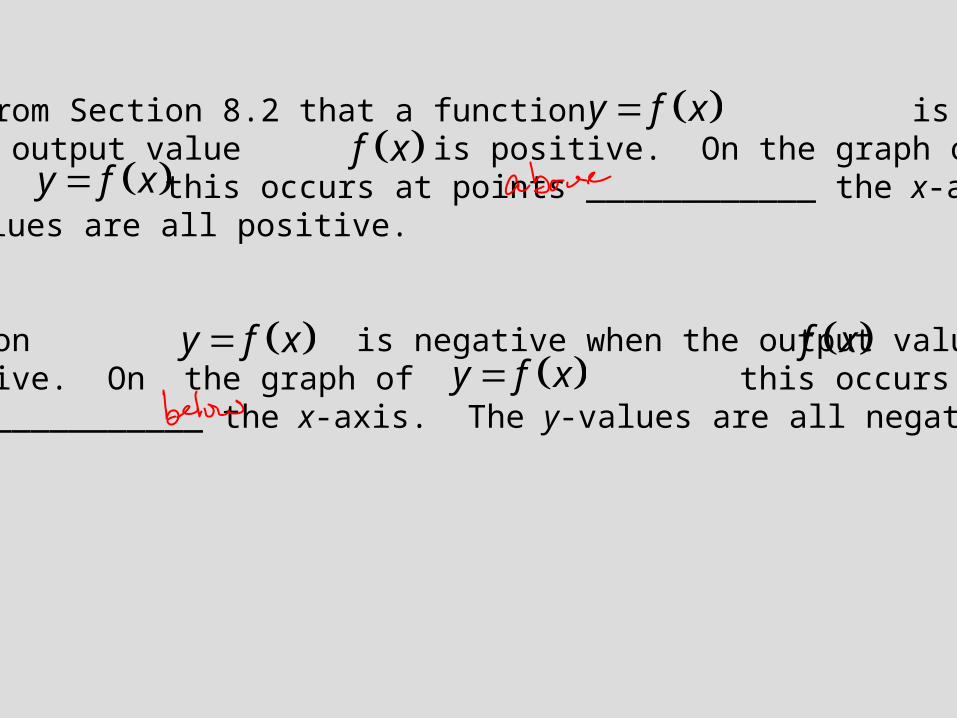
Recall from Section 8.2 that a function is positive when the output value is positive. On the graph of this occurs at points ____________ the x-axis.The y-values are all positive.
A function is negative when the output valueis negative. On the graph of this occurs at points ____________ the x-axis. The y-values are all negative.
y f x
f x y f x
y f x
f x y f x
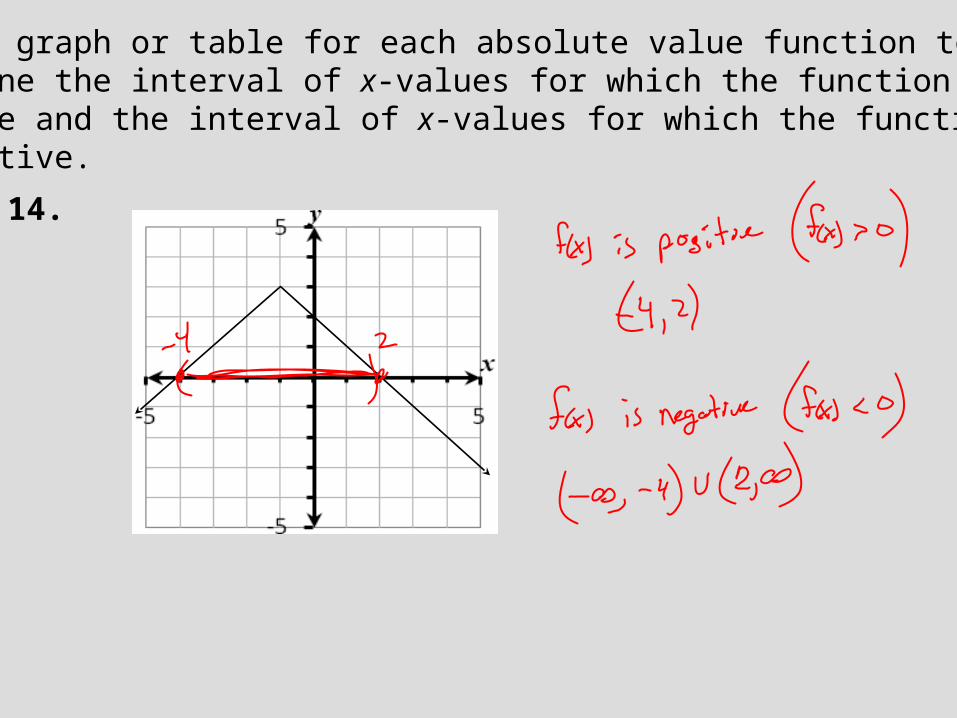
Use the graph or table for each absolute value function todetermine the interval of x-values for which the function is positive and the interval of x-values for which the function is negative.
14.
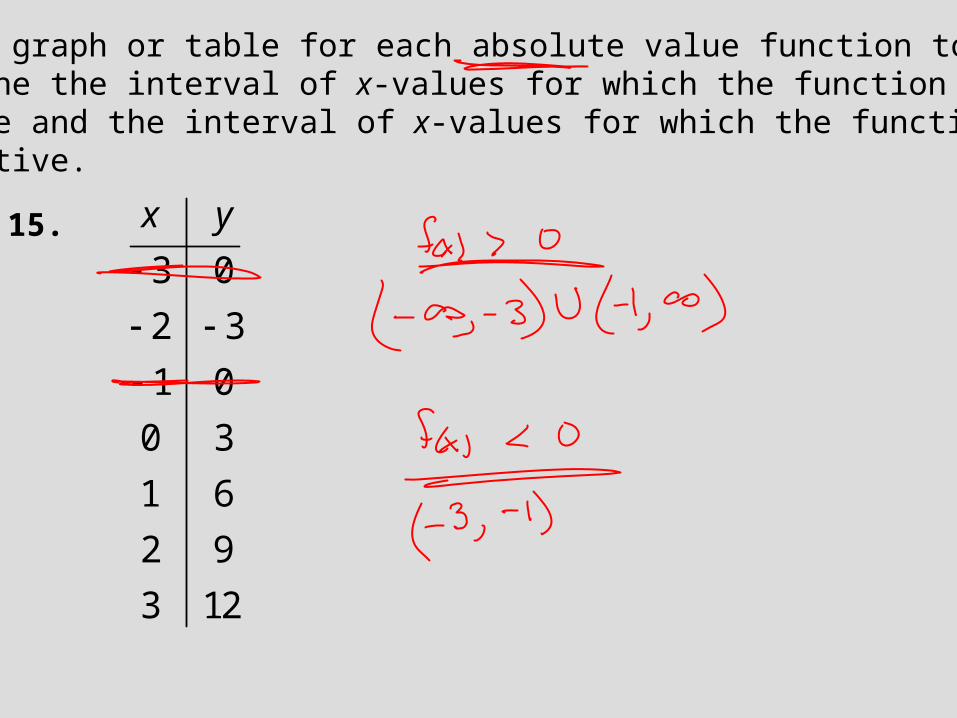
Use the graph or table for each absolute value function todetermine the interval of x-values for which the function is positive and the interval of x-values for which the function is negative.
3 0
2 3
1 0
0 3
1 6
2 9
3 12
x y
15.
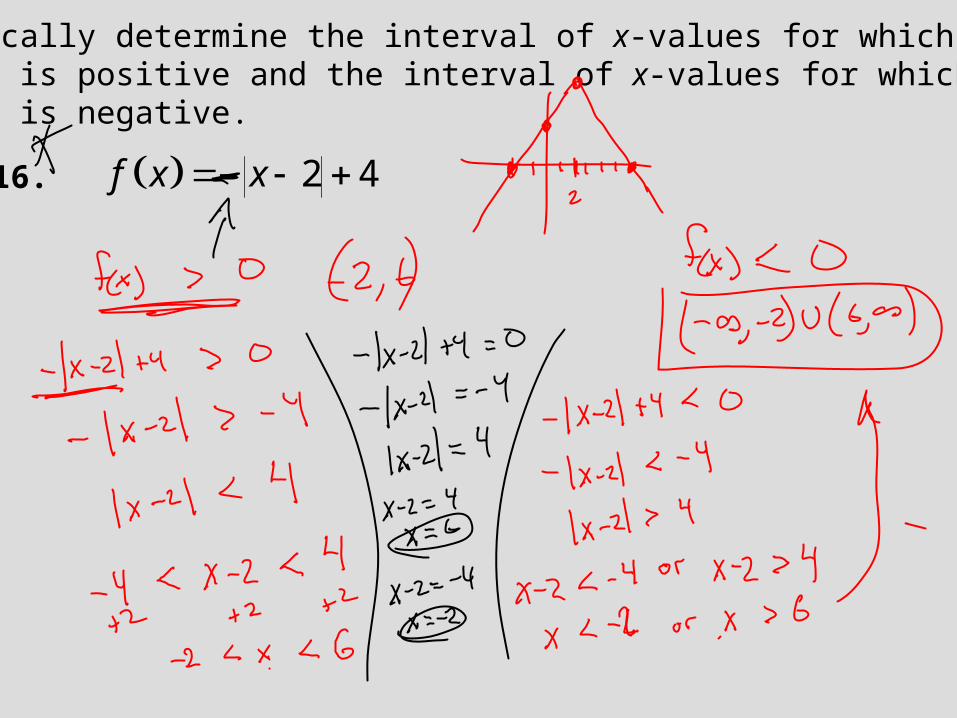
Algebraically determine the interval of x-values for which the function is positive and the interval of x-values for which the function is negative.
16. 2 4f x x
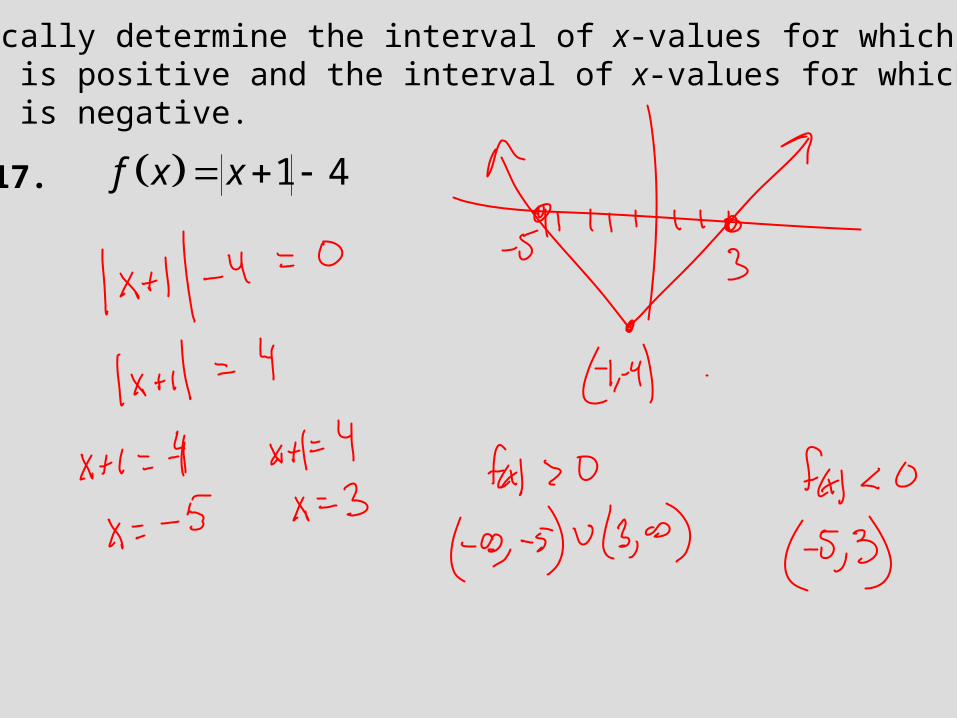
Algebraically determine the interval of x-values for which the function is positive and the interval of x-values for which the function is negative.
17. 1 4f x x
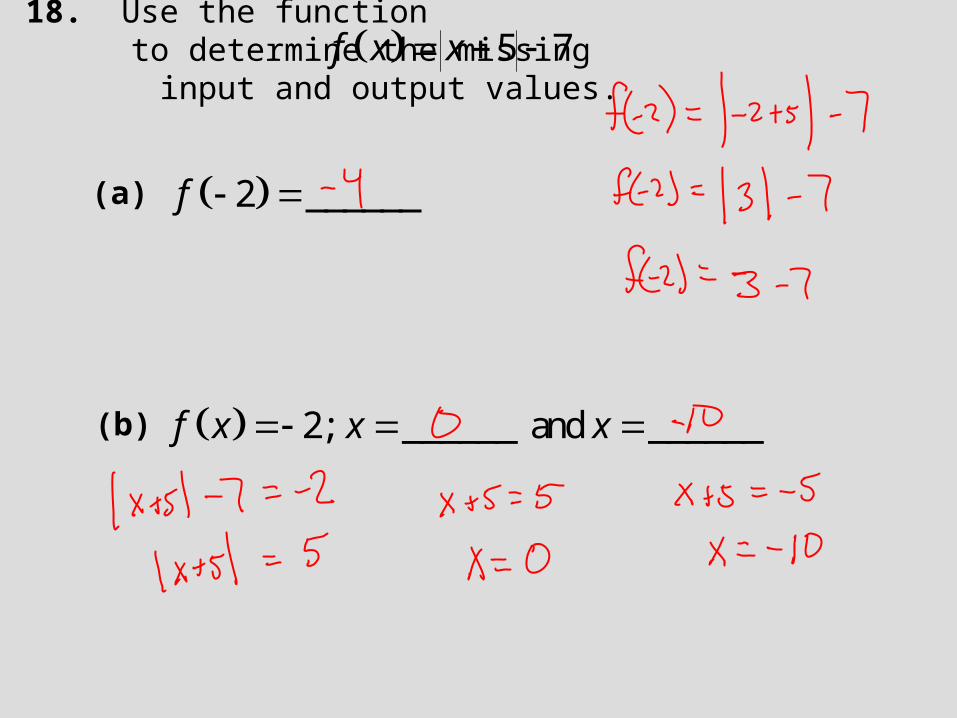
18. Use the function to determine the missing
input and output values.
5 7f x x
2 ______f
2; ______ and ______f x x x
(a)
(b)
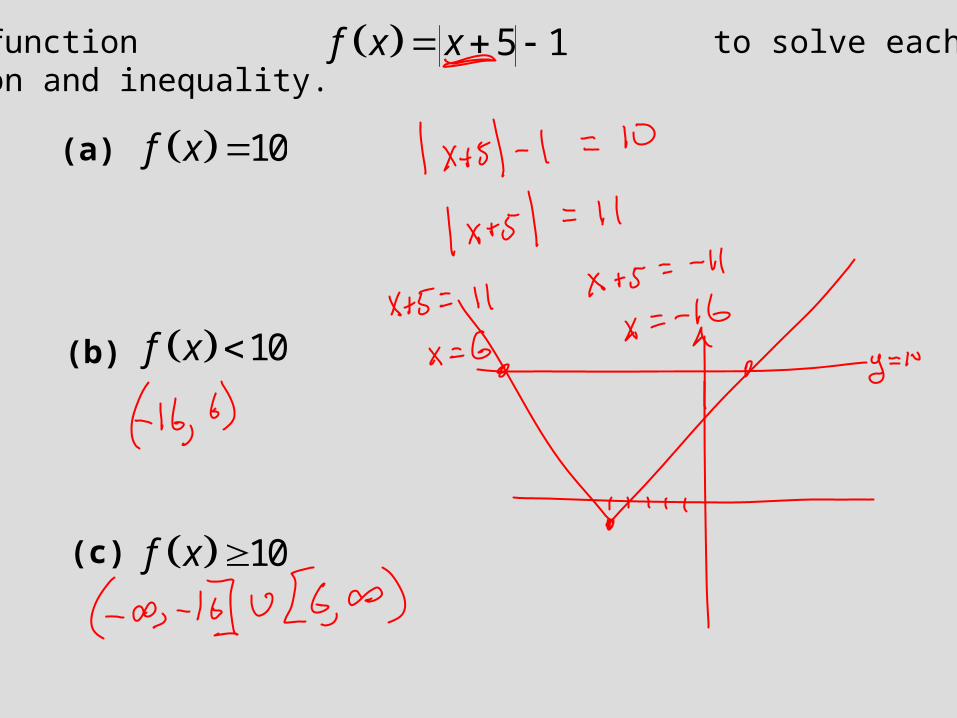
5 1f x x
10f x
10f x
10f x
19. Use the function to solve each equation and inequality.
(a)
(b)
(c)