Embed Size (px)
Citation preview
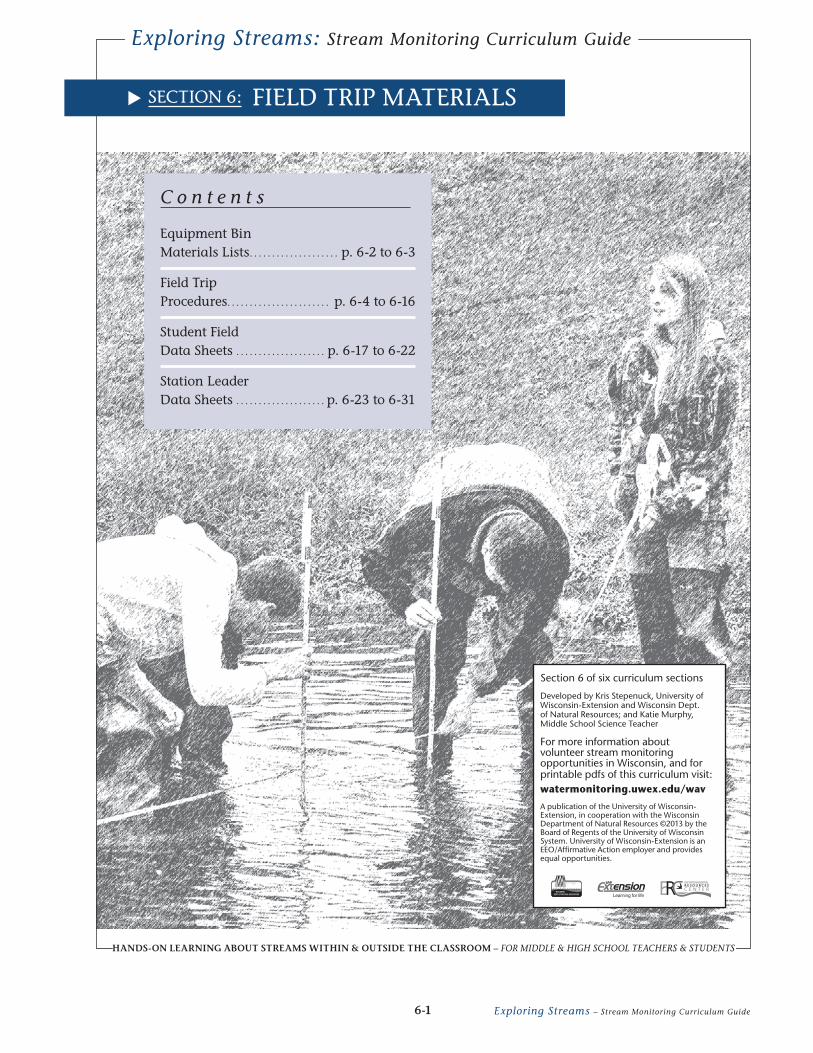
C o n t e n t s
Equipment Bin Materials Lists . . . . . . . . . . . . . . . . . . . . p. 6-2 to 6-3
Field Trip Procedures . . . . . . . . . . . . . . . . . . . . . . . p. 6-4 to 6-16
Student Field Data Sheets . . . . . . . . . . . . . . . . . . . . p. 6-17 to 6-22
Station Leader Data Sheets . . . . . . . . . . . . . . . . . . . . p. 6-23 to 6-31
Exploring Streams: Stream Monitoring Curriculum Guide
. SECTION 6: FIELD TRIP MATERIALS
HANDS-ON LEARNING ABOUT STREAMS WITHIN & OUTSIDE THE CLASSROOM – FOR MIDDLE & HIGH SCHOOL TEACHERS & STUDENTS
Section 6 of six curriculum sections
Developed by Kris Stepenuck, University of Wisconsin-Extension and Wisconsin Dept. of Natural Resources; and Katie Murphy, Middle School Science Teacher
For more information about volunteer stream monitoring opportunities in Wisconsin, and for printable pdfs of this curriculum visit:watermonitoring.uwex.edu/wav
A publication of the University of Wisconsin-Extension, in cooperation with the Wisconsin Department of Natural Resources ©2013 by the Board of Regents of the University of Wisconsin System. University of Wisconsin-Extension is an EEO/Affirmative Action employer and provides equal opportunities.
Learning for life
6-1 Exploring Streams – Stream Monitoring Curriculum Guide
A. EQUIPMENT BIN MATERIALS LISTS
Station 1a - Topographical Maps:
• CopyofMajorWatershedsofWisconsinmap
• Copiesofatopographicalmap(s)showingthestreambeingstudiedandtheschool
• Copiesofatopographicalmapofadifferentlocation
• CopiesofUSGSbrochure“TopographicMapSymbols”
• Rulers(1pergroupofthreestudents)
Station 1b - Transparency bin contents:
• 4pairshipboots(sharewithtemperaturemonitoringstation)*
• 4transparencytubes
Station 2 - Temperature/Water Sampling bin contents:
• 4pairshipboots(sharewithtransparencymonitoringstation)*
• 4thermometers
• 4Hachdissolvedoxygensamplingbottlesandstoppers
• 4clearplasticcups
• Optional–onlyifdoingE. coli monitoring:
– Antibacterial hand wipes
– Sharpie permanent marker
– Sterile 30 mL collection bottle
– Nitrile or latex gloves
– Cooler with ice
Station 3 - Dissolved Oxygen bin contents:
• 4Hachtestkits
• 8pairssafetygoggles
• 1boxgloves
Station 4 - Stream flow bin contents:
• 4pairshipboots*
• 4tapemeasures
• 4yardsticksormarkedpoles
• 24surveyingflags
• 4tennisballs
• 4stopwatchesordigitalwatches
• 4calculators
6-2 Exploring Streams – Stream Monitoring Curriculum Guide
Station 5 - Habitat bin contents:
• 4measuringtapes
• 8surveyingflags
Station 6 - Macroinvertebrate Sampling bin contents:
• 8pairshipboots*
• 4D-framekicknets
• 4whitedishpans
Station 7 - Macroinvertebrate Identification bin contents:
• 4laminatedKeystoMacroinvertebrateLifeintheRiver
• 4whiteicecubetrays
• 12whiteplasticspoons
• 4tweezers
• 4magnifyingglasses
• 4plasticcups
*Note: Hip boots may not be part of a station bin, depending on resources available. The number of pairs of hip
boots indicated is recommended for groups of 8-12 individuals.
. FIELD TRIP MATERIALS – EQUIPMENT BIN MATERIALS LISTS
6-3 Exploring Streams – Stream Monitoring Curriculum Guide
B. FIELD TRIP PROCEDURES
OVERALL FIELD TRIP PROCEDURES (Provide a copy of these to each Station Leader)
1. Students should be divided into six groups. At each station, students will work in pairs or groups of three.
2. Student groups will rotate through the following stations:
Station 1: Transparency/Topographical Maps Station 2: Water Sample Collection/Temperature/Language Arts Station 3: Dissolved Oxygen Station 4: Stream flow Station 5: Habitat Station 6: Macroinvertebrate Collection Station 7: Macroinvertebrate Identification
If only a few volunteers are available to lead station activities, the stations could be condensed as follows:
1. Water sample/Dissolved Oxygen/Temperature 2. Macroinvertebrate Collection and Identification/Transparency 3. Habitat/Stream Flow
If this option is chosen, each station will take approximately one hour to complete.
In this situation, neither the Magic Spots Language Arts Activity nor the Topographical Maps activity would be part of a set station. These could be offered as an additional station or used by a station leader if they had extra time after completing regular station activities.
Teachers may also opt to offer additional stations from suggested Extension Activities (page 2-25) to reduce group size if there is a large number of students to accommodate.
No students should initiate the field trip at Station 7, as macroinvertebrates need to be collected prior to a group working at that station.
It is recommended that the transparency station be located most upstream at your field location if possible to avoid students upstream from contaminating the transparency samples.
The temperature and dissolved oxygen stations should be located near the transparency station to facilitate sharing of hip boots and delivering the water sample, respectively.
Methods for each station should be used as a guideline for station leaders, but since students have prepared in advance, in general, methods are not designed to be handed out to the students (except for dissolved oxygen).
3. Allow approximately 30 minutes to complete each station. An additional 10 minutes should be allowed for students to move between stations and to act as a buffer for stations where students that may need a few extra minutes to complete their tasks.
4. One teacher, parent or volunteer should be assigned to blow a whistle or horn when there are five minutes left in each session, so station facilitators are aware of the time.
5. The lead teacher should collect student data sheets at the end of the field trip. However, for Middle School students or students who require more guidance; after students have completed the data collection at a station, station leaders can record student data on a station leader data sheet for the appropriate parameter (page 6-23). Station leaders should provide this completed data sheet to the lead teacher at the end of the field trip. There is no data sheet to complete at the macroinvertebrate collection station.
6-4 Exploring Streams – Stream Monitoring Curriculum Guide
TOPOGRAPHICAL MAP PROCEDURE:
1. Ask students to gather around a topographical map (not the one they’ll use for their activity) for a general explanation of what the map shows and how to read it.
2. Explain what a topographical map shows (i.e., topography or a graphical representation of the earth’s surface including elevation) and what that means in terms of watersheds and water flowing downhill to form streams, rivers and lakes.
3. Explain to students how to find the scale, legend and contour lines on the map. Talk through how to determine contour interval and steepness of slope based on the contour lines (the closer together the contour lines are, the steeper the slope).
4. Observe a watershed on the map with them, outlining (with your finger) watershed edges, and viewing streams and their direction of flow down gradients.
5. Explain that students will now be given topographical map(s) of the location of the field trip. They will be asked to answer several questions about the stream and the surrounding landscape.
6. Have students break into groups of three to complete the activity.
7. Students should study the map/images and locate their stream.
8. Students should complete the Finding Your Watershed worksheet.
TRANSPARENCY PROCEDURE:
Collecting the sample:
1. Collect the sample away from the river bank in the main flow area upstream from where you are standing. Enter the water downstream from the sampling location. Be careful not to stir up the bottom sediment upstream of your sampling location.
2. Face upstream (into the current).
3. Collect your water sample by holding your transparency tube horizontally and plunging it 8-12 inches beneath the surface or halfway down from the surface. Scoop away from your body and into the current.
4. Scoop water into the tube so it is filled to the top, or use a bucket to collect additional water from the stream at the site to fill the tube to the top.
5. Be careful not to collect water that has sediment from bottom disturbances (toss out the sample and try again if you get bottom sediment in your sample).
6. Return to shore with the sample.
Assessing transparency:
7. Remove large objects from the water sample. (Filter through nylon stocking if necessary.)
STATION 1: TOPOGRAPHICAL MAPS (FINDING YOUR WATERSHED AND TRANSPARENCY
6-5 Exploring Streams – Stream Monitoring Curriculum Guide
8. If the sample has settled, use a stirring stick to stir the sample, or pour the sample into a clean bucket and back into the transparency tube to suspend all materials.
9. Stand out of direct sunlight. If you cannot get to a shady place, use your body to cast a shadow on the tube.
10. If you are wearing sunglasses, remove them. Then look for the target (black and white) disc on the bottom of the tube. If the disc is visible, record the length of the tube (e.g., 120 cm) on the data sheet.
11. If the target disc is not visible, have your partner let water out a little at a time using the valve at the bottom until the disc is just visible. Have them stop letting water out immediately when you can just see the contrast between black and white on the disc.
12. Read the height of water in the tube using the measuring tape on its side.
13. Record the measurement on your data sheet in cm.
14. Dump contents of the tube on the ground.
15. Repeat steps 1 through 14. Record the second measurement in cm on your data sheet.
16. Add both of the readings, divide by 2, and record the average transparency on your data sheet.
17. Tell your results to your station leader.
. FIELD TRIP PROCEDURE STATION 1 – TOPOGRAPHICAL MAPS (FINDING YOUR
WATERSHED) AND TRANSPARENCY
6-6 Exploring Streams – Stream Monitoring Curriculum Guide
STATION 2: TEMPERATURE/WATER SAMPLE/ MAGIC SPOTS
WATER SAMPLING PROCEDURE FOR DISSOLVED OXYGEN (for each pair or group of students):
1. One person per group should put on a pair of hip boots (or tall rubber boots).
2. Use a Hach dissolved oxygen sampling bottle (glass bottle with the stopper) to collect a sample in normally moving water.
3. Facing upstream, slowly lower the bottle so the opening of the bottle faces away from you, and water current is entering the bottle.
4. Allow the bottle to fill with water gradually, turning it to allow air bubbles to float out.
5. Cap the bottle while still submerged, and leave extra water in the neck of the bottle.
6. When lifting out of water, look for bubbles. If you see any, pour out the sample and collect another using the same procedure.
7. Immediately pass this sample on to the dissolved oxygen station for analysis.
TEMPERATURE MONITORING PROCEDURE (for each pair or group of students):
1. Use the thermometer to measure the air temperature. Record the temperature on your data sheet. Be careful to hold the thermometer away from its base, as that is where the sensor is located.
2. To measure water temperature, test in the middle of the stream where the water is moving, not in pools or backwater areas. Test near where the water samples were gathered.
3. Lower the thermometer about four inches below the surface, as close as possible to the middle of the stream.
4. Leave the thermometer immersed until the reading has stabilized. This usually takes about two minutes. Try to take the reading with the base of the thermometer still immersed. You can fill a clear plastic cup with water and raise it to eye level to read the temperature.
5. Record your measurement on your data sheet. If you measured in º F, use the chart on the front to convert and record your measurement in º C.
6. Tell your air and water temperature results to your station leader.
(Optional) E. COLI BACTERIA WATER SAMPLE COLLECTION PROCEDURE (for each pair or group of students):
1. One person should put on a pair hip boots (or tall rubber boots).
2. Wash hands with antibacterial hand wipes.
3. Put on nitrile or latex gloves.
4. Obtain a 30 mL collection bottle.
5. Label the sample bottle with student group number or names, location and date with a permanent marker.
6-7 Exploring Streams – Stream Monitoring Curriculum Guide
6. With the bottle in hand, gently wade into the stream to the main area of flow. Walk slowly to avoid suspending sediments at the sampling site which could lead to false high E. coli counts.
7. Remove the bottle cap carefully so as to avoid touching the inside of the cap or bottle.
8. Sampling upstream from your location, face the open mouth of the bottle downward and immerse it 6-12 inches below the surface (or about midway down through the water column if the water depth does not allow sampling at this depth). While keeping it the same distance under the surface, turn and sweep the bottle in the direction of its opening, then turn it upright and remove it from the water.
9. After bringing the bottle above the surface, pour out a few centimeters of water so that there is a little bit of air space that will allow the sample to be mixed, then replace the lid on the bottle.
10. Place the sample in a cooler with ice packs to be transported back to your school.
MAGIC SPOTS, A LANGUAGE ARTS ACTIVITY PROCEDURE:
1. Explain to students that they will be making observations of their surroundings and recording those on their data sheet.
2. Explain that they will have about five minutes to sit quietly in a location on their own and assess what they see, hear, smell and feel in that area.
3. Also explain that they will have the opportunity to write a paragraph or a poem (Haiku) about the spot where they will sit.
4. Have students move to locations at least 10 feet from any other student. (If the teacher feels comfortable, and the group is mature enough, students can be asked to find a location out of sight of all other students. This can also be done in pairs.)
5. Begin timing this quiet activity and assisting students having difficulties with the assignment.
6. After the allotted time has passed, have the students come back to a central area and form a circle.
7. Ask each student to share something they observed during the activity. They can read a Haiku or a paragraph they wrote about their location, or they can share something they remember that was special or unique about the place where they sat.
. FIELD TRIP PROCEDURE STATION 2 – TEMPERATURE/WATER SAMPLE/MAGIC SPOTS
6-8 Exploring Streams – Stream Monitoring Curriculum Guide
STATION 3: DISSOLVED OXYGEN
FIXING THE DISSOLVED OXYGEN SAMPLE PROCEDURE:
These directions, with some minor modifications, are written for the Hach water testing kit for dissolved oxygen. Remember that photosynthesis and respiration will continue after a sample is collected, so water can gain or lose oxygen while sitting in the sample bottle. Therefore, you should BEGIN D.O. TESTING IMMEDIATELY UPON RECEIVING THE WATER SAMPLE.
1. Put on protective gloves and safety goggles. If your skin comes in contact with any powder or titrant, rinse the area liberally with water.
2. Remove the stopper and add the contents of D.O. powder pillow #1 (manganous sulfate powder) and D.O. powder pillow #2 (alkaline iodide azide powder) to the sample.
3. Insert the stopper, being careful not to trap an air bubble and shake vigorously, holding on to the top. If oxygen is present, a brownish-orange floc will form.
4. Allow the sample to stand until the floc settles halfway. Shake the bottle a second time and allow the floc to settle halfway again.
5. Remove the stopper and slowly add the contents of D.O. powder pillow #3 (sulfamic acid), taking care not to displace any floc.
6. Stopper and shake vigorously to dissolve the floc. Wait until all the floc is dissolved. The yellow color is from iodine. This is called the prepared sample. Prepared samples can be stored in the dark for a short time if it is more convenient or comfortable to return to your home/school to complete the analysis. Check with you teacher, if time enough remains at this station you may continue with the dissolved oxygen test.
Determining Dissolved Oxygen
7. Transfer two plastic measuring tubes full of prepared sample to the square glass mixing bottle. Using two measuring tubes allows you to determine D.O. to the nearest 0.5 mg/L.
a.) Holding the dropper vertically, add one drop at a time of sodium thiosulfate standard solution titrant to the square mixing bottle, and count each drop.
b.) Swirl the solution after each drop.
c.) Continue adding sodium thiosulfate drops until the sample is a very light yellow.
d.) Add 3 to 4 drops of starch solution. The prepared sample will turn blue from the added starch solution.
e.) Continue adding drops of sodium thiosulfate, mixing and counting until the prepared sample turns from blue to colorless (the end point). Often this is just one or two more drops, so be careful.
8. The dissolved oxygen content of the water in mg/L is the total number of drops of titrant used to get to the endpoint divided by two if two measuring tubes of prepared sample were used. If only one measuring tube of prepared sample was used, the dissolved oxygen content is equal to the number of drops of titrant. Example: If you used two tubes of sample, you need to divide by two (13 drops divided by two tubes = 6.5 mg/L). If you only used one tube of sample, it’s the actual number of drops of titrant used (6 drops with one tube = 6 mg/L).
9. Report the number of measuring tubes and the number of drops you used, and the calculated mg/L on your data sheet.
10. Tell your results to your station leader.
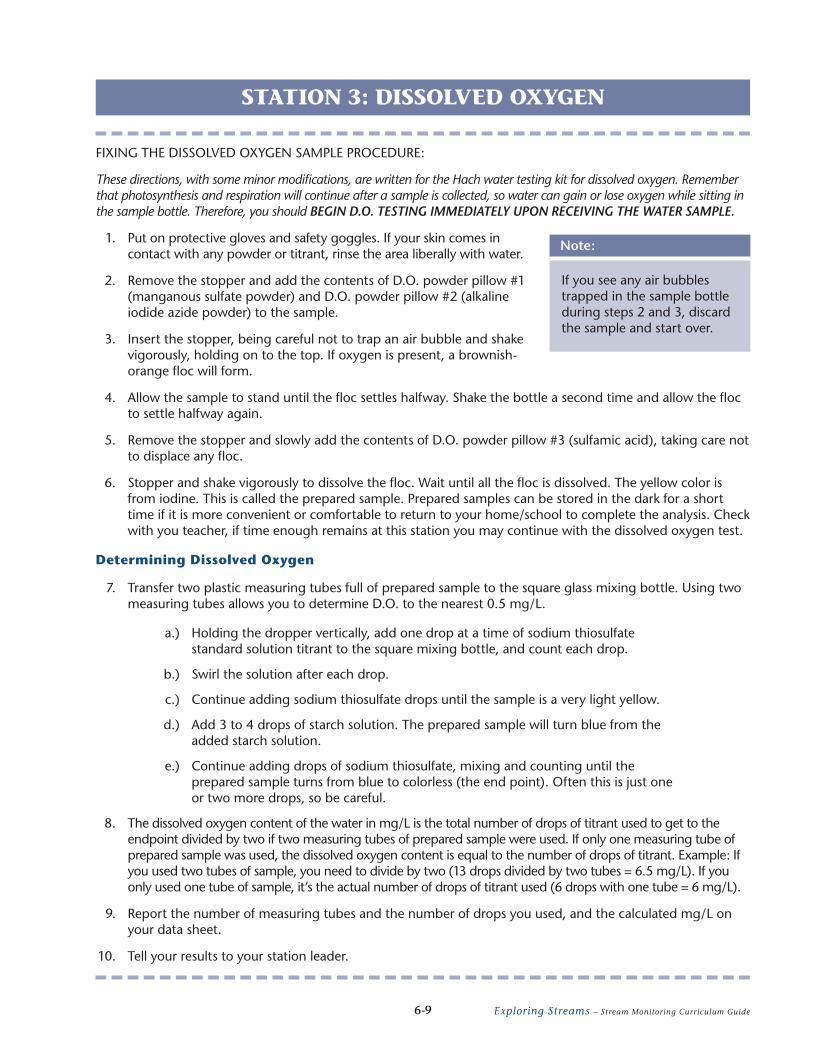
Note:
If you see any air bubbles trapped in the sample bottle during steps 2 and 3, discard the sample and start over.
6-9 Exploring Streams – Stream Monitoring Curriculum Guide
STATION 4: STREAM FLOW
PROCEDURE:
Safety considerations
You will need to enter the stream channel to make width and depth measurements and to calculate velocity. Be aware of stream velocity, water depth and bottom conditions at your stream-monitoring site. Do not attempt to measure stream flow if water velocity appears to be fast enough to knock you down when you are working in the stream. If you are unsure of water depth across the width of the stream, be sure to proceed with caution as you move across the stream, or choose an alternate point from which to measure stream flow.
Site location
1. At your monitoring site, locate a straight section of stream that is at least 20 feet in length and has a uniform width. The water should be at least 6 inches deep, and have some movement. Unobstructed runs or riffles are ideal sites to choose.
2. Measure 20 feet along the length of your chosen stream segment with your measuring tape and mark both the up and downstream ends of the section with flagging. Record this length on your data sheet.
Width and depth measurements
3. Working with a partner, measure stream width (from water’s edge to water’s edge) by extending a measuring tape across the stream at the midway point of your marked stream segment. Record the width in feet on your data sheet. (Using a tape measure graduated in tenths of feet will make calculations easier.)
4. Hold or secure the measuring tape to both shores so that the tape is taut and above the surface of the water. You might choose secrure the tape using shoreline vegetation or to attach the tape or a length of string to two stakes secured on opposite banks to create a transect line across the stream if it is impractical to hold the tape.
5. Using your engineer’s ruler or pre-marked (in tenths of feet) pole, measure the water depth (ft) at one-foot intervals across the stream where you measured width (and secured the measuring tape). Be sure to measure depth in tenths of feet, not in inches. Record depth measurements (ft) on the data sheet. If your stream is greater than 20 feet wide, measure the depth in 20 equal intervals across the stream.
Velocity measurement
6. Velocity will be measured by tracking the time it takes a floating object to move the marked 20-foot length of stream. You will time the floating object (in seconds) a total of four times, at different locations across the stream. Repeating your measurements across the stream, in both slower and faster areas, will help to ensure the closest approximation to the stream’s true velocity. This in turn will make your flow calculations more accurate. However, be sure your float travels freely downstream (during every float trial) without catching in slack water areas of the stream. For narrower streams (less than 10 feet), you can conduct only three float trials to assess velocity.
7. Position the person who will release the float upstream from the upper flag. Position the timekeeper with the stopwatch on the streambank (or out of the main flow path) at the downstream flag. Position the person who will catch the float downstream from the timekeeper. (Note: Unless velocity is very fast, the timekeeper should be able to catch the float with a net after they have finished timing its run down the stream.)
6-10 Exploring Streams – Stream Monitoring Curriculum Guide
8. The float-releaser will gently drop the float into the stream a few feet upstream from the upper flag, and will alert the timekeeper to begin timing as the float passes the upstream flag (the float should have time to get up to speed by the time it passes the upper flag into the marked length of stream). If the float gets stuck on a log, rock or other obstruction, it should be released from the starting point again.
9. The timekeeper should stop the stopwatch as the float passes the downstream flag and retrieve the float using the net.
10. Record the float time for the first trial on the data sheet.
11. Repeat steps 8 and 9 for each of the remaining float time trials in different sections of the stream. Record the float time (seconds) for each trial on your data sheet.
. FIELD TRIP PROCEDURE STATION 4 – STREAM FLOW
6-11 Exploring Streams – Stream Monitoring Curriculum Guide
STATION 5: HABITAT ASSESSMENT
Safety:
Water appearance and odor can indicate water pollution. However, it can also indicate a possible safety hazard. If you notice any unusual water characteristics, DO NOT ENTER THE WATER and contact your local DNR office to report it. Your safety is important to us.
Here is a list of normal and possibly hazardous characteristics of water:
Clear – Colorless, transparent.
Turbid – Cloudy brown. May be due to suspended silt or organic materials suspended in the water.
Milky – Cloudy-white or gray, not transparent. May be natural or due to pollution.
Foamy – May be natural or caused by excessive nutrients or detergents from pollution. (Foam that is several inches high and does not brush apart easily is generally due to some sort of pollution.)
Dark brown – Tea-colored. May indicate that a naturally occurring, harmless acid is being released into the stream.
Oily sheen – A multicolored reflection. Can occur naturally or it may indicate oil or other petro chemicals floating in the stream.
Orange/Reddish – May indicate acids draining into the water or iron bacteria.
Green – Caused by algae. May indicate excess nutrients are being released into the stream. No smell or a natural odor.
Sewage – May indicate the release of human waste material, livestock manure flow from an upstrea feed lot. If you smell sewage/manure or rotten eggs come from the stream, please do not enter the water. Notify the nearest DNR Service Center.
Chlorine – May indicate that a sewage treatment treatment plant is over-chlorinating its effluent or may be from swimming pool discharge. Also component of milk house cleaning.
Fishy – May indicate the presence of excessive algae growth or dead fish.
Rotten eggs – A sulfurous smell may indicate muck soils or sewage/manure pollution, as hydrogen sulfide gas is a product of organic decomposition.
Petroleum – May indicate an oil spill from boats, land or storm drains.
PROCEDURE:
1. Determine if your stream is a rocky-bottom or soft-bottom stream.
2. Measure and mark a 300 ft. section of the stream.
3. Obtain the appropriate Habitat Checklist (i.e., rocky-bottom or soft-bottom stream) and answer the questions on that sheet.
4. Total the habitat score for your stream.
5. Provide your results to your station leader.
6-12 Exploring Streams – Stream Monitoring Curriculum Guide
STATION 6: MACROINVERTEBRATE COLLECTION
PROCEDURE:
1. At least two people in each group should put on hip boots. (It’s great if everyone is able to wear them if possible.)
2. Follow the procedures below to select sampling sites and to collect macroinvertebrates properly in the type of habitat you are sampling.
3. Collect three sub-samples within the 300-foot stream section where you are monitoring. Combine them into one bin for a complete biotic index sample.
Selecting Sampling Sites
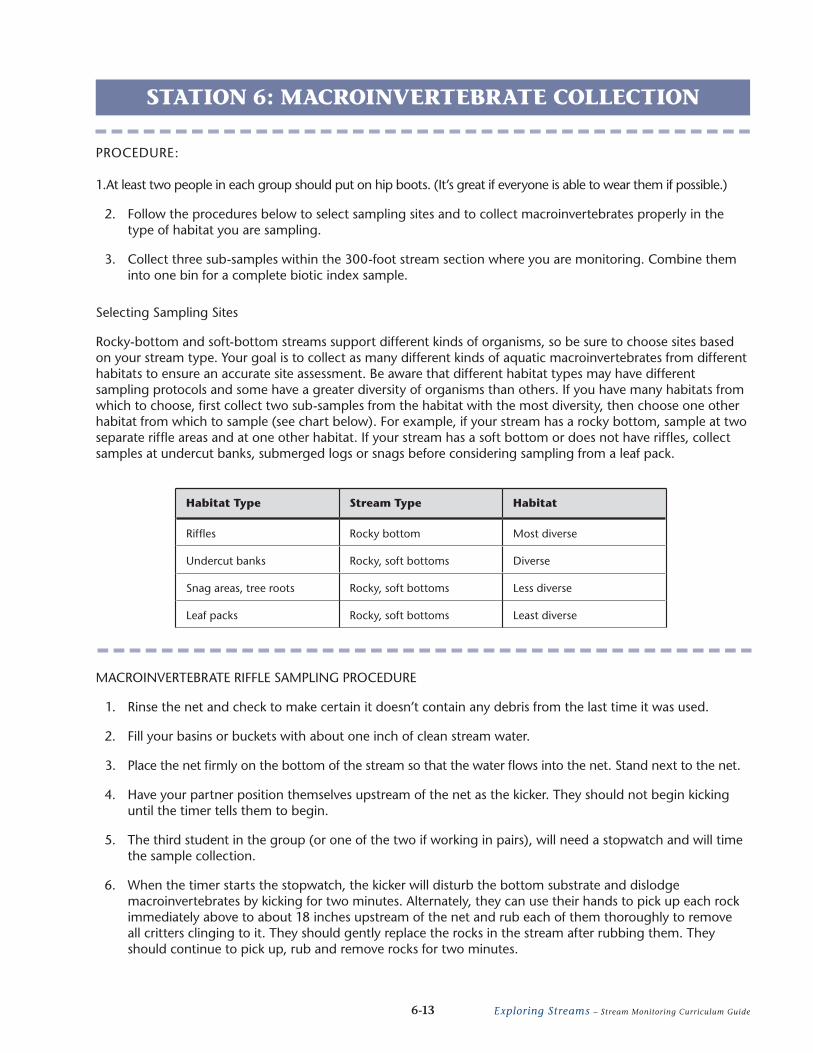
Rocky-bottom and soft-bottom streams support different kinds of organisms, so be sure to choose sites based on your stream type. Your goal is to collect as many different kinds of aquatic macroinvertebrates from different habitats to ensure an accurate site assessment. Be aware that different habitat types may have different sampling protocols and some have a greater diversity of organisms than others. If you have many habitats from which to choose, first collect two sub-samples from the habitat with the most diversity, then choose one other habitat from which to sample (see chart below). For example, if your stream has a rocky bottom, sample at two separate riffle areas and at one other habitat. If your stream has a soft bottom or does not have riffles, collect samples at undercut banks, submerged logs or snags before considering sampling from a leaf pack.
MACROINVERTEBRATE RIFFLE SAMPLING PROCEDURE
1. Rinse the net and check to make certain it doesn’t contain any debris from the last time it was used.
2. Fill your basins or buckets with about one inch of clean stream water.
3. Place the net firmly on the bottom of the stream so that the water flows into the net. Stand next to the net.
4. Have your partner position themselves upstream of the net as the kicker. They should not begin kicking until the timer tells them to begin.
5. The third student in the group (or one of the two if working in pairs), will need a stopwatch and will time the sample collection.
6. When the timer starts the stopwatch, the kicker will disturb the bottom substrate and dislodge macroinvertebrates by kicking for two minutes. Alternately, they can use their hands to pick up each rock immediately above to about 18 inches upstream of the net and rub each of them thoroughly to remove all critters clinging to it. They should gently replace the rocks in the stream after rubbing them. They should continue to pick up, rub and remove rocks for two minutes.
Habitat Type Stream Type Habitat
Riffles Rocky bottom Most diverse
Undercut banks Rocky, soft bottoms Diverse
Snag areas, tree roots Rocky, soft bottoms Less diverse
Leaf packs Rocky, soft bottoms Least diverse
6-13 Exploring Streams – Stream Monitoring Curriculum Guide
7. When sampling, if you find you have too much water in your bucket or if the water is too muddy, pour the excess/muddy water through your net. Then allow stream water to flow through the net to rinse the sample within it, being careful not to lose anything from within the net. Add some clean water to the basin and empty the contents of the net into it.
8. Carry the net to shore and dump the contents into one basin or bucket with water and/or organisms and debris from other habitats’ sub-samples.
9. All organisms clinging to the net should be removed and placed in the basin.
10. When you have added three sub-samples to your basin, you have collected a complete biotic index sample. Return to shore with your basin.
MACROINVERTEBRATE SNAG SAMPLING PROCEDURE
(Snag areas are accumulations of debris caught on logs, stumps or other obstruction in the water.)
1. Rinse the net and check to make certain it doesn’t contain any debris from the last time it was used.
2. Fill your basins or buckets with about one inch of clean stream water.
3. Select about a three-foot by three-foot area (for uniform comparisons) around the snag, tree roots, logs or other debris.
4. Scrape the surface of the tree roots, logs or other debris with your net. You can also disturb the surfaces by scraping them with the net, your hands or your foot, or you can pull off some of the bark to get at organisms hiding underneath.
5. Twenty jabs equals one sample.
6. To remove sediment, allow water to flow through the net while holding it in the stream. Be careful to keep the opening facing upstream so you don’t lose any organisms.
7. Carry the net to shore and dump the contents into one basin or bucket with water and/or organisms and debris from other habitats’ sub-samples.
8. All organisms clinging to the net should be removed and placed in the basin.
9. When you have added three sub-samples to your basin, you have collected a complete biotic index sample. Return to shore with your basin.
MACROINVERTEBRATE UNDERCUT BANK SAMPLING PROCEDURE
(Undercut banks have scooped-out areas just below the surface of the water. This creates a bank that slightly overhangs on the surface of the water, and proivdes habitat for many kinds of organisms underneath).
1. Rinse the net and check to make certain it doesn’t contain any debris from the last time it was used.
2. Fill your basins or buckets with about one inch of clean stream water.
3. Facing the bank, move the net in a bottom-to-surface motion along the undercut bank to dislodge organisms. Jabbing the net about 20 times should provide enough organisms for your sample.
. FIELD TRIP PROCEDURE STATION 6 – MACROINVERTEBRATE COLLECTION
6-14 Exploring Streams – Stream Monitoring Curriculum Guide
4. Carry the net to shore and dump the contents into one basin or bucket with water and/or organisms and debris from other habitats’ sub-samples.
5. All organisms clinging to the net should be removed and placed in the basin.
6. When you have added three sub-samples to your basin, you have collected a complete biotic index sample. Return to shore with your basin.
MACROINVERTEBRATE LEAF PACK SAMPLING PROCEDURE
1. Rinse the net and check to make certain it doesn’t contain any debris from the last time it was used.
2. Fill your basins or buckets with about one inch of clean stream water.
3. Look for old leaf packs that are dark brown, slimy and slightly decomposed.
4. Working in pairs, position the dip net downstream from the leaf pack. Use your feet or hands to (or have your partner) gently move the leaf pack into the net.
5. Carry the net to shore and dump the contents into one basin or bucket with water and/or organisms and debris from other habitats’ sub-samples.
6. All organisms clinging to the net should be removed and placed in the basin.
7. When you have added three sub-samples to your basin, you have collected a complete biotic index sample. Return to shore with your basin.
. FIELD TRIP PROCEDURE STATION 6 – MACROINVERTEBRATE COLLECTION
6-15 Exploring Streams – Stream Monitoring Curriculum Guide
STATION 7: MACROINVERTEBRATE IDENTIFICATION
MACROINVERTEBRATE IDENTIFICATION PROCEDURE:
1. You will be assigned a dishpan to examine.
2. Examine leaves, sticks and other large objects in the sample for any macroinvertebrates that might be hiding.
3. After examining this debris, place it in another container to check later for organisms that may crawl out.
4. Fill the ice cube tray half-full of water.
5. Use plastic spoons to sort out the macroinvertebrates and place macroinvertebrates that look alike together in their own ice cube tray compartments. Sorting and placing similar looking macroinvertebrates together will help insure that you find all varieties of species in the sample.
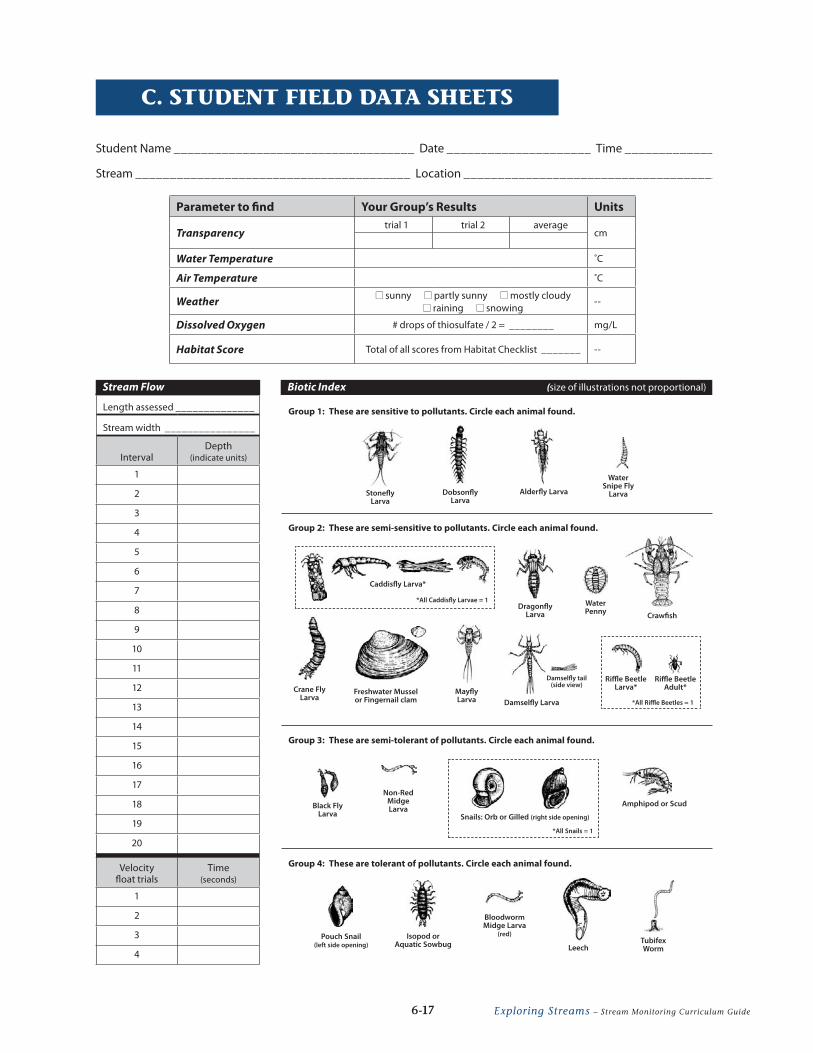
6. Refer to the Key to Macroinvertebrate Life in the River, the macroinvertebrate wild cards and the citizen monitoring biotic index data sheet to identify the aquatic macroinvertebrates.
7. On the citizen monitoring biotic index data sheet, circle the animals on the data sheet that match those found in your sample.
8. Count the number of types of animals that are checked in each group and write that number in the box for each group on your data sheet. (Note: Do not count individual animals that you collected. Only count the number of types of animals found in each group.)
9. Report the number you circled for each group to your station leader for his/her data sheet.
10. Safely return all macroinvertebrates to the stream after sorting and identifying them.
6-16 Exploring Streams – Stream Monitoring Curriculum Guide
C. STUDENT FIELD DATA SHEETS
Student Name ___________________________________ Date _____________________ Time _______________
Stream ________________________________________ Location ______________________________________
Parameter to find Your Group’s Results Units
Transparency trial 1 trial 2 average
cm
Water Temperature ˚C
Air Temperature ˚C
Weather N sunny N partly sunny N mostly cloudy N raining N snowing
--
Dissolved Oxygen # drops of thiosulfate / 2 = ________ mg/L
Habitat Score Total of all scores from Habitat Checklist _______ --
Length assessed ______________
Stream width ________________
IntervalDepth
(indicate units)
1
2
3
4
5
6
7
8
9
10
11
12
13
14
15
16
17
18
19
20
Velocity float trials
Time (seconds)
1
2
3
4
Stream Flow Biotic Index (size of illustrations not proportional)
Non-Red Midge Larva
Riffle Beetle Adult*Crane Fly
LarvaFreshwater Mussel or Fingernail clam
Caddisfly Larva*
Dragonfly Larva Crawfish
Water Snipe Fly
LarvaAlderfly Larva Dobsonfly Larva
StoneflyLarva
Water Penny
Amphipod or ScudBlack Fly Larva
Pouch Snail (left side opening)
Isopod or Aquatic Sowbug
Bloodworm Midge Larva
(red)
LeechTubifexWorm
*All Caddisfly Larvae = 1
Damselfly Larva
Riffle Beetle Larva*
*All Riffle Beetles = 1
Damselfly tail (side view)
Group 1: These are sensitive to pollutants. Circle each animal found.
Group 2: These are semi-sensitive to pollutants. Circle each animal found.
Group 3: These are semi-tolerant of pollutants. Circle each animal found.
Group 4: These are tolerant of pollutants. Circle each animal found.
*All Snails = 1
Mayfly Larva
Snails: Orb or Gilled (right side opening)
6-17 Exploring Streams – Stream Monitoring Curriculum Guide
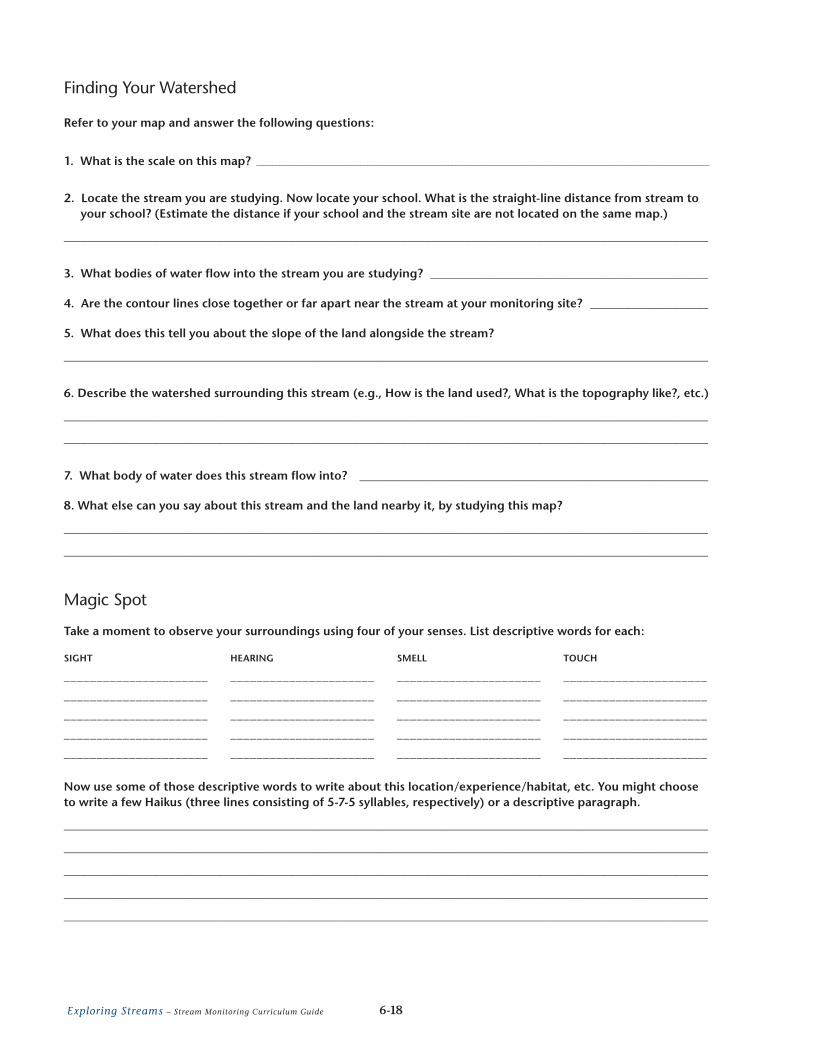
Finding Your Watershed
Refer to your map and answer the following questions:
1. What is the scale on this map? ___________________________________________________________________________________________________________________________________________
2. Locate the stream you are studying. Now locate your school. What is the straight-line distance from stream to your school? (Estimate the distance if your school and the stream site are not located on the same map.)
_____________________________________________________________________________________________________________
3. What bodies of water flow into the stream you are studying? _______________________________________________
4. Are the contour lines close together or far apart near the stream at your monitoring site? ____________________
5. What does this tell you about the slope of the land alongside the stream?
_____________________________________________________________________________________________________________
6. Describe the watershed surrounding this stream (e.g., How is the land used?, What is the topography like?, etc.)
_____________________________________________________________________________________________________________
_____________________________________________________________________________________________________________
7. What body of water does this stream flow into? ___________________________________________________________
8. What else can you say about this stream and the land nearby it, by studying this map?
_____________________________________________________________________________________________________________
_____________________________________________________________________________________________________________
Magic Spot
Take a moment to observe your surroundings using four of your senses. List descriptive words for each:
Now use some of those descriptive words to write about this location/experience/habitat, etc. You might choose to write a few Haikus (three lines consisting of 5-7-5 syllables, respectively) or a descriptive paragraph.
_____________________________________________________________________________________________________________
_____________________________________________________________________________________________________________
_____________________________________________________________________________________________________________
_____________________________________________________________________________________________________________
_____________________________________________________________________________________________________________
SIGHT
______________________
______________________
______________________
______________________
______________________
HEARING
______________________
______________________
______________________
______________________
______________________
SMELL
______________________
______________________
______________________
______________________
______________________
TOUCH
______________________
______________________
______________________
______________________
______________________
6-18 Exploring Streams – Stream Monitoring Curriculum Guide
Student Name ___________________________________ Date _____________________ Time _______________
Stream ________________________________________ Location ______________________________________
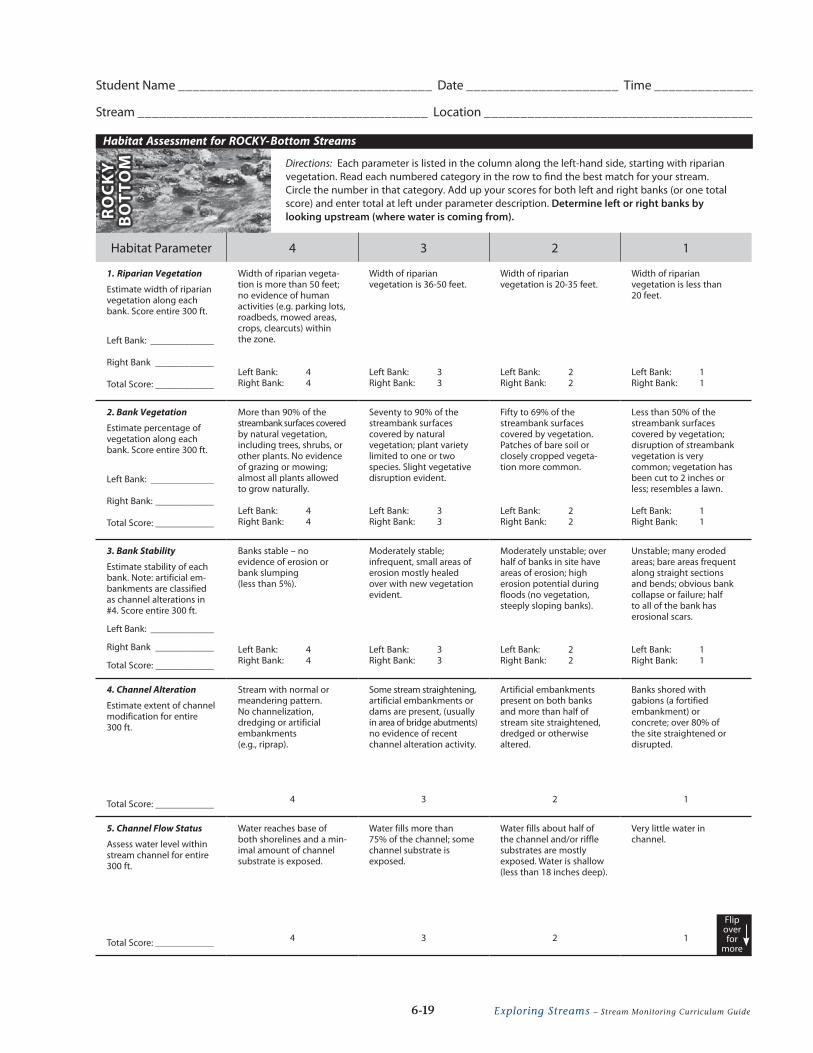
Habitat Assessment for ROCKY-Bottom Streams
RO
CK
Y B
OTT
OM Directions: Each parameter is listed in the column along the left-hand side, starting with riparian
vegetation. Read each numbered category in the row to find the best match for your stream. Circle the number in that category. Add up your scores for both left and right banks (or one total score) and enter total at left under parameter description. Determine left or right banks by looking upstream (where water is coming from).
Habitat Parameter 4 3 2 1
1. Riparian Vegetation
Estimate width of riparian vegetation along each bank. Score entire 300 ft.
Left Bank: _____________
Right Bank ____________
Total Score: ____________
Width of riparian vegeta-tion is more than 50 feet; no evidence of human activities (e.g. parking lots, roadbeds, mowed areas, crops, clearcuts) within the zone.
Left Bank: 4Right Bank: 4
Width of riparian vegetation is 36-50 feet.
Left Bank: 3Right Bank: 3
Width of riparian vegetation is 20-35 feet.
Left Bank: 2Right Bank: 2
Width of riparian vegetation is less than 20 feet.
Left Bank: 1Right Bank: 1
2. Bank Vegetation
Estimate percentage of vegetation along each bank. Score entire 300 ft.
Left Bank: _____________
Right Bank: ____________
Total Score: ____________
More than 90% of the streambank surfaces covered by natural vegetation, including trees, shrubs, or other plants. No evidence of grazing or mowing; almost all plants allowed to grow naturally.
Left Bank: 4Right Bank: 4
Seventy to 90% of the streambank surfaces covered by natural vegetation; plant variety limited to one or two species. Slight vegetative disruption evident.
Left Bank: 3Right Bank: 3
Fifty to 69% of the streambank surfaces covered by vegetation. Patches of bare soil or closely cropped vegeta-tion more common.
Left Bank: 2Right Bank: 2
Less than 50% of the streambank surfaces covered by vegetation; disruption of streambank vegetation is very common; vegetation has been cut to 2 inches or less; resembles a lawn.
Left Bank: 1Right Bank: 1
3. Bank Stability
Estimate stability of each bank. Note: artificial em-bankments are classified as channel alterations in #4. Score entire 300 ft.
Left Bank: _____________
Right Bank ____________
Total Score: ____________
Banks stable – no evidence of erosion or bank slumping (less than 5%).
Left Bank: 4Right Bank: 4
Moderately stable; infrequent, small areas of erosion mostly healed over with new vegetation evident.
Left Bank: 3Right Bank: 3
Moderately unstable; over half of banks in site have areas of erosion; high erosion potential during floods (no vegetation, steeply sloping banks).
Left Bank: 2Right Bank: 2
Unstable; many eroded areas; bare areas frequent along straight sections and bends; obvious bank collapse or failure; half to all of the bank has erosional scars.
Left Bank: 1Right Bank: 1
4. Channel Alteration
Estimate extent of channel modification for entire 300 ft.
Total Score: ____________
Stream with normal or meandering pattern. No channelization, dredging or artificial embankments (e.g., riprap).
4
Some stream straightening, artificial embankments or dams are present, (usually in area of bridge abutments) no evidence of recent channel alteration activity.
3
Artificial embankments present on both banks and more than half of stream site straightened, dredged or otherwise altered.
2
Banks shored with gabions (a fortified embankment) or concrete; over 80% of the site straightened or disrupted.
1
5. Channel Flow Status
Assess water level within stream channel for entire 300 ft.
Total Score: ____________
Water reaches base of both shorelines and a min-imal amount of channel substrate is exposed.
4
Water fills more than 75% of the channel; some channel substrate is exposed.
3
Water fills about half of the channel and/or riffle substrates are mostly exposed. Water is shallow (less than 18 inches deep).
2
Very little water in channel.
1
Flip over for
more
6-19 Exploring Streams – Stream Monitoring Curriculum Guide
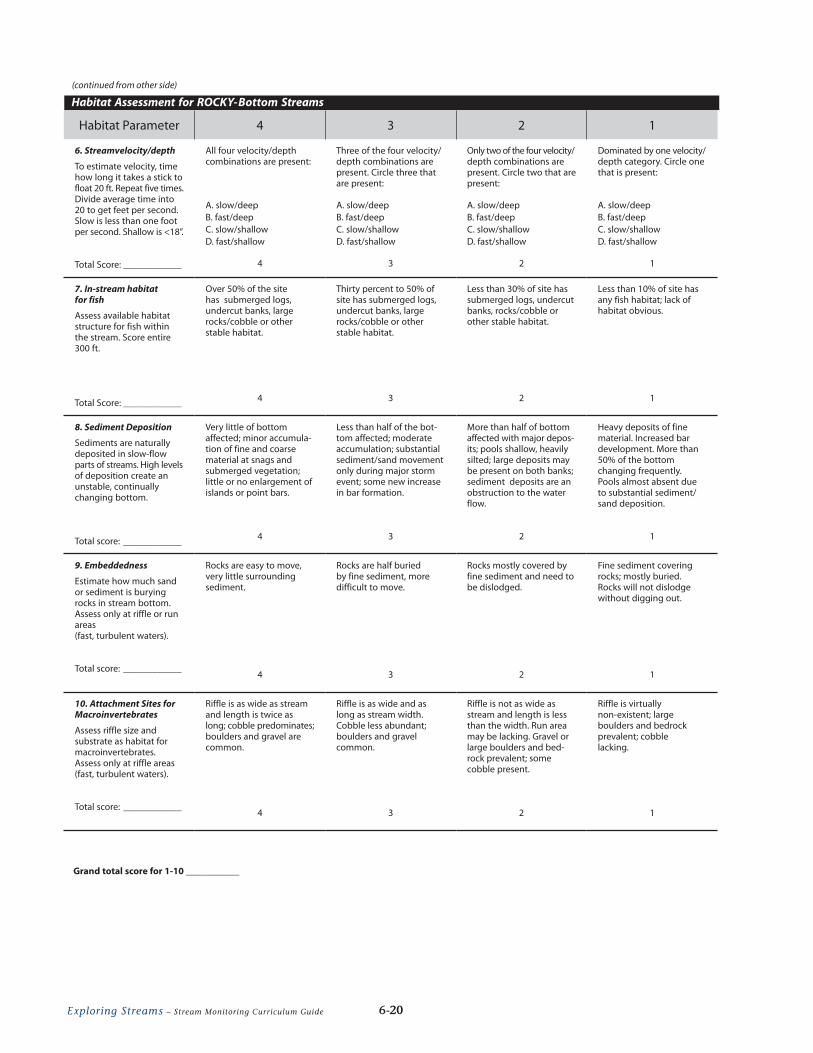
Habitat Assessment for ROCKY-Bottom Streams(continued from other side)
Habitat Parameter 4 3 2 1
6. Streamvelocity/depth
To estimate velocity, time how long it takes a stick to float 20 ft. Repeat five times. Divide average time into 20 to get feet per second. Slow is less than one foot per second. Shallow is <18”.
Total Score: ____________
All four velocity/depth combinations are present:
A. slow/deepB. fast/deepC. slow/shallow D. fast/shallow
4
Three of the four velocity/ depth combinations are present. Circle three that are present:
A. slow/deepB. fast/deepC. slow/shallowD. fast/shallow
3
Only two of the four velocity/ depth combinations are present. Circle two that are present:
A. slow/deepB. fast/deepC. slow/shallowD. fast/shallow
2
Dominated by one velocity/ depth category. Circle one that is present:
A. slow/deepB. fast/deepC. slow/shallowD. fast/shallow
1
7. In-stream habitat for fish
Assess available habitat structure for fish within the stream. Score entire 300 ft.
Total Score: ____________
Over 50% of the site has submerged logs, undercut banks, large rocks/cobble or other stable habitat.
4
Thirty percent to 50% of site has submerged logs, undercut banks, large rocks/cobble or other stable habitat.
3
Less than 30% of site has submerged logs, undercut banks, rocks/cobble or other stable habitat.
2
Less than 10% of site has any fish habitat; lack of habitat obvious.
1
8. Sediment Deposition
Sediments are naturally deposited in slow-flow parts of streams. High levels of deposition create an unstable, continually changing bottom.
Total score: ____________
Very little of bottom affected; minor accumula-tion of fine and coarse material at snags and submerged vegetation; little or no enlargement of islands or point bars.
4
Less than half of the bot-tom affected; moderate accumulation; substantial sediment/sand movement only during major storm event; some new increase in bar formation.
3
More than half of bottom affected with major depos-its; pools shallow, heavily silted; large deposits may be present on both banks; sediment deposits are an obstruction to the water flow.
2
Heavy deposits of fine material. Increased bar development. More than 50% of the bottom changing frequently. Pools almost absent due to substantial sediment/sand deposition.
1
9. Embeddedness
Estimate how much sand or sediment is burying rocks in stream bottom. Assess only at riffle or run areas (fast, turbulent waters).
Total score: ____________
Rocks are easy to move, very little surrounding sediment.
4
Rocks are half buried by fine sediment, more difficult to move.
3
Rocks mostly covered by fine sediment and need to be dislodged.
2
Fine sediment covering rocks; mostly buried. Rocks will not dislodge without digging out.
1
10. Attachment Sites for Macroinvertebrates
Assess riffle size and substrate as habitat for macroinvertebrates. Assess only at riffle areas (fast, turbulent waters).
Total score: ____________
Riffle is as wide as stream and length is twice as long; cobble predominates; boulders and gravel are common.
4
Riffle is as wide and as long as stream width. Cobble less abundant; boulders and gravel common.
3
Riffle is not as wide as stream and length is less than the width. Run area may be lacking. Gravel or large boulders and bed-rock prevalent; some cobble present.
2
Riffle is virtually non-existent; large boulders and bedrock prevalent; cobble lacking.
1
Grand total score for 1-10 ___________
6-20 Exploring Streams – Stream Monitoring Curriculum Guide
Student Name ___________________________________ Date _____________________ Time _______________
Stream ________________________________________ Location ______________________________________
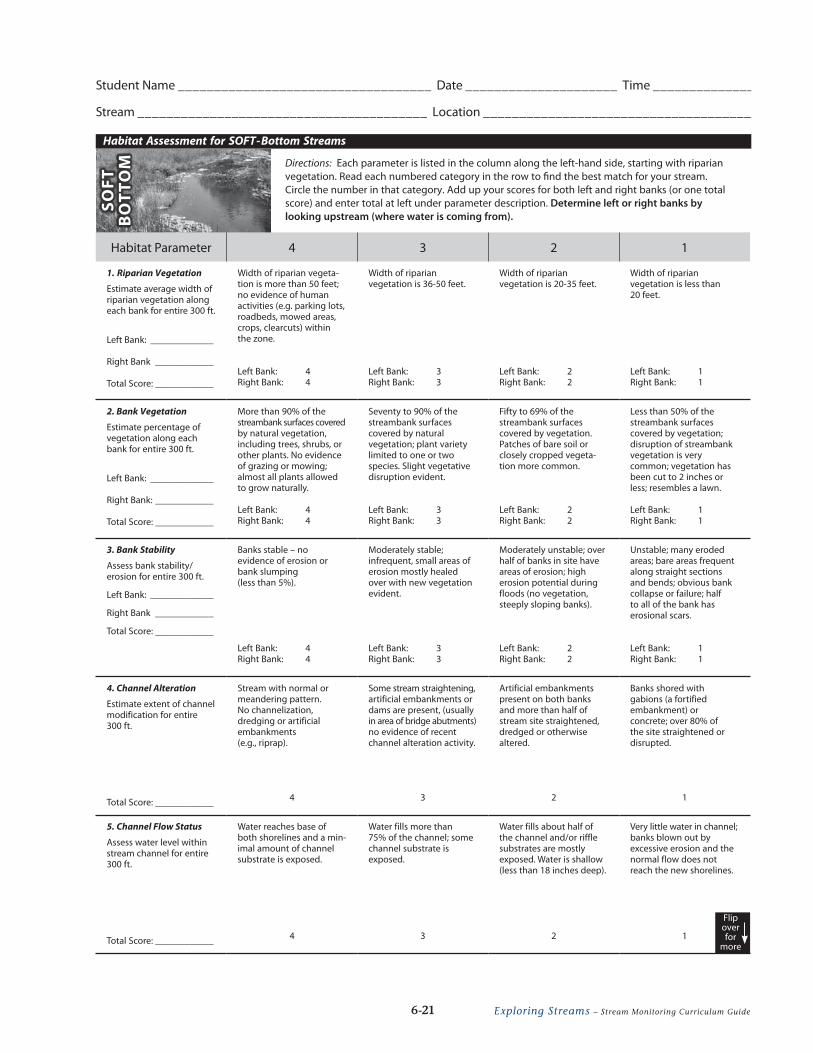
Habitat Assessment for SOFT-Bottom Streams
SOFT
B
OTT
OM Directions: Each parameter is listed in the column along the left-hand side, starting with riparian
vegetation. Read each numbered category in the row to find the best match for your stream. Circle the number in that category. Add up your scores for both left and right banks (or one total score) and enter total at left under parameter description. Determine left or right banks by looking upstream (where water is coming from).
Habitat Parameter 4 3 2 1
1. Riparian Vegetation
Estimate average width of riparian vegetation along each bank for entire 300 ft.
Left Bank: _____________
Right Bank ____________
Total Score: ____________
Width of riparian vegeta-tion is more than 50 feet; no evidence of human activities (e.g. parking lots, roadbeds, mowed areas, crops, clearcuts) within the zone.
Left Bank: 4Right Bank: 4
Width of riparian vegetation is 36-50 feet.
Left Bank: 3Right Bank: 3
Width of riparian vegetation is 20-35 feet.
Left Bank: 2Right Bank: 2
Width of riparian vegetation is less than 20 feet.
Left Bank: 1Right Bank: 1
2. Bank Vegetation
Estimate percentage of vegetation along each bank for entire 300 ft.
Left Bank: _____________
Right Bank: ____________
Total Score: ____________
More than 90% of the streambank surfaces covered by natural vegetation, including trees, shrubs, or other plants. No evidence of grazing or mowing; almost all plants allowed to grow naturally.
Left Bank: 4Right Bank: 4
Seventy to 90% of the streambank surfaces covered by natural vegetation; plant variety limited to one or two species. Slight vegetative disruption evident.
Left Bank: 3Right Bank: 3
Fifty to 69% of the streambank surfaces covered by vegetation. Patches of bare soil or closely cropped vegeta-tion more common.
Left Bank: 2Right Bank: 2
Less than 50% of the streambank surfaces covered by vegetation; disruption of streambank vegetation is very common; vegetation has been cut to 2 inches or less; resembles a lawn.
Left Bank: 1Right Bank: 1
3. Bank Stability
Assess bank stability/ erosion for entire 300 ft.
Left Bank: _____________
Right Bank ____________
Total Score: ____________
Banks stable – no evidence of erosion or bank slumping (less than 5%).
Left Bank: 4Right Bank: 4
Moderately stable; infrequent, small areas of erosion mostly healed over with new vegetation evident.
Left Bank: 3Right Bank: 3
Moderately unstable; over half of banks in site have areas of erosion; high erosion potential during floods (no vegetation, steeply sloping banks).
Left Bank: 2Right Bank: 2
Unstable; many eroded areas; bare areas frequent along straight sections and bends; obvious bank collapse or failure; half to all of the bank has erosional scars.
Left Bank: 1Right Bank: 1
4. Channel Alteration
Estimate extent of channel modification for entire 300 ft.
Total Score: ____________
Stream with normal or meandering pattern. No channelization, dredging or artificial embankments (e.g., riprap).
4
Some stream straightening, artificial embankments or dams are present, (usually in area of bridge abutments) no evidence of recent channel alteration activity.
3
Artificial embankments present on both banks and more than half of stream site straightened, dredged or otherwise altered.
2
Banks shored with gabions (a fortified embankment) or concrete; over 80% of the site straightened or disrupted.
1
5. Channel Flow Status
Assess water level within stream channel for entire 300 ft.
Total Score: ____________
Water reaches base of both shorelines and a min-imal amount of channel substrate is exposed.
4
Water fills more than 75% of the channel; some channel substrate is exposed.
3
Water fills about half of the channel and/or riffle substrates are mostly exposed. Water is shallow (less than 18 inches deep).
2
Very little water in channel; banks blown out by excessive erosion and the normal flow does not reach the new shorelines.
1
Flip over for
more
6-21 Exploring Streams – Stream Monitoring Curriculum Guide
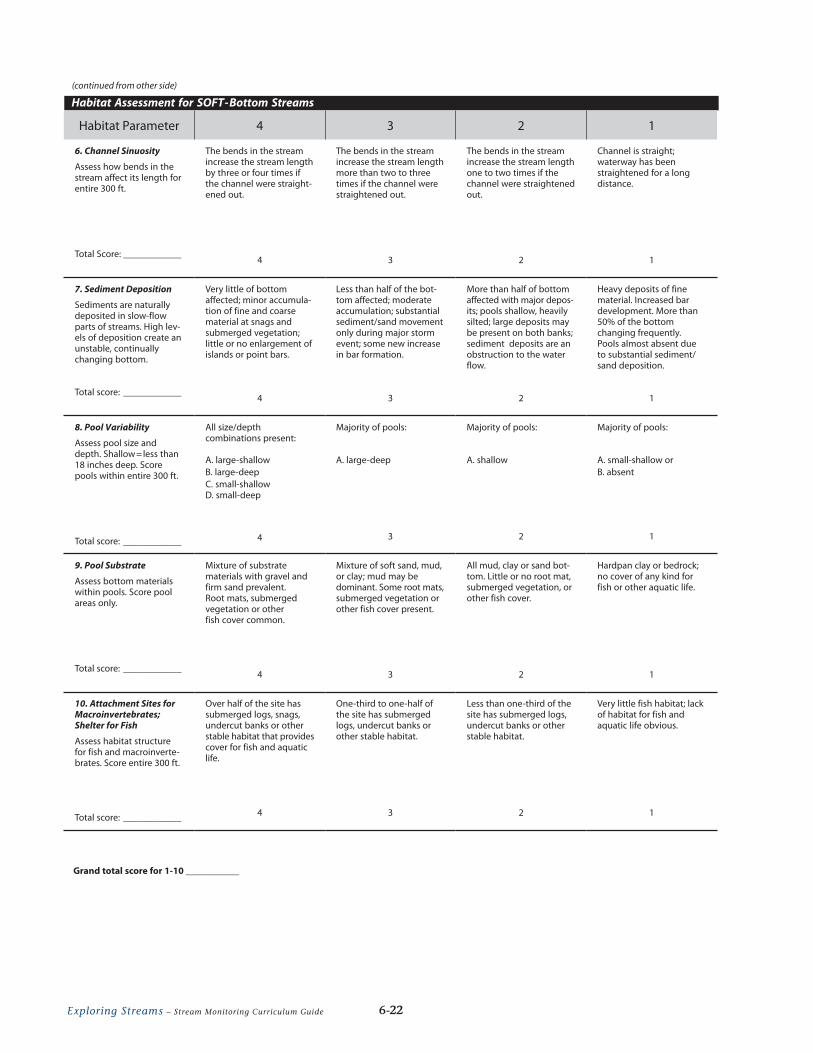
Habitat Assessment for SOFT-Bottom Streams(continued from other side)
Habitat Parameter 4 3 2 1
6. Channel Sinuosity
Assess how bends in the stream affect its length for entire 300 ft.
Total Score: ____________
The bends in the stream increase the stream length by three or four times if the channel were straight-ened out.
4
The bends in the stream increase the stream length more than two to three times if the channel were straightened out.
3
The bends in the stream increase the stream length one to two times if the channel were straightened out.
2
Channel is straight; waterway has been straightened for a long distance.
1
7. Sediment Deposition
Sediments are naturally deposited in slow-flow parts of streams. High lev-els of deposition create an unstable, continually changing bottom.
Total score: ____________
Very little of bottom affected; minor accumula-tion of fine and coarse material at snags and submerged vegetation; little or no enlargement of islands or point bars.
4
Less than half of the bot-tom affected; moderate accumulation; substantial sediment/sand movement only during major storm event; some new increase in bar formation.
3
More than half of bottom affected with major depos-its; pools shallow, heavily silted; large deposits may be present on both banks; sediment deposits are an obstruction to the water flow.
2
Heavy deposits of fine material. Increased bar development. More than 50% of the bottom changing frequently. Pools almost absent due to substantial sediment/sand deposition.
1
8. Pool Variability
Assess pool size and depth. Shallow=less than 18 inches deep. Score pools within entire 300 ft.
Total score: ____________
All size/depth combinations present:
A. large-shallowB. large-deepC. small-shallow D. small-deep
4
Majority of pools:
A. large-deep
3
Majority of pools:
A. shallow
2
Majority of pools:
A. small-shallow orB. absent
1
9. Pool Substrate
Assess bottom materials within pools. Score pool areas only.
Total score: ____________
Mixture of substrate materials with gravel and firm sand prevalent. Root mats, submerged vegetation or other fish cover common.
4
Mixture of soft sand, mud, or clay; mud may be dominant. Some root mats, submerged vegetation or other fish cover present.
3
All mud, clay or sand bot-tom. Little or no root mat, submerged vegetation, or other fish cover.
2
Hardpan clay or bedrock; no cover of any kind for fish or other aquatic life.
1
10. Attachment Sites for Macroinvertebrates; Shelter for Fish
Assess habitat structure for fish and macroinverte-brates. Score entire 300 ft.
Total score: ____________
Over half of the site has submerged logs, snags, undercut banks or other stable habitat that provides cover for fish and aquatic life.
4
One-third to one-half of the site has submerged logs, undercut banks or other stable habitat.
3
Less than one-third of the site has submerged logs, undercut banks or other stable habitat.
2
Very little fish habitat; lack of habitat for fish and aquatic life obvious.
1
Grand total score for 1-10 ___________
6-22 Exploring Streams – Stream Monitoring Curriculum Guide
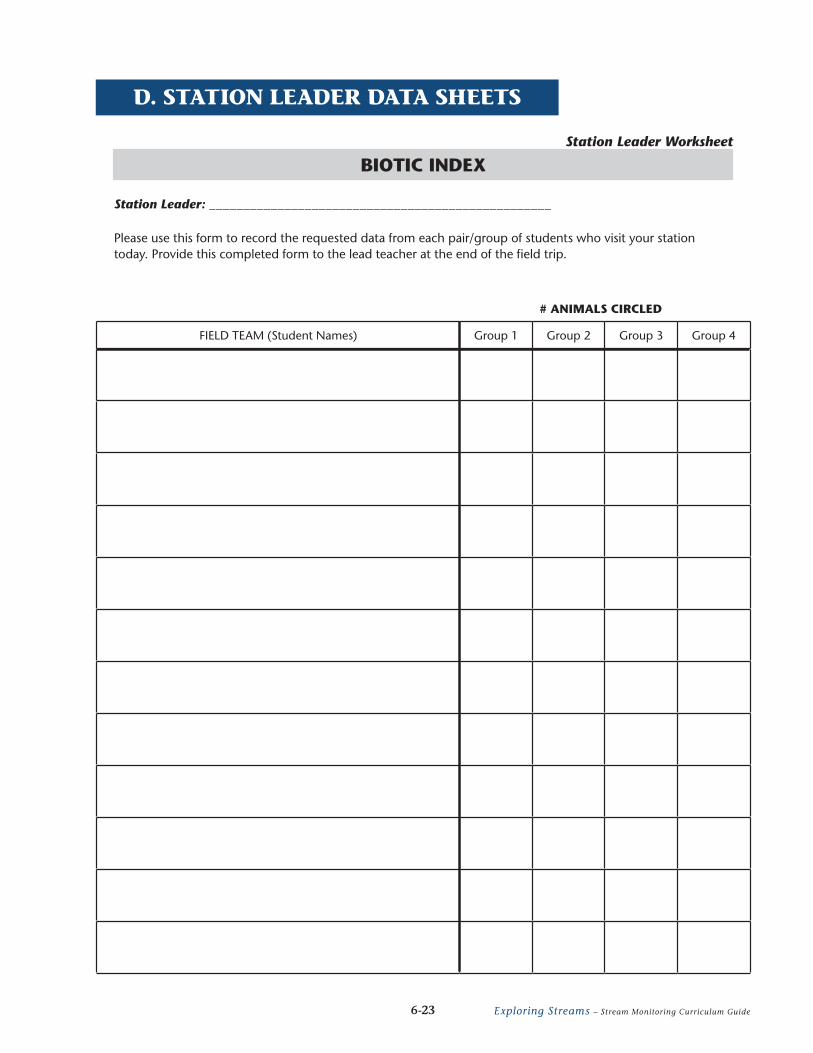
D. STATION LEADER DATA SHEETS
BIOTIC INDEXStation Leader Worksheet
Please use this form to record the requested data from each pair/group of students who visit your station today. Provide this completed form to the lead teacher at the end of the field trip.
Station Leader: __________________________________________________
FIELD TEAM (Student Names) Group 1 Group 2 Group 3 Group 4
# ANIMALS CIRCLED
6-23 Exploring Streams – Stream Monitoring Curriculum Guide
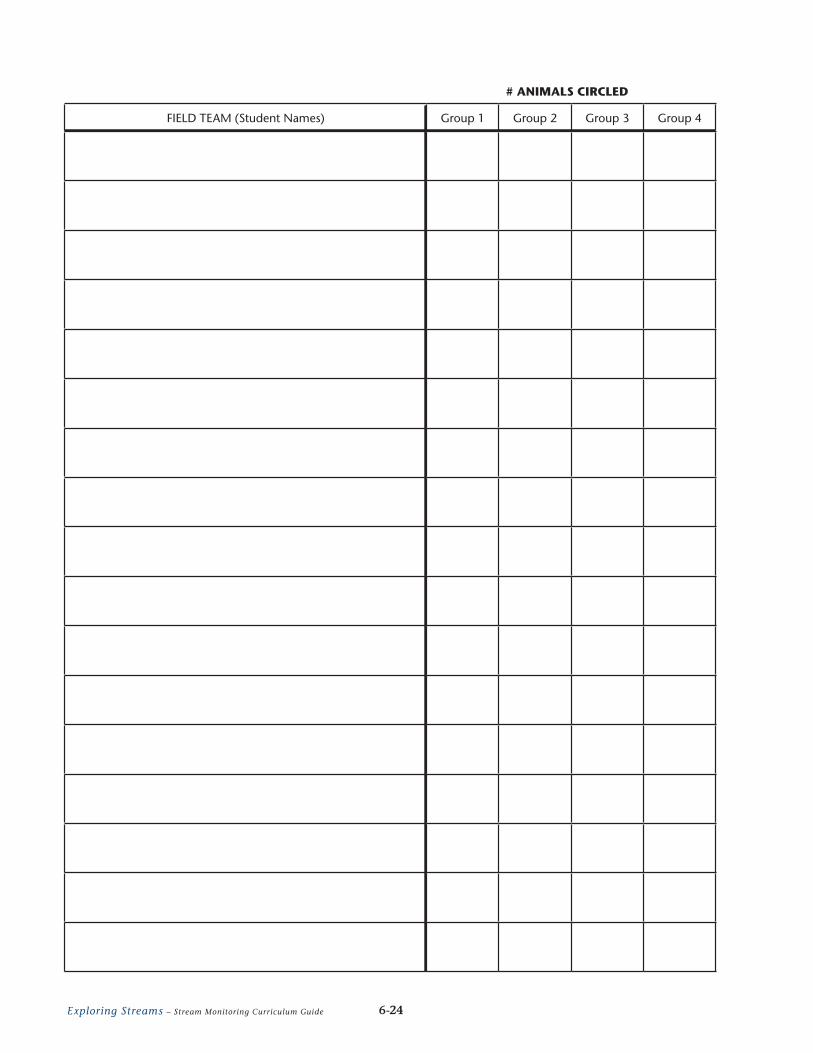
FIELD TEAM (Student Names) Group 1 Group 2 Group 3 Group 4
# ANIMALS CIRCLED
6-24 Exploring Streams – Stream Monitoring Curriculum Guide
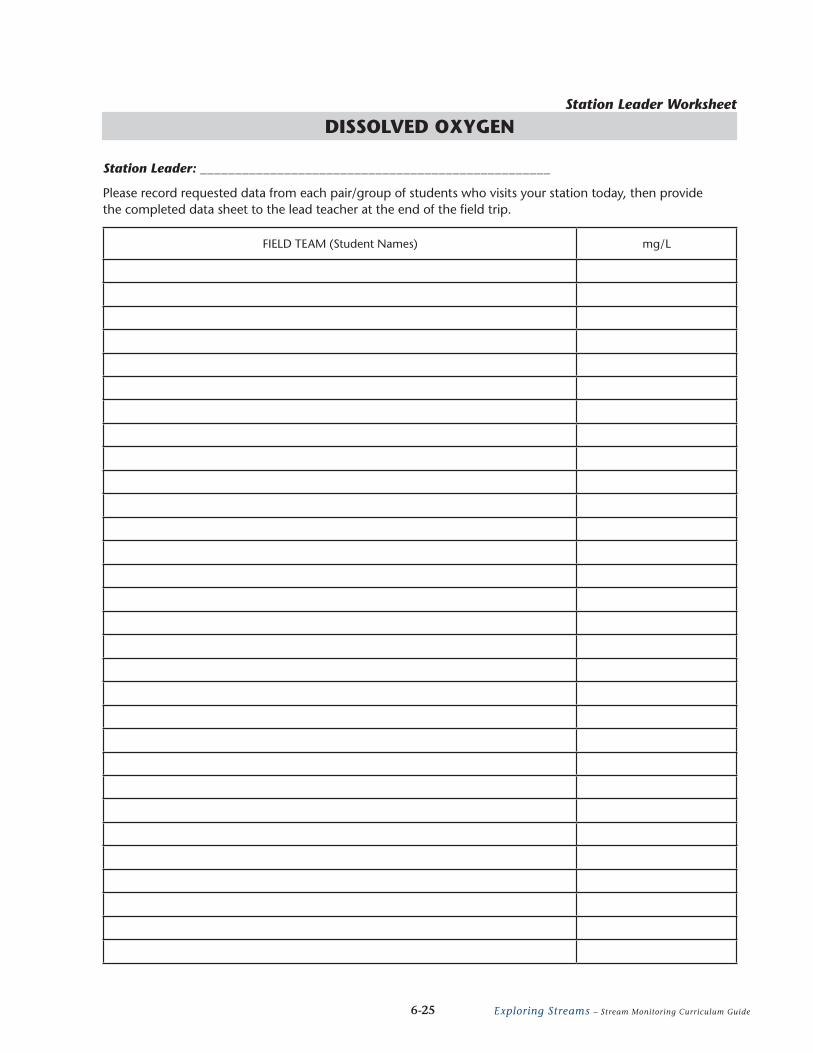
DISSOLVED OXYGENStation Leader Worksheet
Please record requested data from each pair/group of students who visits your station today, then provide the completed data sheet to the lead teacher at the end of the field trip.
Station Leader: __________________________________________________
FIELD TEAM (Student Names) mg/L
6-25 Exploring Streams – Stream Monitoring Curriculum Guide
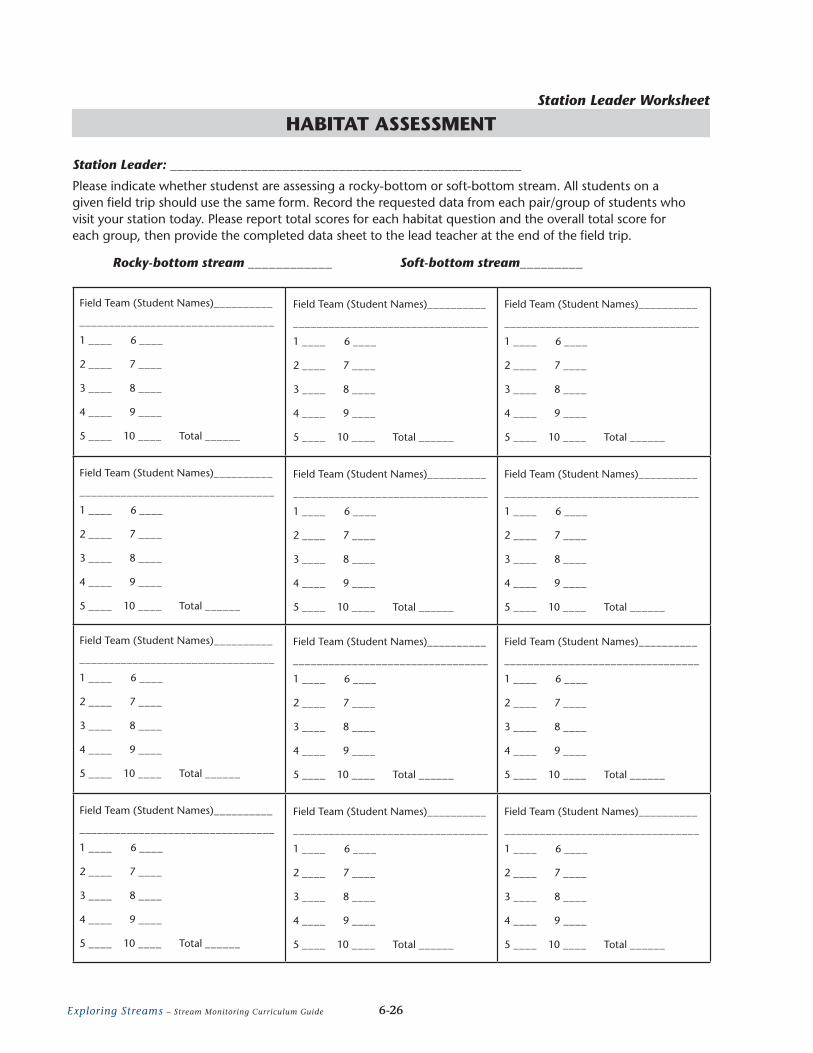
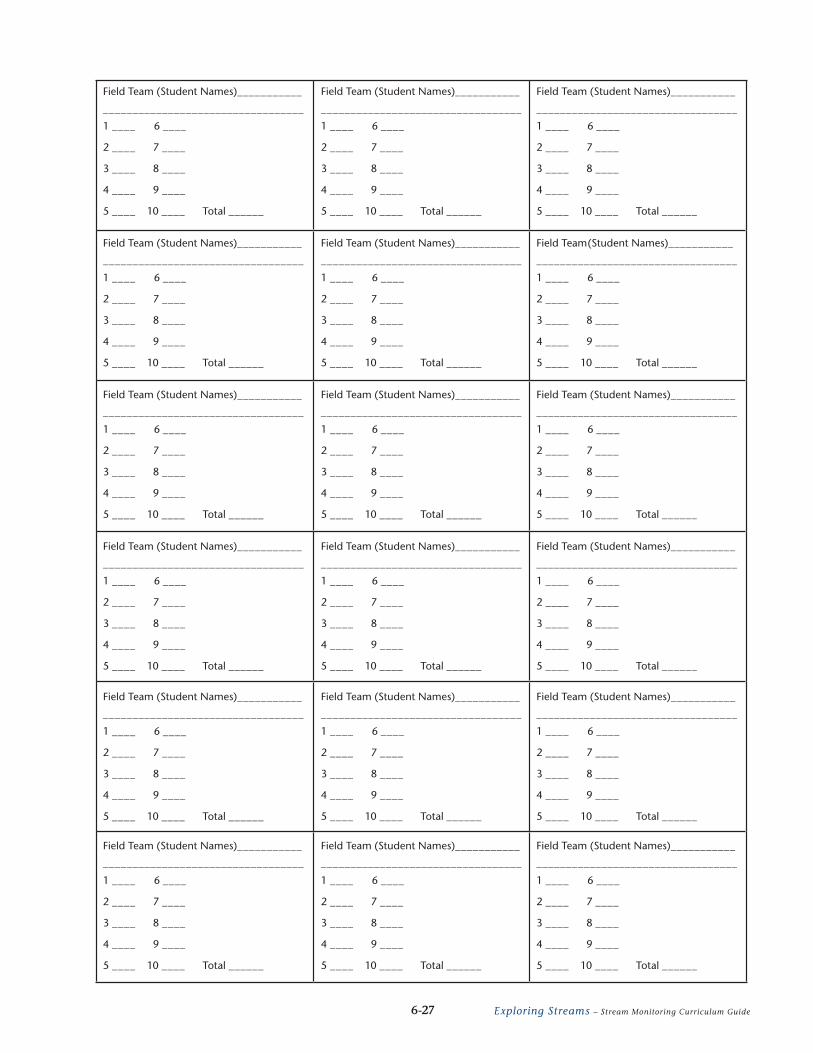
HABITAT ASSESSMENTStation Leader Worksheet
Please indicate whether studenst are assessing a rocky-bottom or soft-bottom stream. All students on a given field trip should use the same form. Record the requested data from each pair/group of students who visit your station today. Please report total scores for each habitat question and the overall total score for each group, then provide the completed data sheet to the lead teacher at the end of the field trip.
Station Leader: __________________________________________________
Rocky-bottom stream ____________ Soft-bottom stream_________
Field Team (Student Names)__________
_________________________________
1 ____ 6 ____
2 ____ 7 ____
3 ____ 8 ____
4 ____ 9 ____
5 ____ 10 ____ Total ______
Field Team (Student Names)__________
_________________________________
1 ____ 6 ____
2 ____ 7 ____
3 ____ 8 ____
4 ____ 9 ____
5 ____ 10 ____ Total ______
Field Team (Student Names)__________
_________________________________
1 ____ 6 ____
2 ____ 7 ____
3 ____ 8 ____
4 ____ 9 ____
5 ____ 10 ____ Total ______
Field Team (Student Names)__________
_________________________________
1 ____ 6 ____
2 ____ 7 ____
3 ____ 8 ____
4 ____ 9 ____
5 ____ 10 ____ Total ______
Field Team (Student Names)__________
_________________________________
1 ____ 6 ____
2 ____ 7 ____
3 ____ 8 ____
4 ____ 9 ____
5 ____ 10 ____ Total ______
Field Team (Student Names)__________
_________________________________
1 ____ 6 ____
2 ____ 7 ____
3 ____ 8 ____
4 ____ 9 ____
5 ____ 10 ____ Total ______
Field Team (Student Names)__________
_________________________________
1 ____ 6 ____
2 ____ 7 ____
3 ____ 8 ____
4 ____ 9 ____
5 ____ 10 ____ Total ______
Field Team (Student Names)__________
_________________________________
1 ____ 6 ____
2 ____ 7 ____
3 ____ 8 ____
4 ____ 9 ____
5 ____ 10 ____ Total ______
Field Team (Student Names)__________
_________________________________
1 ____ 6 ____
2 ____ 7 ____
3 ____ 8 ____
4 ____ 9 ____
5 ____ 10 ____ Total ______
Field Team (Student Names)__________
_________________________________
1 ____ 6 ____
2 ____ 7 ____
3 ____ 8 ____
4 ____ 9 ____
5 ____ 10 ____ Total ______
Field Team (Student Names)__________
_________________________________
1 ____ 6 ____
2 ____ 7 ____
3 ____ 8 ____
4 ____ 9 ____
5 ____ 10 ____ Total ______
Field Team (Student Names)__________
_________________________________
1 ____ 6 ____
2 ____ 7 ____
3 ____ 8 ____
4 ____ 9 ____
5 ____ 10 ____ Total ______
6-26 Exploring Streams – Stream Monitoring Curriculum Guide
Field Team (Student Names)___________
__________________________________
1 ____ 6 ____
2 ____ 7 ____
3 ____ 8 ____
4 ____ 9 ____
5 ____ 10 ____ Total ______
Field Team (Student Names)___________
__________________________________
1 ____ 6 ____
2 ____ 7 ____
3 ____ 8 ____
4 ____ 9 ____
5 ____ 10 ____ Total ______
Field Team (Student Names)___________
__________________________________
1 ____ 6 ____
2 ____ 7 ____
3 ____ 8 ____
4 ____ 9 ____
5 ____ 10 ____ Total ______
Field Team (Student Names)___________
__________________________________
1 ____ 6 ____
2 ____ 7 ____
3 ____ 8 ____
4 ____ 9 ____
5 ____ 10 ____ Total ______
Field Team (Student Names)___________
__________________________________
1 ____ 6 ____
2 ____ 7 ____
3 ____ 8 ____
4 ____ 9 ____
5 ____ 10 ____ Total ______
Field Team (Student Names)___________
__________________________________
1 ____ 6 ____
2 ____ 7 ____
3 ____ 8 ____
4 ____ 9 ____
5 ____ 10 ____ Total ______
Field Team (Student Names)___________
__________________________________
1 ____ 6 ____
2 ____ 7 ____
3 ____ 8 ____
4 ____ 9 ____
5 ____ 10 ____ Total ______
Field Team (Student Names)___________
__________________________________
1 ____ 6 ____
2 ____ 7 ____
3 ____ 8 ____
4 ____ 9 ____
5 ____ 10 ____ Total ______
Field Team (Student Names)___________
__________________________________
1 ____ 6 ____
2 ____ 7 ____
3 ____ 8 ____
4 ____ 9 ____
5 ____ 10 ____ Total ______
Field Team (Student Names)___________
__________________________________
1 ____ 6 ____
2 ____ 7 ____
3 ____ 8 ____
4 ____ 9 ____
5 ____ 10 ____ Total ______
Field Team (Student Names)___________
__________________________________
1 ____ 6 ____
2 ____ 7 ____
3 ____ 8 ____
4 ____ 9 ____
5 ____ 10 ____ Total ______
Field Team (Student Names)___________
__________________________________
1 ____ 6 ____
2 ____ 7 ____
3 ____ 8 ____
4 ____ 9 ____
5 ____ 10 ____ Total ______
Field Team (Student Names)___________
__________________________________
1 ____ 6 ____
2 ____ 7 ____
3 ____ 8 ____
4 ____ 9 ____
5 ____ 10 ____ Total ______
Field Team(Student Names)___________
__________________________________
1 ____ 6 ____
2 ____ 7 ____
3 ____ 8 ____
4 ____ 9 ____
5 ____ 10 ____ Total ______
Field Team (Student Names)___________
__________________________________
1 ____ 6 ____
2 ____ 7 ____
3 ____ 8 ____
4 ____ 9 ____
5 ____ 10 ____ Total ______
Field Team (Student Names)___________
__________________________________
1 ____ 6 ____
2 ____ 7 ____
3 ____ 8 ____
4 ____ 9 ____
5 ____ 10 ____ Total ______
Field Team (Student Names)___________
__________________________________
1 ____ 6 ____
2 ____ 7 ____
3 ____ 8 ____
4 ____ 9 ____
5 ____ 10 ____ Total ______
Field Team (Student Names)___________
__________________________________
1 ____ 6 ____
2 ____ 7 ____
3 ____ 8 ____
4 ____ 9 ____
5 ____ 10 ____ Total ______
6-27 Exploring Streams – Stream Monitoring Curriculum Guide
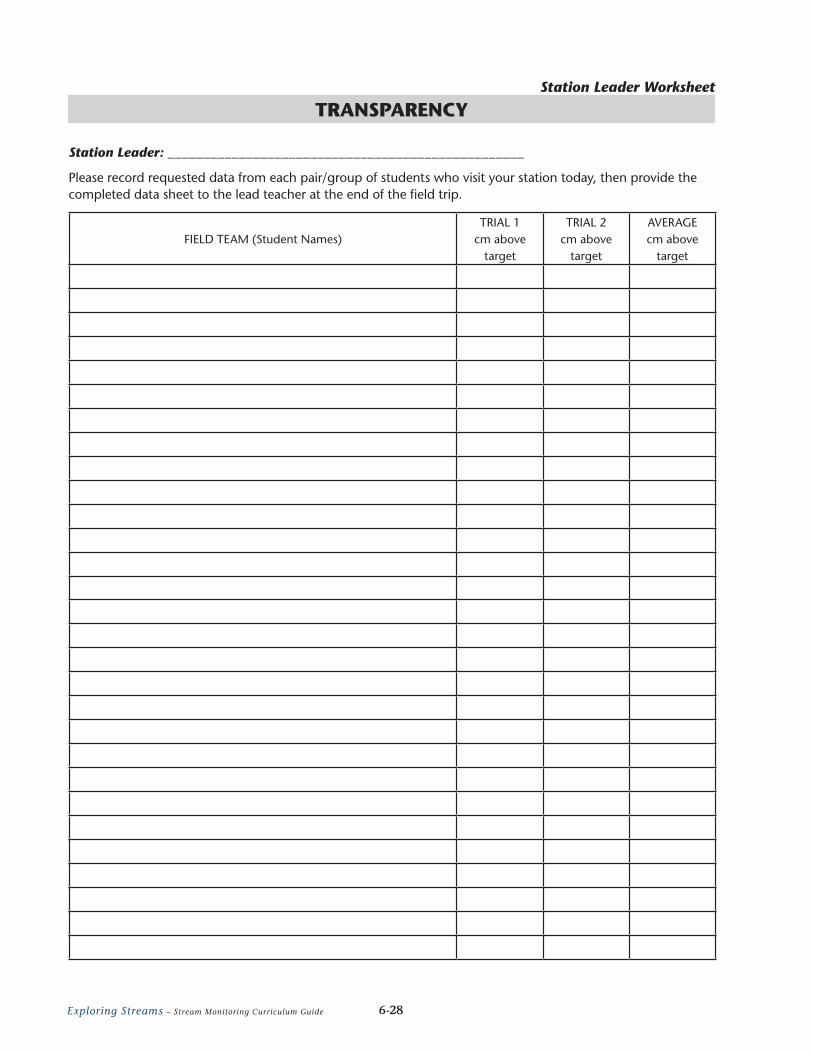
TRANSPARENCYStation Leader Worksheet
Please record requested data from each pair/group of students who visit your station today, then provide the completed data sheet to the lead teacher at the end of the field trip.
Station Leader: __________________________________________________
FIELD TEAM (Student Names)TRIAL 1
cm above target
TRIAL 2 cm above
target
AVERAGE cm above
target
6-28 Exploring Streams – Stream Monitoring Curriculum Guide
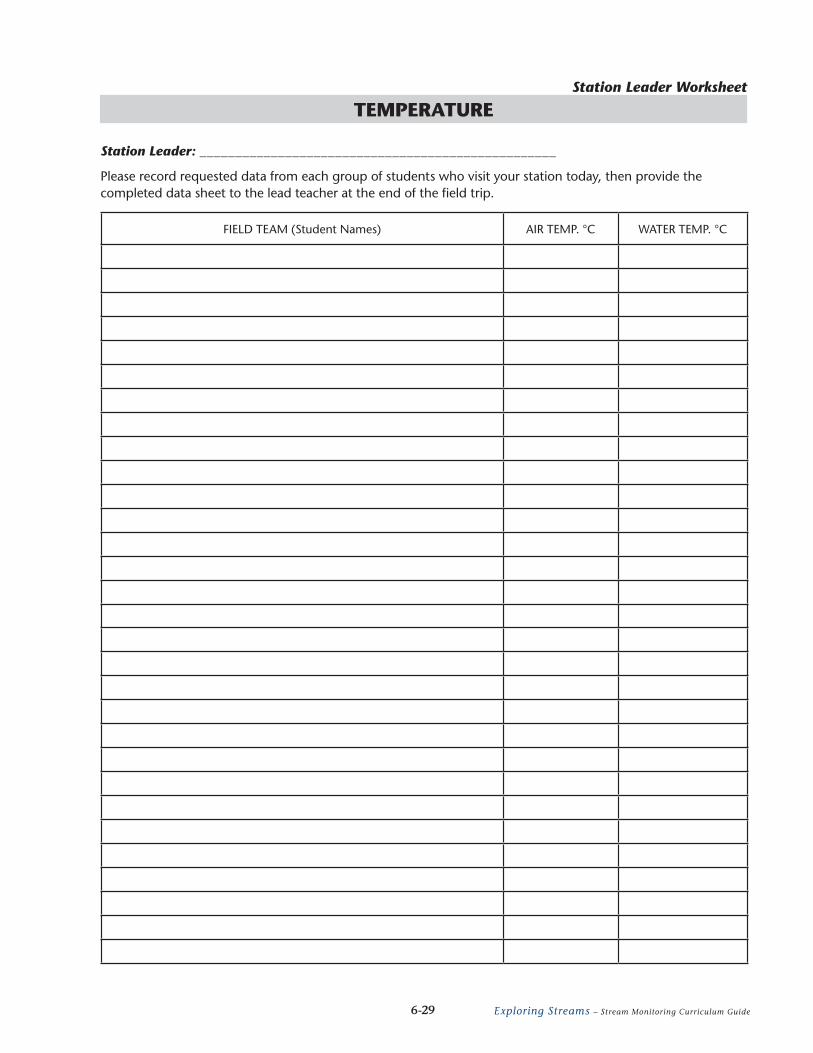
TEMPERATUREStation Leader Worksheet
Please record requested data from each group of students who visit your station today, then provide the completed data sheet to the lead teacher at the end of the field trip.
Station Leader: __________________________________________________
FIELD TEAM (Student Names) AIR TEMP. °C WATER TEMP. °C
6-29 Exploring Streams – Stream Monitoring Curriculum Guide
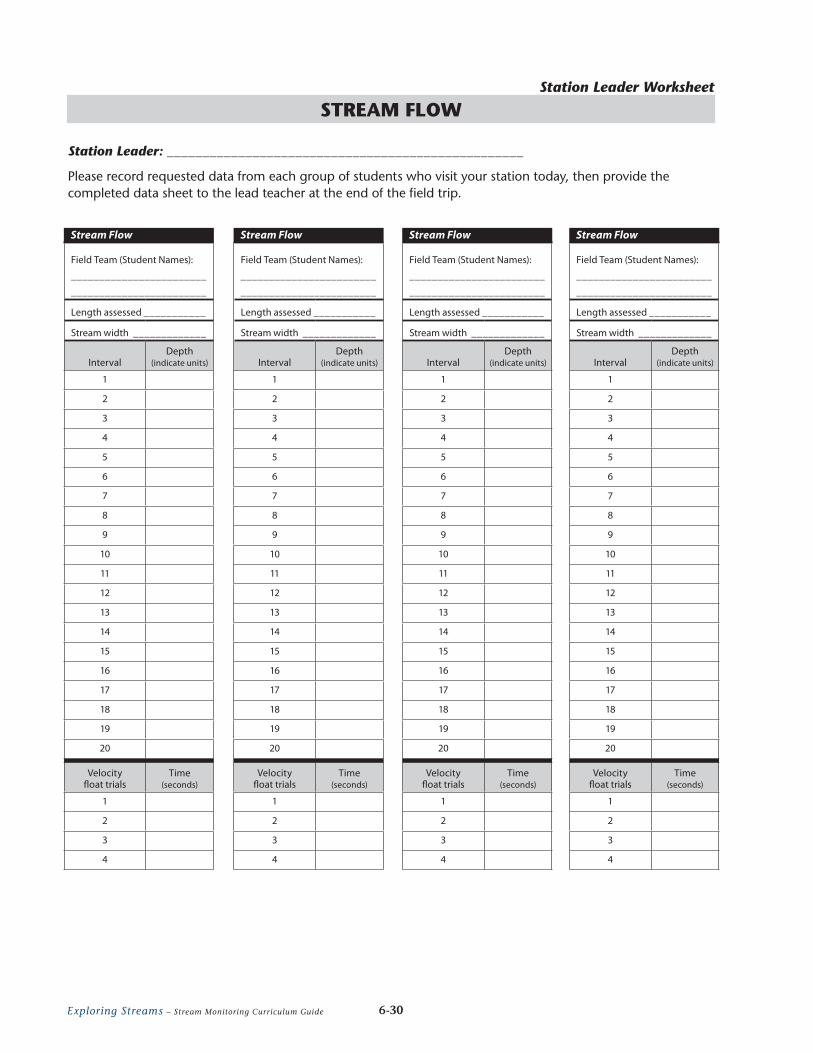
STREAM FLOWStation Leader Worksheet
Please record requested data from each group of students who visit your station today, then provide the completed data sheet to the lead teacher at the end of the field trip.
Station Leader: __________________________________________________
Field Team (Student Names):
________________________
________________________
Length assessed ___________
Stream width _____________
IntervalDepth
(indicate units)
1
2
3
4
5
6
7
8
9
10
11
12
13
14
15
16
17
18
19
20
Velocity float trials
Time (seconds)
1
2
3
4
Stream Flow
Field Team (Student Names):
________________________
________________________
Length assessed ___________
Stream width _____________
IntervalDepth
(indicate units)
1
2
3
4
5
6
7
8
9
10
11
12
13
14
15
16
17
18
19
20
Velocity float trials
Time (seconds)
1
2
3
4
Stream Flow
Field Team (Student Names):
________________________
________________________
Length assessed ___________
Stream width _____________
IntervalDepth
(indicate units)
1
2
3
4
5
6
7
8
9
10
11
12
13
14
15
16
17
18
19
20
Velocity float trials
Time (seconds)
1
2
3
4
Stream Flow
Field Team (Student Names):
________________________
________________________
Length assessed ___________
Stream width _____________
IntervalDepth
(indicate units)
1
2
3
4
5
6
7
8
9
10
11
12
13
14
15
16
17
18
19
20
Velocity float trials
Time (seconds)
1
2
3
4
Stream Flow
6-30 Exploring Streams – Stream Monitoring Curriculum Guide
Field Team (Student Names):
________________________
________________________
Length assessed ___________
Stream width _____________
IntervalDepth
(indicate units)
1
2
3
4
5
6
7
8
9
10
11
12
13
14
15
16
17
18
19
20
Velocity float trials
Time (seconds)
1
2
3
4
Stream Flow
Field Team (Student Names):
________________________
________________________
Length assessed ___________
Stream width _____________
IntervalDepth
(indicate units)
1
2
3
4
5
6
7
8
9
10
11
12
13
14
15
16
17
18
19
20
Velocity float trials
Time (seconds)
1
2
3
4
Stream Flow
Field Team (Student Names):
________________________
________________________
Length assessed ___________
Stream width _____________
IntervalDepth
(indicate units)
1
2
3
4
5
6
7
8
9
10
11
12
13
14
15
16
17
18
19
20
Velocity float trials
Time (seconds)
1
2
3
4
Stream Flow
Field Team (Student Names):
________________________
________________________
Length assessed ___________
Stream width _____________
IntervalDepth
(indicate units)
1
2
3
4
5
6
7
8
9
10
11
12
13
14
15
16
17
18
19
20
Velocity float trials
Time (seconds)
1
2
3
4
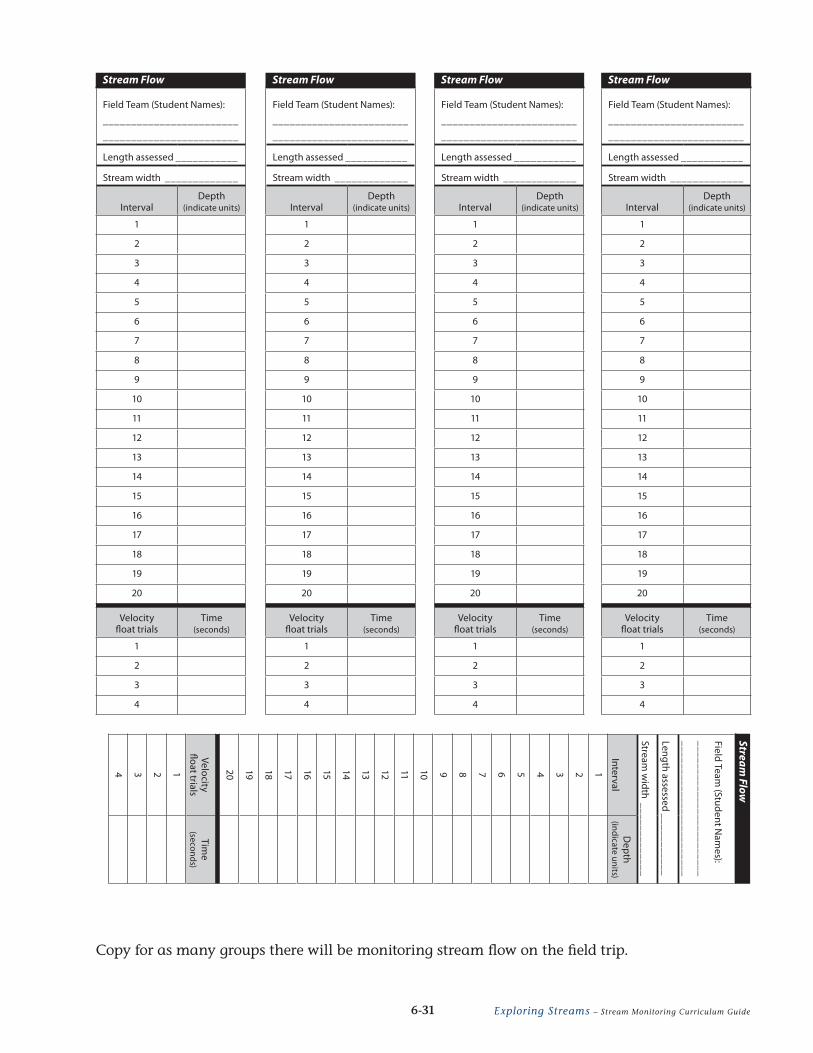
Stream FlowField Team
(Student Nam
es):
________________________
________________________
Length assessed ___________
Stream w
idth _____________
IntervalD
epth (indicate units)
1234567891011121314151617181920
Velocity float trials
Time
(seconds)
1234
Stream Flow
Copy for as many groups there will be monitoring stream flow on the field trip.
6-31 Exploring Streams – Stream Monitoring Curriculum Guide