Embed Size (px)
Citation preview
2014 New York State Hazard Mitigation Plan Earthquake
3.7-1 Final Release Date January 4, 2014
Section 3.7: Earthquake
2014 SHMP Update
Expanded characteristics section Restructured section format Updated data, maps, case studies Applied new numbering system to hazard profile Added local plan vulnerability table listed by counties
3.7.1 Earthquake Profile An earthquake follows sudden movements in the Earth that are caused by abrupt releases of seismic energy accumulated over long periods of time. Forces from plate tectonics help shape the Earth’s surface, and when unexpected slips along fault lines occur, changes in the Earth create jolts below the surface causing ground shaking activity. The massive plates slowly move over, under, and past each other at gradual rates. However, sometimes the plates lock together and are unable to release the accumulating energy. When the accumulated energy grows strong enough, the plates break free, thus, producing an earthquake. The seismic waves caused by earthquakes can potentially destroy buildings, infrastructure, and cause loss of life. Aftershocks, which follow mainshocks, are normally smaller and can continue for a period of weeks, months, or years after the initial shock hits. In addition to creating ground acceleration, earthquakes can trigger surface faulting, volcanic activity, tsunamis, landslides, and liquefaction depending on the conditions.
2014 New York State Hazard Mitigation Plan Earthquake
3.7-2 Final Release Date January 4, 2014
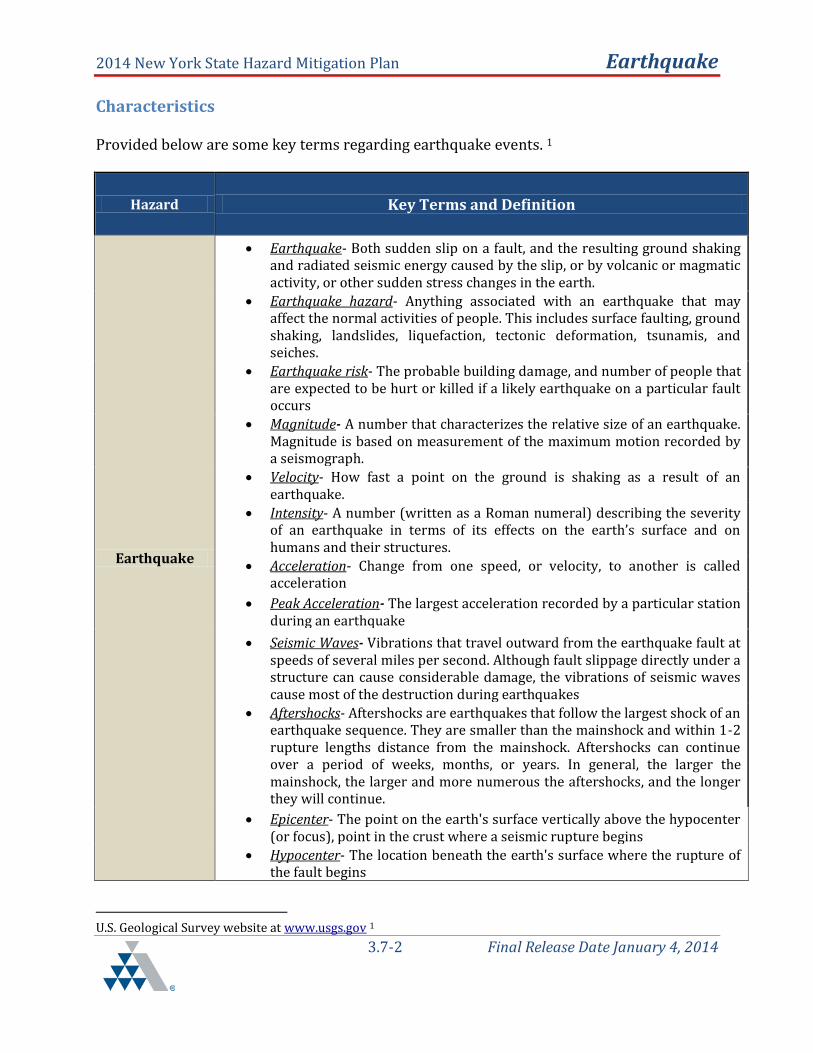
Characteristics Provided below are some key terms regarding earthquake events. 1
Hazard Key Terms and Definition
Earthquake
Earthquake- Both sudden slip on a fault, and the resulting ground shaking and radiated seismic energy caused by the slip, or by volcanic or magmatic activity, or other sudden stress changes in the earth.
Earthquake hazard- Anything associated with an earthquake that may affect the normal activities of people. This includes surface faulting, ground shaking, landslides, liquefaction, tectonic deformation, tsunamis, and seiches.
Earthquake risk- The probable building damage, and number of people that are expected to be hurt or killed if a likely earthquake on a particular fault occurs
Magnitude- A number that characterizes the relative size of an earthquake. Magnitude is based on measurement of the maximum motion recorded by a seismograph.
Velocity- How fast a point on the ground is shaking as a result of an earthquake.
Intensity- A number (written as a Roman numeral) describing the severity of an earthquake in terms of its effects on the earth’s surface and on humans and their structures.
Acceleration- Change from one speed, or velocity, to another is called acceleration
Peak Acceleration- The largest acceleration recorded by a particular station during an earthquake
Seismic Waves- Vibrations that travel outward from the earthquake fault at speeds of several miles per second. Although fault slippage directly under a structure can cause considerable damage, the vibrations of seismic waves cause most of the destruction during earthquakes
Aftershocks- Aftershocks are earthquakes that follow the largest shock of an earthquake sequence. They are smaller than the mainshock and within 1-2 rupture lengths distance from the mainshock. Aftershocks can continue over a period of weeks, months, or years. In general, the larger the mainshock, the larger and more numerous the aftershocks, and the longer they will continue.
Epicenter- The point on the earth's surface vertically above the hypocenter (or focus), point in the crust where a seismic rupture begins
Hypocenter- The location beneath the earth's surface where the rupture of the fault begins
U.S. Geological Survey website at www.usgs.gov 1

2014 New York State Hazard Mitigation Plan Earthquake
3.7-3 Final Release Date January 4, 2014
Fault- A fault is a fracture along which the blocks of crust on either side have moved relative to one another parallel to the fracture.
Seiche- The sloshing of a closed body of water from earthquake shaking.
Source: USGS/ FEMA
Earthquake intensity and classification are commonly measured using two different scales, the Maximum Modified Mercalli Intensity Scale (MMI) and the Richter Magnitude Scale (often shortened to Richter Scale). The MMI Scale estimates the shaking strength of an earthquake at a specific location, such as the epicenter, or over a specific area by considering its effects on people, objects, and buildings. The strength reduces as the distance from the epicenter increases2. The Richter scale uses whole numbers and decimal fractions to quantify the energy released during an earthquake. This determination is based on logarithms from the amplitude of waves recorded by seismographs3. Table 3.7a, found below, provides ranking and classification definitions for the two scales. Table 3.7a: Modified Mercalli Scale vs. Richter Scale
Source: http://www.sms-tsunami-warning.com/pages/mercalli-scale
2http://quake.abag.ca.gov/shaking/mmi/ 3 http://earthquake.usgs.gov/learn/glossary/?term=Richter scale
2014 New York State Hazard Mitigation Plan Earthquake
3.7-4 Final Release Date January 4, 2014
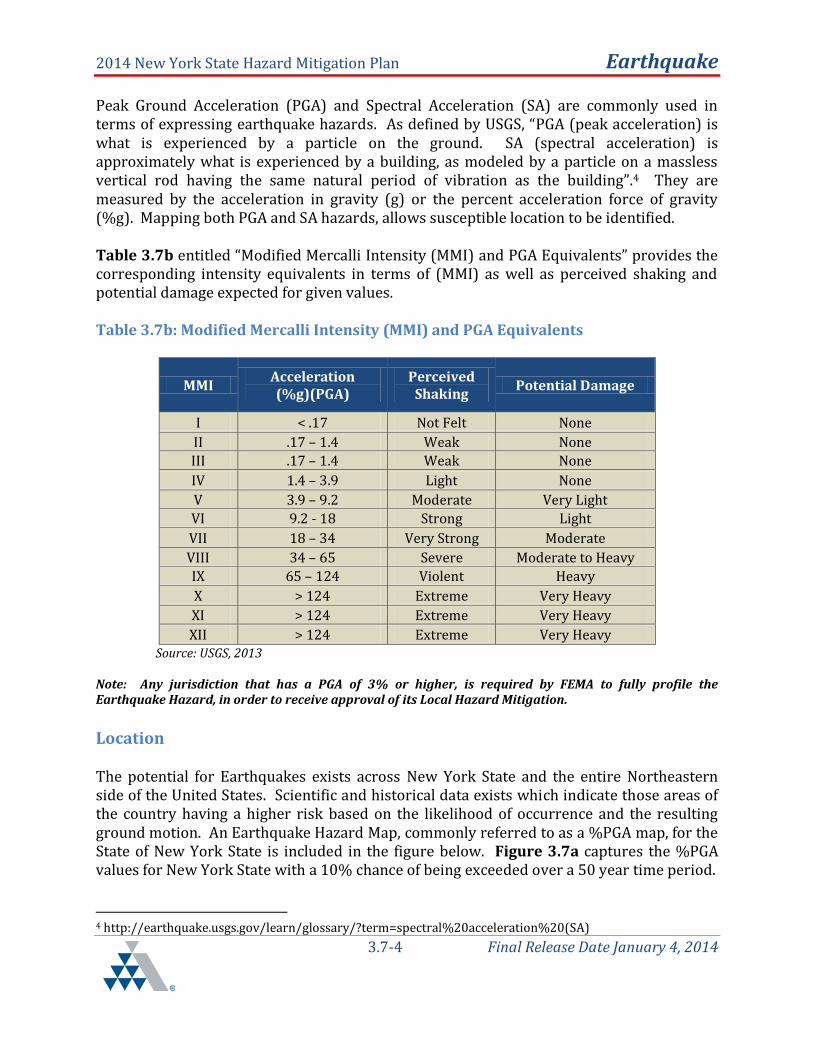
Peak Ground Acceleration (PGA) and Spectral Acceleration (SA) are commonly used in terms of expressing earthquake hazards. As defined by USGS, “PGA (peak acceleration) is what is experienced by a particle on the ground. SA (spectral acceleration) is approximately what is experienced by a building, as modeled by a particle on a massless vertical rod having the same natural period of vibration as the building”.4 They are measured by the acceleration in gravity (g) or the percent acceleration force of gravity (%g). Mapping both PGA and SA hazards, allows susceptible location to be identified. Table 3.7b entitled “Modified Mercalli Intensity (MMI) and PGA Equivalents” provides the corresponding intensity equivalents in terms of (MMI) as well as perceived shaking and potential damage expected for given values. Table 3.7b: Modified Mercalli Intensity (MMI) and PGA Equivalents
MMI Acceleration (%g)(PGA)
Perceived Shaking
Potential Damage
I < .17 Not Felt None
II .17 – 1.4 Weak None
III .17 – 1.4 Weak None
IV 1.4 – 3.9 Light None
V 3.9 – 9.2 Moderate Very Light
VI 9.2 - 18 Strong Light
VII 18 – 34 Very Strong Moderate
VIII 34 – 65 Severe Moderate to Heavy
IX 65 – 124 Violent Heavy
X > 124 Extreme Very Heavy
XI > 124 Extreme Very Heavy
XII > 124 Extreme Very Heavy Source: USGS, 2013
Note: Any jurisdiction that has a PGA of 3% or higher, is required by FEMA to fully profile the Earthquake Hazard, in order to receive approval of its Local Hazard Mitigation.
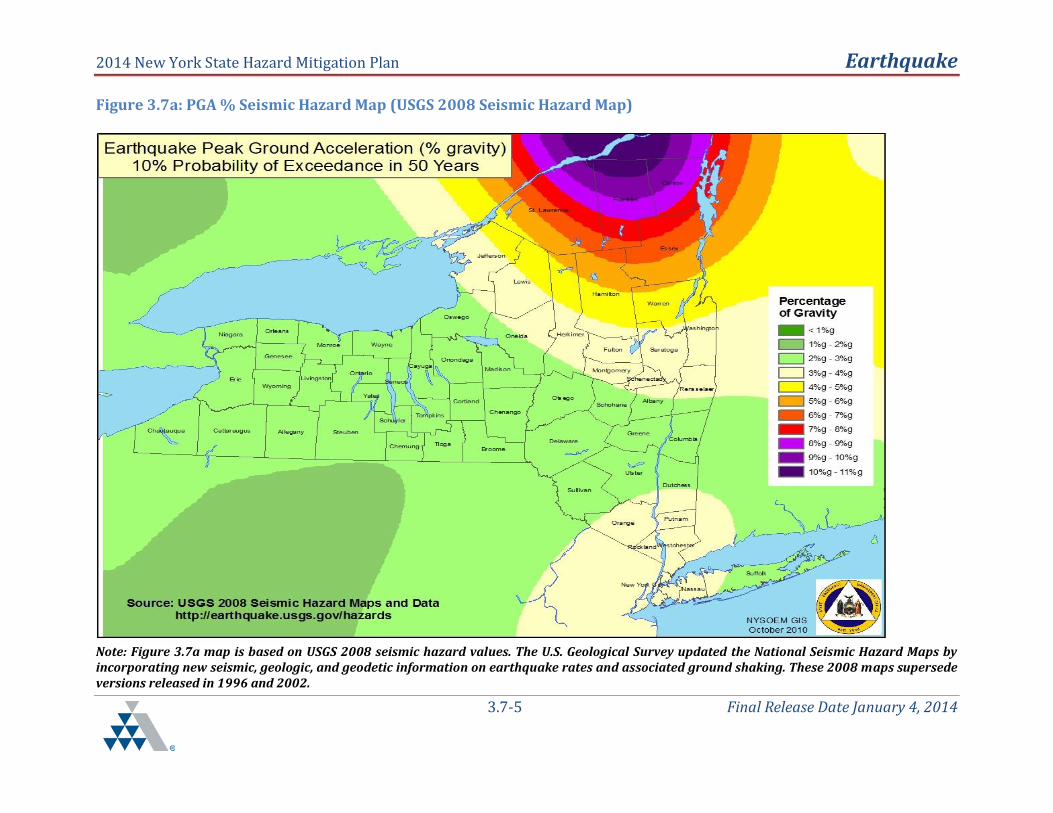
Location The potential for Earthquakes exists across New York State and the entire Northeastern side of the United States. Scientific and historical data exists which indicate those areas of the country having a higher risk based on the likelihood of occurrence and the resulting ground motion. An Earthquake Hazard Map, commonly referred to as a %PGA map, for the State of New York State is included in the figure below. Figure 3.7a captures the %PGA values for New York State with a 10% chance of being exceeded over a 50 year time period.
4 http://earthquake.usgs.gov/learn/glossary/?term=spectral%20acceleration%20(SA)
2014 New York State Hazard Mitigation Plan Earthquake
3.7-5 Final Release Date January 4, 2014
Figure 3.7a: PGA % Seismic Hazard Map (USGS 2008 Seismic Hazard Map)
Note: Figure 3.7a map is based on USGS 2008 seismic hazard values. The U.S. Geological Survey updated the National Seismic Hazard Maps by incorporating new seismic, geologic, and geodetic information on earthquake rates and associated ground shaking. These 2008 maps supersede versions released in 1996 and 2002.

2014 New York State Hazard Mitigation Plan Earthquake
3.7-6 Final Release Date January 4, 2014
Figure 3.7a indicates general regions that have seismic risks that tend to be higher. Those regions include; The North and Northeast third (1/3) of NYS (The North Country/Adirondack Region including a portion of the Greater Albany-Saratoga region). In the USGS 2008 Seismic Hazard Map there was a notable shift in seismic risk as compared to the 2002 mapping. In the 2002 map, the Southeast corner (including the greater NYC area and western Long Island), as well as the Northwest corner (including the City of Buffalo and vicinity) of NY State were also once at risk however no longer pose a threat. An in depth analysis on measuring %PGA located in the Data Appendix-Earthquake Section of the 2014 Update features the case study, “New York State Earthquake Probability That Factors the Effect of Local Soil Conditions: Adjusted USGS 0.2 Second Spectral Acceleration (SA) with 2% Probability of Exceedance in 50 Years”. This study includes maps extracted from the 2011 Hazard Mitigation Plan that displays county level earthquake hazard maps that factor soil conditions. The inclusion of these maps from the 2011 Hazard Mitigation Plan serves as a resource for local planning, and to demonstrate the type of analysis that can be done at the local level. For the sake of the 2014 Hazard Mitigation Plan update, a detailed adjusted spectral acceleration map for each individual county was not completed; however updated and aggregated mapping was done at the state level. A sampling of this case study (Figure 3.7b, 3.7c) was used below to assist with explaining the overlaid mapping feature to determine the NEHRP Soil Classification map used in Figure 3.7a. This classification of the State’s surficial geologic materials by NEHRP soil site class has enabled the effect of soils to be factored with the USGS seismic hazard maps to give an adjusted, more regionally refined picture, of the State’s earthquake hazard based. The level of adjustment to USGS map is based on use of the NEHRP’s soil site coefficients for each soil class, which varies according to the USGS mapped accelerations. The reference for the appropriate coefficient is found in “The 2003 NEHRP Recommended Provisions for New Building and Other Structures – Part: Provisions (FEMA 450). These coefficients provide the level of increase or decrease to the USGS’s seismic hazard map spectral accelerations. See Figure 3.7b below.

2014 New York State Hazard Mitigation Plan Earthquake
3.7-7 Final Release Date January 4, 2014
Figure 3.7b: The 2003 NEHRP Recommended Provisions for New Building and Other Structures
A review of the adjusted maps that factor soil conditions will show some areas of the state with a significantly higher hazard than is shown on the USGS map. A special note for building officials, this analysis is to be used for hazard modeling not construction design.
2014 New York State Hazard Mitigation Plan Earthquake
3.7-8 Final Release Date January 4, 2014
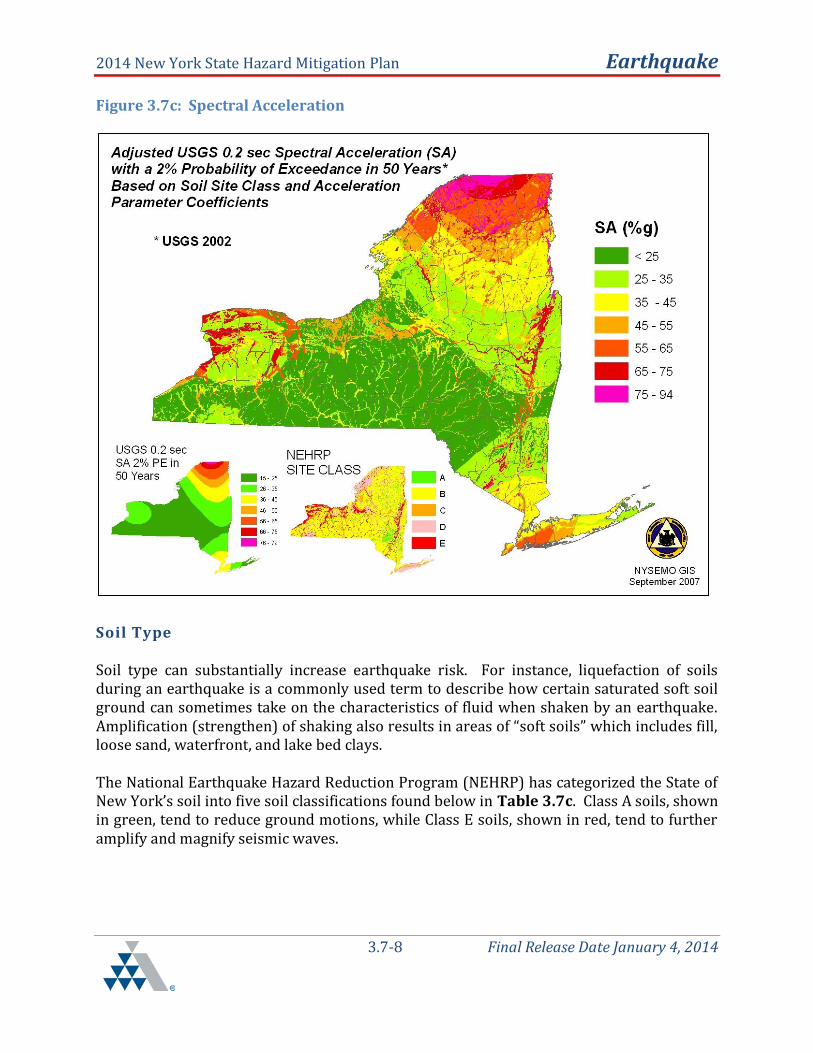
Figure 3.7c: Spectral Acceleration
Soil Type Soil type can substantially increase earthquake risk. For instance, liquefaction of soils during an earthquake is a commonly used term to describe how certain saturated soft soil ground can sometimes take on the characteristics of fluid when shaken by an earthquake. Amplification (strengthen) of shaking also results in areas of “soft soils” which includes fill, loose sand, waterfront, and lake bed clays. The National Earthquake Hazard Reduction Program (NEHRP) has categorized the State of New York’s soil into five soil classifications found below in Table 3.7c. Class A soils, shown in green, tend to reduce ground motions, while Class E soils, shown in red, tend to further amplify and magnify seismic waves.
2014 New York State Hazard Mitigation Plan Earthquake
3.7-9 Final Release Date January 4, 2014
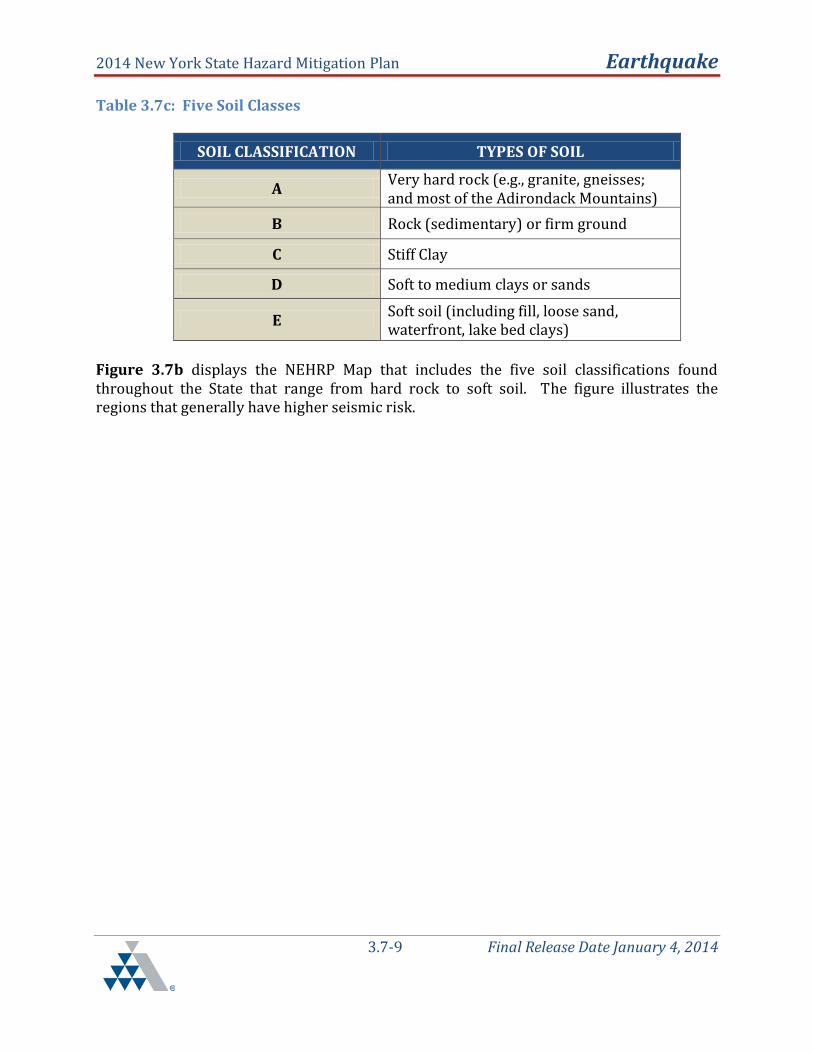
Table 3.7c: Five Soil Classes
SOIL CLASSIFICATION TYPES OF SOIL
A Very hard rock (e.g., granite, gneisses; and most of the Adirondack Mountains)
B Rock (sedimentary) or firm ground
C Stiff Clay
D Soft to medium clays or sands
E Soft soil (including fill, loose sand, waterfront, lake bed clays)
Figure 3.7b displays the NEHRP Map that includes the five soil classifications found throughout the State that range from hard rock to soft soil. The figure illustrates the regions that generally have higher seismic risk.

2014 New York State Hazard Mitigation Plan Earthquake
3.7-10 Final Release Date January 4, 2014
Figure 3.7d: NEHRP Soil Classification Map

2014 New York State Hazard Mitigation Plan Earthquake
3.7-11 Final Release Date January 4, 2014
Overlaying the NEHRP soil classes map with the Percent Peak Ground Acceleration (%PGA) map, provides a clearer indication of the areas that may experience an amplification of ground motion and higher risk at a given magnitude. For instance, areas of New York State that would experience an amplification of ground motion during seismic activity according to the NEHRP soil classification map would include but not be limited to the following: Northwest New York - Northern Erie County, North Central Northeast NY - Jefferson, St. Lawrence, and Northern Franklin Counties Upper Hudson River area of Eastern NY - Northern Saratoga, Washington and Southern
Warren Counties Southeastern NY- Western Nassau County, and New York City
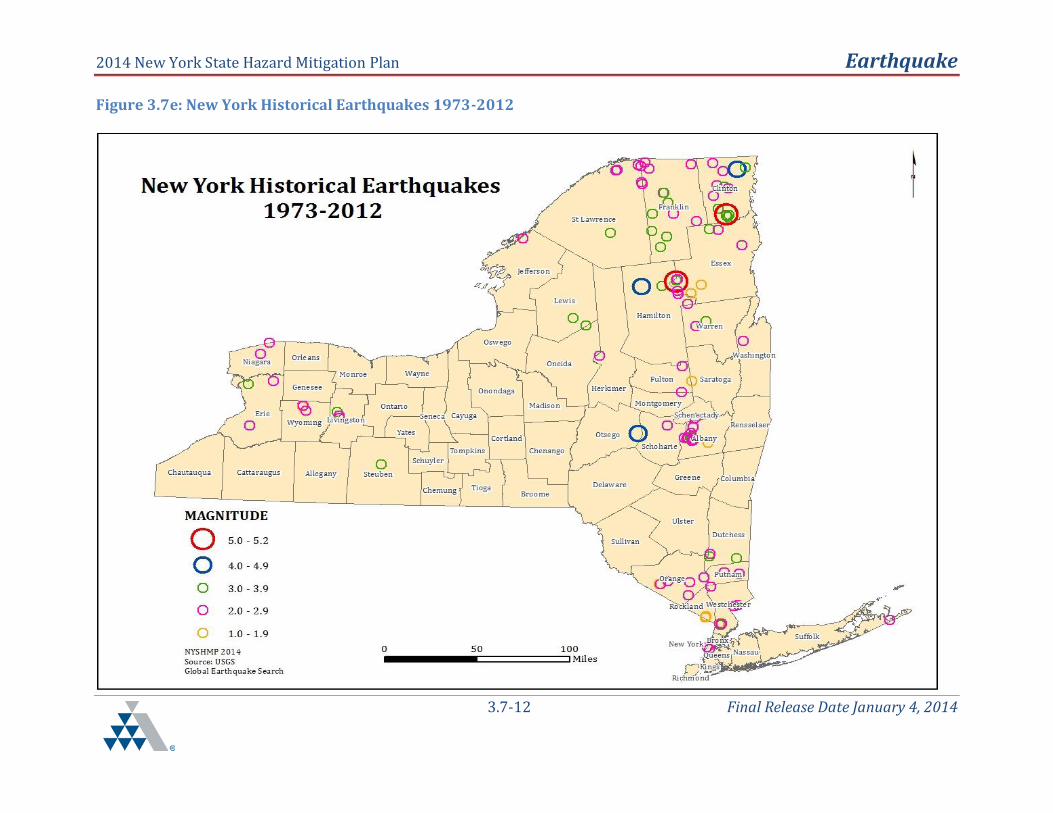
The %PGA is a common earthquake measurement that shows three things: the geographic area affected (all colored areas on the map), the probability of an earthquake of each given level of severity (10% chance in 50 years), and the strength of ground movement (severity) expressed in terms of percent of the acceleration force of gravity (%g) (the PGA is indicated by color). Previous Earthquake Occurrences Figure 3.7e shows historical earthquake events and the associated magnitude for the New York State. During the period of 1973 to 2012, there were eight events of Magnitude 4 or higher. The greatest event during this period was a Magnitude 5.2 that occurred in April 2002 in Clinton County. Magnitudes 1 through 3 earthquake events dominate this time frame.
2014 New York State Hazard Mitigation Plan Earthquake
3.7-12 Final Release Date January 4, 2014
Figure 3.7e: New York Historical Earthquakes 1973-2012
2014 New York State Hazard Mitigation Plan Earthquake
3.7-13 Final Release Date January 4, 2014
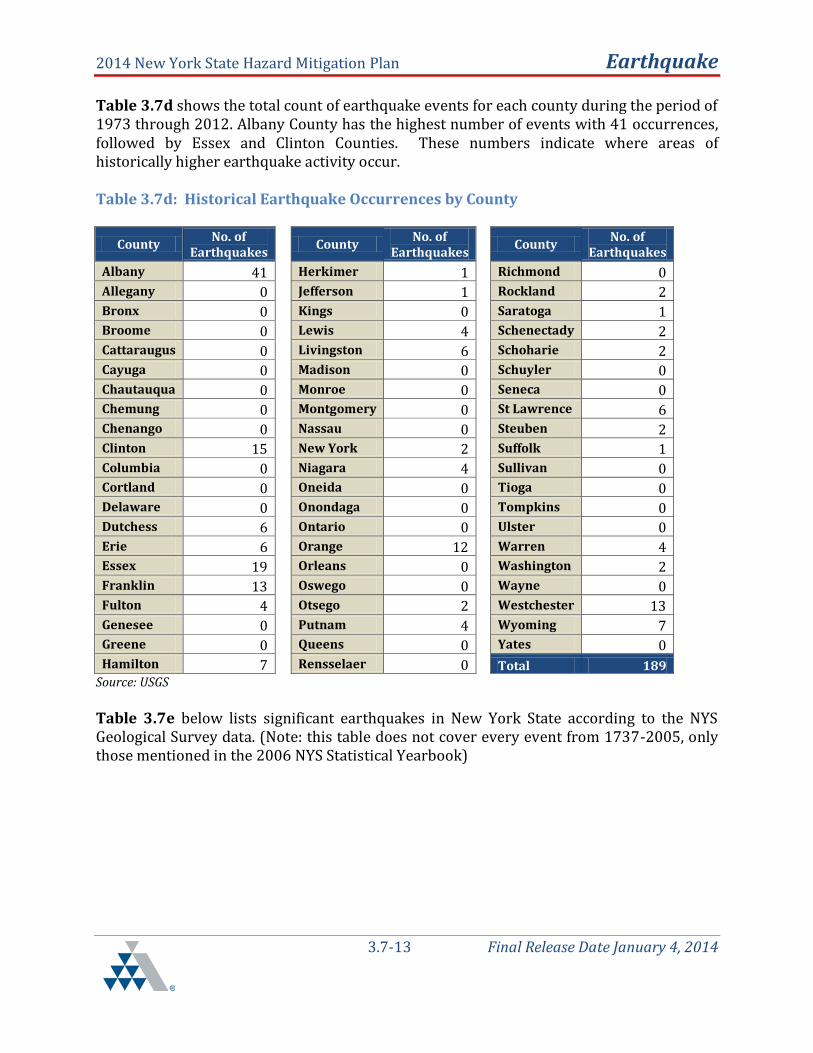
Table 3.7d shows the total count of earthquake events for each county during the period of 1973 through 2012. Albany County has the highest number of events with 41 occurrences, followed by Essex and Clinton Counties. These numbers indicate where areas of historically higher earthquake activity occur. Table 3.7d: Historical Earthquake Occurrences by County
County No. of
Earthquakes County
No. of Earthquakes
County No. of
Earthquakes
Albany 41
Herkimer 1
Richmond 0 Allegany 0
Jefferson 1
Rockland 2
Bronx 0
Kings 0
Saratoga 1 Broome 0
Lewis 4
Schenectady 2 Cattaraugus 0
Livingston 6
Schoharie 2 Cayuga 0
Madison 0
Schuyler 0
Chautauqua 0
Monroe 0
Seneca 0 Chemung 0
Montgomery 0
St Lawrence 6 Chenango 0
Nassau 0
Steuben 2 Clinton 15
New York 2
Suffolk 1
Columbia 0
Niagara 4
Sullivan 0 Cortland 0
Oneida 0
Tioga 0 Delaware 0
Onondaga 0
Tompkins 0 Dutchess 6
Ontario 0
Ulster 0
Erie 6
Orange 12
Warren 4 Essex 19
Orleans 0
Washington 2 Franklin 13
Oswego 0
Wayne 0 Fulton 4
Otsego 2
Westchester 13
Genesee 0
Putnam 4
Wyoming 7 Greene 0
Queens 0
Yates 0 Hamilton 7
Rensselaer 0
Total 189 Source: USGS
Table 3.7e below lists significant earthquakes in New York State according to the NYS Geological Survey data. (Note: this table does not cover every event from 1737-2005, only those mentioned in the 2006 NYS Statistical Yearbook)

2014 New York State Hazard Mitigation Plan Earthquake
3.7-14 Final Release Date January 4, 2014
Table 3.7e: Earthquake History of New York State 1737-2005
Earthquake History Throughout New York State 1737-2005
Date Location Size Damage Estimates
December 18, 1737 New York City 5.2 Bells rang, several chimneys fell
January 16, 1840 Herkimer 3.7 No reference and/or No damage reported
September 2, 1847 Offshore NYC 3.5 No reference and/or No damage reported
September 9, 1848 Rockland Lake V Felt by many
March 12, 1853 Lowville VI Machinery knocked over
February 7, 1855 Saugerties1 VI Cryoseism2,3
October 23, 1857 Buffalo (Lockport1)
4.0 Bells rang, crocks fell from shelves
December 18, 1867 Canton 4.7 Sleepers awakened
December 11, 1874 Tarrytown 3.4 No reference and/or No damage reported
November 4, 1877 Lyon Mountain1 VII Chimneys down, walls cracked, window damaged, crocks overturned
August 10, 1884 New York Bight (NYC)
5.2 Chimneys and bricks fell, walls cracked
May 28, 1897 Dannemora 4.5 No reference and/or No damage reported
February 3, 1916 Schenectady 3.8 Broke windows, people thrown out of bed
March 18, 1928 Saranac Lake 4.0 No reference and/or No damage reported
August 12, 1929 Attica 5.2 250 chimneys fell, brick buildings damaged, Attica prison walls, wells went dry
April 20, 1931 Warrensburg 4.8 Chimneys fell, church spire twisted
April 15, 1934 Dannemora 3.9 House shifted
July 9, 1937 Brooklyn1 3.5 No reference and/or No damage reported
September 5, 1944 Cornwall, Ontario/Massena, NY
5.8 Nearly all chimneys fell, buildings damaged, $2 million damage
September 5, 1944 Cornwall, Ontario/Massena, NY
4.5 Chimneys destroyed, houses damaged
September 3, 1951 Rockland County 3.6 No reference and/or No damage reported
January 1, 1966 Attica 4.7 Chimneys and walls damaged

2014 New York State Hazard Mitigation Plan Earthquake
3.7-15 Final Release Date January 4, 2014
Earthquake History Throughout New York State 1737-2005
Date Location Size Damage Estimates
June 13, 1967 Attica 3.9 Chimneys and walls damaged
May 23, 1971 Blue Mountain Lake
4.1 No reference and/or No damage reported
May 23, 1971 Blue Mountain Lake
3.5 No reference and/or No damage reported
June 7, 1974 Wappingers Falls 3.0 Windows broken
June 9, 1975 Plattsburgh (Altona)
3.5 Chimneys and fireplaces cracked
November 3, 1975 Raquette Lake 4.0 No reference and/or No damage reported
February 2, 1983 Scarsdale-Lagrangeville
3.0 Chimneys cracked
October 7, 1983 Goodnow, Adirondack Mountains
5.1 Tombstones rotated, some cracked chimneys, windows broken, walls damaged
October 19, 1985 Ardsley 4.0 Windows broken, walls damaged
June 17, 1991 Richmondville 4.0 No reference and/or No damage reported
March 10, 1992 East Hampton, Suffolk County
4.1 No reference and/or No damage reported2
April 20, 2000 Newcomb 3.8 Aftershock of the 1983 event. No damage reported
April 20, 2002 Au Sable Forks 5.1 Cracked walls, chimneys fell, road collapsed, power outages
May 24, 2002 Au Sable Forks 3.1 Aftershock of the April 20, 2002 event, no damage reported
Source: NYS Statistical Yearbook 2006, 1=Location Unknown, 2=Damage Uncertain, 3=Frostquake
Records indicate from 1973 to 2012 there were only two (2) damaging earthquakes in the State of New York with an intensity of 5 or greater on the MMI Scale. The Massachusetts Institute of Technology Earth Research Laboratory concludes that, “….more than 400 earthquakes with magnitude greater than 2.0 have occurred in New York State between 1730 and 1986.” The study, “Do Earthquakes Occur in New York State?” referenced by the New York City Emergency Management (NYCEM), also supports existence of seismic hazards in NYS mentioning, “This (data) ranks New York as having the third highest earthquake activity level east of the Mississippi during this period; only South Carolina and Tennessee were more seismically active.” According to a U.S. Department of Commerce Study, “Earthquake History of the United States”, there is record of seismic activity in New York State dating back as far as 1737, with a December 18th occurrence in the New York City area. The earthquake reached a Modified Mercalli Intensity (MMI) VII, meaning the quake was capable of having very strong shaking

2014 New York State Hazard Mitigation Plan Earthquake
3.7-16 Final Release Date January 4, 2014
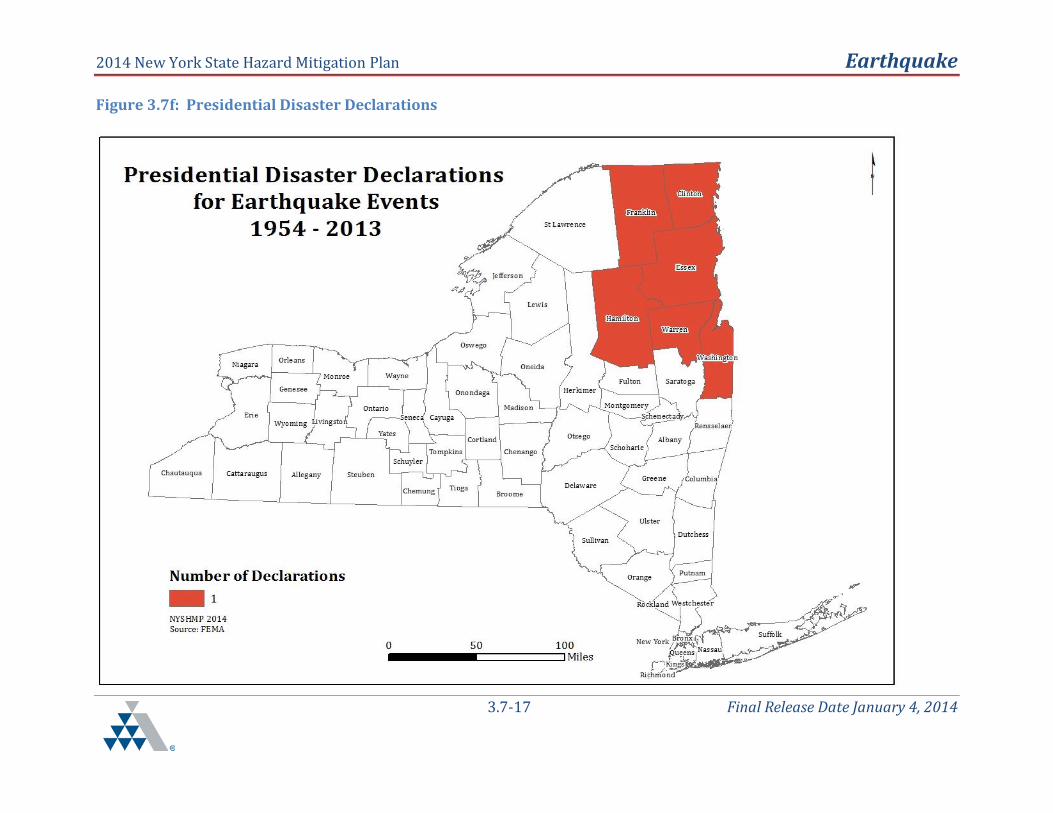
and moderate damage. The %PGA equivalent to a quake of that magnitude ranges from 10-34% gravity. This New York City earthquake which reportedly caused chimneys to fall is estimated to have had a 4.5 Richter magnitude, and is one of two (2) major earthquakes on record. On April 20, 2002, in the Northeast portion of the State, a damaging earthquake reaching a magnitude of 5.1 on the Richter scale was recorded. Dubbed the North Country or Ausable Forks Earthquake, this quake caused a widespread of light to moderate damage. This tremor resulted in a Presidential Disaster Declaration (DR–1415) and over $2 million dollars in eligible damage. Table 3.7f represents the 2002 Presidential Declaration for the 2002 quake affecting Washington, Warren, Hamilton, Franklin, Essex, and Clinton Counties. Table 3.7f: New York State Declared Earthquake Disasters from 1950-2012
New York State Declared Earthquake Disasters from 1950-2012
Disaster # and Date Counties Affected
FEMA: DR: 1415, 5/16/2002 Washington, Warren, Hamilton, Franklin, Essex, and Clinton
Source: FEMA
One of the more recent damage causing earthquakes was reported on August 23,2011, in New York City as a result of a 5.8 magnitude quake that originated in Mineral, Virginia, just northwest of Richmond. Precautionary evacuations had taken place at John F. Kennedy International Airport, Newark Liberty International Airport and briefly at City Hall, however there were no documented injuries reported. Minor damage was reported from Brooklyn’s housing development in Red Hook West Houses where partial chimneys collapsed in one of the community buildings. Other notable earthquakes were felt in Western New York on June 23, 2010 and then again this year in Northern New York on May 17, 2013; both of which originated in Canada with tremors reaching 5.0 or greater magnitudes. Figure 3.7f indicates the counties that have had Presidential Disaster Declarations from 1954 to 2013. Counties with the greatest number of earthquake declarations are concentrated in northeastern New York.
2014 New York State Hazard Mitigation Plan Earthquake
3.7-17 Final Release Date January 4, 2014
Figure 3.7f: Presidential Disaster Declarations
2014 New York State Hazard Mitigation Plan Earthquake
3.7-18 Final Release Date January 4, 2014
Following the April 20th, 2002 event there were recordings of four aftershocks that hit the region; these were recorded as follows:
M 4.0 at 7:04 a.m., April 20 M 1.7 at 7:08 a.m., April 20 M 2.9 at 7:45 a.m., April 20 M 2.2 at 7:47 a.m., April 21 M 2.3 at 7:49 a.m., April 21
The only additional noteworthy event found was an earthquake of a 2.5 magnitude that occurred on June 03, 2010 in the Massena, New York area. This event was reported to be felt throughout various areas of the State.
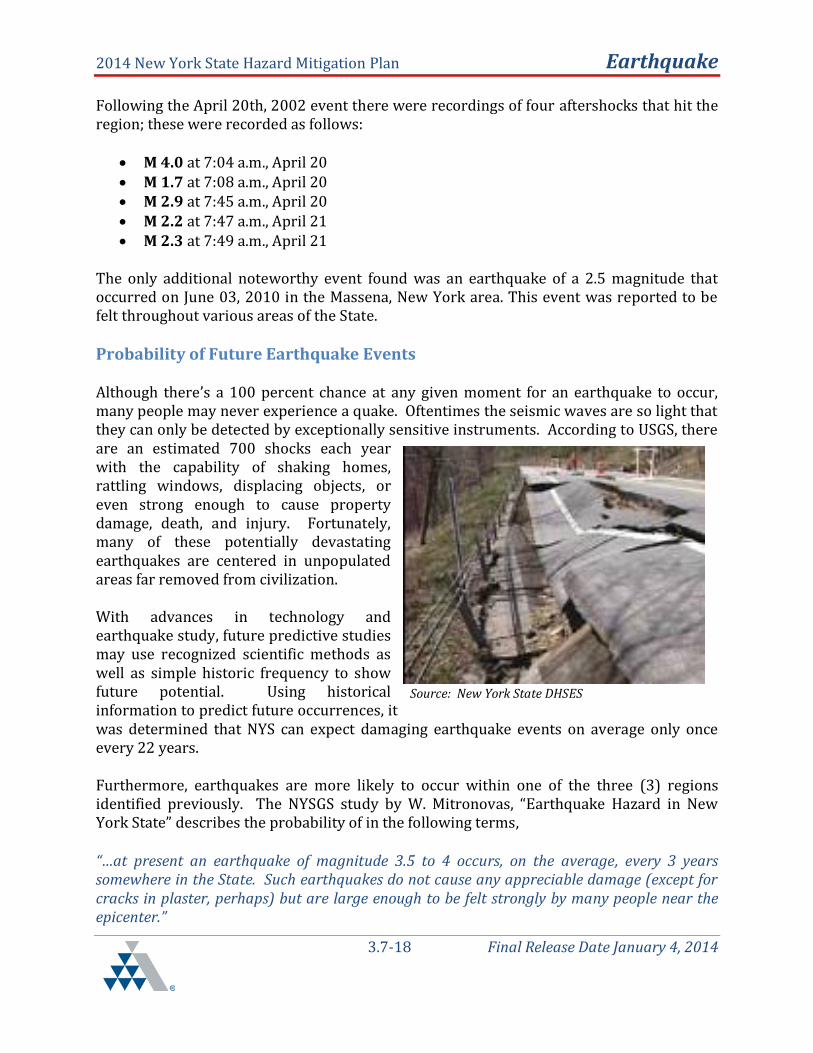
Probability of Future Earthquake Events Although there’s a 100 percent chance at any given moment for an earthquake to occur, many people may never experience a quake. Oftentimes the seismic waves are so light that they can only be detected by exceptionally sensitive instruments. According to USGS, there are an estimated 700 shocks each year with the capability of shaking homes, rattling windows, displacing objects, or even strong enough to cause property damage, death, and injury. Fortunately, many of these potentially devastating earthquakes are centered in unpopulated areas far removed from civilization. With advances in technology and earthquake study, future predictive studies may use recognized scientific methods as well as simple historic frequency to show future potential. Using historical information to predict future occurrences, it was determined that NYS can expect damaging earthquake events on average only once every 22 years. Furthermore, earthquakes are more likely to occur within one of the three (3) regions identified previously. The NYSGS study by W. Mitronovas, “Earthquake Hazard in New York State” describes the probability of in the following terms, “…at present an earthquake of magnitude 3.5 to 4 occurs, on the average, every 3 years somewhere in the State. Such earthquakes do not cause any appreciable damage (except for cracks in plaster, perhaps) but are large enough to be felt strongly by many people near the epicenter.”
Source: New York State DHSES

2014 New York State Hazard Mitigation Plan Earthquake
3.7-19 Final Release Date January 4, 2014
Additionally, according to an article in the CompuServe New York Magazine Online Cover titled “New York Earthquake: The Quake Next Time-Waiting for the Big One” by Graver, Fred, Charlie Rubin, as referred to in the NYCEM Year Two study, “Geologists predict that an earthquake of magnitude 5.0 [some sources describe 5.0 as moderately destructive] or above on the Richter scale has a 2% probability of occurring in the New York area within the next 50 years.” In summary, the frequency of damaging earthquakes within and adjacent to New York State has been relatively low. However, the fact that large, damaging earthquakes have occurred here in the past, combined with the State's high population density and number of old, deteriorating buildings suggests that many people are at risk from damaging earthquakes in New York State.
3.7.2 Assessing Earthquake Vulnerability by Jurisdiction Earthquake Impact Analysis The potential of an earthquake, although a very rare occurrence in this geographical region, exist across the entire State of New York. It is important for an evaluation of the assets that are exposed or vulnerable to this hazard and any other hazard to be identified. Earthquakes typically occur with little to no warning and can have a direct or indirect impact on:
Life, safety and health of residents; Building stock; Critical facilities; The Economy; Future growth and development
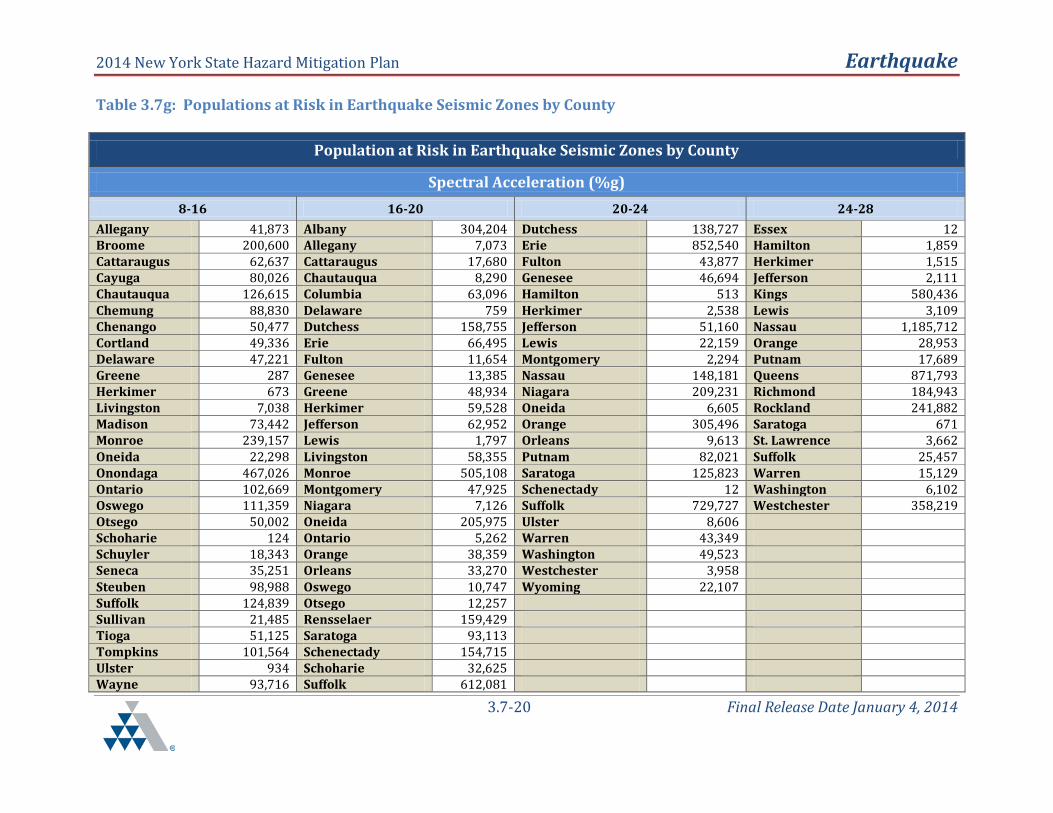
The extent of damage caused by earthquakes depends on population density as well as building and infrastructure construction in affected areas. Soil type, buildings age and building codes may assist in determining areas that are more vulnerable than others. The impacts on population, existing structures, transportation, and the economy within the State are presented in a subsequent section for eight probabilistic earthquake events. Table 3.7g displays vulnerable populations found within seismic zones listed by county. Figure 3.7f illustrates New York State’s seismic zones that are referenced in the table below.
2014 New York State Hazard Mitigation Plan Earthquake
3.7-20 Final Release Date January 4, 2014
Table 3.7g: Populations at Risk in Earthquake Seismic Zones by County
Population at Risk in Earthquake Seismic Zones by County
Spectral Acceleration (%g)
8-16 16-20 20-24 24-28
Allegany 41,873 Albany 304,204 Dutchess 138,727 Essex 12 Broome 200,600 Allegany 7,073 Erie 852,540 Hamilton 1,859 Cattaraugus 62,637 Cattaraugus 17,680 Fulton 43,877 Herkimer 1,515 Cayuga 80,026 Chautauqua 8,290 Genesee 46,694 Jefferson 2,111 Chautauqua 126,615 Columbia 63,096 Hamilton 513 Kings 580,436 Chemung 88,830 Delaware 759 Herkimer 2,538 Lewis 3,109 Chenango 50,477 Dutchess 158,755 Jefferson 51,160 Nassau 1,185,712 Cortland 49,336 Erie 66,495 Lewis 22,159 Orange 28,953 Delaware 47,221 Fulton 11,654 Montgomery 2,294 Putnam 17,689 Greene 287 Genesee 13,385 Nassau 148,181 Queens 871,793 Herkimer 673 Greene 48,934 Niagara 209,231 Richmond 184,943 Livingston 7,038 Herkimer 59,528 Oneida 6,605 Rockland 241,882 Madison 73,442 Jefferson 62,952 Orange 305,496 Saratoga 671 Monroe 239,157 Lewis 1,797 Orleans 9,613 St. Lawrence 3,662 Oneida 22,298 Livingston 58,355 Putnam 82,021 Suffolk 25,457 Onondaga 467,026 Monroe 505,108 Saratoga 125,823 Warren 15,129 Ontario 102,669 Montgomery 47,925 Schenectady 12 Washington 6,102 Oswego 111,359 Niagara 7,126 Suffolk 729,727 Westchester 358,219 Otsego 50,002 Oneida 205,975 Ulster 8,606 Schoharie 124 Ontario 5,262 Warren 43,349 Schuyler 18,343 Orange 38,359 Washington 49,523 Seneca 35,251 Orleans 33,270 Westchester 3,958 Steuben 98,988 Oswego 10,747 Wyoming 22,107 Suffolk 124,839 Otsego 12,257 Sullivan 21,485 Rensselaer 159,429 Tioga 51,125 Saratoga 93,113 Tompkins 101,564 Schenectady 154,715 Ulster 934 Schoharie 32,625 Wayne 93,716 Suffolk 612,081
2014 New York State Hazard Mitigation Plan Earthquake
3.7-21 Final Release Date January 4, 2014
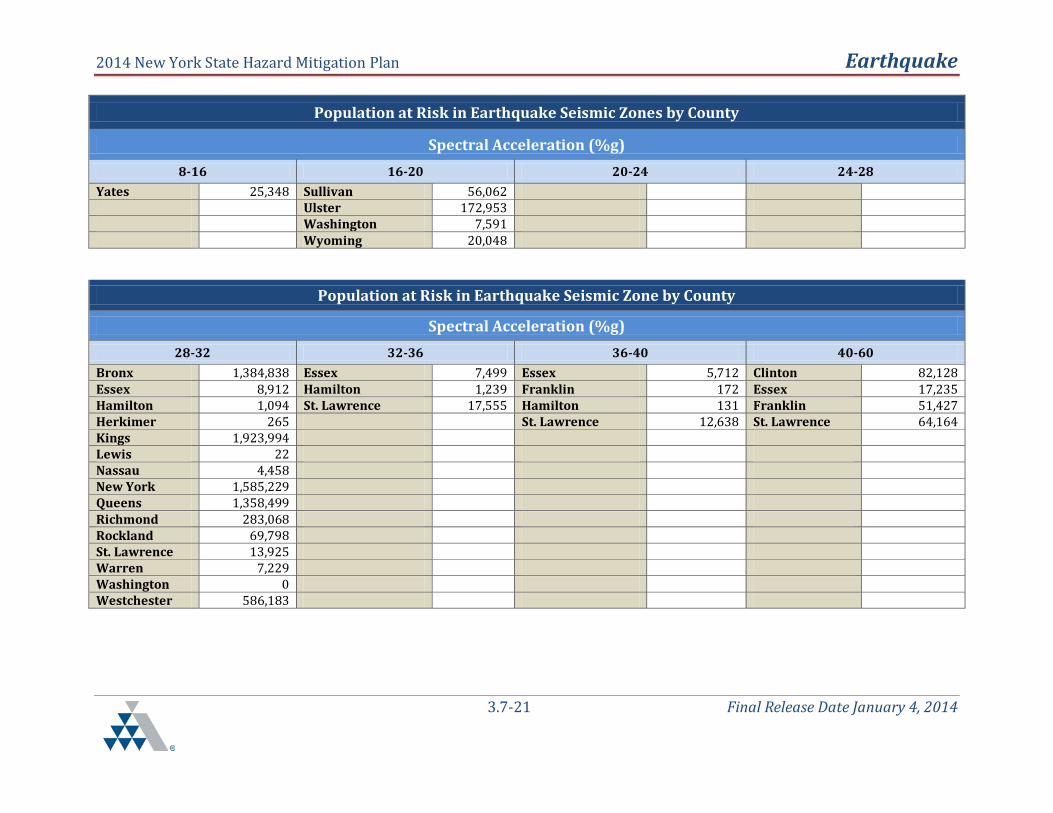
Population at Risk in Earthquake Seismic Zones by County
Spectral Acceleration (%g)
8-16 16-20 20-24 24-28
Yates 25,348 Sullivan 56,062 Ulster 172,953 Washington 7,591 Wyoming 20,048
Population at Risk in Earthquake Seismic Zone by County
Spectral Acceleration (%g)
28-32 32-36 36-40 40-60
Bronx 1,384,838 Essex 7,499 Essex 5,712 Clinton 82,128 Essex 8,912 Hamilton 1,239 Franklin 172 Essex 17,235 Hamilton 1,094 St. Lawrence 17,555 Hamilton 131 Franklin 51,427 Herkimer 265 St. Lawrence 12,638 St. Lawrence 64,164 Kings 1,923,994 Lewis 22 Nassau 4,458 New York 1,585,229 Queens 1,358,499 Richmond 283,068 Rockland 69,798 St. Lawrence 13,925 Warren 7,229 Washington 0 Westchester 586,183
2014 New York State Hazard Mitigation Plan Earthquake
3.7-22 Final Release Date January 4, 2014
Local Plan Integration/ Risk Assessments
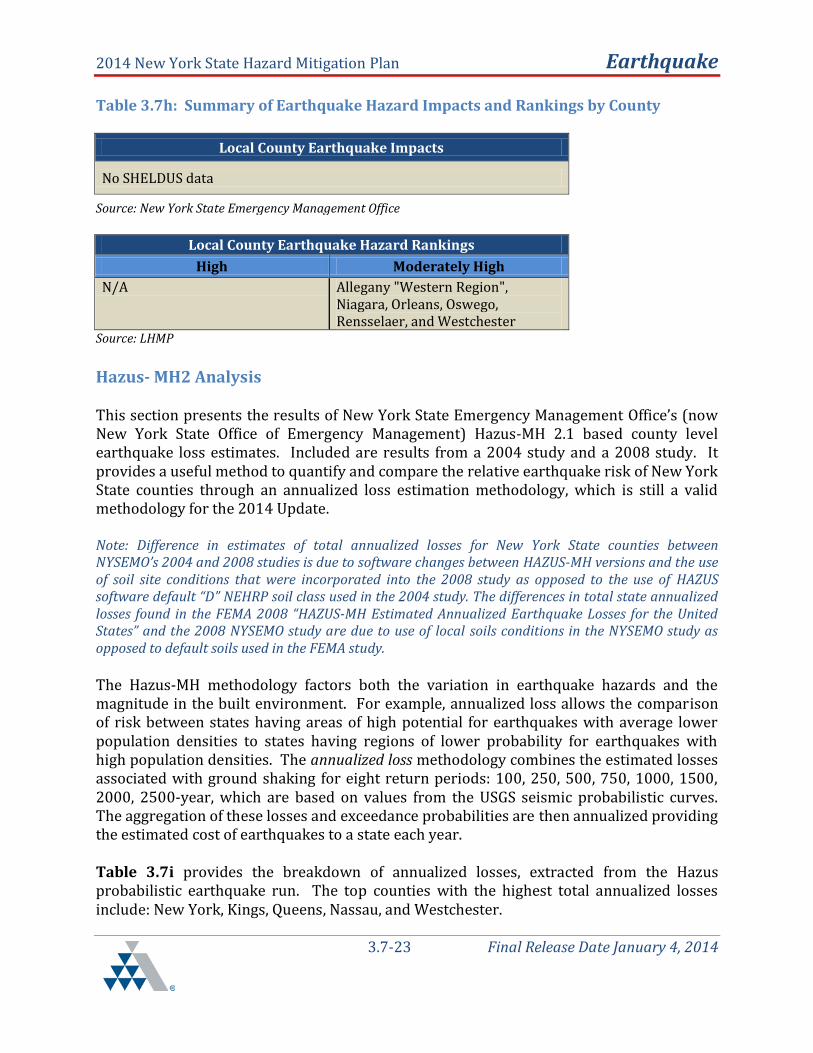
Since August 2013, 56 FEMA-approved local hazard mitigation plans (LHMP) have been reviewed for the 2014 Update. The State’s planning team had the opportunity to review local county risk assessments to help the State better understand its vulnerability in terms of the jurisdictions most threatened by classified hazards. In its analysis, the State of New York reviewed the processes of local governments and how their hazards were ranked based on their jurisdictions and the potential losses (i.e., people, buildings, and dollar values) associated with the hazards of greatest concern. Where data was available, the State extracted the ranking impact information from the LHMP hazard analysis. This ranking feature is based on a combination of probability, severity, and extent of the hazard and was determined to be the best measure of overall risk in the plans. This ranking was either numeric or described in terms of high, moderately high, moderate, or low. In cases where this information was not available, ranking values were not determined yet considered if identified in the individual county local plans. For the sake of the 2014 Update, a proper analysis and summary of the data was required. During the review of the local plan risk assessments, all rankings used were based on the New York HAZNY ranking system, and measured on a scale rating from 44 (low) to 400 (high). This analysis revealed that selected county-level plans did include manmade hazards in their analysis, but the State hazard mitigation plan’s 2014 Update focused solely on natural hazards. The local risk assessment summary allowed for an analysis of which hazards are of high concern to particular counties. Table 3.2a in Section 3.2 lists all the hazards and the number of counties that ranked them at each of the scale levels: High, Moderately High, Moderate, Moderately Low, and Low. According to the plans reviewed, 49 counties recognized earthquake as a hazard. No counties within NYS identified earthquake as a high hazard, six counties considered it a moderately high hazard, one ranked it a moderate hazard, fourteen ranked it moderately low, and fifteen considered it a low hazard. Table 3.7fh displays the highest ranked county hazard impacts and the high and / or moderately high ranked risk assessment scores for Earthquake.
2014 New York State Hazard Mitigation Plan Earthquake
3.7-23 Final Release Date January 4, 2014
Table 3.7h: Summary of Earthquake Hazard Impacts and Rankings by County
Local County Earthquake Impacts
No SHELDUS data
Source: New York State Emergency Management Office
Local County Earthquake Hazard Rankings
High Moderately High
N/A Allegany "Western Region", Niagara, Orleans, Oswego, Rensselaer, and Westchester
Source: LHMP
Hazus- MH2 Analysis This section presents the results of New York State Emergency Management Office’s (now New York State Office of Emergency Management) Hazus-MH 2.1 based county level earthquake loss estimates. Included are results from a 2004 study and a 2008 study. It provides a useful method to quantify and compare the relative earthquake risk of New York State counties through an annualized loss estimation methodology, which is still a valid methodology for the 2014 Update. Note: Difference in estimates of total annualized losses for New York State counties between NYSEMO’s 2004 and 2008 studies is due to software changes between HAZUS-MH versions and the use of soil site conditions that were incorporated into the 2008 study as opposed to the use of HAZUS software default “D” NEHRP soil class used in the 2004 study. The differences in total state annualized losses found in the FEMA 2008 “HAZUS-MH Estimated Annualized Earthquake Losses for the United States” and the 2008 NYSEMO study are due to use of local soils conditions in the NYSEMO study as opposed to default soils used in the FEMA study.
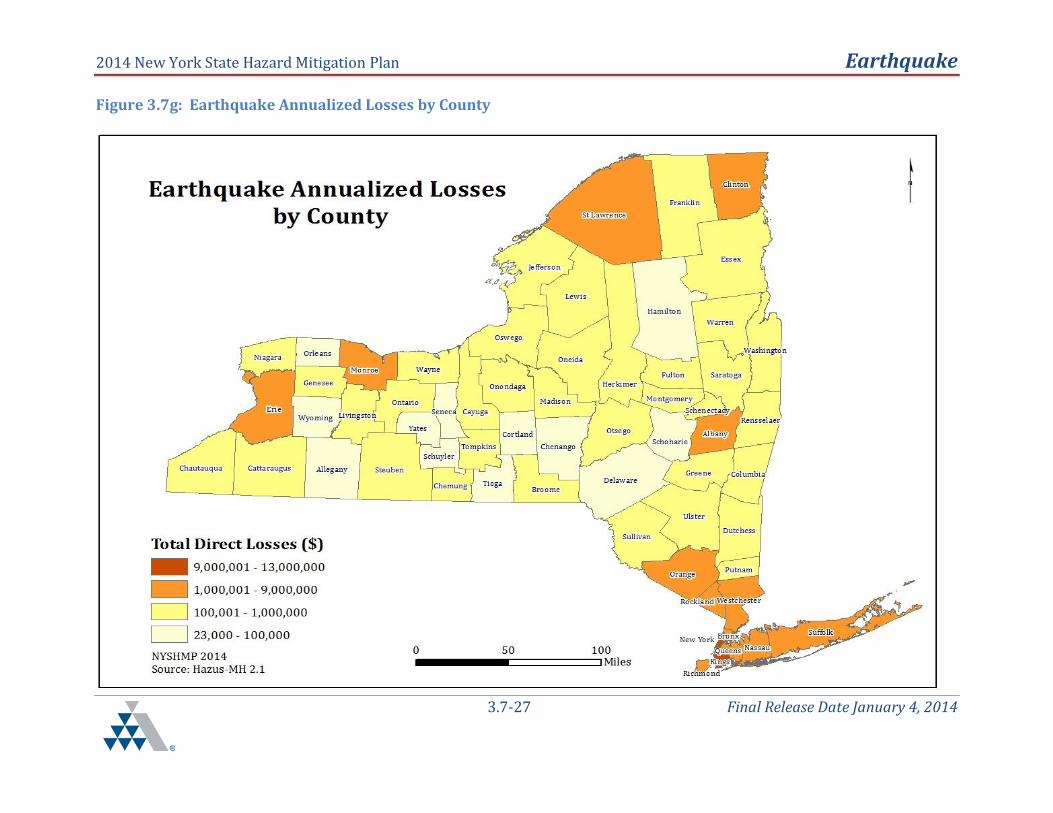
The Hazus-MH methodology factors both the variation in earthquake hazards and the magnitude in the built environment. For example, annualized loss allows the comparison of risk between states having areas of high potential for earthquakes with average lower population densities to states having regions of lower probability for earthquakes with high population densities. The annualized loss methodology combines the estimated losses associated with ground shaking for eight return periods: 100, 250, 500, 750, 1000, 1500, 2000, 2500-year, which are based on values from the USGS seismic probabilistic curves. The aggregation of these losses and exceedance probabilities are then annualized providing the estimated cost of earthquakes to a state each year. Table 3.7i provides the breakdown of annualized losses, extracted from the Hazus probabilistic earthquake run. The top counties with the highest total annualized losses include: New York, Kings, Queens, Nassau, and Westchester.

2014 New York State Hazard Mitigation Plan Earthquake
3.7-24 Final Release Date January 4, 2014
Table 3.7i: Hazus-MH Earthquake Loss Estimation by County
County S
tru
ctu
ral
Da
ma
ge
No
n S
tru
ctu
ral
Da
ma
ge
Co
nte
nts
D
am
ag
e
Inv
en
tory
L
oss
Re
loca
tio
n
Lo
ss
Ca
pit
al
Re
late
d L
oss
Wa
ge
L
oss
Re
nta
l In
com
e
Lo
ss
To
tal
L
oss
Albany $171 $501 $165 $4 $128 $58 $83 $76 $1,186
Allegany $10 $26 $8 $0 $7 $2 $3 $3 $58
Bronx $582 $2,475 $840 $9 $303 $105 $139 $265 $4,718
Broome $45 $122 $35 $1 $33 $13 $18 $18 $285
Cattaraugus $18 $51 $16 $1 $13 $4 $6 $6 $114
Cayuga $19 $51 $14 $1 $13 $5 $7 $6 $116
Chautauqua $30 $88 $29 $1 $20 $9 $13 $11 $200
Chemung $16 $42 $12 $1 $12 $5 $8 $6 $103
Chenango $13 $34 $10 $0 $10 $3 $4 $4 $79
Clinton $168 $544 $202 $7 $115 $45 $67 $57 $1,205
Columbia $28 $77 $24 $1 $18 $7 $11 $9 $173
Cortland $11 $30 $9 $0 $8 $3 $5 $4 $70
Delaware $16 $42 $12 $0 $11 $3 $6 $5 $96
Dutchess $122 $376 $126 $3 $69 $31 $42 $37 $806
Erie $368 $1,257 $479 $16 $238 $97 $132 $146 $2,734
Essex $62 $209 $72 $2 $47 $21 $31 $26 $470
Franklin $109 $368 $134 $3 $80 $24 $39 $38 $795
Fulton $30 $88 $28 $1 $22 $7 $10 $11 $197
Genesee $23 $73 $29 $2 $16 $6 $9 $7 $165
Greene $19 $55 $16 $0 $13 $5 $8 $7 $123
Hamilton $11 $35 $11 $0 $8 $2 $4 $4 $76
Herkimer $29 $85 $27 $1 $22 $9 $12 $11 $196
Jefferson $71 $201 $60 $2 $48 $21 $31 $28 $460
Kings $1,128 $4,734 $1,666 $28 $590 $210 $295 $492 $9,143
Lewis $17 $49 $16 $1 $12 $3 $6 $5 $108
Livingston $18 $53 $18 $1 $12 $4 $6 $6 $117
Madison $22 $57 $17 $1 $14 $6 $8 $7 $131
Monroe $230 $687 $228 $7 $152 $68 $97 $83 $1,551
Montgomery $23 $69 $23 $1 $18 $6 $10 $9 $160
Nassau $884 $3,002 $1,190 $19 $442 $221 $295 $223 $6,276
New York $1,574 $6,204 $2,432 $34 $842 $543 $617 $712 $12,958

2014 New York State Hazard Mitigation Plan Earthquake
3.7-25 Final Release Date January 4, 2014
County
Str
uct
ura
l D
am
ag
e
No
n S
tru
ctu
ral
Da
ma
ge
Co
nte
nts
D
am
ag
e
Inv
en
tory
L
oss
Re
loca
tio
n
Lo
ss
Ca
pit
al
Re
late
d L
oss
Wa
ge
L
oss
Re
nta
l In
com
e
Lo
ss
To
tal
L
oss
Niagara $78 $266 $101 $4 $50 $21 $29 $28 $577
Oneida $97 $275 $83 $3 $68 $29 $40 $40 $634
Onondaga $152 $422 $128 $4 $111 $45 $64 $59 $985
Ontario $29 $81 $26 $1 $19 $9 $12 $10 $187
Orange $171 $537 $197 $5 $98 $43 $62 $52 $1,165
Orleans $13 $39 $14 $1 $8 $3 $4 $4 $87
Oswego $36 $96 $27 $1 $27 $9 $13 $12 $221
Otsego $21 $55 $15 $0 $15 $6 $9 $7 $127
Putnam $49 $162 $58 $1 $25 $9 $13 $11 $329
Queens $1,011 $4,114 $1,449 $20 $516 $171 $235 $394 $7,910
Rensselaer $65 $201 $63 $1 $51 $16 $23 $25 $446
Richmond $251 $943 $343 $4 $123 $45 $60 $79 $1,847
Rockland $193 $667 $260 $5 $103 $48 $67 $56 $1,400
Saratoga $107 $321 $103 $2 $77 $32 $42 $38 $722
Schenectady $97 $282 $106 $7 $64 $26 $31 $38 $651
Schoharie $12 $34 $10 $0 $9 $3 $4 $4 $76
Schuyler $4 $10 $3 $0 $3 $1 $1 $1 $23
Seneca $8 $20 $6 $0 $5 $2 $2 $2 $46
St Lawrence $178 $585 $206 $5 $125 $44 $72 $62 $1,276
Steuben $20 $53 $16 $1 $15 $5 $8 $7 $123
Suffolk $691 $2,127 $793 $21 $341 $159 $210 $169 $4,512
Sullivan $32 $93 $27 $1 $20 $7 $11 $12 $203
Tioga $9 $22 $6 $0 $6 $2 $3 $3 $51
Tompkins $21 $57 $15 $0 $14 $6 $9 $8 $131
Ulster $76 $219 $70 $2 $47 $21 $28 $27 $489
Warren $61 $190 $64 $2 $44 $29 $36 $27 $452
Washington $33 $96 $31 $1 $23 $8 $12 $11 $216
Wayne $29 $70 $22 $1 $17 $6 $9 $8 $161
Westchester $641 $2,308 $894 $17 $349 $168 $221 $210 $4,807
Wyoming $14 $40 $15 $1 $9 $3 $5 $4 $91
Yates $6 $17 $5 $0 $4 $1 $2 $2 $38 Source: Hazus-MH 2.1, Values are in thousands of dollars
2014 New York State Hazard Mitigation Plan Earthquake
3.7-26 Final Release Date January 4, 2014
Figure 3.7g shows total annualized losses by county for New York from a Hazus®MH probabilistic earthquake hazard run. The annualized loss total is the sum of direct building losses from capital stock and income losses. New York, Kings, and Queens Counties make up the top three counties with the highest annualized losses.
2014 New York State Hazard Mitigation Plan Earthquake
3.7-27 Final Release Date January 4, 2014
Figure 3.7g: Earthquake Annualized Losses by County
2014 New York State Hazard Mitigation Plan Earthquake
3.7-28 Final Release Date January 4, 2014
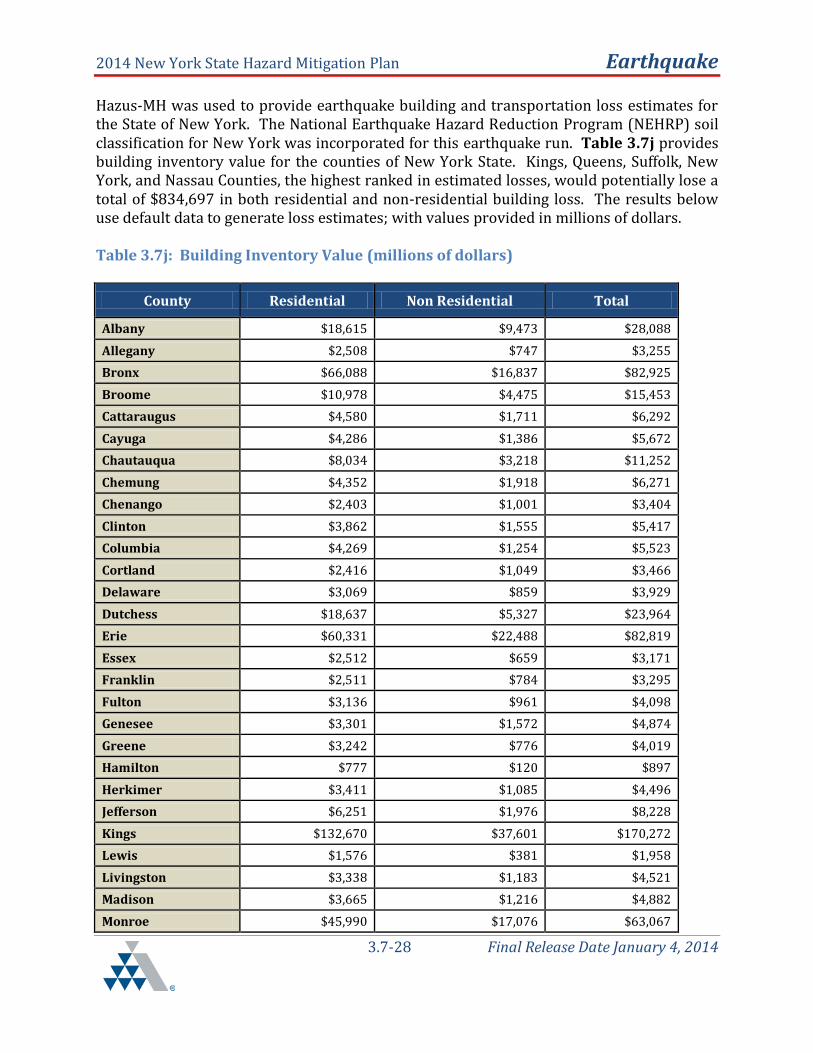
Hazus-MH was used to provide earthquake building and transportation loss estimates for the State of New York. The National Earthquake Hazard Reduction Program (NEHRP) soil classification for New York was incorporated for this earthquake run. Table 3.7j provides building inventory value for the counties of New York State. Kings, Queens, Suffolk, New York, and Nassau Counties, the highest ranked in estimated losses, would potentially lose a total of $834,697 in both residential and non-residential building loss. The results below use default data to generate loss estimates; with values provided in millions of dollars. Table 3.7j: Building Inventory Value (millions of dollars)
County Residential Non Residential Total
Albany $18,615 $9,473 $28,088
Allegany $2,508 $747 $3,255
Bronx $66,088 $16,837 $82,925
Broome $10,978 $4,475 $15,453
Cattaraugus $4,580 $1,711 $6,292
Cayuga $4,286 $1,386 $5,672
Chautauqua $8,034 $3,218 $11,252
Chemung $4,352 $1,918 $6,271
Chenango $2,403 $1,001 $3,404
Clinton $3,862 $1,555 $5,417
Columbia $4,269 $1,254 $5,523
Cortland $2,416 $1,049 $3,466
Delaware $3,069 $859 $3,929
Dutchess $18,637 $5,327 $23,964
Erie $60,331 $22,488 $82,819
Essex $2,512 $659 $3,171
Franklin $2,511 $784 $3,295
Fulton $3,136 $961 $4,098
Genesee $3,301 $1,572 $4,874
Greene $3,242 $776 $4,019
Hamilton $777 $120 $897
Herkimer $3,411 $1,085 $4,496
Jefferson $6,251 $1,976 $8,228
Kings $132,670 $37,601 $170,272
Lewis $1,576 $381 $1,958
Livingston $3,338 $1,183 $4,521
Madison $3,665 $1,216 $4,882
Monroe $45,990 $17,076 $63,067

2014 New York State Hazard Mitigation Plan Earthquake
3.7-29 Final Release Date January 4, 2014
County Residential Non Residential Total
Montgomery $2,470 $1,004 $3,475
Nassau $111,337 $36,901 $148,238
New York $114,968 $83,932 $198,901
Niagara $13,437 $4,511 $17,949
Oneida $12,862 $4,368 $17,230
Onondaga $27,936 $12,253 $40,190
Ontario $6,102 $2,396 $8,498
Orange $22,097 $7,794 $29,892
Orleans $2,239 $751 $2,990
Oswego $5,932 $2,020 $7,953
Otsego $3,392 $1,057 $4,450
Putnam $7,746 $1,499 $9,246
Queens $130,195 $28,411 $158,606
Rensselaer $8,846 $2,825 $11,671
Richmond $32,372 $6,519 $38,892
Rockland $20,466 $6,625 $27,091
Saint Lawrence $5,390 $1,606 $6,996
Saratoga $11,741 $3,408 $15,149
Schenectady $9,138 $5,606 $14,745
Schoharie $1,814 $455 $2,270
Schuyler $972 $352 $1,325
Seneca $1,800 $583 $2,383
Steuben $5,060 $1,996 $7,057
Suffolk $118,835 $39,844 $158,680
Sullivan $6,175 $1,498 $7,674
Tioga $2,512 $722 $3,234
Tompkins $5,109 $1,950 $7,060
Ulster $11,496 $3,922 $15,418
Warren $4,410 $1,550 $5,961
Washington $3,048 $821 $3,869
Wayne $5,272 $2,177 $7,449
Westchester $67,540 $23,665 $91,206
Wyoming $2,197 $831 $3,028
Yates $1,530 $546 $2,076
Total $1,213,244 $433,086 $1,646,360
Source: Hazus-MH 2.1
2014 New York State Hazard Mitigation Plan Earthquake
3.7-30 Final Release Date January 4, 2014
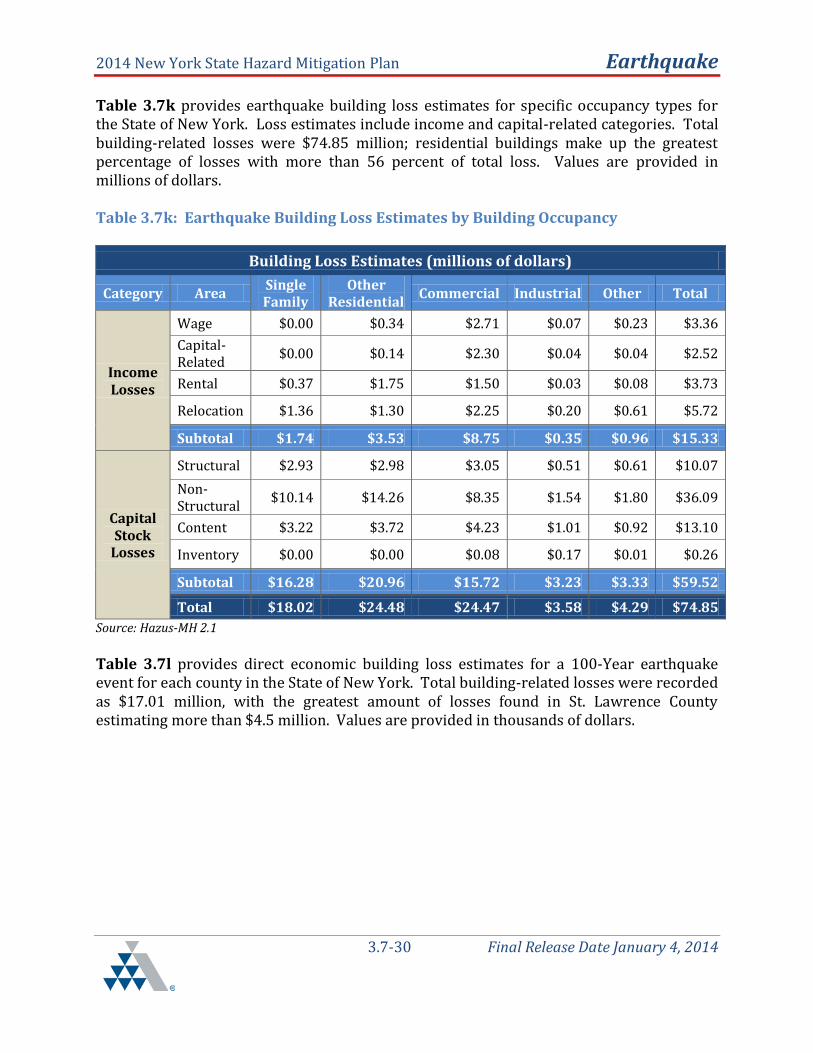
Table 3.7k provides earthquake building loss estimates for specific occupancy types for the State of New York. Loss estimates include income and capital-related categories. Total building-related losses were $74.85 million; residential buildings make up the greatest percentage of losses with more than 56 percent of total loss. Values are provided in millions of dollars. Table 3.7k: Earthquake Building Loss Estimates by Building Occupancy
Building Loss Estimates (millions of dollars)
Category Area Single Family
Other Residential
Commercial Industrial Other Total
Income Losses
Wage $0.00 $0.34 $2.71 $0.07 $0.23 $3.36
Capital-Related
$0.00 $0.14 $2.30 $0.04 $0.04 $2.52
Rental $0.37 $1.75 $1.50 $0.03 $0.08 $3.73
Relocation $1.36 $1.30 $2.25 $0.20 $0.61 $5.72
Subtotal $1.74 $3.53 $8.75 $0.35 $0.96 $15.33
Capital Stock
Losses
Structural $2.93 $2.98 $3.05 $0.51 $0.61 $10.07
Non-Structural
$10.14 $14.26 $8.35 $1.54 $1.80 $36.09
Content $3.22 $3.72 $4.23 $1.01 $0.92 $13.10
Inventory $0.00 $0.00 $0.08 $0.17 $0.01 $0.26
Subtotal $16.28 $20.96 $15.72 $3.23 $3.33 $59.52
Total $18.02 $24.48 $24.47 $3.58 $4.29 $74.85
Source: Hazus-MH 2.1
Table 3.7l provides direct economic building loss estimates for a 100-Year earthquake event for each county in the State of New York. Total building-related losses were recorded as $17.01 million, with the greatest amount of losses found in St. Lawrence County estimating more than $4.5 million. Values are provided in thousands of dollars.

2014 New York State Hazard Mitigation Plan Earthquake
3.7-31 Final Release Date January 4, 2014
Table 3.7l: Direct Economic Building Losses for 100-Year Earthquake Event
Direct Economic Building Losses for 100-Year Return Earthquake Event (value in thousands of dollars)
County Structural
Damage
Non-Structural
Damage
Contents Damage
Inventory Damage
Relocation Loss
Capital Related
Loss
Wages Loss
Rental Income
Loss Total Loss
Albany $ - $ - $ - $ - $ - $ - $ - $ - $ -
Allegany $ - $ - $ - $ - $ - $ - $ - $ - $ -
Bronx $ - $ - $ - $ - $ - $ - $ - $ - $ -
Broome $ - $ - $ - $ - $ - $ - $ - $ - $ -
Cattaraugus $ - $ - $ - $ - $ - $ - $ - $ - $ -
Cayuga $ - $ - $ - $ - $ - $ - $ - $ - $ -
Chautauqua $ - $ - $ - $ - $ - $ - $ - $ - $ -
Chemung $ - $ - $ - $ - $ - $ - $ - $ - $ -
Chenango $ - $ - $ - $ - $ - $ - $ - $ - $ -
Clinton $ 830 $ 1,782 $ 374 $ 13 $ 534 $ 176 $ 276 $ 285 $ 4,269
Columbia $ - $ - $ - $ - $ - $ - $ - $ - $ -
Cortland $ - $ - $ - $ - $ - $ - $ - $ - $ -
Delaware $ - $ - $ - $ - $ - $ - $ - $ - $ -
Dutchess $ - $ - $ - $ - $ - $ - $ - $ - $ -
Erie $ - $ - $ - $ - $ - $ - $ - $ - $ -
Essex $ 303 $ 639 $ 99 $ 2 $ 205 $ 70 $ 107 $ 121 $ 1,547
Franklin $ 539 $ 1,235 $ 270 $ 6 $ 371 $ 90 $ 152 $ 183 $ 2,847
Fulton $ - $ - $ - $ - $ - $ - $ - $ - $ -
Genesee $ - $ - $ - $ - $ - $ - $ - $ - $ -
Greene $ - $ - $ - $ - $ - $ - $ - $ - $ -
Hamilton $ 56 $ 110 $ 12 $ 0 $ 38 $ 7 $ 12 $ 17 $ 252
Herkimer $ 36 $ 64 $ 6 $ 0 $ 24 $ 7 $ 9 $ 10 $ 156

2014 New York State Hazard Mitigation Plan Earthquake
3.7-32 Final Release Date January 4, 2014
Direct Economic Building Losses for 100-Year Return Earthquake Event (value in thousands of dollars)
County Structural
Damage
Non-Structural
Damage
Contents Damage
Inventory Damage
Relocation Loss
Capital Related
Loss
Wages Loss
Rental Income
Loss Total Loss
Jefferson $ 244 $ 432 $ 43 $ 1 $ 141 $ 43 $ 64 $ 93 $ 1,062
Kings $ - $ - $ - $ - $ - $ - $ - $ - $ -
Lewis $ 75 $ 134 $ 14 $ 1 $ 49 $ 11 $ 19 $ 20 $ 321
Livingston $ - $ - $ - $ - $ - $ - $ - $ - $ -
Madison $ - $ - $ - $ - $ - $ - $ - $ - $ -
Monroe $ - $ - $ - $ - $ - $ - $ - $ - $ -
Montgomery $ - $ - $ - $ - $ - $ - $ - $ - $ -
Nassau $ - $ - $ - $ - $ - $ - $ - $ - $ -
New York $ - $ - $ - $ - $ - $ - $ - $ - $ -
Niagara $ - $ - $ - $ - $ - $ - $ - $ - $ -
Oneida $ - $ - $ - $ - $ - $ - $ - $ - $ -
Onondaga $ - $ - $ - $ - $ - $ - $ - $ - $ -
Ontario $ - $ - $ - $ - $ - $ - $ - $ - $ -
Orange $ - $ - $ - $ - $ - $ - $ - $ - $ -
Orleans $ - $ - $ - $ - $ - $ - $ - $ - $ -
Oswego $ - $ - $ - $ - $ - $ - $ - $ - $ -
Otsego $ - $ - $ - $ - $ - $ - $ - $ - $ -
Putnam $ - $ - $ - $ - $ - $ - $ - $ - $ -
Queens $ - $ - $ - $ - $ - $ - $ - $ - $ -
Rensselaer $ - $ - $ - $ - $ - $ - $ - $ - $ -
Richmond $ - $ - $ - $ - $ - $ - $ - $ - $ -
Rockland $ - $ - $ - $ - $ - $ - $ - $ - $ -
Saint Lawrence
$ 899 $ 1,949 $ 374 $ 10 $ 586 $ 167 $ 289 $ 308 $ 4,581

2014 New York State Hazard Mitigation Plan Earthquake
3.7-33 Final Release Date January 4, 2014
Direct Economic Building Losses for 100-Year Return Earthquake Event (value in thousands of dollars)
County Structural
Damage
Non-Structural
Damage
Contents Damage
Inventory Damage
Relocation Loss
Capital Related
Loss
Wages Loss
Rental Income
Loss Total Loss
Saratoga $ 47 $ 82 $ 8 $ 0 $ 29 $ 7 $ 8 $ 14 $ 194
Schenectady $ - $ - $ - $ - $ - $ - $ - $ - $ -
Schoharie $ - $ - $ - $ - $ - $ - $ - $ - $ -
Schuyler $ - $ - $ - $ - $ - $ - $ - $ - $ -
Seneca $ - $ - $ - $ - $ - $ - $ - $ - $ -
Steuben $ - $ - $ - $ - $ - $ - $ - $ - $ -
Suffolk $ - $ - $ - $ - $ - $ - $ - $ - $ -
Sullivan $ - $ - $ - $ - $ - $ - $ - $ - $ -
Tioga $ - $ - $ - $ - $ - $ - $ - $ - $ -
Tompkins $ - $ - $ - $ - $ - $ - $ - $ - $ -
Ulster $ - $ - $ - $ - $ - $ - $ - $ - $ -
Warren $ 288 $ 526 $ 58 $ 1 $ 182 $ 90 $ 116 $ 118 $ 1,379
Washington $ 94 $ 163 $ 16 $ 0 $ 59 $ 14 $ 23 $ 32 $ 402
Wayne $ - $ - $ - $ - $ - $ - $ - $ - $ -
Westchester $ - $ - $ - $ - $ - $ - $ - $ - $ -
Wyoming $ - $ - $ - $ - $ - $ - $ - $ - $ -
Yates $ - $ - $ - $ - $ - $ - $ - $ - $ -
Total $ 3,411 $ 7,118 $ 1,273 $ 36 $ 2,218 $ 681 $ 1,074 $ 1,200 $ 17,010
Source: Hazus, All values are in thousands of dollars

2014 New York State Hazard Mitigation Plan Earthquake
3.7-34 Final Release Date January 4, 2014
Table 3.7m provides earthquake transportation loss estimates for specific transportation systems. The total inventory amount is also provided by Hazus-MH and shown in the table; values are in millions of dollars.
Table 3.7m: Earthquake Transportation Loss Estimate
Transportation Loss Estimates (millions of dollars)
System Inventory Value Economic Loss
Highway $406,863 $1,165 Railways $8,197 $21 Bus $332 $24 Ferry $73 $12 Port $1,002 $42 Airport $5,939 $91 Total $422, 407 $1,355
Source: Hazus-MH 2.1
Table 3.7n provides direct economic transportation loss estimates on a 100 –Year return for an earthquake event. The total inventory amount is also provided by Hazus-MH and shown in the table; values are in thousands of dollars.

2014 New York State Hazard Mitigation Plan Earthquake
3.7-35 Final Release Date January 4, 2014
Table 3.7n: Direct Economic Transportation Loss for 100-Year Return Earthquake
Direct Economic Transportation Losses for 100-Year Return Earthquake Event (value in thousands of dollars)
County Highway Railway Bus Facility Ports Ferries Airport
Albany $ 1 $ 7 $ 2 $ 22 $ - $ 10
Allegany $ - $ - $ - $ - $ - $ 1 Bronx N/A N/A N/A N/A N/A N/A Broome $ - $ - $ 1 $ - $ - $ 3 Cattaraugus $ - $ - $ - $ - $ - $ 1 Cayuga $ - $ - $ - $ - $ - $ 3 Chautauqua $ - $ - $ - $ - $ 2,662 $ 2 Chemung $ - $ - $ - $ - $ - $ 1 Chenango $ - $ - $ - $ - $ - $ 5 Clinton $ 3 $ 55 $ 18 $ - $ 1,331 $ 147 Columbia $ - $ 1 $ - $ 1 $ - $ 3 Cortland $ - $ - $ - $ - $ - $ 2 Delaware $ - $ - $ - $ - $ - $ - Dutchess $ - $ 2 $ - $ - $ - $ 12 Erie $ - $ 5 $ 3 $ 5 $ - $ 3 Essex $ 2 $ 25 $ 12 $ - $ 3,993 $ 76 Franklin $ 1 $ - $ 23 $ - $ - $ 187 Fulton $ - $ - $ - $ - $ - $ 7 Genesee $ - $ - $ - $ - $ - $ 2 Greene $ - $ - $ 1 $ 5 $ - $ 3 Hamilton $ - $ - $ - $ - $ - $ 13 Herkimer $ - $ - $ - $ - $ - $ - Jefferson $ - $ - $ 2 $ - $ 1,331 $ 10 Kings N/A N/A N/A N/A N/A N/A Lewis $ - $ - $ - $ - $ - $ - Livingston $ - $ 1 $ - $ - $ - $ 1 Madison $ - $ 1 $ - $ - $ - $ 3 Monroe $ - $ 1 $ 1 $ 1 $ - $ 4 Montgomery $ - $ 2 $ - $ - $ - $ - Nassau N/A N/A N/A N/A N/A N/A New York N/A N/A N/A N/A N/A N/A

2014 New York State Hazard Mitigation Plan Earthquake
3.7-36 Final Release Date January 4, 2014
Direct Economic Transportation Losses for 100-Year Return Earthquake Event (value in thousands of dollars)
County Highway Railway Bus Facility Ports Ferries Airport
Niagara $ - $ - $ 1 $ - $ - $ 2 Oneida $ - $ 2 $ 3 $ - $ - $ 12 Onondaga $ - $ 2 $ 1 $ - $ - $ 5 Ontario $ - $ - $ - $ - $ - $ 2 Orange $ - $ - $ 3 $ 5 $ - $ 5 Orleans $ - $ - $ - $ - $ - $ 1 Oswego $ - $ - $ 1 $ 3 $ - $ 3 Otsego $ - $ - $ 1 $ - $ - $ 8 Putnam $ - $ - $ - $ - $ - $ - Queens N/A N/A N/A N/A N/A N/A Rensselaer $ - $ 1 $ 1 $ 11 $ - $ - Richmond N/A N/A N/A N/A N/A N/A Rockland $ - $ - $ 1 $ 3 $ 1,331 $ - Saint Lawrence $ 3 $ - $ 24 $ 8 $ - $ 245 Saratoga $ - $ 2 $ 1 $ - $ - $ 7 Schenectady $ - $ 2 $ 1 $ - $ - $ 7 Schoharie $ - $ - $ - $ - $ - $ - Schuyler $ - $ - $ - $ - $ - $ - Seneca $ - $ - $ - $ - $ - $ 2 Steuben $ - $ - $ 1 $ - $ - $ 2 Suffolk N/A N/A N/A N/A N/A N/A Sullivan $ - $ - $ 1 $ - $ - $ 5 Tioga $ - $ - $ - $ - $ - $ - Tompkins $ - $ - $ 1 $ - $ - $ 2 Ulster $ - $ - $ 4 $ 9 $ - $ 6 Warren $ - $ - $ 5 $ - $ - $ 13 Washington $ - $ 7 $ - $ - $ - $ - Wayne $ - $ - $ - $ - $ - $ 2 Westchester $ - $ 1 $ 3 $ 11 $ 1,331 $ 2 Wyoming $ - $ - $ - $ - $ - $ 1 Yates $ 9 $ 118 $ 117 $ 86 $ 11,979 $ 831 Total $ 19 $ 235 $ 233 $ 170 $ 23,958 $ 1,662 Source: Hazus, All values are in thousands of dollars
2014 New York State Hazard Mitigation Plan Earthquake
3.7-37 Final Release Date January 4, 2014
Development in Hazard Prone Areas Because Earthquakes are not limited to geographical boundaries or population groups, it is difficult to identify development and population trends that impact this hazard. Current land use and building codes incorporate standards that address and mitigate earthquake accumulation.
3.7.3 Assessing Earthquake Vulnerability of State Facilities Direct building-related economic losses (which are all expressed in dollars) comprise of two groups. The first group consists of losses that are directly derived from building damage, (Capital Stock Loss) and include:
Cost of repair and replacement of damaged and destroyed buildings Cost of damage to building contents Losses of building inventory (contents related to business activities)
The second group consists of losses that are related to the length of time the facility is non-operational or the immediate economic consequences of damage, also termed (Income Related Loss or Functional Loss):
Relocation expenses (for business and institutions) Capital-related income losses (a measure of the loss of productivity, services
or sales) Wage losses (consistent with income loss) Rental Income losses (to building owners)
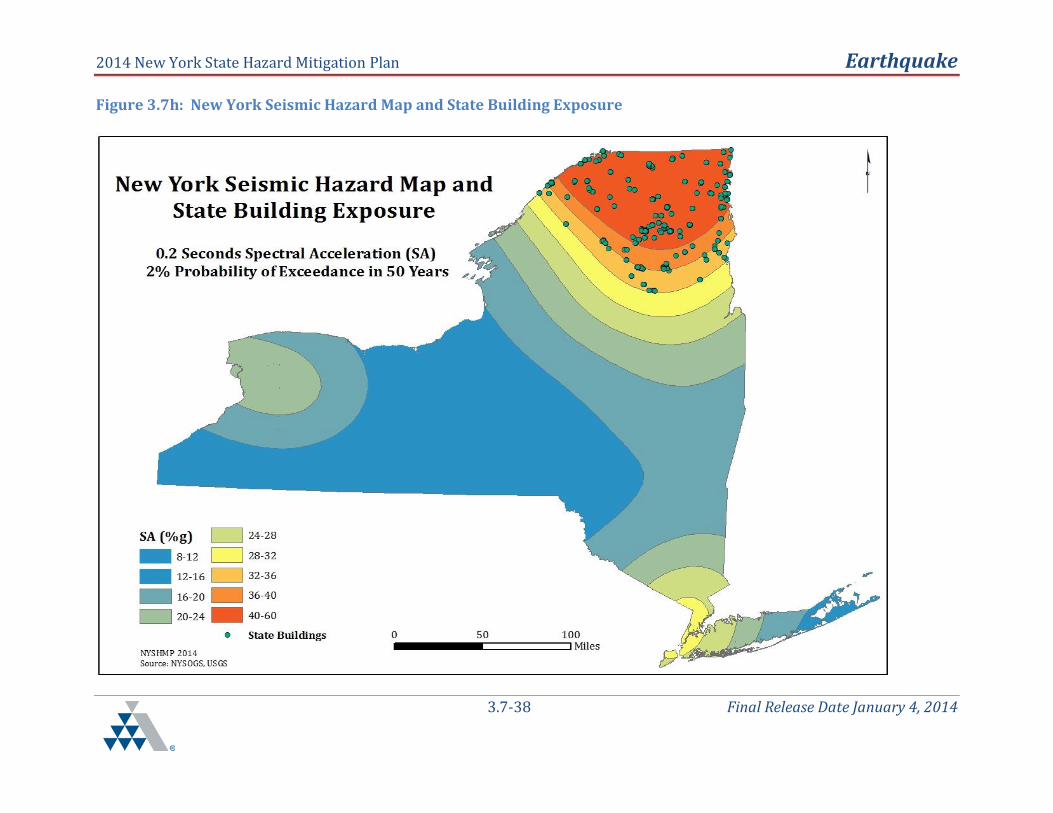
In terms of general building stock total dollar value exposure Kings County Ranks second to New York (Manhattan) with a total value of $133 Billion. Furthermore, Kings County and the other 4 boroughs of New York City are in a higher hazard area with a 6 %PGA value – (in %g). A six %PGA is a higher than average acceleration than throughout the rest of the State, with the exception of some of the Northern Adirondack Counties. In those areas the %PGA values range up to 10%g; however have much lower populations, lower population density, and smaller numbers of structures in its built environment. Figure 3.7h shows New York’s seismic hazard map with state-owned building exposure in potential high ground shaking areas. The map illustrates the best the probability of earthquakes expressed in terms of a two percent probability exceedance and spectral acceleration (SA). Spectral acceleration is used as a better indicator of damage to specific buildings types and heights. Total exposed buildings, with currently available data, includes 1,641 buildings, with a total replacement value of $628,036,209 dollars.
2014 New York State Hazard Mitigation Plan Earthquake
3.7-38 Final Release Date January 4, 2014
Figure 3.7h: New York Seismic Hazard Map and State Building Exposure

2014 New York State Hazard Mitigation Plan Earthquake
3.7-39 Final Release Date January 4, 2014
The analysis found in Table 3.7o below, involved the creation of a GIS layer for state facilities using the coordinate information and an overlay onto an earthquake hazard layer developed using USGS 2008 Percent Peak Ground Acceleration (%PGA) value data. The table shows the outcome of the overlay in terms of the number, dollar replacement value, and percent of state facilities, by agency, within each classification of seismic potential. The seismic potential classes begin at 4 %PGA which represents a lower threat of seismic activity increasing to 10 %PGA indicating the highest seismic threat in NYS. It is acknowledged that there are limitations of this analysis to provide site specific accuracy and that its applicability may not be appropriate beyond a general indication. Instead, the analysis results may be best used as a guide to help target facilities that might benefit from further analysis. The mitigation strategy process has identified activities that will advance the accuracy of the State facilities risk assessment through further analysis. Future analysis will include use of NEHRP soil classification data Figure 3.7a, and the gathering of data to include site specific and building specific attribute information such as construction type, i.e. wood, masonry, reinforced concrete, steel, etc. and continued application of GIS technology. Site specific analysis will allow targeting of the most vulnerable facilities. A statewide inventory pilot project was initiated in August 2013, which will establish the methodology to conduct a multi-year comprehensive assessment of state facilities for risk and losses. The pilot is anticipated to be completed by mid-2014.
3.7.4 Estimating Potential Losses by Jurisdiction- Overview The 2014 Update does not include a description of potential dollar loss estimations by jurisdiction for the earthquake hazard because of the absence of county-level data. As hazard data and risk assessment specific to earthquakes are enhanced in local mitigation plans, it will be incorporated into a state risk assessment repository for integration into SHMP updates. Additionally, application of GIS technology will become more accessible and can address earthquake specific characteristics, such as real property data layers to support of future landslide hazard vulnerability analysis.
3.7.5 Estimating Potential Losses of State Facilities Table 3.7o presents the result of the earthquake hazard vulnerability assessment and loss analysis for State Facilities. The results present a gross estimate of potential earthquake losses to the identified vulnerable State facilities in terms of dollar value of exposed property. In this plan, earthquake hazard vulnerability analysis and loss estimation methodology was supported by GIS technology and involved collaboration with key state agencies. Collaboration resulted in the identification of two state databases that provided key facility information. The NYS Offices of General Services (OGS) fixed asset data base and Cyber Security Critical Infrastructure Coordination (CSCIC) database included fields that provide facility location data and replacement value in dollars.

2014 New York State Hazard Mitigation Plan Earthquake
3.7-40 Final Release Date January 4, 2014
Table 3.7o details the GIS analysis results from the State-Owned buildings in the high seismic ground shaking zones. The table provides the name of the agency that owns the buildings, the total count of buildings, and replacement cost in the high seismic hazard zones. There are 1.641 state owned buildings with a total replacement cost of $628,036,209. Table 3.7o: State-Owned Buildings in High Seismic Hazard Zones
State Agency Number of Buildings
Replacement Cost
Office of General Services (OGS) 41 $11,084,079
Department of Corrections and Community Supervision (DOCCS)
691 $371,893,675
Office of Parks, Recreation and Historic Preservation (OPRHP)
153 $11,448,476
Department of Environmental Conservation (DEC) 489 $32,961,951
Office of Mental Health (OMH) 88 $102,290,234
Office of People with Developmentally Disabilities (OPWDD)
88 $61,353,113
Division of State Police (DSP) 3 $3,883,722
Department of Military and Naval Affairs (DMNA) 6 $4,774,851
Department of Transportation (DOT) 73 $24,265,688
Office of Child and Family Services (OCFS) 6 $1,478,292
Department of Education (EDU) 2 $2,051,432
Adirondack Park Agency (APA) 1 $550,696
Total 1,641 $628,036,209 Source: Hazus-MH 2.1, NYSOGS
As specified previously, the methodology used to gather the data for jurisdiction vulnerabilities was also utilize to obtain State facility losses. Using Hazus-MH earthquake loss estimation software from FEMA, in an April 2008 report entitled, Hazus MH Estimated Annualized Earthquake Losses for the United States, New York State ranked fourth behind California, Washington, and Oregon in annualized earthquake loss (AEL). This report also ranked New York State 26th in annualized earthquake loss ratio (AELR) which addresses annualized loss as a fraction of the replacement value of the building stock.
2014 New York State Hazard Mitigation Plan Earthquake
3.7-41 Final Release Date January 4, 2014
3.7.6 Data Limitations and Other Key Documents The Mitigation Plan Development Team researched the earthquake risk as it affects the State. The contents of this section result from research and outreach including the following sources; Isachson, Y.W., E. Landing, J. M. Lauber, et el., “Do Earthquakes Occur in New York
State?”, Geology of New York: A simplified Account, Albany: New York State Museum/Geological Survey, 1991, pp. 231-238,
FEMA 366 / April 2008 Report – “HAZUS-MH Estimated Annualized Earthquake Losses for the United States.” Produced in cooperation with National Institute of Building Sciences (NIBS). This report cites New York earthquake events as high loss potential, although low frequency, and provides calculated annualized earthquake losses and comparisons by State.
New York City Consortium for Earthquake Loss Mitigation (NYCEM) http://www.nycem.org/default.asp.
United States Geological Survey (USGS), www.usgs.gov . New York State Geological Survey (NYSGS). Lamont-Doherty Earth Observatory, Columbia University Earth Institute Boston College Weston Observatory. New York State Statistical Yearbook, 2003 and 2006, The Nelson A. Rockefeller
Institute of Government, State University of New York. Multidisciplinary Center for Earthquake Engineering Research (MCEER) at the State
University of New York at Buffalo, New York. Please note: data obtained from the Spatial Hazard Events and Losses Database for the United States (SHELDUS™) is a county-level hazard data set for the U.S. for 18 different natural hazard event types such thunderstorms, hurricanes, floods, and tornados. For each event the database includes the beginning date, location (county and state), property losses, crop losses, injuries, and fatalities that affected each county. The data derives from the national data source, National Climatic Data Center's monthly Storm Data publications. Using the latest release of SHELDUS™ 12.0, the database includes every loss causing and/or deadly event between 1960 through 1992 and from 1995 onward. Between 1993 and 1995, SHELDUS™ reflects only events that caused at least one fatality or more than $50,000 in property or crop damages.
Wombs


![[Elearnica.ir]-CompaComparing_response_of_SDF_systems_to_near_fault_and_far_fault_earthquakering Response of SDF Systems to Near Fault and Far Fault Earthquake Mo](https://img.pdfslide.us/doc/110x75/577cc0681a28aba7118ffee3/elearnicair-compacomparingresponseofsdfsystemstonearfaultandfarfaultearthquakering.jpg)