Embed Size (px)
Citation preview

Your grandmother appears to be slowing down. Enter Mega-Grandma! Japanese researchers have developed the
robotic exoskeleton shown here to help the elderly anddisabled walk and even lift heavy objects like the three
22-pound bags of rice in the photo. It’s called the HybridAssistive Limb, or HAL. (The inventor has obviously
never seen 2001: A Space Odyssey.) HAL’s brain is acomputer housed in a back-pack that learns to mimicthe wearer’s gait and posture. Bioelectric sensors
pick up signals transmitted from the brain to themuscles, so it can anticipate movements the momentthe wearer thinks of them. A commercial version is
available at a hefty cost ranging between $14,000 and$20,000. (Source: sanlab.kz.tsukuba.ac.jp)
The cost of manufacturing robotic exoskeletons canbe modeled by rational functions. In this section, you willsee that high production levels of HAL can eventually
make this amazing invention more affordable for theelderly and people with disabilities.
Rational FunctionsRational functions are quotients of polynomial functions. This
means that rational functions can be expressed as
where and are polynomial functions and The domain of a rationalfunction is the set of all real numbers except the that make the denominatorzero. For example, the domain of the rational function
is the set of all real numbers except 0, 2, and
Finding the Domain of a Rational Function
Find the domain of each rational function:
a. b. c.
Solution Rational functions contain division. Because division by 0 is undefined,we must exclude from the domain of each function values of that cause thepolynomial function in the denominator to be 0.
a. The denominator of is 0 if Thus, cannot equal 3.
The domain of consists of all real numbers except 3. We can express thedomain in set-builder or interval notation:
Domain of f = 1- q , 32 ´ 13, q2.
Domain of f = 5x ƒ x Z 36
f
xx = 3.f1x2 =
x2- 9
x - 3
x
h1x2 =
x + 3
x2+ 9
.g1x2 =
x
x2- 9
f1x2 =
x2- 9
x - 3
EXAMPLE 1
-5.
x2+7x+9
x(x-2)(x+5)
This is p(x).
This is q(x).f(x)=
x-valuesq1x2 Z 0.qp
f1x2 =
p1x2
q1x2,
Á
366 Chapter 3 Polynomial and Rational Functions
3.5 Rational Functions and Their GraphsObjectives
� Find the domains of rationalfunctions.
� Use arrow notation.
� Identify vertical asymptotes.
� Identify horizontalasymptotes.
� Use transformations to graphrational functions.
� Graph rational functions.
� Identify slant asymptotes.
� Solve applied problemsinvolving rational functions.
Sec t i on
� Find the domains of rationalfunctions.
C-BLTZMC03_311-410-hr1 12-09-2008 10:46 Page 366

Section 3.5 Rational Functions and Their Graphs 367
b. The denominator of is 0 if or Thus, the domain
of consists of all real numbers except and 3. We can express the domainin set-builder or interval notation:
c. No real numbers cause the denominator of to equal 0. Thedomain of consists of all real numbers.
Check Point 1 Find the domain of each rational function:
a. b. c.
The most basic rational function is the reciprocal function, defined by
The denominator of the reciprocal function is zero when so the
domain of is the set of all real numbers except 0.Let’s look at the behavior of near the excluded value 0. We start by
evaluating to the left of 0.
Mathematically, we say that “ approaches 0 from the left.” From the table and theaccompanying graph, it appears that as approaches 0 from the left, the functionvalues, decrease without bound. We say that “ approaches negativeinfinity.” We use a special arrow notation to describe this situation symbolically:
Observe that the minus superscript on the is read “from the left.”Next, we evaluate to the right of 0.
Mathematically, we say that “ approaches 0 from the right.” From the table and theaccompanying graph, it appears that as approaches 0 from the right, the functionvalues, increase without bound. We say that “ approaches infinity.” Weagain use a special arrow notation to describe this situation symbolically:
Observe that the plus superscript on the is read “from the right.”0 1x : 0+21+2
As x S 0±, f(x) S q.As x approaches 0
from the right, f(x) approachesinfinity (that is, the graph rises).
f1x2f1x2,x
x
y
x
f1x20 1x : 0-21-2
As x S 0–, f(x) S – q.As x approaches 0
from the left, f(x) approachesnegative infinity (that is,
the graph falls).
f1x2f1x2,x
x
y
x
f1x2f
f
x = 0,f1x2 =
1x
.
h1x2 =
x + 5
x2+ 25
.g1x2 =
x
x2- 25
f1x2 =
x2- 25
x - 5
Domain of h = 1- q , q2
hh1x2 =
x + 3
x2+ 9
Domain of g = 1- q , -32 ´ 1-3, 32 ´ 13, q2. Domain of g = 5x ƒ x Z -3, x Z 36
-3g
x = 3.x = -3g1x2 =
x
x2- 9
x approaches 0 from the left.
x -1 -0.5 -0.1 -0.01 -0.001
f(x) �1x
-1 -2 -10 -100 -1000
Study TipBecause the domain of a rationalfunction is the set of all real numbersexcept those for which thedenominator is 0, you can identifysuch numbers by setting thedenominator equal to 0 and solvingfor Exclude the resulting realvalues of from the domain.x
x.
x approaches 0 from the right.
x 0.001 0.01 0.1 0.5 1
f(x) �1x
1000 100 10 2 1
� Use arrow notation.
C-BLTZMC03_311-410-hr1 12-09-2008 10:46 Page 367

368 Chapter 3 Polynomial and Rational Functions
Now let’s see what happens to the function values of as gets
farther away from the origin. The following tables suggest what happens to asincreases or decreases without bound.x
f1x2xf1x2 =
1x
It appears that as increases or decreases without bound, the function values,are getting progressively closer to 0.
Figure 3.27 illustrates the end behavior of as increases or decreases
without bound. The graph shows that the function values, are approaching 0.This means that as increases or decreases without bound, the graph of isapproaching the horizontal line (that is, the ). We use arrow notation todescribe this situation:
Thus, as approaches infinity or as approaches negative infinitythe function values are approaching zero:
The graph of the reciprocal function is shown in Figure 3.28. Unlike
the graph of a polynomial function, the graph of the reciprocal function has a breakand is composed of two distinct branches.
f1x2 =1x
f1x2: 0.1x : - q2,x1x : q2x
As x S q, f(x) S 0 and as x S – q, f(x) S 0.
As x approaches negative infinity (that is, decreases without bound),
f(x) approaches 0.
As x approaches infinity (that is, increases without bound),
f(x) approaches 0.
x-axisy = 0fx
f1x2,xf1x2 =
1x
f1x2,x
−1
12345
−2−3−4−5
1 2 3 4 5−1−2−3−4−5
y
x
Figure 3.28 The graph of the
reciprocal function f1x2 =1x
y
x
Figure 3.27 approaches 0 as increases or decreases without bound.
xf1x2
Study Tip
If is far from 0, then is close to 0.
By contrast, if is close to 0, then is
far from 0.
1x
x
1x
x
decreases without bound:x
x -1 -10 -100 -1000
f(x) 51x
-1 -0.1 -0.01 -0.001
increases without bound:x
x 1 10 100 1000
f(x) 51x
1 0.1 0.01 0.001
The arrow notation used throughout our discussion of the reciprocal functionis summarized in the following box:
Arrow Notation
Symbol Meaning
x : a+ approaches from the right.ax
x : a- approaches from the left.ax
x : q approaches infinity; that is, increases without bound.xx
x : - q approaches negative infinity; that is, decreases withoutbound.
xx
M04_BLIT9838_05_SE_03.QXD 7/10/09 11:16 AM Page 368

Section 3.5 Rational Functions and Their Graphs 369
Another basic rational function is The graph of this even function,
with symmetry and positive function values, is shown in Figure 3.29. Like thereciprocal function, the graph has a break and is composed of two distinct branches.
y-axis
f1x2 =
1
x2 .
1
2
3
x
y
1 2 3 4 5
4
−1−2−3−4−5
As x S 0−, f (x) S q.Function values increase
without bound.
As x S 0+, f (x) S q.Function values increase
without bound.
As x S q (increaseswithout bound),
f (x) S 0.
As x S −q (decreaseswithout bound),
f (x) S 0. Figure 3.29 The graph of f1x2 =
1
x2
Vertical Asymptotes of Rational Functions
Look again at the graph of in Figure 3.29.The curve approaches, but does
not touch, the The or is said to be a vertical asymptote of thegraph. A rational function may have no vertical asymptotes, one vertical asymptote,or several vertical asymptotes. The graph of a rational function never intersects avertical asymptote. We will use dashed lines to show asymptotes.
x = 0,y-axis,y-axis.
f1x2 =
1
x2
Definition of a Vertical AsymptoteThe line is a vertical asymptote of the graph of a function if increasesor decreases without bound as approaches a.x
f1x2fx = a
� Identify vertical asymptotes.
Thus, as approaches from either the left or the right, or f1x2: - q .f1x2: qax
y
x
y
x
y
x
y
x
As x → a+, f(x) → q . As x → a−, f(x) → q . As x → a+, f(x) → −q . As x → a−, f(x) → −q .
x = af
f
f
fa
x = a
a
x = a
a
x = a
a
If the graph of a rational function has vertical asymptotes, they can be locatedusing the following theorem:
Locating Vertical Asymptotes
If is a rational function in which and have no common
factors and is a zero of the denominator, then is a verticalasymptote of the graph of f.
x = aq1x2,a
q1x2p1x2f1x2 =
p1x2
q1x2
Finding the Vertical Asymptotes of a Rational Function
Find the vertical asymptotes, if any, of the graph of each rational function:
a. b. c. h1x2 =
x + 3
x2+ 9
.g1x2 =
x + 3
x2- 9
f1x2 =
x
x2- 9
EXAMPLE 2
C-BLTZMC03_311-410-hr1 12-09-2008 10:46 Page 369

370 Chapter 3 Polynomial and Rational Functions
Solution Factoring is usually helpful in identifying zeros of denominators andany common factors in the numerators and denominators.
a.
There are no common factors in the numerator and the denominator.The zerosof the denominator are and 3. Thus, the lines and are thevertical asymptotes for the graph of [See Figure 3.30(a).]
b. We will use factoring to see if there are common factors.
The only zero of the denominator of insimplified form is 3. Thus, the line is theonly vertical asymptote of the graph of [SeeFigure 3.30(b).]
c. We cannot factor the denominator of over the real numbers.
The denominator has no real zeros. Thus, thegraph of has no vertical asymptotes. [SeeFigure 3.30(c).]
h
h(x)=
No real numbers make this denominator 0.
x+3
x2-9
h1x2
g.x = 3
g1x2
x+3
x2-9
(x+3)
(x+3)(x-3)g(x)= =
1
x-3=
This denominatoris 0 if x = 3.
There is a common factor,x + 3, so simplify.
, provided x � –3
f.x = 3x = -3-3
x
x2-9
x
(x+3)(x-3)f(x)= =
This factor is0 if x = −3.
This factor is0 if x = 3.
y
1 2 3 4 5−1
12345
−2−3−4−5
−1−2−3−4−5x
Verticalasymptote: x = 3
There is ahole in the graph
correspondingto x = −3.
Figure 3.30(b) The graph of
has one vertical
asymptote.
g1x2 =
x + 3
x2- 9
x
y
1 2 3 4 5−1
12345
−2−3−4−5
−1−2−3−4−5
Verticalasymptote: x = −3
Verticalasymptote: x = 3
Figure 3.30(a) The graph of
has two vertical
asymptotes.
f1x2 =
x
x2- 9
x
y
1 2 3 4 5−0.1
0.10.20.30.40.5
−0.2−0.3−0.4−0.5
−2−3−4−5
Technology
The graph of the rational function drawn by hand in Figure 3.30(a), is graphed below in a by
viewing rectangle.The graph is shown in connected mode and in dot mode. In connected mode, the graphing utility plots many points andconnects the points with curves. In dot mode, the utility plots the same points, but does not connect them.
The steep lines in connected mode that are “almost” the vertical asymptotes and are not part of the graph and do notrepresent the vertical asymptotes. The graphing utility has incorrectly connected the last point to the left of with the first pointto the right of It has also incorrectly connected the last point to the left of with the first point to the right of Theeffect is to create two near-vertical segments that look like asymptotes. This erroneous effect does not appear using dot mode.
x = 3.x = 3x = -3.x = -3
x = 3x = -3
Dot Mode
This might appear to be thevertical asymptote x = −3,but it is neither vertical
nor an asymptote.
This might appear to be thevertical asymptote x = 3,but it is neither vertical
nor an asymptote.
Connected Mode
3-4, 4, 143-5, 5, 14f1x2 =
x
x2- 9
,
Figure 3.30(c) The graph of
has no vertical
asymptotes.
h1x2 =
x + 3
x2+ 9
Check Point 2 Find the vertical asymptotes, if any, of the graph of eachrational function:
a. b. c. h1x2 =
x - 1
x2+ 1
.g1x2 =
x - 1
x2- 1
f1x2 =
x
x2- 1
C-BLTZMC03_311-410-hr1 12-09-2008 10:46 Page 370

Section 3.5 Rational Functions and Their Graphs 371
A value where the denominator of a rational function is zero does notnecessarily result in a vertical asymptote.There is a hole corresponding to andnot a vertical asymptote, in the graph of a rational function under the followingconditions:The value causes the denominator to be zero, but there is a reduced formof the function’s equation in which does not cause the denominator to be zero.
Consider, for example, the function
Because the denominator is zero when the function’s domain is all real num-bers except 2. However, there is a reduced form of the equation in which 2 does notcause the denominator to be zero:
Figure 3.31 shows that the graph has a hole corresponding to Graphingutilities do not show this feature of the graph.
Horizontal Asymptotes of Rational Functions
Figure 3.28, repeated, shows the graph of the reciprocal function
As and as the function values are approaching 0: Theline (that is, the ) is a horizontal asymptote of the graph. Many, but notall, rational functions have horizontal asymptotes.
x-axisy = 0f1x2: 0.x : - q ,x : q
f1x2 =
1x
.
x = 2.
Denominator iszero at x = 2.
In this reduced form, 2 does notresult in a zero denominator.
x2-4x-2
(x+2)(x-2)x-2f(x)= =x+2, x � 2.=
x = 2,
f1x2 =
x2- 4
x - 2.
aa
x = a,
x
y
1 2 3 4 5−1
12345
−2−3−4−5
−1−2−3−4−5
Hole correspondingto x = 2
f (x) =x − 2x2 − 4
Figure 3.31 A graph with a holecorresponding to the denominator’s zero
� Identify horizontal asymptotes.
Study TipIt is essential to factor the numeratorand the denominator of a rationalfunction to identify possible verticalasymptotes or holes.
Definition of a Horizontal AsymptoteThe line is a horizontal asymptote of the graph of a function if approaches as increases or decreases without bound.
y = b
y
x
y
x
y
x
As x → q, f(x) → b. As x → q, f(x) → b. As x → q, f(x) → b.
f
ff
y = b
y = b
xbf1x2fy = b−1
12345
−2−3−4−5
1 2 3 4 5−1−2−3−4−5
y
x
Figure 3.28 The graph of
(repeated)
f1x2 =
1x
Recall that a rational function may have several vertical asymptotes. Bycontrast, it can have at most one horizontal asymptote. Although a graph can neverintersect a vertical asymptote, it may cross its horizontal asymptote.
If the graph of a rational function has a horizontal asymptote, it can be locatedusing the following theorem:
Locating Horizontal AsymptotesLet be the rational function given by
The degree of the numerator is The degree of the denominator is
1. If the or is the horizontal asymptote of the graph of
2. If the line is the horizontal asymptote of the graph of
3. If the graph of has no horizontal asymptote.fn 7 m,
f.y =
an
bmn = m,
f.y = 0,x-axis,n 6 m,
m.n.
f1x2 =
anxn+ an - 1x
n - 1+
Á+ a1x + a0
bmxm+ bm - 1x
m - 1+
Á+ b1x + b0
, an Z 0, bm Z 0.
f
Study TipUnlike identifying possible verticalasymptotes or holes, we do not usefactoring to determine a possiblehorizontal asymptote.
C-BLTZMC03_311-410-hr1 12-09-2008 10:46 Page 371
372 Chapter 3 Polynomial and Rational Functions
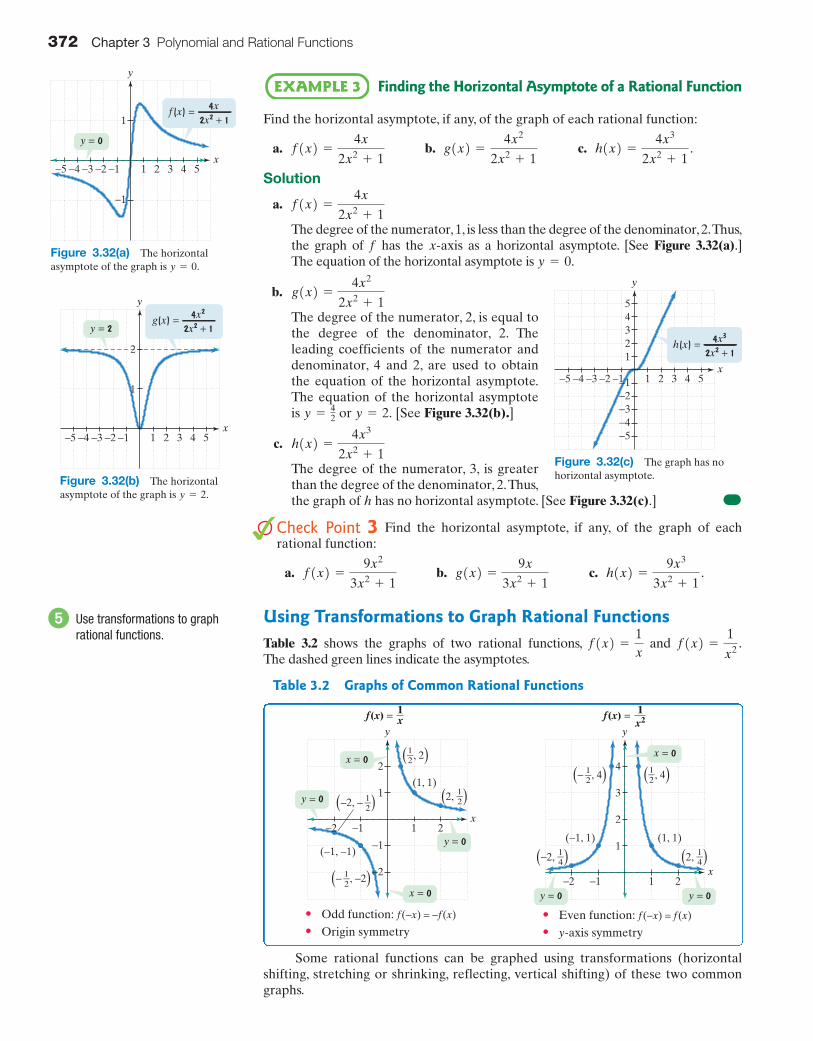
Finding the Horizontal Asymptote of a Rational Function
Find the horizontal asymptote, if any, of the graph of each rational function:
a. b. c.
Solution
a.
The degree of the numerator, 1, is less than the degree of the denominator, 2.Thus,the graph of has the as a horizontal asymptote. [See Figure 3.32(a).]The equation of the horizontal asymptote is
b.
The degree of the numerator, 2, is equal tothe degree of the denominator, 2. Theleading coefficients of the numerator anddenominator, 4 and 2, are used to obtainthe equation of the horizontal asymptote.The equation of the horizontal asymptoteis or [See Figure 3.32(b).]
c.
The degree of the numerator, 3, is greaterthan the degree of the denominator, 2.Thus,the graph of has no horizontal asymptote. [See Figure 3.32(c).]
Check Point 3 Find the horizontal asymptote, if any, of the graph of eachrational function:
a. b. c.
Using Transformations to Graph Rational FunctionsTable 3.2 shows the graphs of two rational functions, and The dashed green lines indicate the asymptotes.
f1x2 =
1
x2 .f1x2 =
1x
h1x2 =
9x3
3x2+ 1
.g1x2 =
9x
3x2+ 1
f1x2 =
9x2
3x2+ 1
h
h1x2 =
4x3
2x2+ 1
y = 2.y =42
g1x2 =
4x2
2x2+ 1
y = 0.x-axisf
f1x2 =
4x
2x2+ 1
h1x2 =
4x3
2x2+ 1
.g1x2 =
4x2
2x2+ 1
f1x2 =
4x
2x2+ 1
EXAMPLE 3
x
y
1 2 3 4 5
−1
1
−1−2−3−4−5
y = 0
f (x) =2x2 + 1
4x
Figure 3.32(a) The horizontalasymptote of the graph is .y = 0
x
y
1 2 3 4 5−1
12345
−2−3−4−5
−1−2−3−4−5
h(x) =2x2 + 1
4x3
Figure 3.32(c) The graph has nohorizontal asymptote.
� Use transformations to graphrational functions.
Table 3.2 Graphs of Common Rational Functions
x
y
1 2
1
2
−1
−2
−1−2
y = 0
(1, 1)
(−1, −1)
(− q, −2)
(−2, − q)
(q, 2)
(2, q)
y = 0
x = 0
x = 0
Odd function: f(−x) = −f(x)•• Origin symmetry
f(x) = 1x
(1, 1)(−1, 1)
(q, 4)(− q, 4)
(2, ~)(−2, ~)
3
4
x
y
1 2
1
2
−1−2
x = 0
y = 0y = 0
Even function: f(−x) = f(x)•• y-axis symmetry
f(x) = 1x2
2
x
y
1 2 3 4 5
1
−1−2−3−5 −4
y = 2 2x2 + 14x2
g(x) =
Figure 3.32(b) The horizontalasymptote of the graph is .y = 2
Some rational functions can be graphed using transformations (horizontalshifting, stretching or shrinking, reflecting, vertical shifting) of these two commongraphs.
C-BLTZMC03_311-410-hr1 12-09-2008 10:46 Page 372

Section 3.5 Rational Functions and Their Graphs 373
Using Transformations to Graph a Rational Function
Use the graph of to graph
Solution
g1x2 =
1
1x - 222+ 1.f1x2 =
1
x2
EXAMPLE 4
Check Point 4 Use the graph of to graph
Graphing Rational Functions
Rational functions that are not transformations of or can be graphed using the following procedure:
f1x2 =
1
x2f1x2 =
1x
g1x2 =
1x + 2
- 1.f1x2 =
1x
Strategy for Graphing a Rational FunctionThe following strategy can be used to graph
where and are polynomial functions with no common factors.
1. Determine whether the graph of has symmetry.
2. Find the (if there is one) by evaluating
3. Find the (if there are any) by solving the equation
4. Find any vertical asymptote(s) by solving the equation
5. Find the horizontal asymptote (if there is one) using the rule for determiningthe horizontal asymptote of a rational function.
6. Plot at least one point between and beyond each and verticalasymptote.
7. Use the information obtained previously to graph the function between andbeyond the vertical asymptotes.
x-intercept
q1x2 = 0.
p1x2 = 0.x-intercepts
f102.y-intercept
f1-x2 = -f1x2: origin symmetry
f1-x2 = f1x2: y-axis symmetry
f
qp
f1x2 =
p1x2
q1x2,
� Graph rational functions.
Graph y = .
Shift 2 units to theright. Add 2 to each
x-coordinate.
We’ve identified twopoints and the asymptotes.
Begin with f(x) = .1x2
The graph of y = 1(x − 2)2
showing two points andthe asymptotes
The graph of g(x) = + 11(x − 2)2
showing two points and theasymptotes
(1, 1)(−1, 1)
3
4
x
y
1 2
1
2
−1−2
(3, 1)(1, 1)
3
4
x
y
1 2 3 4
1
2(3, 2)(1, 2)
3
4
x
y
1 2 3 4
1
2
1(x − 2)2 Graph g(x) = + 1.
Shift 1 unit up. Add 1 to each y-coordinate.
1(x − 2)2
y = 0y = 0 y = 0y = 0
y = 1
x = 2 x = 2x = 0
C-BLTZMC03_311-410-hr1 12-09-2008 10:46 Page 373

x -2 -134 2 4
f(x) �2x � 1x � 1
53
32
-2 373
374 Chapter 3 Polynomial and Rational Functions
Graphing a Rational Function
Graph:
SolutionStep 1 Determine symmetry.
Because does not equal either or the graph has neither symmetry nor origin symmetry.
Step 2 Find the Evaluate
The is 1, so the graph passes through (0, 1).
Step 3 Find This is done by solving where is thenumerator of
Set the numerator equal to 0.
Add 1 to both sides.
Divide both sides by 2.
The is so the graph passes through
Step 4 Find the vertical asymptote(s). Solve where is thedenominator of , thereby finding zeros of the denominator. (Note that the
numerator and denominator of have no common factors.)
Set the denominator equal to 0.
Add 1 to both sides.
The equation of the vertical asymptote is
Step 5 Find the horizontal asymptote. Because the numerator and denominator
of have the same degree, 1, the leading coefficients of the numerator
and denominator, 2 and 1, respectively, are used to obtain the equation of thehorizontal asymptote. The equation is
The equation of the horizontal asymptote is
Step 6 Plot points between and beyond each and verticalasymptote. With an at and a vertical asymptote at we evaluate
the function at and 4.-2, -1, 34
, 2,
x = 1,12x-intercept
x-intercept
y = 2.
y =
21
= 2.
f1x2 =
2x - 1x - 1
x = 1.
x = 1
x - 1 = 0
f1x2 =
2x - 1x - 1
f1x2q1x2q1x2 = 0,
A12 , 0 B .12 ,x-intercept
x =
12
2x = 1
2x - 1 = 0
f1x2.p1x2p1x2 = 0,x-intercept(s).
y-intercept
f102 =
2 # 0 - 10 - 1
=
-1-1
= 1
f102.y-intercept.
y-axis-f1x2,f1x2f1-x2
f1-x2 =
21-x2 - 1
-x - 1=
-2x - 1-x - 1
=
2x + 1x + 1
f1x2 =
2x - 1x - 1
.
EXAMPLE 5
Figure 3.33 shows these points, the the and the asymptotes.
Step 7 Graph the function. The graph of is shown in
Figure 3.34.
f1x2 =
2x - 1x - 1
x-intercept,y-intercept,
C-BLTZMC03_311-410-hr1 12-09-2008 10:46 Page 374

x -3 -1 1 3 4
f(x) �3x2
x2 � 4
275
-1 -1275
4
Section 3.5 Rational Functions and Their Graphs 375
Check Point 5 Graph:
Graphing a Rational Function
Graph:
Solution
Step 1 Determine symmetry. The graph of
is symmetric with respect to the
Step 2 Find the The is 0, so the
graph passes through the origin.
Step 3 Find the so The is 0, verifyingthat the graph passes through the origin.
Step 4 Find the vertical asymptote(s). Set (Note that the numerator
and denominator of have no common factors.)
Set the denominator equal to 0.
Add 4 to both sides.
Use the square root property.
The vertical asymptotes are and
Step 5 Find the horizontal asymptote. Because the numerator and denominator
of have the same degree, 2, their leading coefficients, 3 and 1, are
used to determine the equation of the horizontal asymptote. The equation is
Step 6 Plot points between and beyond each and verticalasymptote. With an at 0 and vertical asymptotes at and we evaluate the function at and 4.-3, -1, 1, 3,
x = 2,x = -2x-interceptx-intercept
y =31 = 3.
f1x2 =
3x2
x2- 4
x = 2.x = -2
x = ;2
x2= 4
x2- 4 = 0
f1x2 =
3x2
x2- 4
q1x2 = 0.
x-interceptx = 0:3x2= 0,x-intercept(s).
y-interceptf102 =
3 # 02
02- 4
=
0-4
= 0:y-intercept.
y-axis.f
f1-x2 =
31-x22
1-x22 - 4=
3x2
x2- 4
= f1x2:
f1x2 =
3x2
x2- 4
.
EXAMPLE 6
f1x2 =
3x - 3x - 2
.
1234
765
−2−1
−3
1 2 3 4 5−1−2−3−4−5
y
x
y = 2
x = 1
Figure 3.34 The graph of
f1x2 =
2x - 1x - 1
1234
765
−2−3
1 2 3 4 5−1−2−3−4−5
y
x
Horizontalasymptote: y = 2
Verticalasymptote: x = 1
y-intercept
x-intercept
Figure 3.33 Preparing to graph the
rational function f1x2 =
2x - 1x - 1
Technology
The graph of obtained
using the dot mode in a byviewing rectangle, verifies
that our hand-drawn graph inFigure 3.34 is correct.
3-6, 6 143-6, 6, 14
y =
2x - 1x - 1
,
Study TipBecause the graph has symmetry, it is not necessary toevaluate the even function at andagain at 3.
This also applies to evaluation at and 1.
-1
f1-32 = f132 =275
-3
y-axis
C-BLTZMC03_311-410-hr1 12-09-2008 10:46 Page 375

376 Chapter 3 Polynomial and Rational Functions
Figure 3.35 shows the points and the
the and the asymptotes.
Step 7 Graph the function. The graph of is shown in Figure 3.36.The symmetry is now obvious.y-axis
f1x2 =
3x2
x2- 4
x-intercept,y-intercept,
(4, 4), a -3, 275b , (-1, -1), (1, -1), a3,
275b ,
Check Point 6 Graph:
Example 7 illustrates that not every rational function has vertical and horizontalasymptotes.
Graphing a Rational Function
Graph:
Solution
Step 1 Determine symmetry.
The graph of is symmetric with respect to the
Step 2 Find the The is 0.
Step 3 Find the so The is 0.
Step 4 Find the vertical asymptote. Set
Set the denominator equal to 0.
Subtract 1 from both sides.
Although this equation has imaginary roots there are no real roots. Thus,the graph of has no vertical asymptotes.
Step 5 Find the horizontal asymptote. Because the degree of the numerator, 4,is greater than the degree of the denominator, 2, there is no horizontalasymptote.
Step 6 Plot points between and beyond each and vertical asymptote.With an at 0 and no vertical asymptotes, let’s look at function valuesat and 2. You can evaluate the function at 1 and 2. Use symmetryto obtain function values at and
f1-12 = f112 and f1-22 = f122.
-2:-1y-axis-2, -1, 1,
x-interceptx-intercept
f1x = ; i2,
x2= -1
x2+ 1 = 0
q1x2 = 0.
x-interceptx = 0:x4= 0,x-intercept(s).
y-interceptf102 =
04
02+ 1
=
01
= 0:y-intercept.
y-axis.f
f1-x2 =
1-x24
1-x22 + 1=
x4
x2+ 1
= f1x2
f1x2 =
x4
x2+ 1
.
EXAMPLE 7
f1x2 =
2x2
x2- 9
.
−1
1234
765
−2−3
1 2 3 4 5−1−2−3−4−5
y
x
Verticalasymptote: x = 2
Verticalasymptote: x = −2
x-intercept andy-intercept
Horizontalasymptote: y = 3
Figure 3.35 Preparing to graph
f1x2 =
3x2
x2- 4
−1
1234
765
−2−3
1 2 3 4 5−1−2−3−4−5
y
x
x = 2x = −2
y = 3
Figure 3.36 The graph of
f1x2 =
3x2
x2- 4
Technology
The graph of generated
by a graphing utility, verifies that ourhand-drawn graph is correct.
[–6, 6, 1] by [–6, 6, 1]
y =
3x2
x2- 4
,
C-BLTZMC03_311-410-hr1 12-09-2008 10:46 Page 376

Section 3.5 Rational Functions and Their Graphs 377
Step 7 Graph the function. Figure 3.37 shows the graph of using the pointsobtained from the table and symmetry. Notice that as approaches infinity or negative infinity the function values, are getting larger without bound
Check Point 7 Graph:
Slant AsymptotesExamine the graph of
shown in Figure 3.38. Note that the degree of the numerator, 2, is greater than thedegree of the denominator, 1. Thus, the graph of this function has no horizontalasymptote. However, the graph has a slant asymptote,
The graph of a rational function has a slant asymptote if the degree of thenumerator is one more than the degree of the denominator. The equation of the slantasymptote can be found by division. For example, to find the slant asymptote for the
graph of divide into
Observe that
As the value of is approximately 0. Thus, when is large,
the function is very close to This means that as or asthe graph of gets closer and closer to the line whose equation isThe line is a slant asymptote of the graph.
In general, if and have no common factors, and the degree
of is one greater than the degree of find the slant asymptote by dividing into The division will take the form
The equation of the slant asymptote is obtained by dropping the term with theremainder. Thus, the equation of the slant asymptote is y = mx + b.
p(x)
q(x)remainder
q(x).=mx+b+
Slant asymptote:y = mx + b
p1x2.q1x2q,p
qf1x2 =
p1x2
q1x2, p
y = x + 1y = x + 1.fx : - q ,
x : qy = x + 1 + 0.
ƒ x ƒ
2x - 1
ƒ x ƒ : q ,
x2+1x-1
2x-1
=x+1+f(x)= .
The equation of the slant asymptote is y = x + 1.
1x + 1 +
2x - 1
x - 1�x2+ 0x + 1
.
Remainder
1
21
0
1
1 1
11
x2+ 1:x - 1f1x2 =
x2+ 1
x - 1,
y = x + 1.
f1x2 =
x2+ 1
x - 1,
f1x2 =
x4
x2+ 2
.
3f1x2: q4.f1x2,1x : q or x : - q2,xy-axis
f
−1
1234
8765
−2
1 2 3 4 5−1−2−3−4−5
y
x
Figure 3.37 The graph of
f1x2 =
x4
x2+ 1
� Identify slant asymptotes.
−1
1234
67
5
−2−3
1 2 3 4 65−1−2−3−4
y
x
Vertical asymptote:x = 1
Slant asymptote:y = x + 1
Figure 3.38 The graph of
with a slant asymptotef1x2 =
x2+ 1
x - 1
x -2 -1 1 2
f(x) �x4
x2 � 1
165
12
12
165
C-BLTZMC03_311-410-hr1 12-09-2008 10:46 Page 377

378 Chapter 3 Polynomial and Rational Functions
Finding the Slant Asymptote of a Rational Function
Find the slant asymptote of
Solution Because the degree of the numerator, 2, is exactly one more than thedegree of the denominator, 1, and is not a factor of the graph of
has a slant asymptote. To find the equation of the slant asymptote, divide into
The equation of the slant asymptote is Using our strategy for graphing
rational functions, the graph of is shown in Figure 3.39.
Check Point 8 Find the slant asymptote of
ApplicationsThere are numerous examples of asymptotic behavior in functions that modelreal-world phenomena. Let’s consider an example from the business world.The costfunction, for a business is the sum of its fixed and variable costs:
The average cost per unit for a company to produce units is the sum of itsfixed and variable costs divided by the number of units produced. The average costfunction is a rational function that is denoted by Thus,
Average Cost for a Business
We return to the robotic exoskeleton described in the section opener. Suppose acompany that manufactures this invention has a fixed monthly cost of $1,000,000and that it costs $5000 to produce each robotic system.
a. Write the cost function, of producing robotic systems.
b. Write the average cost function, of producing robotic systems.
c. Find and interpret and
d. What is the horizontal asymptote for the graph of the average cost function,Describe what this represents for the company.
C?
C1100,0002.C110002, C110,0002,
xC,
xC,
EXAMPLE 9
Cost of producing x units:fixed plus variable costs
Number of units produced
(fixed cost)+cxxC(x)= .
C.
x
Cost per unit times thenumber of units produced, x
C(x)=(fixed cost)+cx.
C,
f1x2 =
2x2- 5x + 7x - 2
.
f1x2 =
x2- 4x - 5x - 3
y = x - 1.
Drop the remainderterm and you'll have
the equation ofthe slant asymptote.�x2-4x-5 .x-3
1x-1-8
x-3
Remainder
–5
–8–3
–4
1
3 1
3–1
x2- 4x - 5:
x - 3fx2
- 4x - 5,x - 3
f1x2 =
x2- 4x - 5x - 3
.
EXAMPLE 8
−1
1234
765
−2−3
1 2 3 4 8765−1−2
y
x
Vertical asymptote:x = 3
Slant asymptote:y = x − 1
Figure 3.39 The graph of
f1x2 =
x2- 4x - 5x - 3
� Solve applied problems involvingrational functions.
C-BLTZMC03_311-410-hr1 12-09-2008 10:46 Page 378

Section 3.5 Rational Functions and Their Graphs 379
Solutiona. The cost function, is the sum of the fixed cost and the variable costs.
b. The average cost function, is the sum of fixed and variable costs divided bythe number of robotic systems produced.
c. We evaluate at 1000, 10,000, and 100,000, interpreting the results.
The average cost per robotic system of producing 1000 systems per month is $6000.
The average cost per robotic system of producing 10,000 systems per month is$5100.
The average cost per robotic system of producing 100,000 systems per month is$5010. Notice that with higher production levels, the cost of producing eachrobotic exoskeleton decreases.
d. We developed the average cost function
in which the degree of the numerator, 1, is equal to the degree ofthe denominator, 1. The leading coefficients of the numeratorand denominator, 5000 and 1, are used to obtain the equation ofthe horizontal asymptote. The equation of the horizontalasymptote is
The horizontal asymptote is shown in Figure 3.40. This meansthat the more robotic systems produced each month, thecloser the average cost per system for the company comes to$5000. The least possible cost per robotic exoskeleton isapproaching $5000. Competitively low prices take place withhigh production levels, posing a major problem for smallbusinesses.
Check Point 9 A company is planning to manufacture wheelchairs that arelight, fast, and beautiful. The fixed monthly cost will be $500,000 and it will cost$400 to produce each radically innovative chair.
a. Write the cost function, of producing wheelchairs.
b. Write the average cost function, of producing wheelchairs.
c. Find and interpret and
d. What is the horizontal asymptote for the graph of the average cost function,Describe what this represents for the company.C?
C1100,0002.C110002, C110,0002,
xC,
xC,
y =
50001
or y = 5000.
C1x2 =
5000x + 1,000,000x
C1100,0002 =
50001100,0002 + 1,000,000
100,000= 5010
C110,0002 =
5000110,0002 + 1,000,000
10,000= 5100
C110002 =
5000110002 + 1,000,000
1000= 6000
C
C1x2 =
1,000,000 + 5000x
x or C1x2 =
5000x + 1,000,000x
C,
C(x)=1,000,000+5000x
Fixed cost is$1,000,000.
Variable cost: $5000 foreach robotic system produced
C,
6000
Number of Robotic ExoskeletonsProduced per Month
y
x1000 2000 3000 4000 5000
$4000
Ave
rage
Cos
t per
Exo
skel
eton
for
the
Com
pany
5000x + 1,000,000
y = 5000
x
Walk Man: HAL’s Average Cost
$5000
$6000
$7000
$8000
$9000
$10,000
C(x) =
Figure 3.40
C-BLTZMC03_311-410-hr1 12-09-2008 10:46 Page 379
380 Chapter 3 Polynomial and Rational Functions
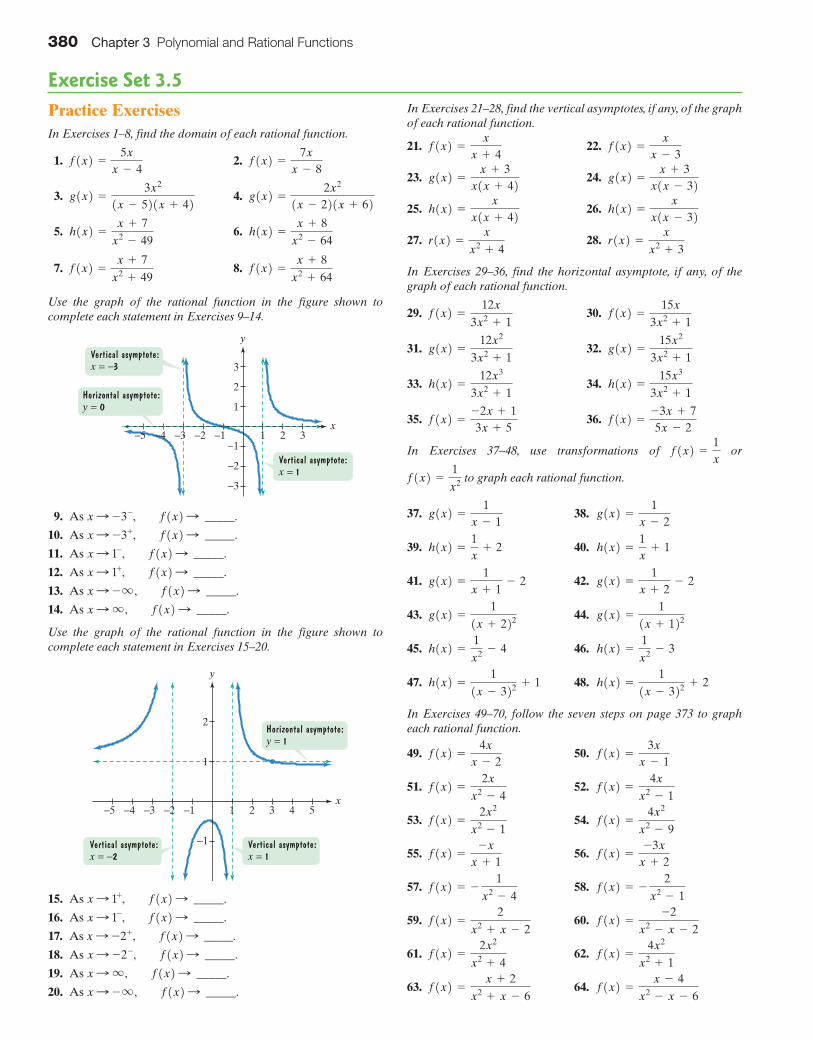
Exercise Set 3.5Practice ExercisesIn Exercises 1–8, find the domain of each rational function.
1. 2.
3. 4.
5. 6.
7. 8.
Use the graph of the rational function in the figure shown tocomplete each statement in Exercises 9–14.
9. As _____.
10. As _____.
11. As _____.
12. As _____.
13. As _____.
14. As _____.
Use the graph of the rational function in the figure shown tocomplete each statement in Exercises 15–20.
15. As _____.
16. As _____.
17. As _____.
18. As _____.
19. As _____.
20. As _____.x : - q , f1x2:x : q , f1x2:x : -2-, f1x2:x : -2+, f1x2:x : 1-, f1x2:x : 1+, f1x2:
x
1
−1
2−5
2
3 4 51−4 −3 −2 −1
y
Vertical asymptote:x = 1
Horizontal asymptote:y = 1
Vertical asymptote:x = −2
x : q , f1x2:x : - q , f1x2:x : 1+, f1x2:x : 1-, f1x2:x : -3+, f1x2:x : -3-, f1x2:
x
1
−2
2−5−1
−3
2
3
31−4 −3 −2 −1
y
Vertical asymptote:x = 1
Horizontal asymptote:y = 0
Vertical asymptote:x = −3
f1x2 =
x + 8x2
+ 64f1x2 =
x + 7x2
+ 49
h1x2 =
x + 8x2
- 64h1x2 =
x + 7x2
- 49
g1x2 =
2x2
1x - 221x + 62g1x2 =
3x2
1x - 521x + 42
f1x2 =
7x
x - 8f1x2 =
5x
x - 4
In Exercises 21–28, find the vertical asymptotes, if any, of the graphof each rational function.
21. 22.
23. 24.
25. 26.
27. 28.
In Exercises 29–36, find the horizontal asymptote, if any, of thegraph of each rational function.
29. 30.
31. 32.
33. 34.
35. 36.
In Exercises 37–48, use transformations of or
to graph each rational function.
37. 38.
39. 40.
41. 42.
43. 44.
45. 46.
47. 48.
In Exercises 49–70, follow the seven steps on page 373 to grapheach rational function.
49. 50.
51. 52.
53. 54.
55. 56.
57. 58.
59. 60.
61. 62.
63. 64. f1x2 =
x - 4x2
- x - 6f1x2 =
x + 2x2
+ x - 6
f1x2 =
4x2
x2+ 1
f1x2 =
2x2
x2+ 4
f1x2 =
-2x2
- x - 2f1x2 =
2x2
+ x - 2
f1x2 = - 2
x2- 1
f1x2 = - 1
x2- 4
f1x2 =
-3x
x + 2f1x2 =
-x
x + 1
f1x2 =
4x2
x2- 9
f1x2 =
2x2
x2- 1
f1x2 =
4x
x2- 1
f1x2 =
2x
x2- 4
f1x2 =
3x
x - 1f1x2 =
4x
x - 2
h1x2 =
11x - 322
+ 2h1x2 =
11x - 322
+ 1
h1x2 =
1x2 - 3h1x2 =
1x2 - 4
g1x2 =
11x + 122
g1x2 =
11x + 222
g1x2 =
1x + 2
- 2g1x2 =
1x + 1
- 2
h1x2 =
1x
+ 1h1x2 =
1x
+ 2
g1x2 =
1x - 2
g1x2 =
1x - 1
f1x2 =
1x2
f1x2 =
1x
f1x2 =
-3x + 75x - 2
f1x2 =
-2x + 13x + 5
h1x2 =
15x3
3x2+ 1
h1x2 =
12x3
3x2+ 1
g1x2 =
15x2
3x2+ 1
g1x2 =
12x2
3x2+ 1
f1x2 =
15x
3x2+ 1
f1x2 =
12x
3x2+ 1
r1x2 =
x
x2+ 3
r1x2 =
x
x2+ 4
h1x2 =
x
x1x - 32h1x2 =
x
x1x + 42
g1x2 =
x + 3x1x - 32
g1x2 =
x + 3x1x + 42
f1x2 =
x
x - 3f1x2 =
x
x + 4
C-BLTZMC03_311-410-hr1 12-09-2008 10:46 Page 380

Section 3.5 Rational Functions and Their Graphs 381
65. 66.
67. 68.
69. 70.
In Exercises 71–78, a. Find the slant asymptote of the graph ofeach rational function and b. Follow the seven-step strategy anduse the slant asymptote to graph each rational function.
71. 72.
73. 74.
75. 76.
77. 78.
Practice PlusIn Exercises 79–84, the equation for is given by the simplifiedexpression that results after performing the indicated operation.Write the equation for and then graph the function.
79. 80.
81. ,82.
83. 84.
In Exercises 85–88, use long division to rewrite the equation for
in the form
quotient
Then use this form of the function’s equation and transformations
of to graph
85. 86.
87. 88.
Application Exercises89. A company is planning to manufacture mountain bikes. The
fixed monthly cost will be $100,000 and it will cost $100 toproduce each bicycle.a. Write the cost function, of producing mountain
bikes.b. Write the average cost function, of producing
mountain bikes.c. Find and interpret and
d. What is the horizontal asymptote for the graph of theaverage cost function, Describe what this means inpractical terms.
C?
C140002.C15002, C110002, C120002,
xC,
xC,
g1x2 =
2x - 9x - 4
g1x2 =
3x - 7x - 2
g1x2 =
3x + 7x + 2
g1x2 =
2x + 7x + 3
g.f1x2 =
1x
+
remainder
divisor.
g
x -
1x
x +
1x
1- 3
x + 2
1 +
1x - 2
2x2
+ 3x + 2-
4x2
+ 4x + 3x
2x + 6-
9x2
- 9
x - 510x - 2
,
x2- 10x + 2525x2
- 15x2
x2- 4
#x2
+ 4x + 410x3
f
f
f1x2 =
x3- 1
x2- 9
f1x2 =
x3+ 1
x2+ 2x
f1x2 =
x2- x + 1x - 1
f1x2 =
x2+ x - 6x - 3
f1x2 =
x2+ 4x
f1x2 =
x2+ 1x
f1x2 =
x2- 4x
f1x2 =
x2- 1x
f1x2 =
x2- 4x + 31x + 122
f1x2 =
3x2+ x - 4
2x2- 5x
f1x2 =
x2
x2+ x - 6
f1x2 =
x2+ x - 12x2
- 4
f1x2 =
2x4
x2+ 1
f1x2 =
x4
x2+ 2
90. A company that manufactures running shoes has a fixedmonthly cost of $300,000. It costs $30 to produce each pairof shoes.
a. Write the cost function, of producing pairs of shoes.
b. Write the average cost function, of producing pairsof shoes.
c. Find and interpret and
d. What is the horizontal asymptote for the graph of theaverage cost function, Describe what this representsfor the company.
91. The function
models the pH level, of the human mouth minutesafter a person eats food containing sugar. The graph of thisfunction is shown in the figure.
a. Use the graph to obtain a reasonable estimate, to thenearest tenth, of the pH level of the humanmouth 42 minutes after a person eats food containingsugar.
b. After eating sugar, when is the pH level the lowest? Usethe function’s equation to determine the pH level, to thenearest tenth, at this time.
c. According to the graph, what is the normal pH level ofthe human mouth?
d. What is the equation of the horizontal asymptoteassociated with this function? Describe what this meansin terms of the mouth’s pH level over time.
e. Use the graph to describe what happens to the pH levelduring the first hour.
92. A drug is injected into a patient and the concentration of thedrug in the bloodstream is monitored. The drug’s concentra-tion, in milligrams per liter, after hours is modeled by
The graph of this rational function, obtained with a graphingutility, is shown in the figure.
5xx2 + 1
y =
[0, 10, 1] by [0, 3, 1]
C1t2 =
5t
t2+ 1
.
tC1t2,
6.5
6.0
7.0
5.5
5.0
4.5
605430 36 42 48pH
Lev
el o
f the
Hum
an M
outh
Number of Minutes afterEating Food Containing Sugar
6 12 18 24 66
4.0
f (x) =
y
x
6.5x2 − 20.4x + 234x2 + 36
xf1x2,
f1x2 =
6.5x2- 20.4x + 234x2
+ 36
C?
C1100,0002.C110002, C110,0002,
xC,
xC,
C-BLTZMC03_311-410-hr1 12-09-2008 10:46 Page 381

382 Chapter 3 Polynomial and Rational Functions
a. Use the graph at the bottom of the previous page toobtain a reasonable estimate of the drug’s concentrationafter 3 hours.
b. Use the function’s equation displayed in the voiceballoon by the graph to determine the drug’sconcentration after 3 hours.
c. Use the function’s equation to find the horizontalasymptote for the graph. Describe what this means aboutthe drug’s concentration in the patient’s bloodstream astime increases.
Among all deaths from a particular disease, the percentage that aresmoking related (21–39 cigarettes per day) is a function of thedisease’s incidence ratio.The incidence ratio describes the numberof times more likely smokers are than nonsmokers to die from thedisease. The following table shows the incidence ratios for heartdisease and lung cancer for two age groups.
For example, the incidence ratio of 9 in the table means thatsmokers between the ages of 65 and 74 are 9 times more likelythan nonsmokers in the same age group to die from lung cancer.The rational function
models the percentage of smoking-related deaths among all deathsfrom a disease, in terms of the disease’s incidence ratio,The graph of the rational function is shown. Use this function tosolve Exercises 93–96.
93. Find Describe what this means in terms of theincidence ratio, 10, given in the table. Identify your solutionas a point on the graph.
94. Find Round to the nearest percent. Describe what thismeans in terms of the incidence ratio, 9, given in the table.Identify your solution as a point on the graph.
95. What is the horizontal asymptote of the graph? Describewhat this means about the percentage of deaths caused bysmoking with increasing incidence ratios.
P192.
P1102.
Per
cent
age
of D
eath
s fr
om th
eD
isea
se T
hat A
re S
mok
ing
Rel
ated
y
x
The Disease’s Incidence Ratio:The number of times more likely smokers are
than nonsmokers to die from the disease
10987654321
100
80
60
40
20
100(x − 1)xP(x) =
x.P1x2,
P1x2 =
1001x - 12
x
96. According to the model and its graph, is there a disease forwhich all deaths are caused by smoking? Explain youranswer.
97. The bar graph shows the amount, in billions of dollars, thatthe United States government spent on human resources andtotal budget outlays for six selected years. (Human resourcesinclude education, health, Medicare, Social Security, andveterans benefits and services.)
$2000
$3200
$2400
$2800
$1600
$1200
$800
$400
Federal Budget Expenditures on Human Resources
195.
6 590.
9
1253
.2
1789
.1
2472
.2
2708
.7
Am
ount
Spe
nt (
billi
ons
of d
olla
rs)
Human Resources
Total Budget Expenditures
Year1970 1980 1990 2000 2005 2006
75.3 31
3.4 61
9.4
1115
.5 1586
.1
1707
.2
Source: Office of Management and Budget
The function models theamount, in billions of dollars, that the United Statesgovernment spent on human resources years after1970. The function models totalbudget expenditures, in billions of dollars, yearsafter 1970.
a. Use and to write a rational function that models thefraction of total budget outlays spent on humanresources years after 1970.
b. Use the data displayed by the bar graph to find thepercentage of federal expenditures spent on humanresources in 2006. Round to the nearest percent.
c. Use the rational function from part (a) to find thepercentage of federal expenditures spent on humanresources in 2006. Round to the nearest percent. Doesthis underestimate or overestimate the actual percentthat you found in part (b)? By how much?
d. What is the equation of the horizontal asymptoteassociated with the rational function in part (a)? Iftrends modeled by the function continue, what percent-age of the federal budget will be spent on humanresources over time? Round to the nearest percent. Doesthis projection seem realistic? Why or why not?
Writing in Mathematics98. What is a rational function?
99. Use everyday language to describe the graph of a rationalfunction such that as x : - q , f1x2: 3.f
x
qp
xq1x2,q1x2 = 12x2
+ 230x + 2190x
p1x2,p1x2 = 11x2
+ 40x + 1040
Incidence Ratios
Heart Disease Lung Cancer
Ages 55–64 1.9 10
Ages 65–74 1.7 9
Source: Alexander M. Walker, Observations and Inference, Epidemiology Re-sources Inc., 1991.
C-BLTZMC03_311-410-hr1 12-09-2008 10:46 Page 382

Section 3.5 Rational Functions and Their Graphs 383
100. Use everyday language to describe the behavior of a graphnear its vertical asymptote if as and
as
101. If you are given the equation of a rational function,explain howto find the vertical asymptotes, if any, of the function’s graph.
102. If you are given the equation of a rational function, explainhow to find the horizontal asymptote, if any, of the func-tion’s graph.
103. Describe how to graph a rational function.
104. If you are given the equation of a rational function, how canyou tell if the graph has a slant asymptote? If it does, howdo you find its equation?
105. Is every rational function a polynomial function? Why orwhy not? Does a true statement result if the two adjectivesrational and polynomial are reversed? Explain.
106. Although your friend has a family history of heart disease,he smokes, on average, 25 cigarettes per day. He sees thetable showing incidence ratios for heart disease (see Exer-cises 93–96) and feels comfortable that they are less than 2,compared to 9 and 10 for lung cancer. He claims that allfamily deaths have been from heart disease and decides notto give up smoking. Use the given function and its graph todescribe some additional information not given in the tablethat might influence his decision.
Technology Exercises107. Use a graphing utility to verify any five of your hand-drawn
graphs in Exercises 37–78.
108. Use a graphing utility to graph and in the
same viewing rectangle. For odd values of how does
changing affect the graph of
109. Use a graphing utility to graph and
in the same viewing rectangle. For even values of how
does changing affect the graph of
110. Use a graphing utility to graph
What differences do you observe between the graph of and the graph of How do you account for thesedifferences?
111. The rational function
models the number of arrests, per 100,000 drivers, fordriving under the influence of alcohol, as a function of adriver’s age,
a. Graph the function in a [0, 70, 5] by [0, 400, 20] viewingrectangle.
b. Describe the trend shown by the graph.
c. Use the and features or the maxi-mum function feature of your graphing utility to find theage that corresponds to the greatest number of arrests.How many arrests, per 100,000 drivers, are there for thisage group?
� TRACE �� ZOOM �
x.
f1x2,
f1x2 =
27,7251x - 142
x2+ 9
- 5x
g?f
f1x2 =
x2- 4x + 3x - 2
and g1x2 =
x2- 5x + 6x - 2
.
y =
1xn?n
n,
y =
1
x6y =
1x2 , y =
1x4 ,
y =
1xn?n
n,
1
x5y =
1x
, y =
1x3 ,
x : -2+.f1x2: - q
x : -2-f1x2: q
Critical Thinking ExercisesMake Sense? In Exercises 112–115, determine whethereach statement makes sense or does not make sense, and explainyour reasoning.
112. I’ve graphed a rational function that has two verticalasymptotes and two horizontal asymptotes.
113. My graph of has vertical asymptotes at
and
114. The function
models the fraction of nonviolent prisoners in New YorkState prisons years after 1980. I can conclude from thisequation that over time the percentage of nonviolentprisoners will exceed 60%.
115. As production level increases, the average cost for acompany to produce each unit of its product alsoincreases.
In Exercises 116–119, determine whether each statement is true orfalse. If the statement is false, make the necessary change(s) toproduce a true statement.
116. The graph of a rational function cannot have both a verticalasymptote and a horizontal asymptote.
117. It is possible to have a rational function whose graph has no
118. The graph of a rational function can have three verticalasymptotes.
119. The graph of a rational function can never cross a verticalasymptote.
In Exercises 120–123, write the equation of a rational function
having the indicated properties, in which the degrees
of and are as small as possible. More than one correct functionmay be possible. Graph your function using a graphing utility toverify that it has the required properties.
120. has a vertical asymptote given by a horizontalasymptote at and no
121. has vertical asymptotes given by and ahorizontal asymptote at at and 3, and symmetry.
122. has a vertical asymptote given by a slantasymptote whose equation is at 2, and
at and 2.
123. has no vertical, horizontal, or slant asymptotes, and no
Preview ExercisesExercises 124–126 will help you prepare for the material coveredin the next section.
124. Solve:
125. Solve:
126. Simplify:x + 1x + 3
- 2.
x3+ x2
= 4x + 4.
2x2+ x = 15.
x-intercepts.f
-1x-interceptsy = x, y-intercept
x = 1,f
y-axis-3
92 , x-interceptsy = 2, y-intercept
x = 2,x = -2f
x-intercept.-1,y = 0, y-interceptx = 3,f
qp
f1x2 =
p1x2
q1x2
y-intercept.
x
f1x2 =
1.96x + 3.143.04x + 21.79
x = 2.x = 1
y =
x - 11x - 121x - 22
C-BLTZMC03_311-410-hr1 12-09-2008 10:46 Page 383


![Graphs of Rational Functions · Unit 15 Intro to Multiplying and Dividing.notebook May 07, 2019 Record the transformations and then graph. [1] [2] 2 Graphs of Rational Functions:](https://img.pdfslide.us/doc/110x75/5f58ac8085ab135f5444a206/graphs-of-rational-functions-unit-15-intro-to-multiplying-and-dividingnotebook.jpg)