Embed Size (px)
Citation preview
Section 3.2 - Functions
•Evaluate a Function•Identify a Function Given By An Equation•Find the Domain of a Function•Graph of a Function•Vertical Line Test for Functions•Find the Domain and Range From a Graph•Definition of Increasing, Decreasing, and Constant Functions•Horizontal Line Test for a One-to-One Function•Piecewise Functions•Definition of the Greatest Integer Function
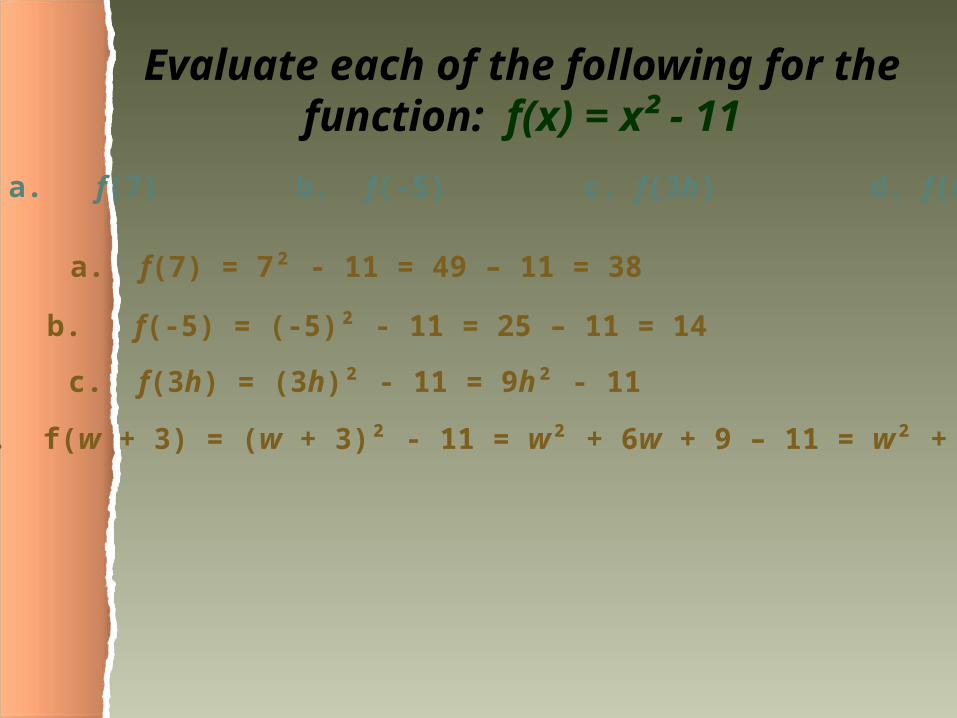
Evaluate each of the following for the function: f(x) = x² - 11
a. f(7) b. f(-5) c. f(3h) d. f(w + 3)
a. f(7) = 7² - 11 = 49 – 11 = 38
b. f(-5) = (-5)² - 11 = 25 – 11 = 14
c. f(3h) = (3h)² - 11 = 9h² - 11
d. f(w + 3) = (w + 3)² - 11 = w² + 6w + 9 – 11 = w² + 6w - 2
How to Identify a Function Given By an Equation
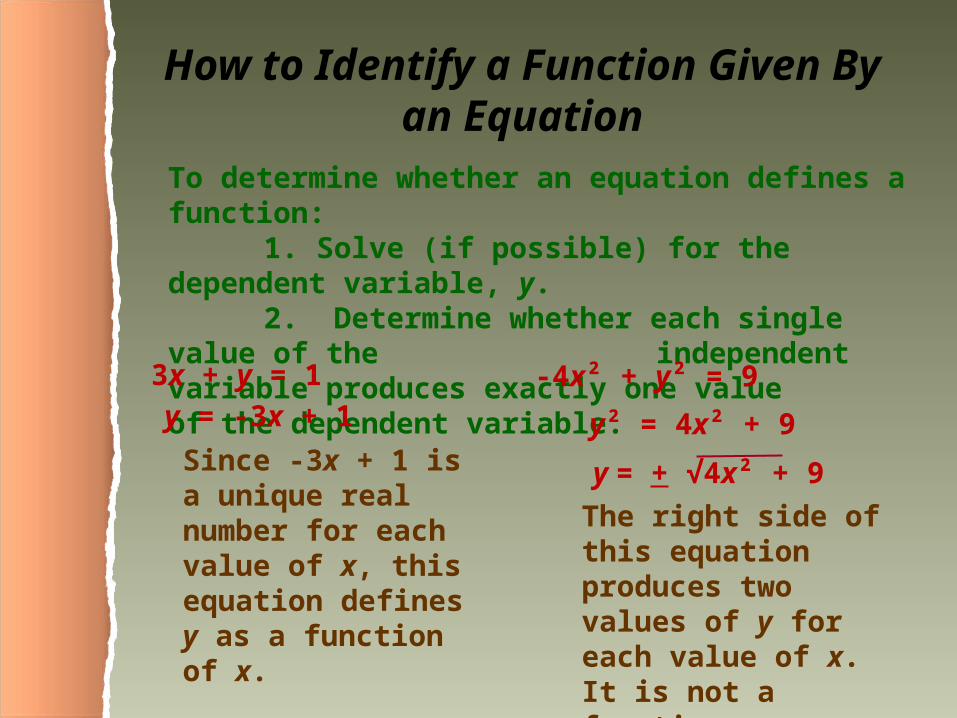
To determine whether an equation defines a function:1. Solve (if possible) for the dependent variable, y.2. Determine whether each single value of the independent variable produces exactly one value of the dependent variable.
3x + y = 1y = -3x + 1
Since -3x + 1 is a unique real number for each value of x, this equation defines y as a function of x.
-4x² + y² = 9
y² = 4x² + 9
y = + √4x² + 9The right side of this equation produces two values of y for each value of x. It is not a function.
Graph of a Function
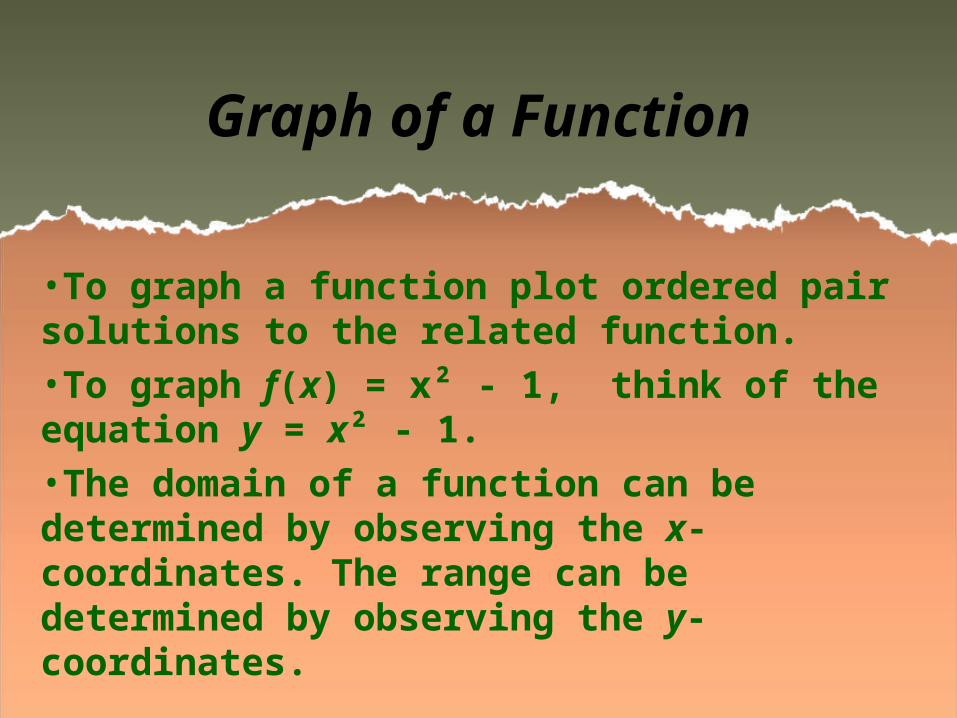
•To graph a function plot ordered pair solutions to the related function.•To graph f(x) = x² - 1, think of the equation y = x² - 1.•The domain of a function can be determined by observing the x-coordinates. The range can be determined by observing the y-coordinates.

The Vertical Line TestThe definition of a function implies that any vertical line will intersect the graph at only one point.
The Vertical Line TestA graph is the graph of a function if and only if no vertical
line intersects the graph at more than one point.

Find the Domain and Range from a Graph
Domain: The graph extends from x = 1 on the left to x = 9 on the right. So the domain is [1, 9]
Range: The graph extends from a height of y = 2 to a height of y = 12. So the range is [2, 12]
Increasing, Decreasing and Constant Functions
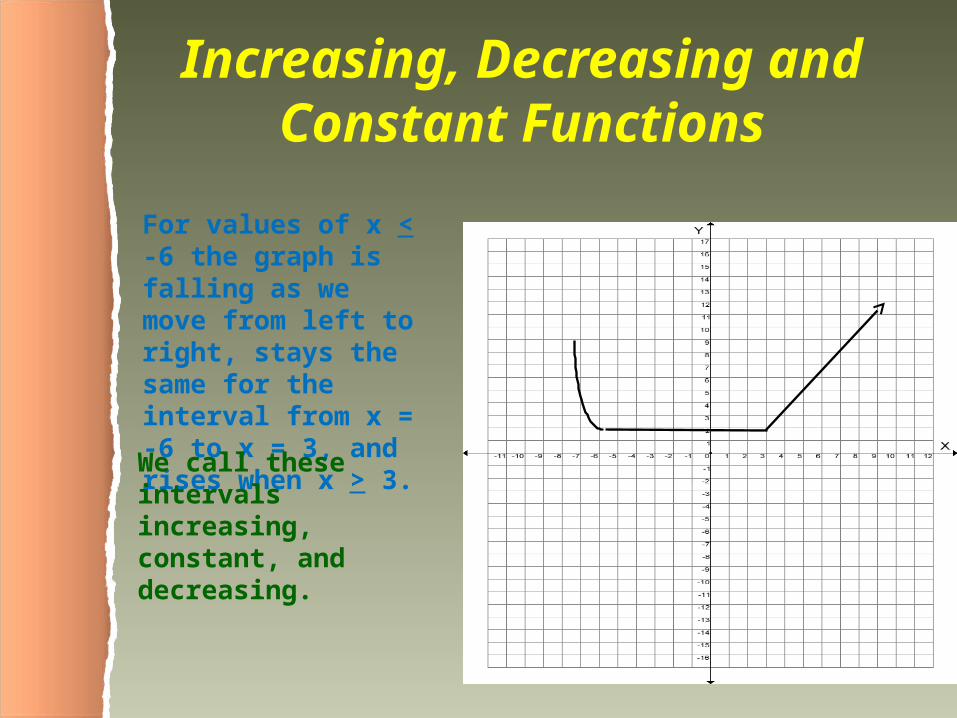
For values of x < -6 the graph is falling as we move from left to right, stays the same for the interval from x = -6 to x = 3, and rises when x > 3.
We call these intervals increasing, constant, and decreasing.
Horizontal Line Test for a one-to-one Function
If any horizontal line intersects the graph at most once, then the graph is the graph of a one-to-one function.
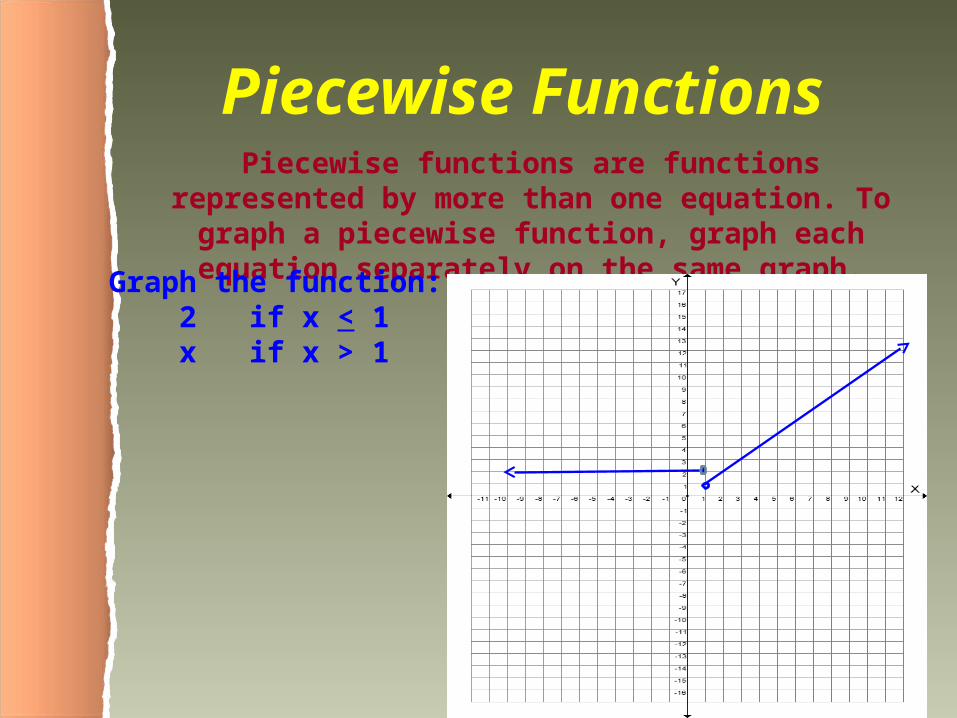
Piecewise FunctionsPiecewise functions are functions represented by more
than one equation. To graph a piecewise function, graph each equation separately on the same graph.
Graph the function: 2 if x < 1 x if x > 1
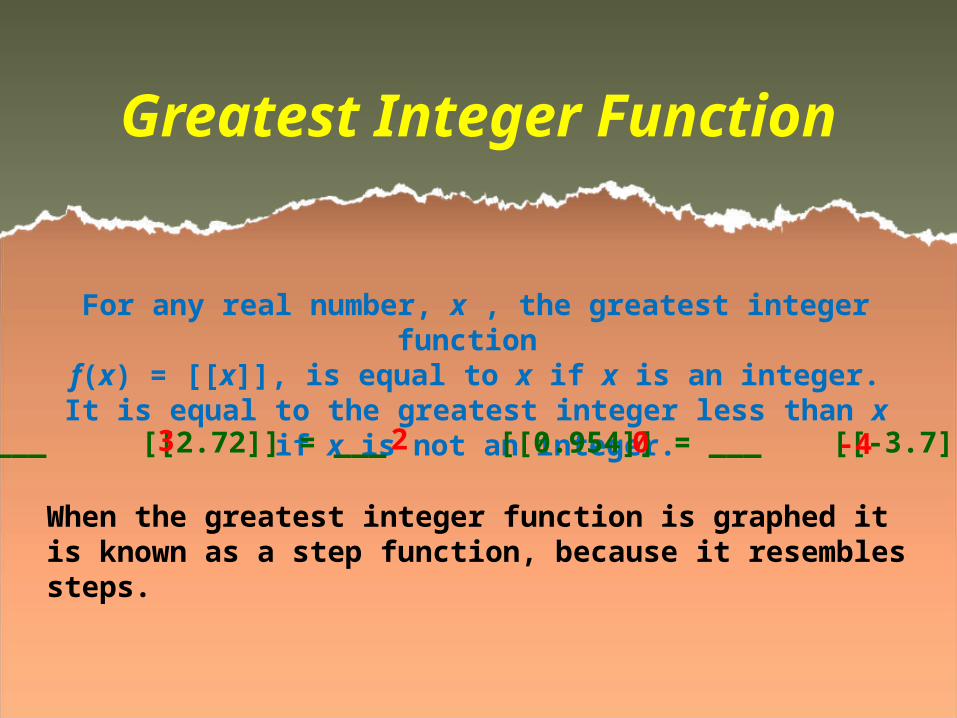
Greatest Integer Function
For any real number, x , the greatest integer function f(x) = [[x]], is equal to x if x is an integer. It is equal to the
greatest integer less than x if x is not an integer.
[[3]] = ___ [[2.72]] = ___ [[0.954]] = ___ [[-3.7]] = ____3 2 0 -4
When the greatest integer function is graphed it is known as a step function, because it resembles steps.

Solve an ApplicationA car was purchased for$16,500. Assuming the car depreciates at a constant rate of $2200 per year (straight line depreciation) for the first seven years, write the value of the car, v, as a function of time, and calculate the value of the car after 3 years.
t will represent the number of years after the car was purchased. Then 2200t is the amount that the car has depreciated after t years. So the value of the car written as a function of time will be:
v(t) = 16,500 – 2200t
After 3 years: v(3) =16,500 – 2200(3)
$9900
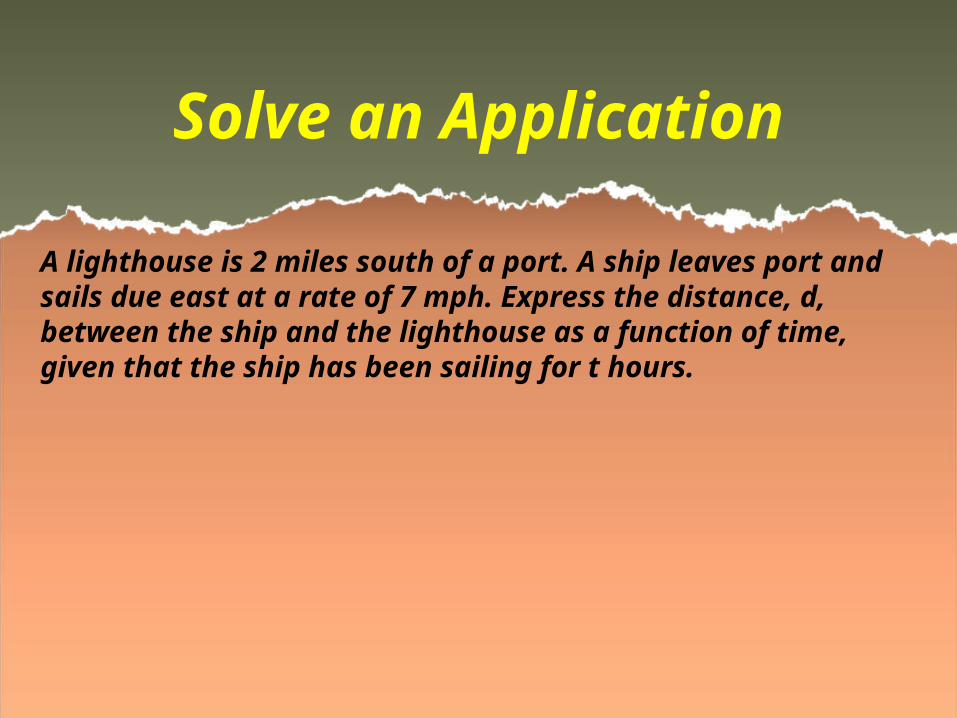
Solve an Application
A lighthouse is 2 miles south of a port. A ship leaves port and sails due east at a rate of 7 mph. Express the distance, d, between the ship and the lighthouse as a function of time, given that the ship has been sailing for t hours.

Assignment
Page 138 – 142# 1 – 9 odd, 13 – 37 odd,
39 - 68