Embed Size (px)
Citation preview
SEER Cancer Statistics Review 1975-2010 National Cancer Institute
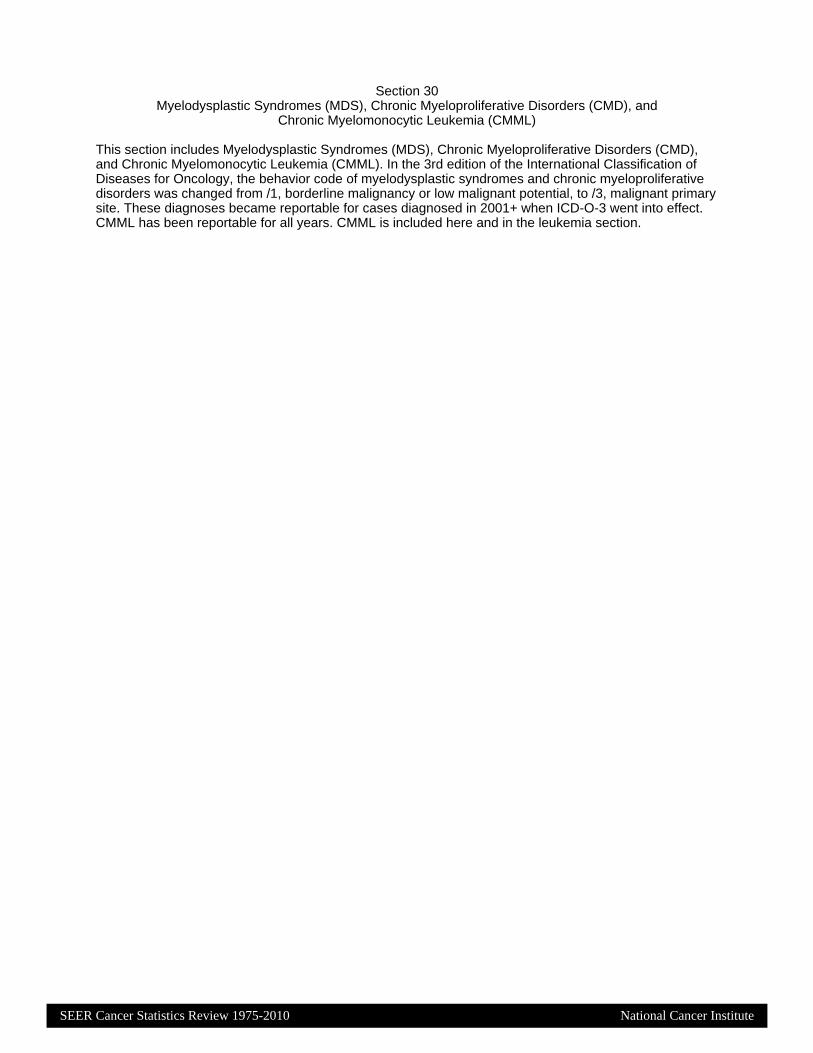
This section includes Myelodysplastic Syndromes (MDS), Chronic Myeloproliferative Disorders (CMD),and Chronic Myelomonocytic Leukemia (CMML). In the 3rd edition of the International Classification ofDiseases for Oncology, the behavior code of myelodysplastic syndromes and chronic myeloproliferativedisorders was changed from /1, borderline malignancy or low malignant potential, to /3, malignant primarysite. These diagnoses became reportable for cases diagnosed in 2001+ when ICD-O-3 went into effect.CMML has been reportable for all years. CMML is included here and in the leukemia section.
Section 30Myelodysplastic Syndromes (MDS), Chronic Myeloproliferative Disorders (CMD), and
Chronic Myelomonocytic Leukemia (CMML)
SEE
R C
ancer Statistics Review
1975-2010N
ational Cancer Institute
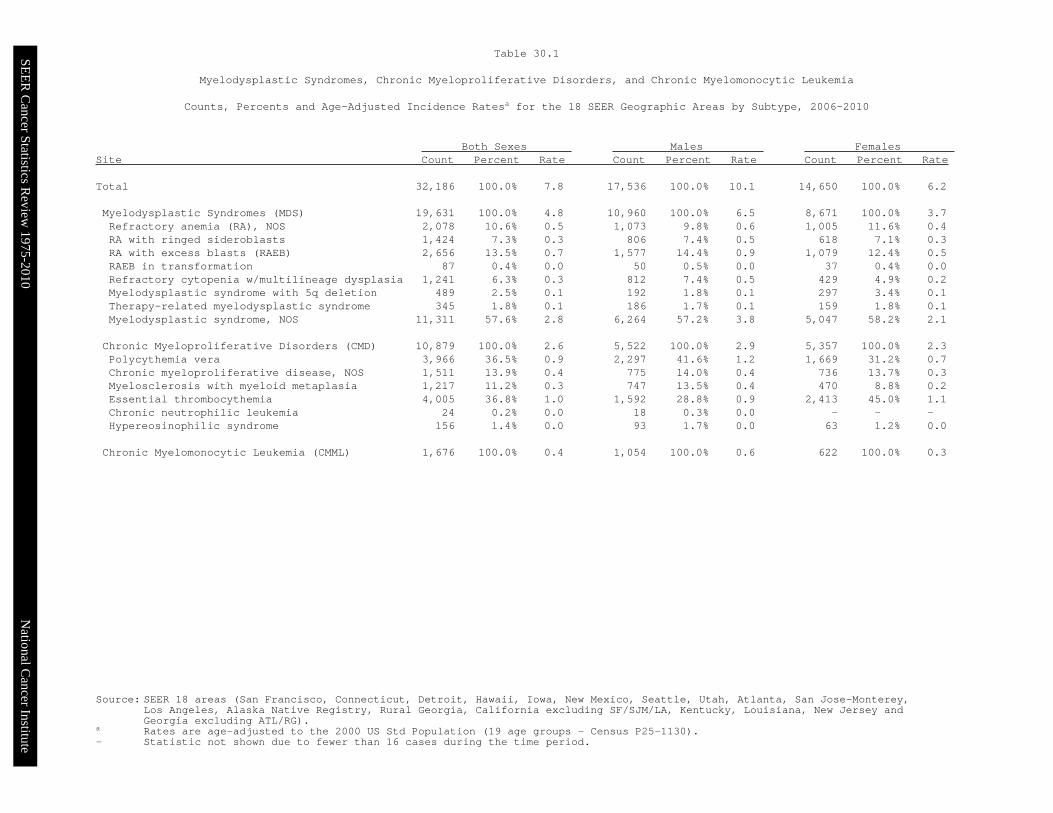
Source: SEER 18 areas (San Francisco, Connecticut, Detroit, Hawaii, Iowa, New Mexico, Seattle, Utah, Atlanta, San Jose-Monterey,Los Angeles, Alaska Native Registry, Rural Georgia, California excluding SF/SJM/LA, Kentucky, Louisiana, New Jersey andGeorgia excluding ATL/RG).
a Rates are age-adjusted to the 2000 US Std Population (19 age groups - Census P25-1130).- Statistic not shown due to fewer than 16 cases during the time period.
Both Sexes Males Females Site Count Percent Rate Count Percent Rate Count Percent Rate
Total 32,186 100.0% 7.8 17,536 100.0% 10.1 14,650 100.0% 6.2
Myelodysplastic Syndromes (MDS) 19,631 100.0% 4.8 10,960 100.0% 6.5 8,671 100.0% 3.7Refractory anemia (RA), NOS 2,078 10.6% 0.5 1,073 9.8% 0.6 1,005 11.6% 0.4RA with ringed sideroblasts 1,424 7.3% 0.3 806 7.4% 0.5 618 7.1% 0.3RA with excess blasts (RAEB) 2,656 13.5% 0.7 1,577 14.4% 0.9 1,079 12.4% 0.5RAEB in transformation 87 0.4% 0.0 50 0.5% 0.0 37 0.4% 0.0Refractory cytopenia w/multilineage dysplasia 1,241 6.3% 0.3 812 7.4% 0.5 429 4.9% 0.2Myelodysplastic syndrome with 5q deletion 489 2.5% 0.1 192 1.8% 0.1 297 3.4% 0.1Therapy-related myelodysplastic syndrome 345 1.8% 0.1 186 1.7% 0.1 159 1.8% 0.1Myelodysplastic syndrome, NOS 11,311 57.6% 2.8 6,264 57.2% 3.8 5,047 58.2% 2.1
Chronic Myeloproliferative Disorders (CMD) 10,879 100.0% 2.6 5,522 100.0% 2.9 5,357 100.0% 2.3Polycythemia vera 3,966 36.5% 0.9 2,297 41.6% 1.2 1,669 31.2% 0.7Chronic myeloproliferative disease, NOS 1,511 13.9% 0.4 775 14.0% 0.4 736 13.7% 0.3Myelosclerosis with myeloid metaplasia 1,217 11.2% 0.3 747 13.5% 0.4 470 8.8% 0.2Essential thrombocythemia 4,005 36.8% 1.0 1,592 28.8% 0.9 2,413 45.0% 1.1Chronic neutrophilic leukemia 24 0.2% 0.0 18 0.3% 0.0 - - -Hypereosinophilic syndrome 156 1.4% 0.0 93 1.7% 0.0 63 1.2% 0.0
Chronic Myelomonocytic Leukemia (CMML) 1,676 100.0% 0.4 1,054 100.0% 0.6 622 100.0% 0.3
Table 30.1
Myelodysplastic Syndromes, Chronic Myeloproliferative Disorders, and Chronic Myelomonocytic Leukemia
Counts, Percents and Age-Adjusted Incidence Ratesa for the 18 SEER Geographic Areas by Subtype, 2006-2010
SEER Cancer Statistics Review 1975-2010 National Cancer Institute
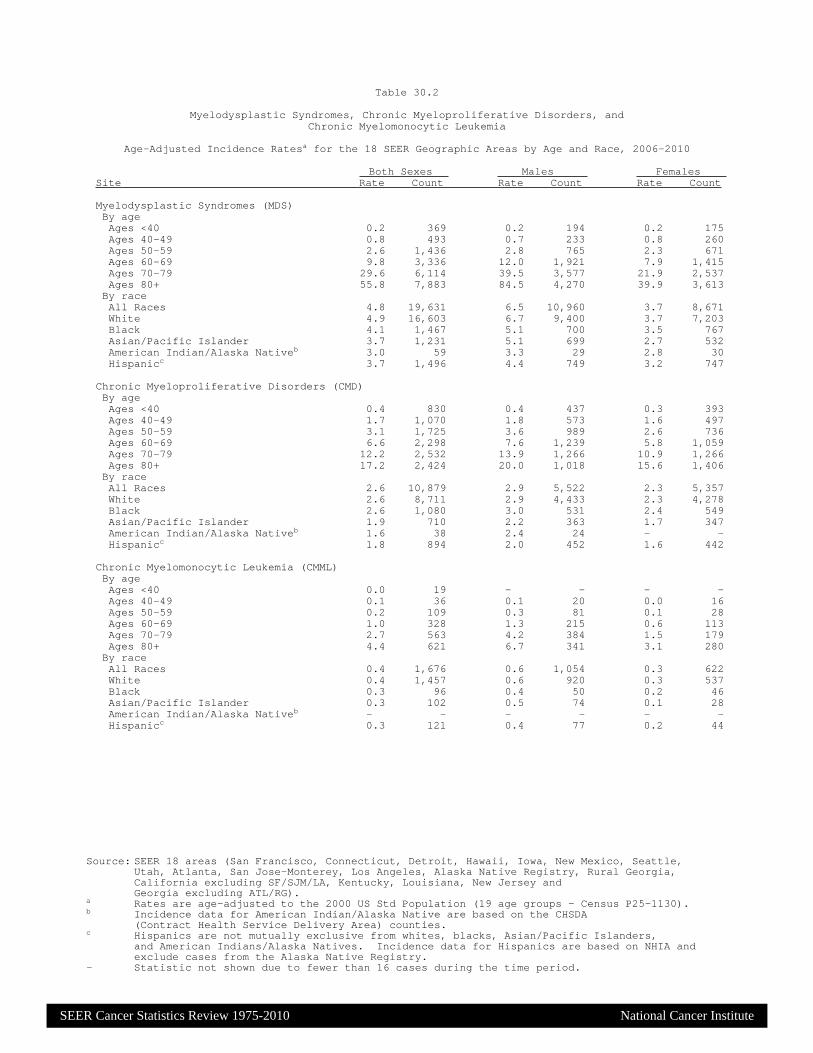
Source: SEER 18 areas (San Francisco, Connecticut, Detroit, Hawaii, Iowa, New Mexico, Seattle,Utah, Atlanta, San Jose-Monterey, Los Angeles, Alaska Native Registry, Rural Georgia,California excluding SF/SJM/LA, Kentucky, Louisiana, New Jersey andGeorgia excluding ATL/RG).
a Rates are age-adjusted to the 2000 US Std Population (19 age groups - Census P25-1130).b Incidence data for American Indian/Alaska Native are based on the CHSDA
(Contract Health Service Delivery Area) counties.c Hispanics are not mutually exclusive from whites, blacks, Asian/Pacific Islanders,
and American Indians/Alaska Natives. Incidence data for Hispanics are based on NHIA andexclude cases from the Alaska Native Registry.
- Statistic not shown due to fewer than 16 cases during the time period.
Both Sexes Males Females Site Rate Count Rate Count Rate Count
Myelodysplastic Syndromes (MDS)By ageAges <40 0.2 369 0.2 194 0.2 175Ages 40-49 0.8 493 0.7 233 0.8 260Ages 50-59 2.6 1,436 2.8 765 2.3 671Ages 60-69 9.8 3,336 12.0 1,921 7.9 1,415Ages 70-79 29.6 6,114 39.5 3,577 21.9 2,537Ages 80+ 55.8 7,883 84.5 4,270 39.9 3,613By raceAll Races 4.8 19,631 6.5 10,960 3.7 8,671White 4.9 16,603 6.7 9,400 3.7 7,203Black 4.1 1,467 5.1 700 3.5 767Asian/Pacific Islander 3.7 1,231 5.1 699 2.7 532American Indian/Alaska Nativeb 3.0 59 3.3 29 2.8 30Hispanicc 3.7 1,496 4.4 749 3.2 747
Chronic Myeloproliferative Disorders (CMD)By ageAges <40 0.4 830 0.4 437 0.3 393Ages 40-49 1.7 1,070 1.8 573 1.6 497Ages 50-59 3.1 1,725 3.6 989 2.6 736Ages 60-69 6.6 2,298 7.6 1,239 5.8 1,059Ages 70-79 12.2 2,532 13.9 1,266 10.9 1,266Ages 80+ 17.2 2,424 20.0 1,018 15.6 1,406By raceAll Races 2.6 10,879 2.9 5,522 2.3 5,357White 2.6 8,711 2.9 4,433 2.3 4,278Black 2.6 1,080 3.0 531 2.4 549Asian/Pacific Islander 1.9 710 2.2 363 1.7 347American Indian/Alaska Nativeb 1.6 38 2.4 24 - -Hispanicc 1.8 894 2.0 452 1.6 442
Chronic Myelomonocytic Leukemia (CMML)By ageAges <40 0.0 19 - - - -Ages 40-49 0.1 36 0.1 20 0.0 16Ages 50-59 0.2 109 0.3 81 0.1 28Ages 60-69 1.0 328 1.3 215 0.6 113Ages 70-79 2.7 563 4.2 384 1.5 179Ages 80+ 4.4 621 6.7 341 3.1 280By raceAll Races 0.4 1,676 0.6 1,054 0.3 622White 0.4 1,457 0.6 920 0.3 537Black 0.3 96 0.4 50 0.2 46Asian/Pacific Islander 0.3 102 0.5 74 0.1 28American Indian/Alaska Nativeb - - - - - -Hispanicc 0.3 121 0.4 77 0.2 44
Table 30.2
Myelodysplastic Syndromes, Chronic Myeloproliferative Disorders, andChronic Myelomonocytic Leukemia
Age-Adjusted Incidence Ratesa for the 18 SEER Geographic Areas by Age and Race, 2006-2010