Embed Size (px)
Citation preview
Foreign Commerce and Aid 789U.S. Census Bureau, Statistical Abstract of the United States: 2012
Section 28Foreign Commerce and Aid
This section presents data on the flow of goods, services, and capital between the United States and other countries; changes in official reserve assets of the United States; international investments; and foreign assistance programs.
The Bureau of Economic Analysis pub-lishes current figures on U.S. international transactions and the U.S. international investment position in its monthly Survey of Current Business. Statistics for the foreign aid programs are presented by the Agency for International Development (AID) in its annual U.S. Overseas Loans and Grants and Assistance from International Organizations.
The principal source of merchandise import and export data is the U.S. Census Bureau. Current data are presented monthly in U.S. International Trade in Goods and Services report Series FT 900. The Guide to Foreign TradeStatistics, found on the Census Bureau Web site at <http://www.census.gov /foreign-trade/guide/index.html>, lists the Census Bureau’s monthly and annual products and services in this field. In addition, the International Trade Administration and the Bureau of Economic Analysis present summary as well as selected commodity and country data for U.S. foreign trade on their Web sites: <http://ita.doc.gov/td/industry /otea/> and <http://www.bea.gov /international/index>, respectively. The merchandise trade data published by the Bureau of Economic Analysis in the Survey of Current Business and on the Web include balance of payments adjust-ments to the Census Bureau data. The U.S. Treasury Department’s Monthly Treasury Statement of Receipts and Outlays of the United States Government contains information on import duties. The International Trade Commission, U.S. Department of Agriculture (agricul-tural products), U.S. Department of Energy (mineral fuels, like petroleum and coal), and the U.S. Geological Survey (minerals)
release various reports and specialized products on U.S. trade.
International accounts—The international transactions tables (Tables 1286 to 1288) show, for given time periods, the transfer of goods, services, grants, and financial assets and liabilities between the United States and the rest of the world. The international investment position table (Table 1289) presents, for specific dates, the value of U.S. investments abroad and of foreign investments in the United States. The movement of foreign and U.S. capital as presented in the balance of payments is not the only factor affecting the total value of foreign investments. Among the other factors are changes in the valuation of assets or liabilities, including changes in prices of securities, defaults, expropriations, and write-offs.
Direct investment abroad means the ownership or control, directly or indirectly, by one person of 10 percent or more of the voting securities of an incorporated business enterprise or an equivalent interest in an unincorporated business enterprise. Direct investment position is the value of U.S. parents’ claims on the equity of and receivables due from foreign affiliates, less foreign affiliates’ receivables due from their U.S. parents. Income consists of parents’ shares in the earnings of their affiliates plus net interest received by parents on intercompany accounts, less withholding taxes on dividends and interest.
Foreign aid—Foreign assistance is divided into three major categories— grants (military supplies and services and other grants), credits, and other assistance (through net accumulation of foreign currency claims from the sale of agricultural commodities). Grants are transfers for which no payment is expected (other than a limited percent-age of the foreign currency ‘‘counterpart’’ funds generated by the grant), or which at most involve an obligation on the part
790 Foreign Commerce and AidU.S. Census Bureau, Statistical Abstract of the United States: 2012
of the receiver to extend aid to the United States or other countries to achieve a common objective. Credits are loan disbursements or transfers under other agreements which give rise to specific obligations to repay, over a period of years, usually with interest. All known returns to the U.S. government stemming from grants and credits (reverse grants, returns of grants, and payments of principal) are taken into account in net grants and net credits, but no allowance is made for interest or commissions. Other assistance represents the transfer of U.S. farm products in exchange for foreign currencies (plus, since enactment of Public Law 87-128, currency claims from principal and interest collected on credits extended under the farm products program), less the government’s disburse-ments of the currencies as grants, credits, or for purchases. The net acquisition of currencies represents net transfers of resources to foreign countries under the agricultural programs, in addition to those classified as grants or credits.
In 1952, economic, technical, and military aid programs were combined under the Mutual Security Act, which in turn was followed by the Foreign Assistance Act passed in 1961. Appropriations to provide military assistance were also made in the Department of Defense Appropriation Act (rather than the Foreign Assistance Appropriation Act) beginning in 1966 for certain countries in Southeast Asia and in other legislation concerning programs for specific countries (such as Israel). Figures on activity under the Foreign Assistance Act as reported in the Foreign Grants and Credits series differ from data published by AID or its immediate predecessors, due largely to differences in reporting, timing, and treatment of particular items.
Exports—The Census Bureau compiles export data primarily from Shipper’s Export Declarations required to be filed with customs officials for shipments leaving the United States. They include U.S. exports under mutual security programs and exclude shipments to U.S. Armed Forces for their own use.
The value reported in the export statistics is generally equivalent to a free along-side ship (f.a.s.) value at the U.S. port of
export, based on the transaction price, including inland freight, insurance, and other charges incurred in placing the merchandise alongside the carrier at the U.S. port of exportation. This value, as defined, excludes the cost of loading merchandise aboard the exporting carrier and also excludes freight, insurance, and any other charges or transportation and other costs beyond the U.S. port of exportation. The country of destination is defined as the country of ultimate destination or country where the merchandise is to be consumed, further processed, or manufactured, as known to the shipper at the time of exportation. When ultimate destination is not known, the shipment is statistically credited to the last country to which the shipper knows the merchandise will be shipped in the same form as exported.
Effective January 1990, the United States began substituting Canadian import statistics for U.S. exports to Canada. As a result of the data exchange between the United States and Canada, the United States has adopted the Canadian import exemption level for its export statistics based on shipments to Canada.
Data are estimated for shipments valued under $2,501 to all countries, except Canada, using factors based on the ratios of low-valued shipments to individual country totals.
Prior to 1989, exports were based on Schedule B, Statistical Classification of Domestic and Foreign Commodities Exported from the United States. Beginning in 1989, Schedule B classifications are based on the Harmonized System and coincide with the Standard International Trade Classification, Revision 3. This revision will affect the comparability of most export series beginning with the 1989 data for commodities.
Imports—The Census Bureau compiles import data from various customs forms required to be filed with customs officials. Data on import values are presented on two valuations bases in this section: The c.i.f. (cost, insurance, and freight) and the customs import value (as appraised by the U.S. Customs Service in accordance
Foreign Commerce and Aid 791U.S. Census Bureau, Statistical Abstract of the United States: 2012
with legal requirements of the Tariff Act of 1930, as amended). This latter valuation, primarily used for collection of import duties, frequently does not reflect the actual transaction value. Country of origin is defined as country where the merchan-dise was grown, mined, or manufactured. If country of origin is unknown, country of shipment is reported.
Imports are classified either as ‘‘General imports’’ or ‘‘Imports for consumption.’’ General imports are a combination of entries for immediate consumption, entries into customs bonded warehouses, and entries into U.S. Foreign Trade Zones, thus generally reflecting total arrivals of merchandise. Imports for consumptionare a combination of entries for immediate consumption, withdrawals from warehouses for consumption, and entries of merchandise into U.S. customs territory from U.S. Foreign Trade Zones, thus generally reflecting the total of the commodities entered into U.S. consumption channels.
Beginning in 1989, import statistics are based on the Harmonized Tariff Schedule of the United States, which coincides with import Standard International Trade Classification, Revision 3. This revision will affect the comparability of most import series beginning with the 1989 data.
Area coverage—Except as noted, the geographic area covered by the export and import trade statistics is the United States Customs area (includes the 50 states, the District of Columbia, and Puerto Rico), the U.S. Virgin Islands (effective January 1981), and U.S. Foreign Trade Zones (effective July 1982). Data for selected tables and total values for 1980 have been revised to reflect the U.S. Virgin Islands’ trade with foreign countries, where possible.
Statistical reliability—For a discussion of statistical collection and estimation, sampling procedures, and measures of statistical reliability applicable to Census Bureau data, see Appendix III.
ContentsForeign Commerce
and Aid 789
79
2 Fo
reign C
om
merce an
d A
id U
.S. Cen
sus Bu
reau, Statistical A
bstract o
f the U
nited
States: 20
12
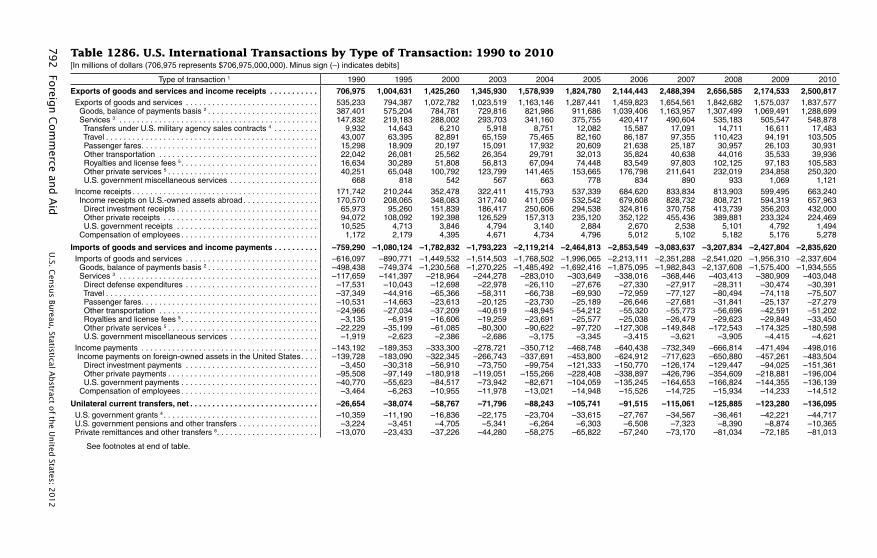
Table 1286. U.S. International Transactions by Type of Transaction: 1990 to 2010[In millions of dollars (706,975 represents $706,975,000,000). Minus sign (–) indicates debits]
Type of transaction 1 1990 1995 2000 2003 2004 2005 2006 2007 2008 2009 2010
Exports of goods and services and income receipts . . . . . . . . . . . 706,975 1,004,631 1,425,260 1,345,930 1,578,939 1,824,780 2,144,443 2,488,394 2,656,585 2,174,533 2,500,817 Exports of goods and services . . . . . . . . . . . . . . . . . . . . . . . . . . . . . . 535,233 794,387 1,072,782 1,023,519 1,163,146 1,287,441 1,459,823 1,654,561 1,842,682 1,575,037 1,837,577 Goods, balance of payments basis 2 . . . . . . . . . . . . . . . . . . . . . . . . . 387,401 575,204 784,781 729,816 821,986 911,686 1,039,406 1,163,957 1,307,499 1,069,491 1,288,699 Services 3 . . . . . . . . . . . . . . . . . . . . . . . . . . . . . . . . . . . . . . . . . . . . . 147,832 219,183 288,002 293,703 341,160 375,755 420,417 490,604 535,183 505,547 548,878 Transfers under U.S. military agency sales contracts 4 . . . . . . . . . . 9,932 14,643 6,210 5,918 8,751 12,082 15,587 17,091 14,711 16,611 17,483 Travel . . . . . . . . . . . . . . . . . . . . . . . . . . . . . . . . . . . . . . . . . . . . . . . . 43,007 63,395 82,891 65,159 75,465 82,160 86,187 97,355 110,423 94,191 103,505 Passenger fares . . . . . . . . . . . . . . . . . . . . . . . . . . . . . . . . . . . . . . . . 15,298 18,909 20,197 15,091 17,932 20,609 21,638 25,187 30,957 26,103 30,931 Other transportation . . . . . . . . . . . . . . . . . . . . . . . . . . . . . . . . . . . . 22,042 26,081 25,562 26,354 29,791 32,013 35,824 40,638 44,016 35,533 39,936 Royalties and license fees 5 . . . . . . . . . . . . . . . . . . . . . . . . . . . . . . . 16,634 30,289 51,808 56,813 67,094 74,448 83,549 97,803 102,125 97,183 105,583 Other private services 5 . . . . . . . . . . . . . . . . . . . . . . . . . . . . . . . . . . 40,251 65,048 100,792 123,799 141,465 153,665 176,798 211,641 232,019 234,858 250,320 U.S. government miscellaneous services . . . . . . . . . . . . . . . . . . . . 668 818 542 567 663 778 834 890 933 1,069 1,121 Income receipts . . . . . . . . . . . . . . . . . . . . . . . . . . . . . . . . . . . . . . . . . . 171,742 210,244 352,478 322,411 415,793 537,339 684,620 833,834 813,903 599,495 663,240 Income receipts on U.S.-owned assets abroad . . . . . . . . . . . . . . . . . 170,570 208,065 348,083 317,740 411,059 532,542 679,608 828,732 808,721 594,319 657,963 Direct investment receipts . . . . . . . . . . . . . . . . . . . . . . . . . . . . . . . . 65,973 95,260 151,839 186,417 250,606 294,538 324,816 370,758 413,739 356,203 432,000 Other private receipts . . . . . . . . . . . . . . . . . . . . . . . . . . . . . . . . . . . 94,072 108,092 192,398 126,529 157,313 235,120 352,122 455,436 389,881 233,324 224,469 U.S. government receipts . . . . . . . . . . . . . . . . . . . . . . . . . . . . . . . . 10,525 4,713 3,846 4,794 3,140 2,884 2,670 2,538 5,101 4,792 1,494 Compensation of employees . . . . . . . . . . . . . . . . . . . . . . . . . . . . . . . 1,172 2,179 4,395 4,671 4,734 4,796 5,012 5,102 5,182 5,176 5,278
Imports of goods and services and income payments . . . . . . . . . . –759,290 –1,080,124 –1,782,832 –1,793,223 –2,119,214 –2,464,813 –2,853,549 –3,083,637 –3,207,834 –2,427,804 –2,835,620 Imports of goods and services . . . . . . . . . . . . . . . . . . . . . . . . . . . . . . –616,097 –890,771 –1,449,532 –1,514,503 –1,768,502 –1,996,065 –2,213,111 –2,351,288 –2,541,020 –1,956,310 –2,337,604 Goods, balance of payments basis 2 . . . . . . . . . . . . . . . . . . . . . . . . . –498,438 –749,374 –1,230,568 –1,270,225 –1,485,492 –1,692,416 –1,875,095 –1,982,843 –2,137,608 –1,575,400 –1,934,555 Services 3 . . . . . . . . . . . . . . . . . . . . . . . . . . . . . . . . . . . . . . . . . . . . . –117,659 –141,397 –218,964 –244,278 –283,010 –303,649 –338,016 –368,446 –403,413 –380,909 –403,048 Direct defense expenditures . . . . . . . . . . . . . . . . . . . . . . . . . . . . . . –17,531 –10,043 –12,698 –22,978 –26,110 –27,676 –27,330 –27,917 –28,311 –30,474 –30,391 Travel . . . . . . . . . . . . . . . . . . . . . . . . . . . . . . . . . . . . . . . . . . . . . . . . –37,349 –44,916 –65,366 –58,311 –66,738 –69,930 –72,959 –77,127 –80,494 –74,118 –75,507 Passenger fares . . . . . . . . . . . . . . . . . . . . . . . . . . . . . . . . . . . . . . . . –10,531 –14,663 –23,613 –20,125 –23,730 –25,189 –26,646 –27,681 –31,841 –25,137 –27,279 Other transportation . . . . . . . . . . . . . . . . . . . . . . . . . . . . . . . . . . . . –24,966 –27,034 –37,209 –40,619 –48,945 –54,212 –55,320 –55,773 –56,696 –42,591 –51,202 Royalties and license fees 5 . . . . . . . . . . . . . . . . . . . . . . . . . . . . . . . –3,135 –6,919 –16,606 –19,259 –23,691 –25,577 –25,038 –26,479 –29,623 –29,849 –33,450 Other private services 5 . . . . . . . . . . . . . . . . . . . . . . . . . . . . . . . . . . –22,229 –35,199 –61,085 –80,300 –90,622 –97,720 –127,308 –149,848 –172,543 –174,325 –180,598 U.S. government miscellaneous services . . . . . . . . . . . . . . . . . . . . –1,919 –2,623 –2,386 –2,686 –3,175 –3,345 –3,415 –3,621 –3,905 –4,415 –4,621 Income payments . . . . . . . . . . . . . . . . . . . . . . . . . . . . . . . . . . . . . . . . –143,192 –189,353 –333,300 –278,721 –350,712 –468,748 –640,438 –732,349 –666,814 –471,494 –498,016 Income payments on foreign-owned assets in the United States . . . . –139,728 –183,090 –322,345 –266,743 –337,691 –453,800 –624,912 –717,623 –650,880 –457,261 –483,504 Direct investment payments . . . . . . . . . . . . . . . . . . . . . . . . . . . . . . –3,450 –30,318 –56,910 –73,750 –99,754 –121,333 –150,770 –126,174 –129,447 –94,025 –151,361 Other private payments . . . . . . . . . . . . . . . . . . . . . . . . . . . . . . . . . . –95,508 –97,149 –180,918 –119,051 –155,266 –228,408 –338,897 –426,796 –354,609 –218,881 –196,004 U.S. government payments . . . . . . . . . . . . . . . . . . . . . . . . . . . . . . . –40,770 –55,623 –84,517 –73,942 –82,671 –104,059 –135,245 –164,653 –166,824 –144,355 –136,139 Compensation of employees . . . . . . . . . . . . . . . . . . . . . . . . . . . . . . . –3,464 –6,263 –10,955 –11,978 –13,021 –14,948 –15,526 –14,725 –15,934 –14,233 –14,512
Unilateral current transfers, net . . . . . . . . . . . . . . . . . . . . . . . . . . . . . –26,654 –38,074 –58,767 –71,796 –88,243 –105,741 –91,515 –115,061 –125,885 –123,280 –136,095 U.S. government grants 4 . . . . . . . . . . . . . . . . . . . . . . . . . . . . . . . . . . . –10,359 –11,190 –16,836 –22,175 –23,704 –33,615 –27,767 –34,567 –36,461 –42,221 –44,717 U.S. government pensions and other transfers . . . . . . . . . . . . . . . . . . –3,224 –3,451 –4,705 –5,341 –6,264 –6,303 –6,508 –7,323 –8,390 –8,874 –10,365 Private remittances and other transfers 6 . . . . . . . . . . . . . . . . . . . . . . . –13,070 –23,433 –37,226 –44,280 –58,275 –65,822 –57,240 –73,170 –81,034 –72,185 –81,013
See footnotes at end of table.
Foreig
n C
om
merce an
d A
id 7
93
U.S. C
ensu
s Bureau
, Statistical Abstract o
f the U
nited
States: 20
12
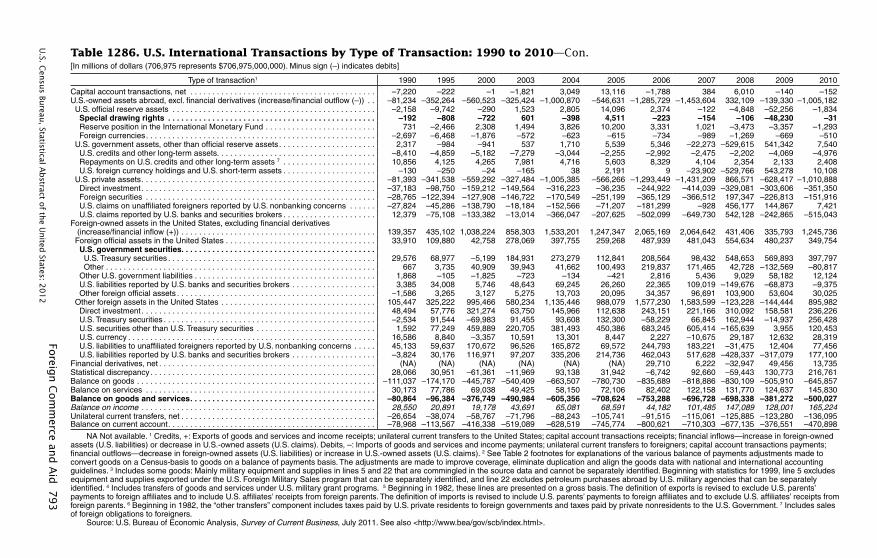
Table 1286. U.S. International Transactions by Type of Transaction: 1990 to 2010—Con.[In millions of dollars (706,975 represents $706,975,000,000). Minus sign (–) indicates debits]
Type of transaction1 1990 1995 2000 2003 2004 2005 2006 2007 2008 2009 2010Capital account transactions, net . . . . . . . . . . . . . . . . . . . . . . . . . . . . . . . . . . . . . . . . . . –7,220 –222 –1 –1,821 3,049 13,116 –1,788 384 6,010 –140 –152U.S.-owned assets abroad, excl. financial derivatives (increase/financial outflow (–)) . . –81,234 –352,264 –560,523 –325,424 –1,000,870 –546,631 –1,285,729 –1,453,604 332,109 –139,330 –1,005,182 U.S. official reserve assets . . . . . . . . . . . . . . . . . . . . . . . . . . . . . . . . . . . . . . . . . . . . . . –2,158 –9,742 –290 1,523 2,805 14,096 2,374 –122 –4,848 –52,256 –1,834 Special drawing rights . . . . . . . . . . . . . . . . . . . . . . . . . . . . . . . . . . . . . . . . . . . . . . . –192 –808 –722 601 –398 4,511 –223 –154 –106 –48,230 –31 Reserve position in the International Monetary Fund . . . . . . . . . . . . . . . . . . . . . . . . . 731 –2,466 2,308 1,494 3,826 10,200 3,331 1,021 –3,473 –3,357 –1,293 Foreign currencies . . . . . . . . . . . . . . . . . . . . . . . . . . . . . . . . . . . . . . . . . . . . . . . . . . . . –2,697 –6,468 –1,876 –572 –623 –615 –734 –989 –1,269 –669 –510 U.S. government assets, other than official reserve assets . . . . . . . . . . . . . . . . . . . . . . 2,317 –984 –941 537 1,710 5,539 5,346 –22,273 –529,615 541,342 7,540 U.S. credits and other long-term assets. . . . . . . . . . . . . . . . . . . . . . . . . . . . . . . . . . . . –8,410 –4,859 –5,182 –7,279 –3,044 –2,255 –2,992 –2,475 –2,202 –4,069 –4,976 Repayments on U.S. credits and other long-term assets 7 . . . . . . . . . . . . . . . . . . . . . 10,856 4,125 4,265 7,981 4,716 5,603 8,329 4,104 2,354 2,133 2,408 U.S. foreign currency holdings and U.S. short-term assets . . . . . . . . . . . . . . . . . . . . . –130 –250 –24 –165 38 2,191 9 –23,902 –529,766 543,278 10,108 U.S. private assets . . . . . . . . . . . . . . . . . . . . . . . . . . . . . . . . . . . . . . . . . . . . . . . . . . . . . –81,393 –341,538 –559,292 –327,484 –1,005,385 –566,266 –1,293,449 –1,431,209 866,571 –628,417 –1,010,888 Direct investment . . . . . . . . . . . . . . . . . . . . . . . . . . . . . . . . . . . . . . . . . . . . . . . . . . . . . –37,183 –98,750 –159,212 –149,564 –316,223 –36,235 –244,922 –414,039 –329,081 –303,606 –351,350 Foreign securities . . . . . . . . . . . . . . . . . . . . . . . . . . . . . . . . . . . . . . . . . . . . . . . . . . . . –28,765 –122,394 –127,908 –146,722 –170,549 –251,199 –365,129 –366,512 197,347 –226,813 –151,916 U.S. claims on unaffiliated foreigners reported by U.S. nonbanking concerns . . . . . . –27,824 –45,286 –138,790 –18,184 –152,566 –71,207 –181,299 –928 456,177 144,867 7,421 U.S. claims reported by U.S. banks and securities brokers . . . . . . . . . . . . . . . . . . . . . 12,379 –75,108 –133,382 –13,014 –366,047 –207,625 –502,099 –649,730 542,128 –242,865 –515,043Foreign-owned assets in the United States, excluding financial derivatives (increase/financial inflow (+)) . . . . . . . . . . . . . . . . . . . . . . . . . . . . . . . . . . . . . . . . . . . . 139,357 435,102 1,038,224 858,303 1,533,201 1,247,347 2,065,169 2,064,642 431,406 335,793 1,245,736 Foreign official assets in the United States . . . . . . . . . . . . . . . . . . . . . . . . . . . . . . . . . . 33,910 109,880 42,758 278,069 397,755 259,268 487,939 481,043 554,634 480,237 349,754 U .S . government securities . . . . . . . . . . . . . . . . . . . . . . . . . . . . . . . . . . . . . . . . . . . . U.S. Treasury securities . . . . . . . . . . . . . . . . . . . . . . . . . . . . . . . . . . . . . . . . . . . . . . . 29,576 68,977 –5,199 184,931 273,279 112,841 208,564 98,432 548,653 569,893 397,797 Other . . . . . . . . . . . . . . . . . . . . . . . . . . . . . . . . . . . . . . . . . . . . . . . . . . . . . . . . . . . . . 667 3,735 40,909 39,943 41,662 100,493 219,837 171,465 42,728 –132,569 –80,817 Other U.S. government liabilities . . . . . . . . . . . . . . . . . . . . . . . . . . . . . . . . . . . . . . . . . 1,868 –105 –1,825 –723 –134 –421 2,816 5,436 9,029 58,182 12,124 U.S. liabilities reported by U.S. banks and securities brokers . . . . . . . . . . . . . . . . . . . 3,385 34,008 5,746 48,643 69,245 26,260 22,365 109,019 –149,676 –68,873 –9,375 Other foreign official assets . . . . . . . . . . . . . . . . . . . . . . . . . . . . . . . . . . . . . . . . . . . . . –1,586 3,265 3,127 5,275 13,703 20,095 34,357 96,691 103,900 53,604 30,025 Other foreign assets in the United States . . . . . . . . . . . . . . . . . . . . . . . . . . . . . . . . . . . 105,447 325,222 995,466 580,234 1,135,446 988,079 1,577,230 1,583,599 –123,228 –144,444 895,982 Direct investment . . . . . . . . . . . . . . . . . . . . . . . . . . . . . . . . . . . . . . . . . . . . . . . . . . . . . 48,494 57,776 321,274 63,750 145,966 112,638 243,151 221,166 310,092 158,581 236,226 U.S. Treasury securities . . . . . . . . . . . . . . . . . . . . . . . . . . . . . . . . . . . . . . . . . . . . . . . . –2,534 91,544 –69,983 91,455 93,608 132,300 –58,229 66,845 162,944 –14,937 256,428 U.S. securities other than U.S. Treasury securities . . . . . . . . . . . . . . . . . . . . . . . . . . . 1,592 77,249 459,889 220,705 381,493 450,386 683,245 605,414 –165,639 3,955 120,453 U.S. currency . . . . . . . . . . . . . . . . . . . . . . . . . . . . . . . . . . . . . . . . . . . . . . . . . . . . . . . . 16,586 8,840 –3,357 10,591 13,301 8,447 2,227 –10,675 29,187 12,632 28,319 U.S. liabilities to unaffiliated foreigners reported by U.S. nonbanking concerns . . . . . 45,133 59,637 170,672 96,526 165,872 69,572 244,793 183,221 –31,475 12,404 77,456 U.S. liabilities reported by U.S. banks and securities brokers . . . . . . . . . . . . . . . . . . . –3,824 30,176 116,971 97,207 335,206 214,736 462,043 517,628 –428,337 –317,079 177,100Financial derivatives, net . . . . . . . . . . . . . . . . . . . . . . . . . . . . . . . . . . . . . . . . . . . . . . . . . (NA) (NA) (NA) (NA) (NA) (NA) 29,710 6,222 –32,947 49,456 13,735Statistical discrepancy . . . . . . . . . . . . . . . . . . . . . . . . . . . . . . . . . . . . . . . . . . . . . . . . . . . 28,066 30,951 –61,361 –11,969 93,138 31,942 –6,742 92,660 –59,443 130,773 216,761Balance on goods . . . . . . . . . . . . . . . . . . . . . . . . . . . . . . . . . . . . . . . . . . . . . . . . . . . . . . –111,037 –174,170 –445,787 –540,409 –663,507 –780,730 –835,689 –818,886 –830,109 –505,910 –645,857Balance on services . . . . . . . . . . . . . . . . . . . . . . . . . . . . . . . . . . . . . . . . . . . . . . . . . . . . 30,173 77,786 69,038 49,425 58,150 72,106 82,402 122,158 131,770 124,637 145,830Balance on goods and services . . . . . . . . . . . . . . . . . . . . . . . . . . . . . . . . . . . . . . . . . . –80,864 –96,384 –376,749 –490,984 –605,356 –708,624 –753,288 –696,728 –698,338 –381,272 –500,027Balance on income . . . . . . . . . . . . . . . . . . . . . . . . . . . . . . . . . . . . . . . . . . . . . . . . . . . . . 28,550 20,891 19,178 43,691 65,081 68,591 44,182 101,485 147,089 128,001 165,224Unilateral current transfers, net . . . . . . . . . . . . . . . . . . . . . . . . . . . . . . . . . . . . . . . . . . . . –26,654 –38,074 –58,767 –71,796 –88,243 –105,741 –91,515 –115,061 –125,885 –123,280 –136,095Balance on current account . . . . . . . . . . . . . . . . . . . . . . . . . . . . . . . . . . . . . . . . . . . . . . . –78,968 –113,567 –416,338 –519,089 –628,519 –745,774 –800,621 –710,303 –677,135 –376,551 –470,898
NA Not available. 1 Credits, +: Exports of goods and services and income receipts; unilateral current transfers to the United States; capital account transactions receipts; financial inflows—increase in foreign-owned assets (U.S. liabilities) or decrease in U.S.-owned assets (U.S. claims). Debits, –: Imports of goods and services and income payments; unilateral current transfers to foreigners; capital account transactions payments; financial outflows—decrease in foreign-owned assets (U.S. liabilities) or increase in U.S.-owned assets (U.S. claims). 2 See Table 2 footnotes for explanations of the various balance of payments adjustments made to convert goods on a Census-basis to goods on a balance of payments basis. The adjustments are made to improve coverage, eliminate duplication and align the goods data with national and international accounting guidelines. 3 Includes some goods: Mainly military equipment and supplies in lines 5 and 22 that are commingled in the source data and cannot be separately identified. Beginning with statistics for 1999, line 5 excludes equipment and supplies exported under the U.S. Foreign Military Sales program that can be separately identified, and line 22 excludes petroleum purchases abroad by U.S. military agencies that can be separately identified. 4 Includes transfers of goods and services under U.S. military grant programs. 5 Beginning in 1982, these lines are presented on a gross basis. The definition of exports is revised to exclude U.S. parents’payments to foreign affiliates and to include U.S. affiliates’ receipts from foreign parents. The definition of imports is revised to include U.S. parents’ payments to foreign affiliates and to exclude U.S. affiliates’ receipts from foreign parents. 6 Beginning in 1982, the “other transfers” component includes taxes paid by U.S. private residents to foreign governments and taxes paid by private nonresidents to the U.S. Government. 7 Includes sales of foreign obligations to foreigners.
Source: U.S. Bureau of Economic Analysis, Survey of Current Business, July 2011. See also <http://www.bea/gov/scb/index.html>.
794 Foreign Commerce and Aid U.S. Census Bureau, Statistical Abstract of the United States: 2012
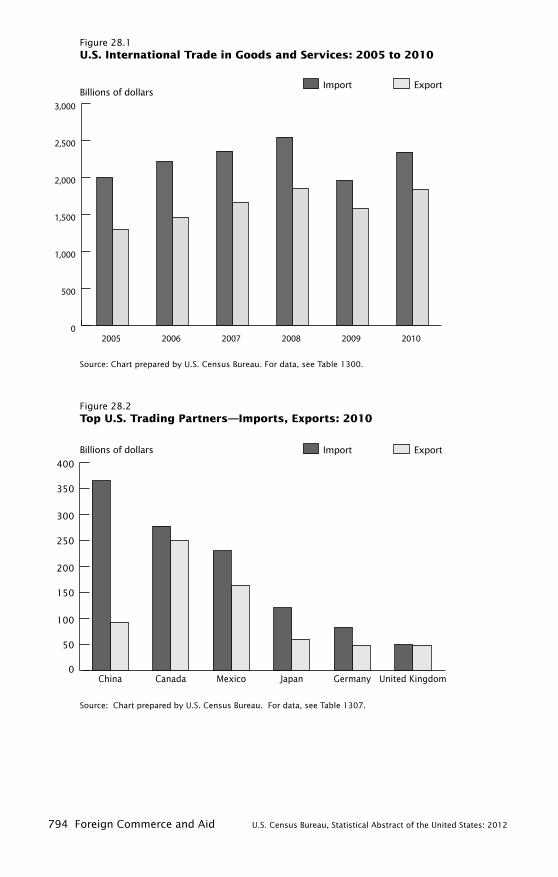
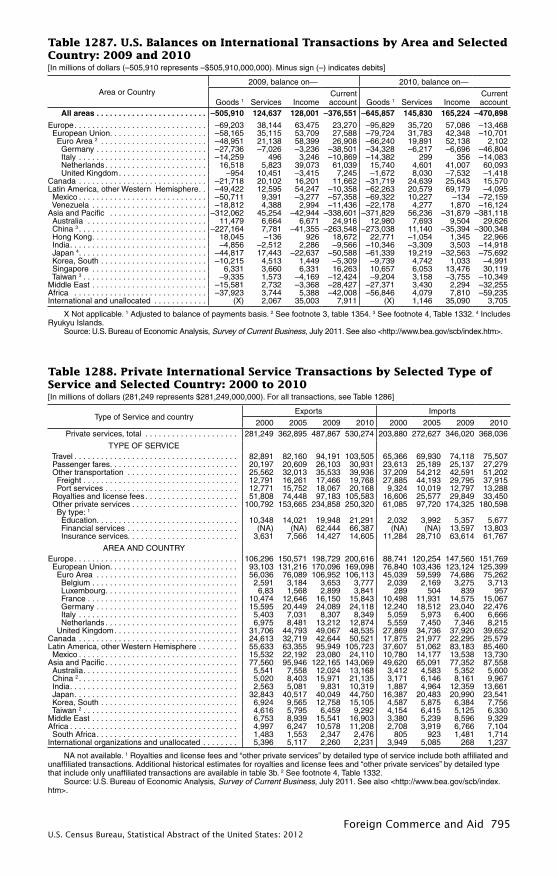
Import Export
Import Export Billions of dollars
Billions of dollars
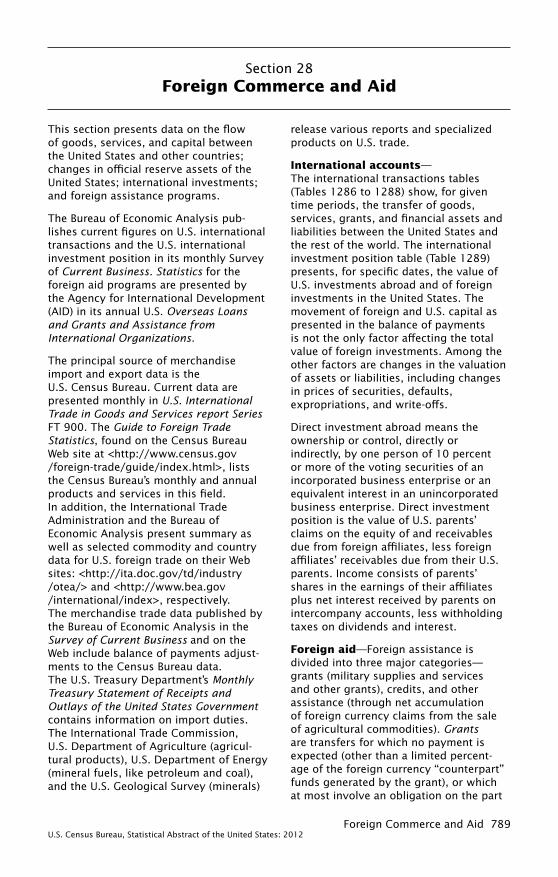
Source: Chart prepared by U.S. Census Bureau. For data, see Table 1307.
Figure 28.2Top U.S. Trading Partners—Imports, Exports: 2010
Figure 28.1U.S. International Trade in Goods and Services: 2005 to 2010
0
50
100
150
200
250
300
350
400
United KingdomGermanyJapanMexicoCanadaChina
Source: Chart prepared by U.S. Census Bureau. For data, see Table 1300.
0
500
1,000
1,500
2,000
2,500
3,000
201020092008200720062005
Foreign Commerce and Aid 795U.S. Census Bureau, Statistical Abstract of the United States: 2012
Table 1287. U.S. Balances on International Transactions by Area and Selected Country: 2009 and 2010[In millions of dollars (–505,910 represents –$505,910,000,000). Minus sign (–) indicates debits]
Area or Country2009, balance on— 2010, balance on—
Goods 1 Services IncomeCurrent account Goods 1 Services Income
Current account
All areas . . . . . . . . . . . . . . . . . . . . . . . . . –505,910 124,637 128,001 –376,551 –645,857 145,830 165,224 –470,898
Europe . . . . . . . . . . . . . . . . . . . . . . . . . . . . . . –69,203 38,144 63,475 23,270 –95,829 35,720 57,086 –13,468 European Union . . . . . . . . . . . . . . . . . . . . . . –58,165 35,115 53,709 27,588 –79,724 31,783 42,348 –10,701 Euro Area 2 . . . . . . . . . . . . . . . . . . . . . . . . –48,951 21,138 58,399 26,908 –66,240 19,891 52,138 2,102 Germany . . . . . . . . . . . . . . . . . . . . . . . . . –27,736 –7,026 –3,236 –38,501 –34,328 –6,217 –6,696 –46,804 Italy . . . . . . . . . . . . . . . . . . . . . . . . . . . . . –14,259 496 3,246 –10,869 –14,382 299 356 –14,083 Netherlands . . . . . . . . . . . . . . . . . . . . . . . 16,518 5,823 39,073 61,039 15,740 4,601 41,007 60,093 United Kingdom . . . . . . . . . . . . . . . . . . . . –954 10,451 –3,415 7,245 –1,672 8,030 –7,532 –1,418Canada . . . . . . . . . . . . . . . . . . . . . . . . . . . . . –21,718 20,102 16,201 11,662 –31,719 24,639 25,643 15,570Latin America, other Western Hemisphere . . –49,422 12,595 54,247 –10,358 –62,263 20,579 69,179 –4,095 Mexico . . . . . . . . . . . . . . . . . . . . . . . . . . . . . –50,711 9,391 –3,277 –57,358 –69,322 10,227 –134 –72,159 Venezuela . . . . . . . . . . . . . . . . . . . . . . . . . . –18,812 4,388 2,994 –11,436 –22,178 4,277 1,870 –16,124Asia and Pacific . . . . . . . . . . . . . . . . . . . . . . –312,062 45,254 –42,944 –338,601 –371,829 56,236 –31,879 –381,118 Australia . . . . . . . . . . . . . . . . . . . . . . . . . . . 11,479 6,664 6,671 24,916 12,980 7,693 9,504 29,626 China 3 . . . . . . . . . . . . . . . . . . . . . . . . . . . . . –227,164 7,781 –41,355 –263,548 –273,038 11,140 –35,394 –300,348 Hong Kong . . . . . . . . . . . . . . . . . . . . . . . . . . 18,045 –136 926 18,672 22,771 –1,054 1,345 22,966 India . . . . . . . . . . . . . . . . . . . . . . . . . . . . . . . –4,856 –2,512 2,286 –9,566 –10,346 –3,309 3,503 –14,918 Japan 4 . . . . . . . . . . . . . . . . . . . . . . . . . . . . . –44,817 17,443 –22,637 –50,588 –61,339 19,219 –32,563 –75,692 Korea, South . . . . . . . . . . . . . . . . . . . . . . . . –10,215 4,513 1,449 –5,309 –9,739 4,742 1,033 –4,991 Singapore . . . . . . . . . . . . . . . . . . . . . . . . . . 6,331 3,660 6,331 16,263 10,657 6,053 13,476 30,119 Taiwan 3 . . . . . . . . . . . . . . . . . . . . . . . . . . . . –9,335 1,573 –4,169 –12,424 –9,204 3,158 –3,755 –10,349Middle East . . . . . . . . . . . . . . . . . . . . . . . . . . –15,581 2,732 –3,368 –28,427 –27,371 3,430 2,294 –32,255Africa . . . . . . . . . . . . . . . . . . . . . . . . . . . . . . –37,923 3,744 5,388 –42,008 –56,846 4,079 7,810 –59,235International and unallocated . . . . . . . . . . . . (X) 2,067 35,003 7,911 (X) 1,146 35,090 3,705
X Not applicable. 1 Adjusted to balance of payments basis. 2 See footnote 3, table 1354. 3 See footnote 4, Table 1332. 4 Includes Ryukyu Islands.
Source: U.S. Bureau of Economic Analysis, Survey of Current Business, July 2011. See also <http://www.bea.gov/scb/index.htm>.
Table 1288. Private International Service Transactions by Selected Type of Service and Selected Country: 2000 to 2010[In millions of dollars (281,249 represents $281,249,000,000). For all transactions, see Table 1286]
Type of Service and countryExports Imports
2000 2005 2009 2010 2000 2005 2009 2010 Private services, total . . . . . . . . . . . . . . . . . . . . . 281,249 362,895 487,867 530,274 203,880 272,627 346,020 368,036
TYPE OF SERVICE Travel . . . . . . . . . . . . . . . . . . . . . . . . . . . . . . . . . . . . . 82,891 82,160 94,191 103,505 65,366 69,930 74,118 75,507 Passenger fares . . . . . . . . . . . . . . . . . . . . . . . . . . . . . 20,197 20,609 26,103 30,931 23,613 25,189 25,137 27,279 Other transportation . . . . . . . . . . . . . . . . . . . . . . . . . 25,562 32,013 35,533 39,936 37,209 54,212 42,591 51,202 Freight . . . . . . . . . . . . . . . . . . . . . . . . . . . . . . . . . . . 12,791 16,261 17,466 19,768 27,885 44,193 29,795 37,915 Port services . . . . . . . . . . . . . . . . . . . . . . . . . . . . . . 12,771 15,752 18,067 20,168 9,324 10,019 12,797 13,288 Royalties and license fees . . . . . . . . . . . . . . . . . . . . . 51,808 74,448 97,183 105,583 16,606 25,577 29,849 33,450 Other private services . . . . . . . . . . . . . . . . . . . . . . . . 100,792 153,665 234,858 250,320 61,085 97,720 174,325 180,598 By type: 1
Education . . . . . . . . . . . . . . . . . . . . . . . . . . . . . . . . 10,348 14,021 19,948 21,291 2,032 3,992 5,357 5,677 Financial services . . . . . . . . . . . . . . . . . . . . . . . . . (NA) (NA) 62,444 66,387 (NA) (NA) 13,597 13,803 Insurance services. . . . . . . . . . . . . . . . . . . . . . . . . 3,631 7,566 14,427 14,605 11,284 28,710 63,614 61,767
AREA AND COUNTRYEurope . . . . . . . . . . . . . . . . . . . . . . . . . . . . . . . . . . . . . 106,296 150,571 198,729 200,616 88,741 120,254 147,560 151,769 European Union . . . . . . . . . . . . . . . . . . . . . . . . . . . . . 93,103 131,216 170,096 169,098 76,840 103,436 123,124 125,399 Euro Area . . . . . . . . . . . . . . . . . . . . . . . . . . . . . . . . 56,036 76,089 106,952 106,113 45,039 59,599 74,686 75,262 Belgium . . . . . . . . . . . . . . . . . . . . . . . . . . . . . . . . . 2,591 3,184 3,653 3,777 2,039 2,169 3,275 3,713 Luxembourg . . . . . . . . . . . . . . . . . . . . . . . . . . . . . . 6,83 1,568 2,899 3,841 289 504 839 957 France . . . . . . . . . . . . . . . . . . . . . . . . . . . . . . . . . . 10,474 12,646 16,150 15,843 10,498 11,931 14,575 15,067 Germany . . . . . . . . . . . . . . . . . . . . . . . . . . . . . . . . 15,595 20,449 24,089 24,118 12,240 18,512 23,040 22,476 Italy . . . . . . . . . . . . . . . . . . . . . . . . . . . . . . . . . . . . 5,403 7,031 8,307 8,349 5,059 5,973 6,400 6,666 Netherlands . . . . . . . . . . . . . . . . . . . . . . . . . . . . . . 6,975 8,481 13,212 12,874 5,559 7,450 7,346 8,215 United Kingdom . . . . . . . . . . . . . . . . . . . . . . . . . . . . 31,706 44,793 49,067 48,535 27,869 34,736 37,920 39,652Canada . . . . . . . . . . . . . . . . . . . . . . . . . . . . . . . . . . . . 24,613 32,719 42,644 50,521 17,875 21,977 22,295 25,579Latin America, other Western Hemisphere . . . . . . . . . 55,633 63,355 95,949 105,723 37,607 51,062 83,183 85,460 Mexico . . . . . . . . . . . . . . . . . . . . . . . . . . . . . . . . . . . . 15,532 22,192 23,080 24,110 10,780 14,177 13,538 13,730Asia and Pacific . . . . . . . . . . . . . . . . . . . . . . . . . . . . . . 77,560 95,946 122,165 143,069 49,620 65,091 77,352 87,558 Australia . . . . . . . . . . . . . . . . . . . . . . . . . . . . . . . . . . . 5,541 7,558 12,024 13,168 3,412 4,583 5,352 5,600 China 2 . . . . . . . . . . . . . . . . . . . . . . . . . . . . . . . . . . . . 5,020 8,403 15,971 21,135 3,171 6,146 8,161 9,967 India . . . . . . . . . . . . . . . . . . . . . . . . . . . . . . . . . . . . . . 2,563 5,081 9,831 10,319 1,887 4,964 12,359 13,661 Japan . . . . . . . . . . . . . . . . . . . . . . . . . . . . . . . . . . . . . 32,843 40,517 40,049 44,750 16,387 20,483 20,990 23,541 Korea, South . . . . . . . . . . . . . . . . . . . . . . . . . . . . . . . 6,924 9,565 12,758 15,105 4,587 5,875 6,384 7,756 Taiwan 2 . . . . . . . . . . . . . . . . . . . . . . . . . . . . . . . . . . . 4,616 5,795 6,459 9,292 4,154 6,415 5,125 6,330Middle East . . . . . . . . . . . . . . . . . . . . . . . . . . . . . . . . . 6,753 8,939 15,541 16,903 3,380 5,239 8,596 9,329Africa . . . . . . . . . . . . . . . . . . . . . . . . . . . . . . . . . . . . . . 4,997 6,247 10,578 11,208 2,708 3,919 6,766 7,104 South Africa . . . . . . . . . . . . . . . . . . . . . . . . . . . . . . . . 1,483 1,553 2,347 2,476 805 923 1,481 1,714International organizations and unallocated . . . . . . . . 5,396 5,117 2,260 2,231 3,949 5,085 268 1,237
NA not available. 1 Royalties and license fees and “other private services” by detailed type of service include both affiliated and unaffiliated transactions. Additional historical estimates for royalties and license fees and “other private services” by detailed type that include only unaffiliated transactions are available in table 3b. 2 See footnote 4, Table 1332.
Source: U.S. Bureau of Economic Analysis, Survey of Current Business, July 2011. See also <http://www.bea.gov/scb/index.htm>.
796 Foreign Commerce and Aid U.S. Census Bureau, Statistical Abstract of the United States: 2012
Table 1290. U.S. Reserve Assets: 1990 to 2010[In billions of dollars (83.3 represents $83,300,000,000). As of end of year]
Type 1990 2000 2004 2005 2006 2007 2008 2009 2010 Total . . . . . . . . . . . . . . . . . . . . . 83 .3 67 .6 86 .8 65 .1 65 .9 70 .6 77 .6 130 .8 132 .4
Gold stock . . . . . . . . . . . . . . . . . . 11.1 11.0 11.0 11.0 11.0 11.0 11.0 11.0 11.0Special drawing rights . . . . . . . . . 11.0 10.5 13.6 8.2 8.9 9.5 9.3 57.8 56.8Foreign currencies . . . . . . . . . . . . 52.2 31.2 42.7 37.8 40.9 45.8 49.6 50.5 52.1Reserve position in IMF 1 . . . . . . . 9.1 14.8 19.5 8.0 5.0 4.2 7.7 11.4 12.5
1 International Monetary Fund.Source: U.S. Department of the Treasury, Treasury Bulletin, quarterly. See also <http://www.fms.treas.gov/bulletin
/index.html>.
Table 1289. International Investment Position by Type of Investment: 2000 to 2010[In billions of dollars (–1,337 represents –$1,337,000,000,000). Estimates for end of year; subject to considerable error due to nature of basic data. Unless otherwise specified, types below refer to current-cost method. For information on current-cost method and market value, see article cited in source]
Type of investment 2000 2005 2006 2007 2008 20092010,
prel.Net international investment position . . . . . . . . . . . . . . . . . . . –1,337 –1,932 –2,192 –1,796 –3,260 –2,396 –2,471 Financial derivatives, net 1 . . . . . . . . . . . . . . . . . . . . . . . . . . . . (X) 58 60 71 160 135 110 Net international investment position, excluding financial
derivatives . . . . . . . . . . . . . . . . . . . . . . . . . . . . . . . . . . . . . . . –1,337 –1,990 –2,251 –1,867 –3,420 –2,531 –2,581
U .S .-owned assets abroad . . . . . . . . . . . . . . . . . . . . . . . . . . . 6,239 11,962 14,428 18,400 19,465 18,487 20,315 Financial derivatives (gross positive fair value) 1 . . . . . . . . . . . (X) 1,190 1,239 2,559 6,127 3,501 3,653 U.S.-owned assets abroad, excluding financial derivatives . . . 6,239 10,772 13,189 15,840 13,337 14,986 16,662
U.S. official reserve assets . . . . . . . . . . . . . . . . . . . . . . . . . . . 128 188 220 277 294 404 489 Gold 2 . . . . . . . . . . . . . . . . . . . . . . . . . . . . . . . . . . . . . . . . . . . 72 134 165 218 227 284 368 Special drawing rights . . . . . . . . . . . . . . . . . . . . . . . . . . . . . . 11 8 9 9 9 58 57 Reserve position in the International Monetary Fund . . . . . . 15 8 5 4 8 11 12 Foreign currencies . . . . . . . . . . . . . . . . . . . . . . . . . . . . . . . . . 31 38 41 45 49 50 52
U.S. government assets, other than official reserve assets . . . 85 78 72 94 624 83 75 U.S. credits and other long-term assets 3 . . . . . . . . . . . . . . . 83 77 72 70 70 72 74 U.S. foreign currency holdings and U.S. short-term assets 4 . 3 1 1 24 554 11 1
U.S. private assets . . . . . . . . . . . . . . . . . . . . . . . . . . . . . . . . . . 6,025 10,506 12,897 15,469 12,419 14,500 16,099 Direct investment at current cost . . . . . . . . . . . . . . . . . . . . . 1,532 2,652 2,948 3,553 3,749 4,068 4,429 Foreign securities . . . . . . . . . . . . . . . . . . . . . . . . . . . . . . . . . 2,426 4,329 5,604 6,835 3,986 5,566 6,223 Bonds . . . . . . . . . . . . . . . . . . . . . . . . . . . . . . . . . . . . . . . . . 573 1,012 1,276 1,587 1,237 1,570 1,737 Corporate stocks . . . . . . . . . . . . . . . . . . . . . . . . . . . . . . . . . 1,853 3,318 4,329 5,248 2,748 3,995 4,486 U.S. claims on unaffiliated foreigners 2 . . . . . . . . . . . . . . . . . 837 1,018 1,184 1,233 931 862 874 U.S. claims reported by U.S. banks . . . . . . . . . . . . . . . . . . . . 1,232 2,507 3,160 3,847 3,754 4,005 4,573
Foreign-owned assets in the United States . . . . . . . . . . . . . 7,576 13,894 16,620 20,196 22,725 20,883 22,786 Financial derivatives (gross negative fair value) 1 . . . . . . . . . . (X) 1,132 1,179 2,488 5,968 3,366 3,542 Foreign-owned assets in the Unites States, excluding
financial derivatives . . . . . . . . . . . . . . . . . . . . . . . . . . . . . . . . 7,576 12,762 15,441 17,708 16,757 17,517 19,244
Foreign official assets in the United States . . . . . . . . . . . . . . . 1,037 2,313 2,833 3,412 3,944 4,403 4,864 U.S. government securities . . . . . . . . . . . . . . . . . . . . . . . . . . 756 1,725 2,167 2,540 3,264 3,589 3,957 U.S. Treasury securities . . . . . . . . . . . . . . . . . . . . . . . . . . . 640 1,341 1,558 1,737 2,401 2,880 3,321 Other . . . . . . . . . . . . . . . . . . . . . . . . . . . . . . . . . . . . . . . . . . 116 385 609 803 864 709 637 Other U.S. government liabilities . . . . . . . . . . . . . . . . . . . . . 26 23 26 32 41 99 110 U.S. liabilities reported by U.S. banks . . . . . . . . . . . . . . . . . . 153 297 297 406 256 187 178 Other foreign official assets . . . . . . . . . . . . . . . . . . . . . . . . . 102 269 343 434 383 528 618
Other foreign assets . . . . . . . . . . . . . . . . . . . . . . . . . . . . . . . . 6,539 10,448 12,608 14,296 12,813 13,115 14,380 Direct investment at current cost . . . . . . . . . . . . . . . . . . . . . . 1,421 1,906 2,154 2,346 2,397 2,442 2,659 U.S. Treasury securities . . . . . . . . . . . . . . . . . . . . . . . . . . . . . 382 644 568 640 852 792 1,065 U.S. securities other than U.S. Treasury securities . . . . . . . . 2,623 4,353 5,372 6,190 4,621 5,320 5,860 Corporate and other bonds . . . . . . . . . . . . . . . . . . . . . . . . . 1,069 2,243 2,825 3,289 2,771 2,826 2,868 Corporate stocks . . . . . . . . . . . . . . . . . . . . . . . . . . . . . . . . . 1,554 2,110 2,547 2,901 1,850 2,494 2,992 U.S. currency . . . . . . . . . . . . . . . . . . . . . . . . . . . . . . . . . . . . . 205 280 283 272 301 314 342 U.S. liabilities to unaffiliated foreigners . . . . . . . . . . . . . . . . . 739 658 799 863 741 707 748 U.S. liabilities reported by U.S. banks . . . . . . . . . . . . . . . . . . 1,169 2,607 3,431 3,985 3,901 3,540 3,707
Memoranda: . . . . . . . . . . . . . . . . . . . . . . . . . . . . . . . . . . . . . . . . Direct investment abroad at market value . . . . . . . . . . . . . . . . 2,694 3,638 4,470 5,275 3,102 4,331 4,843 Direct investment in the United States at market value . . . . . . 2,783 2,818 3,293 3,551 2,486 3,027 3,451
X Not applicable. 1 A break in series in 2005 reflects the introduction of U.S. Department of the Treasury data on financialderivatives. 2 U.S. official gold stock is valued at market price. 3 Also includes paid-in capital subscriptions to international financial institutions and resources provided to foreigners under foreign assistance programs requiring repayment over several years. Excludes World War I debts that are not being serviced. 4 Beginning in 2007, includes foreign-currency-denominated assets obtained through temporary reciprocal currency arrangements between the Federal Reserve System and foreign central banks.
Source: U.S. Bureau of Economic Analysis, Survey of Current Business, July 2011. See also <http://www.bea.gov/scb.index.htm>.
Foreign Commerce and Aid 797U.S. Census Bureau, Statistical Abstract of the United States: 2012
Table 1291. Foreign Direct Investment Position in the United States on a Historical-Cost Basis by Selected Country, 2000 to 2010, and by Industry, 2010[In millions of dollars (1,256,867 represents $1,256,867,000,000). Foreign direct investment is defined as the ownership or control, directly or indirectly, by one foreign entity (as used here, “entity” is synonymous with “person” as the term is used in a broad legal sense including any individual, branch, partnership, association, trust, corporation, or government) of 10 percent or more of the voting interest of a U.S. business enterprise. Data are based on surveys of U.S. affiliates of foreign companies]
Country
2000 2005 2008 2009
2010
Total 1Manufac-
turingWholesale
trade
Finance 2 and insur-
ance All countries . . . . . . . . . . . . . . . . 1,256,867 1,634,121 2,046,662 2,114,501 2,342,829 748,279 330,889 356,781Canada . . . . . . . . . . . . . . . . . . . . . . 114,309 165,667 168,746 202,303 206,139 35,728 5,491 65,214Europe 3 . . . . . . . . . . . . . . . . . . . . . . 887,014 1,154,048 1,477,896 1,516,268 1,697,196 585,004 189,346 284,260 Austria . . . . . . . . . . . . . . . . . . . . . . 3,007 2,425 4,251 4,455 4,353 2,234 418 2 Belgium . . . . . . . . . . . . . . . . . . . . . 14,787 10,024 23,379 37,820 43,236 20,662 7,151 (D) Denmark . . . . . . . . . . . . . . . . . . . . 4,025 6,117 5,537 6,383 9,285 3,027 (D) 1 Finland . . . . . . . . . . . . . . . . . . . . . . 8,875 5,938 7,613 7,293 6,558 4,241 1,775 (Z) France . . . . . . . . . . . . . . . . . . . . . . 125,740 114,260 141,922 157,921 184,762 71,286 18,827 22,469 Germany . . . . . . . . . . . . . . . . . . . . 122,412 177,176 173,843 191,461 212,915 69,222 16,601 41,631 Ireland . . . . . . . . . . . . . . . . . . . . . . 25,523 17,465 21,270 24,217 30,583 18,382 (D) 5,429 Italy . . . . . . . . . . . . . . . . . . . . . . . . 6,576 7,725 19,466 14,979 15,689 6,844 1,254 (D) Luxembourg . . . . . . . . . . . . . . . . . . 58,930 79,680 130,020 146,580 181,203 65,996 4,586 42,315 Netherlands . . . . . . . . . . . . . . . . . . 138,894 156,602 179,938 199,906 217,050 78,003 24,638 47,849 Norway. . . . . . . . . . . . . . . . . . . . . . 2,665 9,810 11,511 9,951 10,356 445 4,855 91 Spain . . . . . . . . . . . . . . . . . . . . . . . 5,068 7,472 30,037 38,812 40,723 4,592 55 2,437 Sweden . . . . . . . . . . . . . . . . . . . . . 21,991 22,269 32,578 35,598 40,758 25,386 10,602 142 Switzerland . . . . . . . . . . . . . . . . . . 64,719 133,387 157,121 140,745 192,231 85,074 11,799 45,348 United Kingdom . . . . . . . . . . . . . . . 277,613 371,350 447,529 416,139 432,488 93,705 82,168 73,662 Other . . . . . . . . . . . . . . . . . . . . . . . 6,188 32,348 91,878 84,008 75,006 35,906 (D) 29Latin America and other Western Hemisphere 3 . . . . . . . . . . . . . . . . . 53,691 57,175 56,538 48,300 60,074 15,454 6,649 –17,868 South and Central America 3 . . . . . 13,384 22,507 13,581 14,699 19,206 7,357 2,119 548 Brazil . . . . . . . . . . . . . . . . . . . . . . 882 2,051 16 –1,651 1,093 –1,003 1,169 (D) Mexico . . . . . . . . . . . . . . . . . . . . . 7,462 3,595 8,420 11,492 12,591 4,937 832 (D) Panama . . . . . . . . . . . . . . . . . . . . 3,819 10,983 916 1,101 1,485 632 –39 7 Venezuela . . . . . . . . . . . . . . . . . . 792 5,292 2,402 2,599 2,857 (D) –3 2 Other Western Hemisphere 3 . . . . 40,307 34,668 42,957 33,601 40,869 8,097 4,529 –18,416 Bermuda . . . . . . . . . . . . . . . . . . . 18,336 2,147 13,703 2,175 5,142 3,131 (D) –19,757 Netherlands Antilles. . . . . . . . . . . 3,807 5,531 6,351 8,024 3,680 (D) 291 32 U.K. Islands, Caribbean . . . . . . . . 15,191 23,063 27,799 25,120 31,150 4,424 3,335 1,283 Other . . . . . . . . . . . . . . . . . . . . . . 1,719 3,277 –5,132 –2,411 768 (D) 462 30Africa . . . . . . . . . . . . . . . . . . . . . . . . 2,700 2,341 1,817 1,205 2,010 135 530 –7Middle East 3 . . . . . . . . . . . . . . . . . . 6,506 8,306 16,233 16,949 15,407 3,536 6,013 (D) Israel . . . . . . . . . . . . . . . . . . . . . . . 3,012 4,231 6,752 7,109 7,231 3,582 485 (D) Saudi Arabia . . . . . . . . . . . . . . . . . (D) (D) (D) (D) (D) –55 (D) (Z)Asia and Pacific 3 . . . . . . . . . . . . . . . 192,647 246,585 325,431 329,475 362,003 108,421 122,860 (D) Australia . . . . . . . . . . . . . . . . . . . . . 18,775 36,392 37,399 41,289 49,543 5,263 75 4,348 Hong Kong . . . . . . . . . . . . . . . . . . . 1,493 3,467 4,217 4,172 4,272 (D) 1,538 12 India . . . . . . . . . . . . . . . . . . . . . . . . 96 1,497 2,820 2,375 3,344 381 20 (Z) Japan . . . . . . . . . . . . . . . . . . . . . . . 159,690 189,851 234,748 239,312 257,273 80,739 104,009 19,313 Korea, South . . . . . . . . . . . . . . . . . 3,110 6,077 12,859 13,503 15,213 2,460 12,300 161 Singapore . . . . . . . . . . . . . . . . . . . 5,087 3,338 25,801 20,658 21,831 (D) 975 (D) Taiwan 4 . . . . . . . . . . . . . . . . . . . . . 3,174 3,731 4,462 4,516 5,180 1,935 1,674 –114
D Suppressed to avoid disclosure of data of individual companies. Z Less than $500,000. 1 Includes other industries, not shown separately. 2 Excludes depository institutions 3 Includes other countries, not shown separately. 4 See footnote 4, Table 1332.
Source: U.S. Bureau of Economic Analysis, Survey of Current Business, July 2011, and previous issues.See <http://www.bea.gov/scb/index.htm>.
Table 1292. U.S. Majority-Owned Affiliates of Foreign Companies—Selected Financial and Operating Data by Industry of Affiliate: 2008[In millions of dollars, except as indicated (11,671,560 represents $11,671,560,000,000). Preliminary. A majority-owned U.S. affiliate is a U.S. business enterprise in which a foreign entity (as used here, “entity” is synonymous with “person” as the term is used in a broad legal sense including any individual, branch, partnership, association, trust, corporation, or government) has a direct or indirect voting interest greater than 50 percent]
Industry2007
NAICS Code Total
assets Sales
Employ-ment
(1,000)
Employee compen-
sation
Gross property,
plant, and equip-ment
Mer-chandise
exports
Mer-chandise
imports
All industries . . . . . . . . . . . . . . . . (X) 11,671,560 3,448,568 5,593 .5 408,453 1,442,375 232,413 566,925Manufacturing 1 . . . . . . . . . . . . . . . . . . 31–33 1,500,219 1,288,552 2,115.5 166,749 558,736 131,300 223,993 Petroleum and coal products . . . . . . . 324 115,965 226,817 38.1 5,216 69,207 (D) 63,080 Chemicals . . . . . . . . . . . . . . . . . . . . . 325 375,916 267,418 305.8 35,027 127,734 30,048 46,827 Computers and electronic products . . 334 99,150 60,476 164.7 11,071 20,915 13,229 12,823 Transportation equipment . . . . . . . . . 336 245,902 219,616 420.5 29,132 88,517 26,574 54,218Wholesale trade . . . . . . . . . . . . . . . . . . 42 695,840 1,019,137 648.8 55,753 287,568 89,824 322,319Retail trade . . . . . . . . . . . . . . . . . . . . . 44–45 68,003 120,905 464.4 14,469 41,430 700 7,303Information . . . . . . . . . . . . . . . . . . . . . . 51 254,337 101,672 249.1 23,517 53,351 968 644Finance and insurance . . . . . . . . . . . . 52, exc. 8,111,541 494,441 407.5 56,720 75,019 (D) (Z)Real estate and rental and leasing . . . 53 140,526 24,925 39.4 2,759 109,793 (D) (D)Professional, scientific, and technical services . . . . . . . . . . . . . . . . . . . . . . . 54 120,883 78,727 248.3 22,525 14,631 565 348Other industries . . . . . . . . . . . . . . . . . . (X) 780,211 320,210 1,420.5 65,960 301,848 (D) (D)
X Not applicable. D Suppressed to avoid disclosure of data of individual companies. Z Less than $500,000. 1 Includesindustries not shown separately.
Source: U.S. Bureau of Economic Analysis, Survey of Current Business, November 2010, and Foreign Direct Investment inthe United States: Operations of U .S . Affiliates of Foreign Companies, Preliminary 2008 Estimates. For more information,see <http://www.bea.gov/international/di1fdiop.htm>.
798 Foreign Commerce and Aid U.S. Census Bureau, Statistical Abstract of the United States: 2012
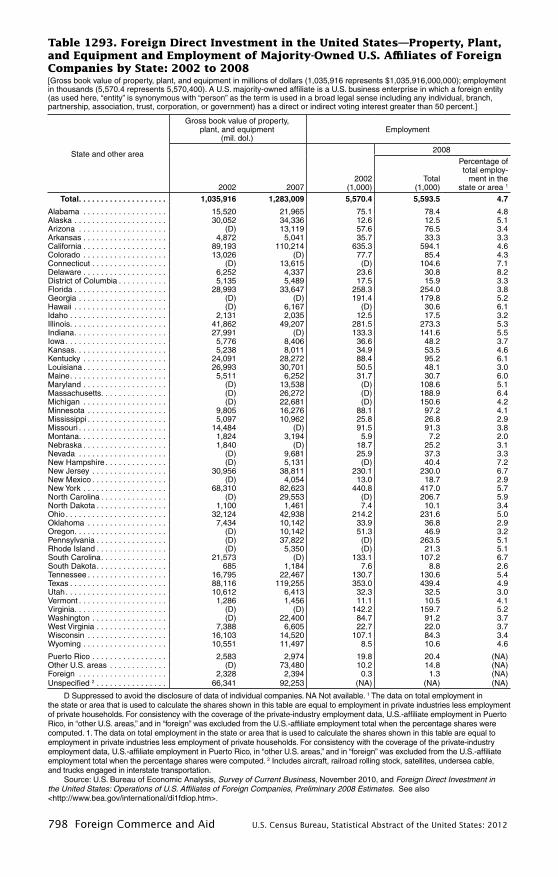
Table 1293. Foreign Direct Investment in the United States—Property, Plant, and Equipment and Employment of Majority-Owned U.S. Affiliates of Foreign Companies by State: 2002 to 2008[Gross book value of property, plant, and equipment in millions of dollars (1,035,916 represents $1,035,916,000,000); employment in thousands (5,570.4 represents 5,570,400). A U.S. majority-owned affiliate is a U.S. business enterprise in which a foreign entity (as used here, “entity” is synonymous with “person” as the term is used in a broad legal sense including any individual, branch, partnership, association, trust, corporation, or government) has a direct or indirect voting interest greater than 50 percent.]
State and other area
Gross book value of property, plant, and equipment
(mil. dol.)Employment
2002 20072002
(1,000)
2008
Total (1,000)
Percentage of total employ-
ment in the state or area 1
Total . . . . . . . . . . . . . . . . . . . . 1,035,916 1,283,009 5,570 .4 5,593 .5 4 .7
Alabama . . . . . . . . . . . . . . . . . . . 15,520 21,965 75.1 78.4 4.8Alaska . . . . . . . . . . . . . . . . . . . . . 30,052 34,336 12.6 12.5 5.1Arizona . . . . . . . . . . . . . . . . . . . . (D) 13,119 57.6 76.5 3.4Arkansas . . . . . . . . . . . . . . . . . . . 4,872 5,041 35.7 33.3 3.3California . . . . . . . . . . . . . . . . . . . 89,193 110,214 635.3 594.1 4.6Colorado . . . . . . . . . . . . . . . . . . . 13,026 (D) 77.7 85.4 4.3Connecticut . . . . . . . . . . . . . . . . . (D) 13,615 (D) 104.6 7.1Delaware . . . . . . . . . . . . . . . . . . . 6,252 4,337 23.6 30.8 8.2District of Columbia . . . . . . . . . . . 5,135 5,489 17.5 15.9 3.3Florida . . . . . . . . . . . . . . . . . . . . . 28,993 33,647 258.3 254.0 3.8Georgia . . . . . . . . . . . . . . . . . . . . (D) (D) 191.4 179.8 5.2Hawaii . . . . . . . . . . . . . . . . . . . . . (D) 6,167 (D) 30.6 6.1Idaho . . . . . . . . . . . . . . . . . . . . . . 2,131 2,035 12.5 17.5 3.2Illinois . . . . . . . . . . . . . . . . . . . . . . 41,862 49,207 281.5 273.3 5.3Indiana . . . . . . . . . . . . . . . . . . . . . 27,991 (D) 133.3 141.6 5.5Iowa . . . . . . . . . . . . . . . . . . . . . . . 5,776 8,406 36.6 48.2 3.7Kansas . . . . . . . . . . . . . . . . . . . . . 5,238 8,011 34.9 53.5 4.6Kentucky . . . . . . . . . . . . . . . . . . . 24,091 28,272 88.4 95.2 6.1Louisiana . . . . . . . . . . . . . . . . . . . 26,993 30,701 50.5 48.1 3.0Maine . . . . . . . . . . . . . . . . . . . . . . 5,511 6,252 31.7 30.7 6.0Maryland . . . . . . . . . . . . . . . . . . . (D) 13,538 (D) 108.6 5.1Massachusetts . . . . . . . . . . . . . . . (D) 26,272 (D) 188.9 6.4Michigan . . . . . . . . . . . . . . . . . . . (D) 22,681 (D) 150.6 4.2Minnesota . . . . . . . . . . . . . . . . . . 9,805 16,276 88.1 97.2 4.1Mississippi . . . . . . . . . . . . . . . . . . 5,097 10,962 25.8 26.8 2.9Missouri . . . . . . . . . . . . . . . . . . . . 14,484 (D) 91.5 91.3 3.8Montana . . . . . . . . . . . . . . . . . . . . 1,824 3,194 5.9 7.2 2.0Nebraska . . . . . . . . . . . . . . . . . . . 1,840 (D) 18.7 25.2 3.1Nevada . . . . . . . . . . . . . . . . . . . . (D) 9,681 25.9 37.3 3.3New Hampshire . . . . . . . . . . . . . . (D) 5,131 (D) 40.4 7.2New Jersey . . . . . . . . . . . . . . . . . 30,956 38,811 230.1 230.0 6.7New Mexico . . . . . . . . . . . . . . . . . (D) 4,054 13.0 18.7 2.9New York . . . . . . . . . . . . . . . . . . . 68,310 82,623 440.8 417.0 5.7North Carolina . . . . . . . . . . . . . . . (D) 29,553 (D) 206.7 5.9North Dakota . . . . . . . . . . . . . . . . 1,100 1,461 7.4 10.1 3.4Ohio . . . . . . . . . . . . . . . . . . . . . . . 32,124 42,938 214.2 231.6 5.0Oklahoma . . . . . . . . . . . . . . . . . . 7,434 10,142 33.9 36.8 2.9Oregon . . . . . . . . . . . . . . . . . . . . . (D) 10,142 51.3 46.9 3.2Pennsylvania . . . . . . . . . . . . . . . . (D) 37,822 (D) 263.5 5.1Rhode Island . . . . . . . . . . . . . . . . (D) 5,350 (D) 21.3 5.1South Carolina . . . . . . . . . . . . . . . 21,573 (D) 133.1 107.2 6.7South Dakota . . . . . . . . . . . . . . . . 685 1,184 7.6 8.8 2.6Tennessee . . . . . . . . . . . . . . . . . . 16,795 22,467 130.7 130.6 5.4Texas . . . . . . . . . . . . . . . . . . . . . . 88,116 119,255 353.0 439.4 4.9Utah . . . . . . . . . . . . . . . . . . . . . . . 10,612 6,413 32.3 32.5 3.0Vermont . . . . . . . . . . . . . . . . . . . . 1,286 1,456 11.1 10.5 4.1Virginia . . . . . . . . . . . . . . . . . . . . . (D) (D) 142.2 159.7 5.2Washington . . . . . . . . . . . . . . . . . (D) 22,400 84.7 91.2 3.7West Virginia . . . . . . . . . . . . . . . . 7,388 6,605 22.7 22.0 3.7Wisconsin . . . . . . . . . . . . . . . . . . 16,103 14,520 107.1 84.3 3.4Wyoming . . . . . . . . . . . . . . . . . . . 10,551 11,497 8.5 10.6 4.6
Puerto Rico . . . . . . . . . . . . . . . . . 2,583 2,974 19.8 20.4 (NA)Other U.S. areas . . . . . . . . . . . . . (D) 73,480 10.2 14.8 (NA)Foreign . . . . . . . . . . . . . . . . . . . . 2,328 2,394 0.3 1.3 (NA)Unspecified 2 . . . . . . . . . . . . . . . . 66,341 92,253 (NA) (NA) (NA)
D Suppressed to avoid the disclosure of data of individual companies. NA Not available. 1 The data on total employment inthe state or area that is used to calculate the shares shown in this table are equal to employment in private industries less employment of private households. For consistency with the coverage of the private-industry employment data, U.S.-affiliate employment in Puerto Rico, in “other U.S. areas,” and in “foreign” was excluded from the U.S.-affiliate employment total when the percentage shares were computed. 1. The data on total employment in the state or area that is used to calculate the shares shown in this table are equal to employment in private industries less employment of private households. For consistency with the coverage of the private-industry employment data, U.S.-affiliate employment in Puerto Rico, in “other U.S. areas,” and in “foreign” was excluded from the U.S.-affiliate employment total when the percentage shares were computed. 2 Includes aircraft, railroad rolling stock, satellites, undersea cable,and trucks engaged in interstate transportation.
Source: U.S. Bureau of Economic Analysis, Survey of Current Business, November 2010, and Foreign Direct Investment inthe United States: Operations of U .S . Affiliates of Foreign Companies, Preliminary 2008 Estimates. See also <http://www.bea.gov/international/di1fdiop.htm>.
Foreign Commerce and Aid 799U.S. Census Bureau, Statistical Abstract of the United States: 2012
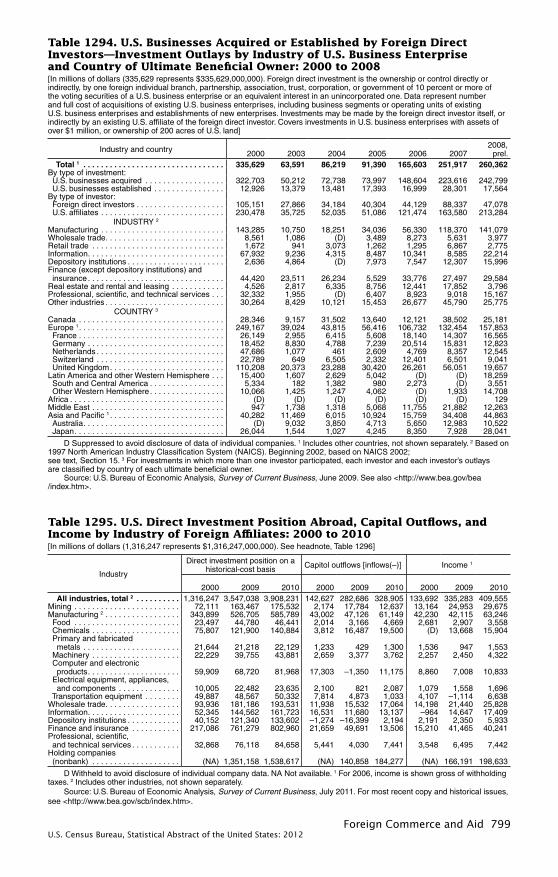
Table 1294. U.S. Businesses Acquired or Established by Foreign Direct Investors—Investment Outlays by Industry of U.S. Business Enterprise and Country of Ultimate Beneficial Owner: 2000 to 2008[In millions of dollars (335,629 represents $335,629,000,000). Foreign direct investment is the ownership or control directly or indirectly, by one foreign individual branch, partnership, association, trust, corporation, or government of 10 percent or more of the voting securities of a U.S. business enterprise or an equivalent interest in an unincorporated one. Data represent number and full cost of acquisitions of existing U.S. business enterprises, including business segments or operating units of existing U.S. business enterprises and establishments of new enterprises. Investments may be made by the foreign direct investor itself, or indirectly by an existing U.S. affiliate of the foreign direct investor. Covers investments in U.S. business enterprises with assets of over $1 million, or ownership of 200 acres of U.S. land]
Industry and country 2000 2003 2004 2005 2006 20072008,
prel. Total 1 . . . . . . . . . . . . . . . . . . . . . . . . . . . . . . . . 335,629 63,591 86,219 91,390 165,603 251,917 260,362By type of investment: U.S. businesses acquired . . . . . . . . . . . . . . . . . . 322,703 50,212 72,738 73,997 148,604 223,616 242,799 U.S. businesses established . . . . . . . . . . . . . . . . 12,926 13,379 13,481 17,393 16,999 28,301 17,564By type of investor: Foreign direct investors . . . . . . . . . . . . . . . . . . . . 105,151 27,866 34,184 40,304 44,129 88,337 47,078 U.S. affiliates . . . . . . . . . . . . . . . . . . . . . . . . . . . . 230,478 35,725 52,035 51,086 121,474 163,580 213,284
INDUSTRY 2
Manufacturing . . . . . . . . . . . . . . . . . . . . . . . . . . . . 143,285 10,750 18,251 34,036 56,330 118,370 141,079Wholesale trade . . . . . . . . . . . . . . . . . . . . . . . . . . . 8,561 1,086 (D) 3,489 8,273 5,631 3,977Retail trade . . . . . . . . . . . . . . . . . . . . . . . . . . . . . . 1,672 941 3,073 1,262 1,295 6,867 2,775Information . . . . . . . . . . . . . . . . . . . . . . . . . . . . . . . 67,932 9,236 4,315 8,487 10,341 8,585 22,214Depository institutions . . . . . . . . . . . . . . . . . . . . . . 2,636 4,864 (D) 7,973 7,547 12,307 15,996Finance (except depository institutions) and insurance . . . . . . . . . . . . . . . . . . . . . . . . . . . . . . . 44,420 23,511 26,234 5,529 33,776 27,497 29,584Real estate and rental and leasing . . . . . . . . . . . . 4,526 2,817 6,335 8,756 12,441 17,852 3,796Professional, scientific, and technical services . . . 32,332 1,955 (D) 6,407 8,923 9,018 15,167Other industries . . . . . . . . . . . . . . . . . . . . . . . . . . . 30,264 8,429 10,121 15,453 26,677 45,790 25,775
COUNTRY 3
Canada . . . . . . . . . . . . . . . . . . . . . . . . . . . . . . . . . 28,346 9,157 31,502 13,640 12,121 38,502 25,181Europe 1 . . . . . . . . . . . . . . . . . . . . . . . . . . . . . . . . . 249,167 39,024 43,815 56,416 106,732 132,454 157,853 France . . . . . . . . . . . . . . . . . . . . . . . . . . . . . . . . . 26,149 2,955 6,415 5,608 18,140 14,307 16,565 Germany . . . . . . . . . . . . . . . . . . . . . . . . . . . . . . . 18,452 8,830 4,788 7,239 20,514 15,831 12,823 Netherlands . . . . . . . . . . . . . . . . . . . . . . . . . . . . . 47,686 1,077 461 2,609 4,769 8,357 12,545 Switzerland . . . . . . . . . . . . . . . . . . . . . . . . . . . . . 22,789 649 6,505 2,332 12,401 6,501 9,041 United Kingdom . . . . . . . . . . . . . . . . . . . . . . . . . . 110,208 20,373 23,288 30,420 26,261 56,051 19,657Latin America and other Western Hemisphere . . . 15,400 1,607 2,629 5,042 (D) (D) 18,259 South and Central America . . . . . . . . . . . . . . . . . 5,334 182 1,382 980 2,273 (D) 3,551 Other Western Hemisphere . . . . . . . . . . . . . . . . . 10,066 1,425 1,247 4,062 (D) 1,933 14,708Africa . . . . . . . . . . . . . . . . . . . . . . . . . . . . . . . . . . . (D) (D) (D) (D) (D) (D) 129Middle East . . . . . . . . . . . . . . . . . . . . . . . . . . . . . . 947 1,738 1,318 5,068 11,755 21,882 12,263Asia and Pacific 1 . . . . . . . . . . . . . . . . . . . . . . . . . . 40,282 11,469 6,015 10,924 15,759 34,408 44,863 Australia . . . . . . . . . . . . . . . . . . . . . . . . . . . . . . . . (D) 9,032 3,850 4,713 5,650 12,983 10,522 Japan . . . . . . . . . . . . . . . . . . . . . . . . . . . . . . . . . . 26,044 1,544 1,027 4,245 8,350 7,928 28,041
D Suppressed to avoid disclosure of data of individual companies. 1 Includes other countries, not shown separately. 2 Based on 1997 North American Industry Classification System (NAICS). Beginning 2002, based on NAICS 2002; see text, Section 15. 3 For investments in which more than one investor participated, each investor and each investor’s outlaysare classified by country of each ultimate beneficial owner.
Source: U.S. Bureau of Economic Analysis, Survey of Current Business, June 2009. See also <http://www.bea.gov/bea/index.htm>.
Table 1295. U.S. Direct Investment Position Abroad, Capital Outflows, and Income by Industry of Foreign Affiliates: 2000 to 2010[In millions of dollars (1,316,247 represents $1,316,247,000,000). See headnote, Table 1296]
Industry
Direct investment position on a historical-cost basis Capitol outflows [inflows(–)] Income 1
2000 2009 2010 2000 2009 2010 2000 2009 2010 All industries, total 2 . . . . . . . . . . 1,316,247 3,547,038 3,908,231 142,627 282,686 328,905 133,692 335,283 409,555Mining . . . . . . . . . . . . . . . . . . . . . . . . 72,111 163,467 175,532 2,174 17,784 12,637 13,164 24,953 29,675Manufacturing 2 . . . . . . . . . . . . . . . . . 343,899 526,705 585,789 43,002 47,126 61,149 42,230 42,115 63,246 Food . . . . . . . . . . . . . . . . . . . . . . . . 23,497 44,780 46,441 2,014 3,166 4,669 2,681 2,907 3,558 Chemicals . . . . . . . . . . . . . . . . . . . . 75,807 121,900 140,884 3,812 16,487 19,500 (D) 13,668 15,904 Primary and fabricated metals . . . . . . . . . . . . . . . . . . . . . . 21,644 21,218 22,129 1,233 429 1,300 1,536 947 1,553 Machinery . . . . . . . . . . . . . . . . . . . . 22,229 39,755 43,881 2,659 3,377 3,762 2,257 2,450 4,322 Computer and electronic products . . . . . . . . . . . . . . . . . . . . . 59,909 68,720 81,968 17,303 –1,350 11,175 8,860 7,008 10,833 Electrical equipment, appliances, and components . . . . . . . . . . . . . . 10,005 22,482 23,635 2,100 821 2,087 1,079 1,558 1,696 Transportation equipment . . . . . . . . 49,887 48,567 50,332 7,814 4,873 1,033 4,107 –1,114 6,638Wholesale trade . . . . . . . . . . . . . . . . . 93,936 181,186 193,531 11,938 15,532 17,064 14,198 21,440 25,828Information . . . . . . . . . . . . . . . . . . . . . 52,345 144,562 161,723 16,531 11,680 13,137 –964 14,647 17,409Depository institutions . . . . . . . . . . . . 40,152 121,340 133,602 –1,274 –16,399 2,194 2,191 2,350 5,933Finance and insurance . . . . . . . . . . . 217,086 761,279 802,960 21,659 49,691 13,506 15,210 41,465 40,241Professional, scientific, and technical services . . . . . . . . . . . 32,868 76,118 84,658 5,441 4,030 7,441 3,548 6,495 7,442Holding companies (nonbank) . . . . . . . . . . . . . . . . . . . . (NA) 1,351,158 1,538,617 (NA) 140,858 184,277 (NA) 166,191 198,633
D Withheld to avoid disclosure of individual company data. NA Not available. 1 For 2006, income is shown gross of withholding taxes. 2 Includes other industries, not shown separately.
Source: U.S. Bureau of Economic Analysis, Survey of Current Business, July 2011. For most recent copy and historical issues, see <http://www.bea.gov/scb/index.htm>.
800 Foreign Commerce and Aid U.S. Census Bureau, Statistical Abstract of the United States: 2012
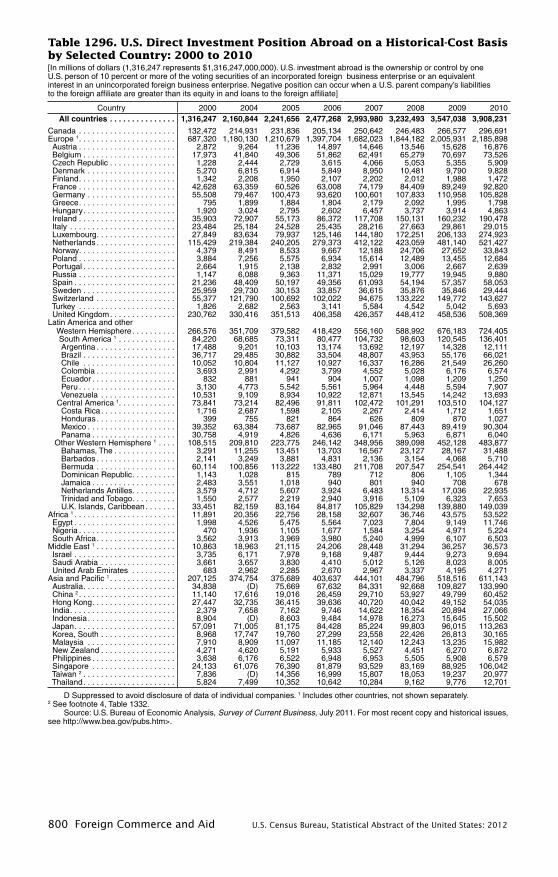
Table 1296. U.S. Direct Investment Position Abroad on a Historical-Cost Basis by Selected Country: 2000 to 2010[In millions of dollars (1,316,247 represents $1,316,247,000,000). U.S. investment abroad is the ownership or control by one U.S. person of 10 percent or more of the voting securities of an incorporated foreign business enterprise or an equivalent interest in an unincorporated foreign business enterprise. Negative position can occur when a U.S. parent company’s liabilities to the foreign affiliate are greater than its equity in and loans to the foreign affiliate]
Country 2000 2004 2005 2006 2007 2008 2009 2010 All countries . . . . . . . . . . . . . . . 1,316,247 2,160,844 2,241,656 2,477,268 2,993,980 3,232,493 3,547,038 3,908,231
Canada . . . . . . . . . . . . . . . . . . . . . . 132,472 214,931 231,836 205,134 250,642 246,483 266,577 296,691Europe 1 . . . . . . . . . . . . . . . . . . . . . . 687,320 1,180,130 1,210,679 1,397,704 1,682,023 1,844,182 2,005,931 2,185,898 Austria . . . . . . . . . . . . . . . . . . . . . . 2,872 9,264 11,236 14,897 14,646 13,546 15,628 16,876 Belgium . . . . . . . . . . . . . . . . . . . . . 17,973 41,840 49,306 51,862 62,491 65,279 70,697 73,526 Czech Republic . . . . . . . . . . . . . . . 1,228 2,444 2,729 3,615 4,066 5,053 5,355 5,909 Denmark . . . . . . . . . . . . . . . . . . . . 5,270 6,815 6,914 5,849 8,950 10,481 9,790 9,828 Finland . . . . . . . . . . . . . . . . . . . . . . 1,342 2,208 1,950 2,107 2,202 2,012 1,988 1,472 France . . . . . . . . . . . . . . . . . . . . . . 42,628 63,359 60,526 63,008 74,179 84,409 89,249 92,820 Germany . . . . . . . . . . . . . . . . . . . . 55,508 79,467 100,473 93,620 100,601 107,833 110,958 105,828 Greece . . . . . . . . . . . . . . . . . . . . . . 795 1,899 1,884 1,804 2,179 2,092 1,995 1,798 Hungary . . . . . . . . . . . . . . . . . . . . . 1,920 3,024 2,795 2,602 6,457 3,737 3,914 4,863 Ireland . . . . . . . . . . . . . . . . . . . . . . 35,903 72,907 55,173 86,372 117,708 150,131 160,232 190,478 Italy . . . . . . . . . . . . . . . . . . . . . . . . 23,484 25,184 24,528 25,435 28,216 27,663 29,861 29,015 Luxembourg . . . . . . . . . . . . . . . . . . 27,849 83,634 79,937 125,146 144,180 172,251 206,133 274,923 Netherlands . . . . . . . . . . . . . . . . . . 115,429 219,384 240,205 279,373 412,122 423,059 481,140 521,427 Norway. . . . . . . . . . . . . . . . . . . . . . 4,379 8,491 8,533 9,667 12,188 24,706 27,652 33,843 Poland . . . . . . . . . . . . . . . . . . . . . . 3,884 7,256 5,575 6,934 15,614 12,489 13,455 12,684 Portugal . . . . . . . . . . . . . . . . . . . . . 2,664 1,915 2,138 2,832 2,991 3,006 2,667 2,639 Russia . . . . . . . . . . . . . . . . . . . . . . 1,147 6,088 9,363 11,371 15,029 19,777 19,945 9,880 Spain . . . . . . . . . . . . . . . . . . . . . . . 21,236 48,409 50,197 49,356 61,093 54,194 57,357 58,053 Sweden . . . . . . . . . . . . . . . . . . . . . 25,959 29,730 30,153 33,857 36,615 35,876 35,846 29,444 Switzerland . . . . . . . . . . . . . . . . . . 55,377 121,790 100,692 102,022 94,675 133,222 149,772 143,627 Turkey . . . . . . . . . . . . . . . . . . . . . . 1,826 2,682 2,563 3,141 5,584 4,542 5,042 5,693 United Kingdom . . . . . . . . . . . . . . . 230,762 330,416 351,513 406,358 426,357 448,412 458,536 508,369Latin America and other Western Hemisphere . . . . . . . . . . 266,576 351,709 379,582 418,429 556,160 588,992 676,183 724,405 South America 1 . . . . . . . . . . . . . 84,220 68,685 73,311 80,477 104,732 98,603 120,545 136,401 Argentina . . . . . . . . . . . . . . . . . . 17,488 9,201 10,103 13,174 13,692 12,197 14,328 12,111 Brazil . . . . . . . . . . . . . . . . . . . . . 36,717 29,485 30,882 33,504 48,807 43,953 55,176 66,021 Chile . . . . . . . . . . . . . . . . . . . . . 10,052 10,804 11,127 10,927 16,337 16,286 21,549 26,260 Colombia . . . . . . . . . . . . . . . . . . 3,693 2,991 4,292 3,799 4,552 5,028 6,176 6,574 Ecuador . . . . . . . . . . . . . . . . . . . 832 881 941 904 1,007 1,098 1,209 1,250 Peru . . . . . . . . . . . . . . . . . . . . . . 3,130 4,773 5,542 5,561 5,964 4,448 5,594 7,907 Venezuela . . . . . . . . . . . . . . . . . 10,531 9,109 8,934 10,922 12,871 13,545 14,242 13,693 Central America 1 . . . . . . . . . . . . . 73,841 73,214 82,496 91,811 102,472 101,291 103,510 104,127 Costa Rica . . . . . . . . . . . . . . . . . 1,716 2,687 1,598 2,105 2,267 2,414 1,712 1,651 Honduras . . . . . . . . . . . . . . . . . . 399 755 821 864 626 809 870 1,027 Mexico . . . . . . . . . . . . . . . . . . . . 39,352 63,384 73,687 82,965 91,046 87,443 89,419 90,304 Panama . . . . . . . . . . . . . . . . . . . 30,758 4,919 4,826 4,636 6,171 5,963 6,871 6,040 Other Western Hemisphere 1 . . . . 108,515 209,810 223,775 246,142 348,956 389,098 452,128 483,877 Bahamas, The . . . . . . . . . . . . . . 3,291 11,255 13,451 13,703 16,567 23,127 28,167 31,488 Barbados . . . . . . . . . . . . . . . . . . 2,141 3,249 3,881 4,831 2,136 3,154 4,068 5,710 Bermuda . . . . . . . . . . . . . . . . . . 60,114 100,856 113,222 133,480 211,708 207,547 254,541 264,442 Dominican Republic . . . . . . . . . . 1,143 1,028 815 789 712 806 1,105 1,344 Jamaica . . . . . . . . . . . . . . . . . . . 2,483 3,551 1,018 940 801 940 708 678 Netherlands Antilles. . . . . . . . . . 3,579 4,712 5,607 3,924 6,483 13,314 17,036 22,935 Trinidad and Tobago. . . . . . . . . . 1,550 2,577 2,219 2,940 3,916 5,109 6,323 7,653 U.K. Islands, Caribbean . . . . . . . 33,451 82,159 83,164 84,817 105,829 134,298 139,880 149,039Africa 1 . . . . . . . . . . . . . . . . . . . . . . . 11,891 20,356 22,756 28,158 32,607 36,746 43,575 53,522 Egypt . . . . . . . . . . . . . . . . . . . . . . . 1,998 4,526 5,475 5,564 7,023 7,804 9,149 11,746 Nigeria . . . . . . . . . . . . . . . . . . . . . . 470 1,936 1,105 1,677 1,584 3,254 4,971 5,224 South Africa . . . . . . . . . . . . . . . . . . 3,562 3,913 3,969 3,980 5,240 4,999 6,107 6,503Middle East 1 . . . . . . . . . . . . . . . . . . 10,863 18,963 21,115 24,206 28,448 31,294 36,257 36,573 Israel . . . . . . . . . . . . . . . . . . . . . . . 3,735 6,171 7,978 9,168 9,487 9,444 9,273 9,694 Saudi Arabia . . . . . . . . . . . . . . . . . 3,661 3,657 3,830 4,410 5,012 5,126 8,023 8,005 United Arab Emirates . . . . . . . . . . 683 2,962 2,285 2,670 2,967 3,337 4,195 4,271Asia and Pacific 1 . . . . . . . . . . . . . . . 207,125 374,754 375,689 403,637 444,101 484,796 518,516 611,143 Australia . . . . . . . . . . . . . . . . . . . . . 34,838 (D) 75,669 67,632 84,331 92,668 109,827 133,990 China 2 . . . . . . . . . . . . . . . . . . . . . . 11,140 17,616 19,016 26,459 29,710 53,927 49,799 60,452 Hong Kong . . . . . . . . . . . . . . . . . . . 27,447 32,735 36,415 39,636 40,720 40,042 49,152 54,035 India . . . . . . . . . . . . . . . . . . . . . . . . 2,379 7,658 7,162 9,746 14,622 18,354 20,894 27,066 Indonesia . . . . . . . . . . . . . . . . . . . . 8,904 (D) 8,603 9,484 14,978 16,273 15,645 15,502 Japan . . . . . . . . . . . . . . . . . . . . . . . 57,091 71,005 81,175 84,428 85,224 99,803 96,015 113,263 Korea, South . . . . . . . . . . . . . . . . . 8,968 17,747 19,760 27,299 23,558 22,426 26,813 30,165 Malaysia . . . . . . . . . . . . . . . . . . . . 7,910 8,909 11,097 11,185 12,140 12,243 13,235 15,982 New Zealand . . . . . . . . . . . . . . . . . 4,271 4,620 5,191 5,933 5,527 4,451 6,270 6,872 Philippines . . . . . . . . . . . . . . . . . . . 3,638 6,176 6,522 6,948 6,953 5,505 5,908 6,579 Singapore . . . . . . . . . . . . . . . . . . . 24,133 61,076 76,390 81,879 93,529 83,169 88,925 106,042 Taiwan 2 . . . . . . . . . . . . . . . . . . . . . 7,836 (D) 14,356 16,999 15,807 18,053 19,237 20,977 Thailand . . . . . . . . . . . . . . . . . . . . . 5,824 7,499 10,352 10,642 10,284 9,162 9,776 12,701
D Suppressed to avoid disclosure of data of individual companies. 1 Includes other countries, not shown separately.2 See footnote 4, Table 1332.
Source: U.S. Bureau of Economic Analysis, Survey of Current Business, July 2011. For most recent copy and historical issues, see http://www.bea.gov/pubs.htm>.
Foreign Commerce and Aid 801U.S. Census Bureau, Statistical Abstract of the United States: 2012
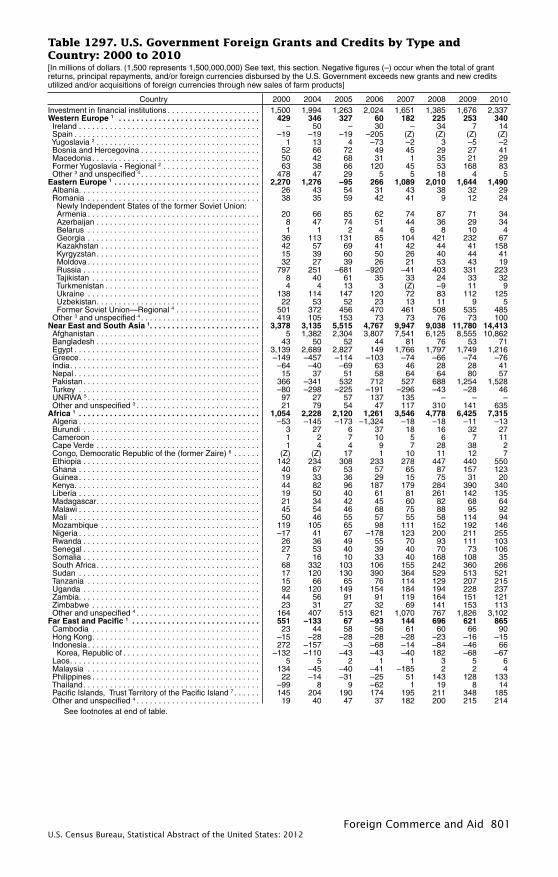
Table 1297. U.S. Government Foreign Grants and Credits by Type and Country: 2000 to 2010[In millions of dollars. (1,500 represents 1,500,000,000) See text, this section. Negative figures (–) occur when the total of grant returns, principal repayments, and/or foreign currencies disbursed by the U.S. Government exceeds new grants and new credits utilized and/or acquisitions of foreign currencies through new sales of farm products]
Country 2000 2004 2005 2006 2007 2008 2009 2010Investment in financial institutions . . . . . . . . . . . . . . . . . . . . . 1,500 1,994 1,263 2,024 1,651 1,385 1,676 2,337Western Europe 1 . . . . . . . . . . . . . . . . . . . . . . . . . . . . . . . . 429 346 327 60 182 225 253 340 Ireland . . . . . . . . . . . . . . . . . . . . . . . . . . . . . . . . . . . . . . . . . – 50 – 30 – 34 7 14 Spain . . . . . . . . . . . . . . . . . . . . . . . . . . . . . . . . . . . . . . . . . . –19 –19 –19 –205 (Z) (Z) (Z) (Z) Yugoslavia 2 . . . . . . . . . . . . . . . . . . . . . . . . . . . . . . . . . . . . . 1 13 4 –73 –2 3 –5 –2 Bosnia and Hercegovina . . . . . . . . . . . . . . . . . . . . . . . . . . . 52 66 72 49 45 29 27 41 Macedonia . . . . . . . . . . . . . . . . . . . . . . . . . . . . . . . . . . . . . . 50 42 68 31 1 35 21 29 Former Yugoslavia - Regional 2 . . . . . . . . . . . . . . . . . . . . . . 63 38 66 120 45 53 168 83 Other 3 and unspecified 4 . . . . . . . . . . . . . . . . . . . . . . . . . . . 478 47 29 5 5 18 4 5Eastern Europe 1 . . . . . . . . . . . . . . . . . . . . . . . . . . . . . . . . . 2,270 1,276 –95 266 1,089 2,010 1,644 1,490 Albania . . . . . . . . . . . . . . . . . . . . . . . . . . . . . . . . . . . . . . . . . 26 43 54 31 43 38 32 29 Romania . . . . . . . . . . . . . . . . . . . . . . . . . . . . . . . . . . . . . . . 38 35 59 42 41 9 12 24 Newly Independent States of the former Soviet Union: Armenia . . . . . . . . . . . . . . . . . . . . . . . . . . . . . . . . . . . . . . . 20 66 85 62 74 87 71 34 Azerbaijan . . . . . . . . . . . . . . . . . . . . . . . . . . . . . . . . . . . . . 8 47 74 51 44 36 29 34 Belarus . . . . . . . . . . . . . . . . . . . . . . . . . . . . . . . . . . . . . . . 1 1 2 4 6 8 10 4 Georgia . . . . . . . . . . . . . . . . . . . . . . . . . . . . . . . . . . . . . . . 36 113 131 85 104 421 232 67 Kazakhstan . . . . . . . . . . . . . . . . . . . . . . . . . . . . . . . . . . . . 42 57 69 41 42 44 41 158 Kyrgyzstan . . . . . . . . . . . . . . . . . . . . . . . . . . . . . . . . . . . . . 15 39 60 50 26 40 44 41 Moldova . . . . . . . . . . . . . . . . . . . . . . . . . . . . . . . . . . . . . . . 32 27 39 26 21 53 43 19 Russia . . . . . . . . . . . . . . . . . . . . . . . . . . . . . . . . . . . . . . . . 797 251 –681 –920 –41 403 331 223 Tajikistan . . . . . . . . . . . . . . . . . . . . . . . . . . . . . . . . . . . . . . 8 40 61 35 33 24 33 32 Turkmenistan . . . . . . . . . . . . . . . . . . . . . . . . . . . . . . . . . . . 4 4 13 3 (Z) –9 11 9 Ukraine . . . . . . . . . . . . . . . . . . . . . . . . . . . . . . . . . . . . . . . 138 114 147 120 72 83 112 125 Uzbekistan . . . . . . . . . . . . . . . . . . . . . . . . . . . . . . . . . . . . . 22 53 52 23 13 11 9 5 Former Soviet Union—Regional 4 . . . . . . . . . . . . . . . . . . . 501 372 456 470 461 508 535 485 Other 3 and unspecified 4 . . . . . . . . . . . . . . . . . . . . . . . . . . . 419 105 153 73 73 76 73 100Near East and South Asia 1 . . . . . . . . . . . . . . . . . . . . . . . . . 3,378 3,135 5,515 4,767 9,947 9,038 11,780 14,413 Afghanistan . . . . . . . . . . . . . . . . . . . . . . . . . . . . . . . . . . . . . 5 1,382 2,304 3,807 7,541 6,125 8,555 10,862 Bangladesh . . . . . . . . . . . . . . . . . . . . . . . . . . . . . . . . . . . . . 43 50 52 44 81 76 53 71 Egypt . . . . . . . . . . . . . . . . . . . . . . . . . . . . . . . . . . . . . . . . . . 3,139 2,689 2,827 149 1,766 1,797 1,749 1,216 Greece . . . . . . . . . . . . . . . . . . . . . . . . . . . . . . . . . . . . . . . . . –149 –457 –114 –103 –74 –66 –74 –76 India . . . . . . . . . . . . . . . . . . . . . . . . . . . . . . . . . . . . . . . . . . . –64 –40 –69 63 46 28 28 41 Nepal . . . . . . . . . . . . . . . . . . . . . . . . . . . . . . . . . . . . . . . . . . 15 37 51 58 64 64 80 57 Pakistan . . . . . . . . . . . . . . . . . . . . . . . . . . . . . . . . . . . . . . . . 366 –341 532 712 527 688 1,254 1,528 Turkey . . . . . . . . . . . . . . . . . . . . . . . . . . . . . . . . . . . . . . . . . –80 –298 –225 –191 –296 –43 –28 46 UNRWA 5 . . . . . . . . . . . . . . . . . . . . . . . . . . . . . . . . . . . . . . . 97 27 57 137 135 – – – Other and unspecified 3 . . . . . . . . . . . . . . . . . . . . . . . . . . . . 21 79 54 47 117 310 141 635Africa 1 . . . . . . . . . . . . . . . . . . . . . . . . . . . . . . . . . . . . . . . . . 1,054 2,228 2,120 1,261 3,546 4,778 6,425 7,315 Algeria . . . . . . . . . . . . . . . . . . . . . . . . . . . . . . . . . . . . . . . . . –53 –145 –173 –1,324 –18 –18 –11 –13 Burundi . . . . . . . . . . . . . . . . . . . . . . . . . . . . . . . . . . . . . . . . 3 27 6 37 18 16 32 27 Cameroon . . . . . . . . . . . . . . . . . . . . . . . . . . . . . . . . . . . . . . 1 2 7 10 5 6 7 11 Cape Verde . . . . . . . . . . . . . . . . . . . . . . . . . . . . . . . . . . . . . 1 4 4 9 7 28 38 2 Congo, Democratic Republic of the (former Zaire) 6 . . . . . . (Z) (Z) 17 1 10 11 12 7 Ethiopia . . . . . . . . . . . . . . . . . . . . . . . . . . . . . . . . . . . . . . . . 142 234 308 233 278 447 440 550 Ghana . . . . . . . . . . . . . . . . . . . . . . . . . . . . . . . . . . . . . . . . . 40 67 53 57 65 87 157 123 Guinea . . . . . . . . . . . . . . . . . . . . . . . . . . . . . . . . . . . . . . . . . 19 33 36 29 15 75 31 20 Kenya . . . . . . . . . . . . . . . . . . . . . . . . . . . . . . . . . . . . . . . . . . 44 82 96 187 179 284 390 340 Liberia . . . . . . . . . . . . . . . . . . . . . . . . . . . . . . . . . . . . . . . . . 19 50 40 61 81 261 142 135 Madagascar . . . . . . . . . . . . . . . . . . . . . . . . . . . . . . . . . . . . . 21 34 42 45 60 82 68 64 Malawi . . . . . . . . . . . . . . . . . . . . . . . . . . . . . . . . . . . . . . . . . 45 54 46 68 75 88 95 92 Mali . . . . . . . . . . . . . . . . . . . . . . . . . . . . . . . . . . . . . . . . . . . 50 46 55 57 55 58 114 94 Mozambique . . . . . . . . . . . . . . . . . . . . . . . . . . . . . . . . . . . . 119 105 65 98 111 152 192 146 Nigeria . . . . . . . . . . . . . . . . . . . . . . . . . . . . . . . . . . . . . . . . . –17 41 67 –178 123 200 211 255 Rwanda . . . . . . . . . . . . . . . . . . . . . . . . . . . . . . . . . . . . . . . . 26 36 49 55 70 93 111 103 Senegal . . . . . . . . . . . . . . . . . . . . . . . . . . . . . . . . . . . . . . . . 27 53 40 39 40 70 73 106 Somalia . . . . . . . . . . . . . . . . . . . . . . . . . . . . . . . . . . . . . . . . 7 16 10 33 40 168 108 35 South Africa . . . . . . . . . . . . . . . . . . . . . . . . . . . . . . . . . . . . . 68 332 103 106 155 242 360 266 Sudan . . . . . . . . . . . . . . . . . . . . . . . . . . . . . . . . . . . . . . . . . 17 120 130 390 364 529 513 521 Tanzania . . . . . . . . . . . . . . . . . . . . . . . . . . . . . . . . . . . . . . . 15 66 65 76 114 129 207 215 Uganda . . . . . . . . . . . . . . . . . . . . . . . . . . . . . . . . . . . . . . . . 92 120 149 154 184 194 228 237 Zambia . . . . . . . . . . . . . . . . . . . . . . . . . . . . . . . . . . . . . . . . . 44 56 91 91 119 164 151 121 Zimbabwe . . . . . . . . . . . . . . . . . . . . . . . . . . . . . . . . . . . . . . 23 31 27 32 69 141 153 113 Other and unspecified 4 . . . . . . . . . . . . . . . . . . . . . . . . . . . . 164 407 513 621 1,070 767 1,826 3,102Far East and Pacific 1 . . . . . . . . . . . . . . . . . . . . . . . . . . . . . 551 –133 67 –93 144 696 621 865 Cambodia . . . . . . . . . . . . . . . . . . . . . . . . . . . . . . . . . . . . . . 23 44 58 56 61 60 66 90 Hong Kong . . . . . . . . . . . . . . . . . . . . . . . . . . . . . . . . . . . . . . –15 –28 –28 –28 –28 –23 –16 –15 Indonesia . . . . . . . . . . . . . . . . . . . . . . . . . . . . . . . . . . . . . . . 272 –157 –3 –68 –14 –84 –46 66 Korea, Republic of . . . . . . . . . . . . . . . . . . . . . . . . . . . . . . . –132 –110 –43 –43 –40 182 –68 –67 Laos . . . . . . . . . . . . . . . . . . . . . . . . . . . . . . . . . . . . . . . . . . . 5 5 2 1 1 3 5 6 Malaysia . . . . . . . . . . . . . . . . . . . . . . . . . . . . . . . . . . . . . . . 134 –45 –40 –41 –185 2 2 4 Philippines . . . . . . . . . . . . . . . . . . . . . . . . . . . . . . . . . . . . . . 22 –14 –31 –25 51 143 128 133 Thailand . . . . . . . . . . . . . . . . . . . . . . . . . . . . . . . . . . . . . . . . –99 8 9 –62 1 19 8 14 Pacific Islands, Trust Territory of the Pacific Island 7 . . . . . . 145 204 190 174 195 211 348 185 Other and unspecified 4 . . . . . . . . . . . . . . . . . . . . . . . . . . . . 19 40 47 37 182 200 215 214
See footnotes at end of table.
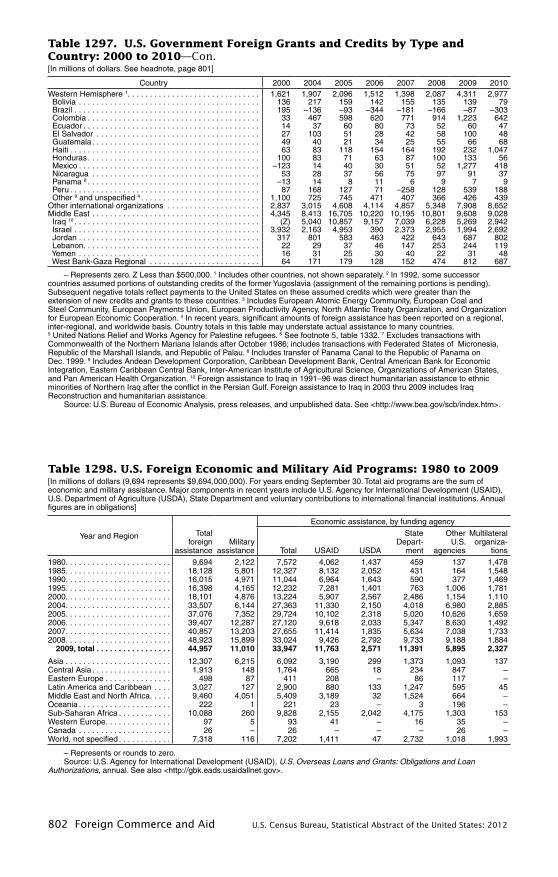
802 Foreign Commerce and Aid U.S. Census Bureau, Statistical Abstract of the United States: 2012
Table 1298. U.S. Foreign Economic and Military Aid Programs: 1980 to 2009[In millions of dollars (9,694 represents $9,694,000,000). For years ending September 30. Total aid programs are the sum of economic and military assistance. Major components in recent years include U.S. Agency for International Development (USAID), U.S. Department of Agriculture (USDA), State Department and voluntary contributions to international financial institutions. Annual figures are in obligations]
Year and Region Total foreign
assistanceMilitary
assistance
Economic assistance, by funding agency
Total USAID USDA
State Depart-
ment
Other U.S.
agencies
Multilateral organiza-
tions
1980. . . . . . . . . . . . . . . . . . . . . . . . 9,694 2,122 7,572 4,062 1,437 459 137 1,4781985. . . . . . . . . . . . . . . . . . . . . . . . 18,128 5,801 12,327 8,132 2,052 431 164 1,5481990. . . . . . . . . . . . . . . . . . . . . . . . 16,015 4,971 11,044 6,964 1,643 590 377 1,4691995. . . . . . . . . . . . . . . . . . . . . . . . 16,398 4,165 12,232 7,281 1,401 763 1,006 1,7812000. . . . . . . . . . . . . . . . . . . . . . . . 18,101 4,876 13,224 5,907 2,567 2,486 1,154 1,1102004. . . . . . . . . . . . . . . . . . . . . . . . 33,507 6,144 27,363 11,330 2,150 4,018 6,980 2,8852005. . . . . . . . . . . . . . . . . . . . . . . . 37,076 7,352 29,724 10,102 2,318 5,020 10,626 1,6592006. . . . . . . . . . . . . . . . . . . . . . . . 39,407 12,287 27,120 9,618 2,033 5,347 8,630 1,4922007. . . . . . . . . . . . . . . . . . . . . . . . 40,857 13,203 27,655 11,414 1,835 5,634 7,038 1,7332008. . . . . . . . . . . . . . . . . . . . . . . . 48,923 15,899 33,024 9,426 2,792 9,733 9,188 1,884 2009, total . . . . . . . . . . . . . . . . . 44,957 11,010 33,947 11,763 2,571 11,391 5,895 2,327
Asia . . . . . . . . . . . . . . . . . . . . . . . . 12,307 6,215 6,092 3,190 299 1,373 1,093 137Central Asia . . . . . . . . . . . . . . . . . . 1,913 148 1,764 665 18 234 847 –Eastern Europe . . . . . . . . . . . . . . . 498 87 411 208 – 86 117 –Latin America and Caribbean . . . . 3,027 127 2,900 880 133 1,247 595 45Middle East and North Africa . . . . . 9,460 4,051 5,409 3,189 32 1,524 664 –Oceania . . . . . . . . . . . . . . . . . . . . . 222 1 221 23 – 3 196 –Sub-Saharan Africa . . . . . . . . . . . . 10,088 260 9,828 2,155 2,042 4,175 1,303 153Western Europe . . . . . . . . . . . . . . . 97 5 93 41 – 16 35 –Canada . . . . . . . . . . . . . . . . . . . . . 26 – 26 – – – 26 –World, not specified . . . . . . . . . . . . 7,318 116 7,202 1,411 47 2,732 1,018 1,993
– Represents or rounds to zero.Source: U.S. Agency for International Development (USAID), U .S . Overseas Loans and Grants: Obligations and Loan
Authorizations, annual. See also <http://gbk.eads.usaidallnet.gov>.
Table 1297. U.S. Government Foreign Grants and Credits by Type and Country: 2000 to 2010—Con.[In millions of dollars. See headnote, page 801]
Country 2000 2004 2005 2006 2007 2008 2009 2010Western Hemisphere 1 . . . . . . . . . . . . . . . . . . . . . . . . . . . . . . 1,621 1,907 2,096 1,512 1,398 2,087 4,311 2,977 Bolivia . . . . . . . . . . . . . . . . . . . . . . . . . . . . . . . . . . . . . . . . . 136 217 159 142 155 135 139 79 Brazil . . . . . . . . . . . . . . . . . . . . . . . . . . . . . . . . . . . . . . . . . . 195 –136 –93 –344 –181 –166 –87 –303 Colombia . . . . . . . . . . . . . . . . . . . . . . . . . . . . . . . . . . . . . . . 33 467 598 620 771 914 1,223 642 Ecuador . . . . . . . . . . . . . . . . . . . . . . . . . . . . . . . . . . . . . . . . 14 37 60 80 73 52 60 47 El Salvador . . . . . . . . . . . . . . . . . . . . . . . . . . . . . . . . . . . . . 27 103 51 28 42 58 100 48 Guatemala . . . . . . . . . . . . . . . . . . . . . . . . . . . . . . . . . . . . . . 49 40 21 34 25 55 66 68 Haiti . . . . . . . . . . . . . . . . . . . . . . . . . . . . . . . . . . . . . . . . . . . 63 83 118 154 164 192 232 1,047 Honduras . . . . . . . . . . . . . . . . . . . . . . . . . . . . . . . . . . . . . . . 100 83 71 63 87 100 133 56 Mexico . . . . . . . . . . . . . . . . . . . . . . . . . . . . . . . . . . . . . . . . . –123 14 40 30 51 52 1,277 418 Nicaragua . . . . . . . . . . . . . . . . . . . . . . . . . . . . . . . . . . . . . . 53 28 37 56 75 97 91 37 Panama 8 . . . . . . . . . . . . . . . . . . . . . . . . . . . . . . . . . . . . . . . –13 14 8 11 6 9 7 9 Peru . . . . . . . . . . . . . . . . . . . . . . . . . . . . . . . . . . . . . . . . . . . 87 168 127 71 –258 128 539 188 Other 9 and unspecified 4 . . . . . . . . . . . . . . . . . . . . . . . . . . . 1,100 725 745 471 407 366 426 439Other international organizations . . . . . . . . . . . . . . . . . . . . . 2,837 3,015 4,608 4,114 4,857 5,348 7,908 8,652Middle East . . . . . . . . . . . . . . . . . . . . . . . . . . . . . . . . . . . . . . 4,345 8,413 16,705 10,220 10,195 10,801 9,608 9,028 Iraq 10 . . . . . . . . . . . . . . . . . . . . . . . . . . . . . . . . . . . . . . . . . . (Z) 5,040 10,857 9,157 7,039 6,228 5,269 2,942 Israel . . . . . . . . . . . . . . . . . . . . . . . . . . . . . . . . . . . . . . . . . . 3,932 2,163 4,953 390 2,373 2,955 1,994 2,692 Jordan . . . . . . . . . . . . . . . . . . . . . . . . . . . . . . . . . . . . . . . . . 317 801 583 463 422 643 687 802 Lebanon. . . . . . . . . . . . . . . . . . . . . . . . . . . . . . . . . . . . . . . . 22 29 37 46 147 253 244 119 Yemen . . . . . . . . . . . . . . . . . . . . . . . . . . . . . . . . . . . . . . . . . 16 31 25 30 40 22 31 48 West Bank-Gaza Regional . . . . . . . . . . . . . . . . . . . . . . . . . 64 171 179 128 152 474 812 687
– Represents zero. Z Less than $500,000. 1 Includes other countries, not shown separately. 2 In 1992, some successor countries assumed portions of outstanding credits of the former Yugoslavia (assignment of the remaining portions is pending). Subsequent negative totals reflect payments to the United States on these assumed credits which were greater than the extension of new credits and grants to these countries. 3 Includes European Atomic Energy Community, European Coal andSteel Community, European Payments Union, European Productivity Agency, North Atlantic Treaty Organization, and Organization for European Economic Cooperation. 4 In recent years, significant amounts of foreign assistance has been reported on a regional,inter-regional, and worldwide basis. Country totals in this table may understate actual assistance to many countries. 5 United Nations Relief and Works Agency for Palestine refugees. 6 See footnote 5, table 1332. 7 Excludes transactions with Commonwealth of the Northern Mariana Islands after October 1986; includes transactions with Federated States of Micronesia, Republic of the Marshall Islands, and Republic of Palau. 8 Includes transfer of Panama Canal to the Republic of Panama on Dec. 1999. 9 Includes Andean Development Corporation, Caribbean Development Bank, Central American Bank for Economic Integration, Eastern Caribbean Central Bank, Inter-American Institute of Agricultural Science, Organizations of American States, and Pan American Health Organization. 10 Foreign assistance to Iraq in 1991–96 was direct humanitarian assistance to ethnic minorities of Northern Iraq after the conflict in the Persian Gulf. Foreign assistance to Iraq in 2003 thru 2009 includes Iraq Reconstruction and humanitarian assistance.
Source: U.S. Bureau of Economic Analysis, press releases, and unpublished data. See <http://www.bea.gov/scb/index.htm>.
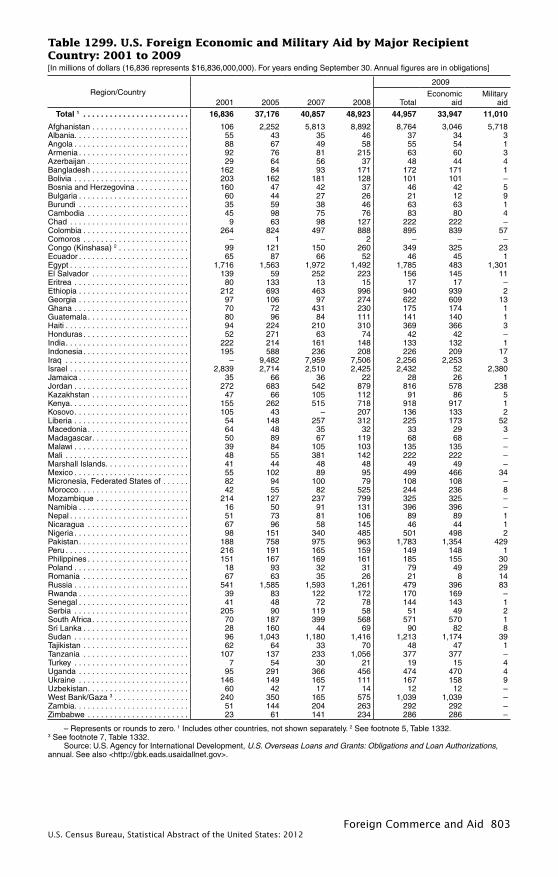
Foreign Commerce and Aid 803U.S. Census Bureau, Statistical Abstract of the United States: 2012
Table 1299. U.S. Foreign Economic and Military Aid by Major Recipient Country: 2001 to 2009[In millions of dollars (16,836 represents $16,836,000,000). For years ending September 30. Annual figures are in obligations]
Region/Country2001 2005 2007 2008
2009
TotalEconomic
aidMilitary
aid
Total 1 . . . . . . . . . . . . . . . . . . . . . . . . 16,836 37,176 40,857 48,923 44,957 33,947 11,010
Afghanistan . . . . . . . . . . . . . . . . . . . . . . 106 2,252 5,813 8,892 8,764 3,046 5,718Albania . . . . . . . . . . . . . . . . . . . . . . . . . . 55 43 35 46 37 34 3Angola . . . . . . . . . . . . . . . . . . . . . . . . . . 88 67 49 58 55 54 1Armenia . . . . . . . . . . . . . . . . . . . . . . . . . 92 76 81 215 63 60 3Azerbaijan . . . . . . . . . . . . . . . . . . . . . . . 29 64 56 37 48 44 4Bangladesh . . . . . . . . . . . . . . . . . . . . . . 162 84 93 171 172 171 1Bolivia . . . . . . . . . . . . . . . . . . . . . . . . . . 203 162 181 128 101 101 –Bosnia and Herzegovina . . . . . . . . . . . . 160 47 42 37 46 42 5Bulgaria . . . . . . . . . . . . . . . . . . . . . . . . . 60 44 27 26 21 12 9Burundi . . . . . . . . . . . . . . . . . . . . . . . . . 35 59 38 46 63 63 1Cambodia . . . . . . . . . . . . . . . . . . . . . . . 45 98 75 76 83 80 4Chad . . . . . . . . . . . . . . . . . . . . . . . . . . . 9 63 98 127 222 222 –Colombia . . . . . . . . . . . . . . . . . . . . . . . . 264 824 497 888 895 839 57Comoros . . . . . . . . . . . . . . . . . . . . . . . . – 1 – 2 – – –Congo (Kinshasa) 2 . . . . . . . . . . . . . . . . 99 121 150 260 349 325 23Ecuador . . . . . . . . . . . . . . . . . . . . . . . . . 65 87 66 52 46 45 1Egypt . . . . . . . . . . . . . . . . . . . . . . . . . . . 1,716 1,563 1,972 1,492 1,785 483 1,301El Salvador . . . . . . . . . . . . . . . . . . . . . . 139 59 252 223 156 145 11Eritrea . . . . . . . . . . . . . . . . . . . . . . . . . . 80 133 13 15 17 17 –Ethiopia . . . . . . . . . . . . . . . . . . . . . . . . . 212 693 463 996 940 939 2Georgia . . . . . . . . . . . . . . . . . . . . . . . . . 97 106 97 274 622 609 13Ghana . . . . . . . . . . . . . . . . . . . . . . . . . . 70 72 431 230 175 174 1Guatemala . . . . . . . . . . . . . . . . . . . . . . . 80 96 84 111 141 140 1Haiti . . . . . . . . . . . . . . . . . . . . . . . . . . . . 94 224 210 310 369 366 3Honduras . . . . . . . . . . . . . . . . . . . . . . . . 52 271 63 74 42 42 –India . . . . . . . . . . . . . . . . . . . . . . . . . . . . 222 214 161 148 133 132 1Indonesia . . . . . . . . . . . . . . . . . . . . . . . . 195 588 236 208 226 209 17Iraq . . . . . . . . . . . . . . . . . . . . . . . . . . . . – 9,482 7,959 7,506 2,256 2,253 3Israel . . . . . . . . . . . . . . . . . . . . . . . . . . . 2,839 2,714 2,510 2,425 2,432 52 2,380Jamaica . . . . . . . . . . . . . . . . . . . . . . . . . 35 66 36 22 28 26 1Jordan . . . . . . . . . . . . . . . . . . . . . . . . . . 272 683 542 879 816 578 238Kazakhstan . . . . . . . . . . . . . . . . . . . . . . 47 66 105 112 91 86 5Kenya . . . . . . . . . . . . . . . . . . . . . . . . . . . 155 262 515 718 918 917 1Kosovo . . . . . . . . . . . . . . . . . . . . . . . . . . 105 43 – 207 136 133 2Liberia . . . . . . . . . . . . . . . . . . . . . . . . . . 54 148 257 312 225 173 52Macedonia . . . . . . . . . . . . . . . . . . . . . . . 64 48 35 32 33 29 3Madagascar . . . . . . . . . . . . . . . . . . . . . . 50 89 67 119 68 68 –Malawi . . . . . . . . . . . . . . . . . . . . . . . . . . 39 84 105 103 135 135 –Mali . . . . . . . . . . . . . . . . . . . . . . . . . . . . 48 55 381 142 222 222 –Marshall Islands . . . . . . . . . . . . . . . . . . . 41 44 48 48 49 49 –Mexico . . . . . . . . . . . . . . . . . . . . . . . . . . 55 102 89 95 499 466 34Micronesia, Federated States of . . . . . . 82 94 100 79 108 108 –Morocco . . . . . . . . . . . . . . . . . . . . . . . . . 42 55 82 525 244 236 8Mozambique . . . . . . . . . . . . . . . . . . . . . 214 127 237 799 325 325 –Namibia . . . . . . . . . . . . . . . . . . . . . . . . . 16 50 91 131 396 396 –Nepal . . . . . . . . . . . . . . . . . . . . . . . . . . . 51 73 81 106 89 89 1Nicaragua . . . . . . . . . . . . . . . . . . . . . . . 67 96 58 145 46 44 1Nigeria . . . . . . . . . . . . . . . . . . . . . . . . . . 98 151 340 485 501 498 2Pakistan . . . . . . . . . . . . . . . . . . . . . . . . . 188 758 975 963 1,783 1,354 429Peru . . . . . . . . . . . . . . . . . . . . . . . . . . . . 216 191 165 159 149 148 1Philippines . . . . . . . . . . . . . . . . . . . . . . . 151 167 169 161 185 155 30Poland . . . . . . . . . . . . . . . . . . . . . . . . . . 18 93 32 31 79 49 29Romania . . . . . . . . . . . . . . . . . . . . . . . . 67 63 35 26 21 8 14Russia . . . . . . . . . . . . . . . . . . . . . . . . . . 541 1,585 1,593 1,261 479 396 83Rwanda . . . . . . . . . . . . . . . . . . . . . . . . . 39 83 122 172 170 169 –Senegal . . . . . . . . . . . . . . . . . . . . . . . . . 41 48 72 78 144 143 1Serbia . . . . . . . . . . . . . . . . . . . . . . . . . . 205 90 119 58 51 49 2South Africa . . . . . . . . . . . . . . . . . . . . . . 70 187 399 568 571 570 1Sri Lanka . . . . . . . . . . . . . . . . . . . . . . . . 28 160 44 69 90 82 8Sudan . . . . . . . . . . . . . . . . . . . . . . . . . . 96 1,043 1,180 1,416 1,213 1,174 39Tajikistan . . . . . . . . . . . . . . . . . . . . . . . . 62 64 33 70 48 47 1Tanzania . . . . . . . . . . . . . . . . . . . . . . . . 107 137 233 1,056 377 377 –Turkey . . . . . . . . . . . . . . . . . . . . . . . . . . 7 54 30 21 19 15 4Uganda . . . . . . . . . . . . . . . . . . . . . . . . . 95 291 366 456 474 470 4Ukraine . . . . . . . . . . . . . . . . . . . . . . . . . 146 149 165 111 167 158 9Uzbekistan . . . . . . . . . . . . . . . . . . . . . . . 60 42 17 14 12 12 –West Bank/Gaza 3 . . . . . . . . . . . . . . . . . 240 350 165 575 1,039 1,039 –Zambia . . . . . . . . . . . . . . . . . . . . . . . . . . 51 144 204 263 292 292 –Zimbabwe . . . . . . . . . . . . . . . . . . . . . . . 23 61 141 234 286 286 –
– Represents or rounds to zero. 1 Includes other countries, not shown separately. 2 See footnote 5, Table 1332.3 See footnote 7, Table 1332.
Source: U.S. Agency for International Development, U .S . Overseas Loans and Grants: Obligations and Loan Authorizations,annual. See also <http://gbk.eads.usaidallnet.gov>.
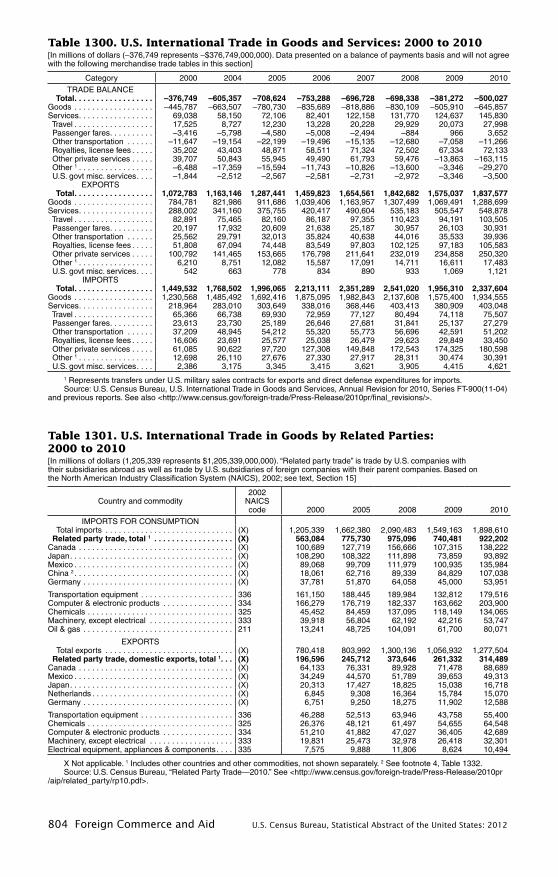
804 Foreign Commerce and Aid U.S. Census Bureau, Statistical Abstract of the United States: 2012
Table 1300. U.S. International Trade in Goods and Services: 2000 to 2010[In millions of dollars (–376,749 represents –$376,749,000,000). Data presented on a balance of payments basis and will not agree with the following merchandise trade tables in this section]
Category 2000 2004 2005 2006 2007 2008 2009 2010
TRADE BALANCE Total . . . . . . . . . . . . . . . . . . –376,749 –605,357 –708,624 –753,288 –696,728 –698,338 –381,272 –500,027Goods . . . . . . . . . . . . . . . . . . –445,787 –663,507 –780,730 –835,689 –818,886 –830,109 –505,910 –645,857Services . . . . . . . . . . . . . . . . . 69,038 58,150 72,106 82,401 122,158 131,770 124,637 145,830 Travel . . . . . . . . . . . . . . . . . . 17,525 8,727 12,230 13,228 20,228 29,929 20,073 27,998 Passenger fares . . . . . . . . . . –3,416 –5,798 –4,580 –5,008 –2,494 –884 966 3,652 Other transportation . . . . . . –11,647 –19,154 –22,199 –19,496 –15,135 –12,680 –7,058 –11,266 Royalties, license fees . . . . . 35,202 43,403 48,871 58,511 71,324 72,502 67,334 72,133 Other private services . . . . . 39,707 50,843 55,945 49,490 61,793 59,476 –13,863 –163,115 Other 1 . . . . . . . . . . . . . . . . . –6,488 –17,359 –15,594 –11,743 –10,826 –13,600 –3,346 –29,270 U.S. govt misc. services . . . . –1,844 –2,512 –2,567 –2,581 –2,731 –2,972 –3,346 –3,500
EXPORTS Total . . . . . . . . . . . . . . . . . . 1,072,783 1,163,146 1,287,441 1,459,823 1,654,561 1,842,682 1,575,037 1,837,577Goods . . . . . . . . . . . . . . . . . . 784,781 821,986 911,686 1,039,406 1,163,957 1,307,499 1,069,491 1,288,699Services . . . . . . . . . . . . . . . . . 288,002 341,160 375,755 420,417 490,604 535,183 505,547 548,878 Travel . . . . . . . . . . . . . . . . . . 82,891 75,465 82,160 86,187 97,355 110,423 94,191 103,505 Passenger fares . . . . . . . . . . 20,197 17,932 20,609 21,638 25,187 30,957 26,103 30,931 Other transportation . . . . . . 25,562 29,791 32,013 35,824 40,638 44,016 35,533 39,936 Royalties, license fees . . . . . 51,808 67,094 74,448 83,549 97,803 102,125 97,183 105,583 Other private services . . . . . 100,792 141,465 153,665 176,798 211,641 232,019 234,858 250,320 Other 1 . . . . . . . . . . . . . . . . . 6,210 8,751 12,082 15,587 17,091 14,711 16,611 17,483 U.S. govt misc. services . . . . 542 663 778 834 890 933 1,069 1,121
IMPORTS Total . . . . . . . . . . . . . . . . . . 1,449,532 1,768,502 1,996,065 2,213,111 2,351,289 2,541,020 1,956,310 2,337,604Goods . . . . . . . . . . . . . . . . . . 1,230,568 1,485,492 1,692,416 1,875,095 1,982,843 2,137,608 1,575,400 1,934,555Services . . . . . . . . . . . . . . . . . 218,964 283,010 303,649 338,016 368,446 403,413 380,909 403,048 Travel . . . . . . . . . . . . . . . . . . 65,366 66,738 69,930 72,959 77,127 80,494 74,118 75,507 Passenger fares . . . . . . . . . . 23,613 23,730 25,189 26,646 27,681 31,841 25,137 27,279 Other transportation . . . . . . 37,209 48,945 54,212 55,320 55,773 56,696 42,591 51,202 Royalties, license fees . . . . . 16,606 23,691 25,577 25,038 26,479 29,623 29,849 33,450 Other private services . . . . . 61,085 90,622 97,720 127,308 149,848 172,543 174,325 180,598 Other 1 . . . . . . . . . . . . . . . . . 12,698 26,110 27,676 27,330 27,917 28,311 30,474 30,391 U.S. govt misc. services . . . . 2,386 3,175 3,345 3,415 3,621 3,905 4,415 4,621
1 Represents transfers under U.S. military sales contracts for exports and direct defense expenditures for imports.Source: U.S. Census Bureau, U.S. International Trade in Goods and Services, Annual Revision for 2010, Series FT-900(11-04)
and previous reports. See also <http://www.census.gov/foreign-trade/Press-Release/2010pr/final_revisions/>.
Table 1301. U.S. International Trade in Goods by Related Parties: 2000 to 2010[In millions of dollars (1,205,339 represents $1,205,339,000,000). “Related party trade” is trade by U.S. companies with their subsidiaries abroad as well as trade by U.S. subsidiaries of foreign companies with their parent companies. Based on the North American Industry Classification System (NAICS), 2002; see text, Section 15]
Country and commodity 2002
NAICS code 2000 2005 2008 2009 2010
IMPORTS FOR CONSUMPTION Total imports . . . . . . . . . . . . . . . . . . . . . . . . . . . . . (X) 1,205,339 1,662,380 2,090,483 1,549,163 1,898,610 Related party trade, total 1 . . . . . . . . . . . . . . . . . . (X) 563,084 775,730 975,096 740,481 922,202Canada . . . . . . . . . . . . . . . . . . . . . . . . . . . . . . . . . . . (X) 100,689 127,719 156,666 107,315 138,222Japan . . . . . . . . . . . . . . . . . . . . . . . . . . . . . . . . . . . . . (X) 108,290 108,322 111,898 73,859 93,892Mexico . . . . . . . . . . . . . . . . . . . . . . . . . . . . . . . . . . . . (X) 89,068 99,709 111,979 100,935 135,984China 2 . . . . . . . . . . . . . . . . . . . . . . . . . . . . . . . . . . . . (X) 18,061 62,716 89,339 84,829 107,038Germany . . . . . . . . . . . . . . . . . . . . . . . . . . . . . . . . . . (X) 37,781 51,870 64,058 45,000 53,951
Transportation equipment . . . . . . . . . . . . . . . . . . . . . 336 161,150 188,445 189,984 132,812 179,516Computer & electronic products . . . . . . . . . . . . . . . . 334 166,279 176,719 182,337 163,662 203,900Chemicals . . . . . . . . . . . . . . . . . . . . . . . . . . . . . . . . . 325 45,452 84,459 137,095 118,149 134,065Machinery, except electrical . . . . . . . . . . . . . . . . . . . 333 39,918 56,804 62,192 42,216 53,747Oil & gas . . . . . . . . . . . . . . . . . . . . . . . . . . . . . . . . . . 211 13,241 48,725 104,091 61,700 80,071
EXPORTS Total exports . . . . . . . . . . . . . . . . . . . . . . . . . . . . . (X) 780,418 803,992 1,300,136 1,056,932 1,277,504 Related party trade, domestic exports, total 1 . . . (X) 196,596 245,712 373,646 261,332 314,489Canada . . . . . . . . . . . . . . . . . . . . . . . . . . . . . . . . . . . (X) 64,133 76,331 89,928 71,478 88,689Mexico . . . . . . . . . . . . . . . . . . . . . . . . . . . . . . . . . . . . (X) 34,249 44,570 51,789 39,653 49,313Japan . . . . . . . . . . . . . . . . . . . . . . . . . . . . . . . . . . . . . (X) 20,313 17,427 18,825 15,038 16,718Netherlands . . . . . . . . . . . . . . . . . . . . . . . . . . . . . . . . (X) 6,845 9,308 16,364 15,784 15,070Germany . . . . . . . . . . . . . . . . . . . . . . . . . . . . . . . . . . (X) 6,751 9,250 18,275 11,902 12,588
Transportation equipment . . . . . . . . . . . . . . . . . . . . . 336 46,288 52,513 63,946 43,758 55,400Chemicals . . . . . . . . . . . . . . . . . . . . . . . . . . . . . . . . . 325 26,376 48,121 61,497 54,655 64,548Computer & electronic products . . . . . . . . . . . . . . . . 334 51,210 41,882 47,027 36,405 42,689Machinery, except electrical . . . . . . . . . . . . . . . . . . . 333 19,831 25,473 32,978 26,418 32,301Electrical equipment, appliances & components . . . . 335 7,575 9,888 11,806 8,624 10,494
X Not applicable. 1 Includes other countries and other commodities, not shown separately. 2 See footnote 4, Table 1332.Source: U.S. Census Bureau, “Related Party Trade—2010.” See <http://www.census.gov/foreign-trade/Press-Release/2010pr
/aip/related_party/rp10.pdf>.
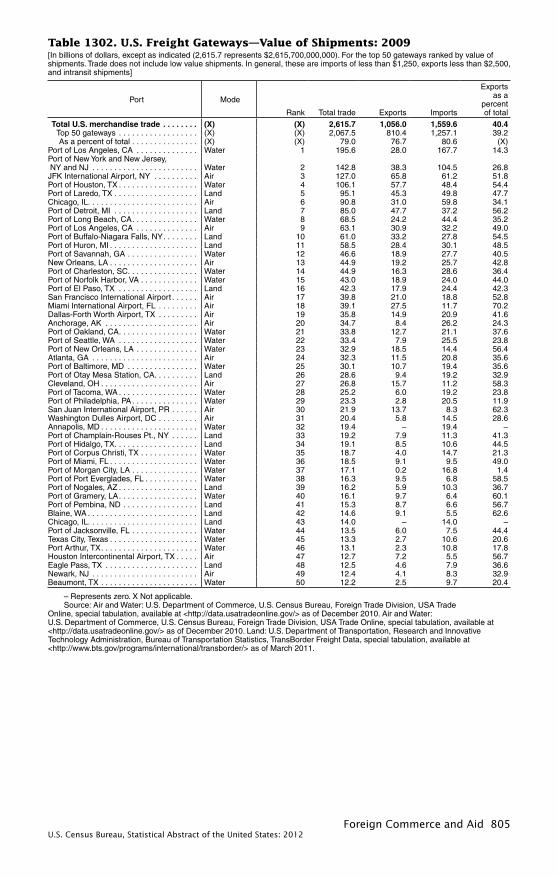
Foreign Commerce and Aid 805U.S. Census Bureau, Statistical Abstract of the United States: 2012
Table 1302. U.S. Freight Gateways—Value of Shipments: 2009[In billions of dollars, except as indicated (2,615.7 represents $2,615,700,000,000). For the top 50 gateways ranked by value of shipments. Trade does not include low value shipments. In general, these are imports of less than $1,250, exports less than $2,500, and intransit shipments]
Port Mode
Rank Total trade Exports Imports
Exports as a
percent of total
Total U .S . merchandise trade . . . . . . . . (X) (X) 2,615 .7 1,056 .0 1,559 .6 40 .4 Top 50 gateways . . . . . . . . . . . . . . . . . . (X) (X) 2,067.5 810.4 1,257.1 39.2 As a percent of total . . . . . . . . . . . . . . . (X) (X) 79.0 76.7 80.6 (X)Port of Los Angeles, CA . . . . . . . . . . . . . . Water 1 195.6 28.0 167.7 14.3Port of New York and New Jersey, NY and NJ . . . . . . . . . . . . . . . . . . . . . . . . Water 2 142.8 38.3 104.5 26.8JFK International Airport, NY . . . . . . . . . . Air 3 127.0 65.8 61.2 51.8Port of Houston, TX . . . . . . . . . . . . . . . . . . Water 4 106.1 57.7 48.4 54.4Port of Laredo, TX . . . . . . . . . . . . . . . . . . . Land 5 95.1 45.3 49.8 47.7Chicago, IL. . . . . . . . . . . . . . . . . . . . . . . . . Air 6 90.8 31.0 59.8 34.1Port of Detroit, MI . . . . . . . . . . . . . . . . . . . Land 7 85.0 47.7 37.2 56.2Port of Long Beach, CA . . . . . . . . . . . . . . . Water 8 68.5 24.2 44.4 35.2Port of Los Angeles, CA . . . . . . . . . . . . . . Air 9 63.1 30.9 32.2 49.0Port of Buffalo-Niagara Falls, NY . . . . . . . . Land 10 61.0 33.2 27.8 54.5Port of Huron, MI . . . . . . . . . . . . . . . . . . . . Land 11 58.5 28.4 30.1 48.5Port of Savannah, GA . . . . . . . . . . . . . . . . Water 12 46.6 18.9 27.7 40.5New Orleans, LA . . . . . . . . . . . . . . . . . . . . Air 13 44.9 19.2 25.7 42.8Port of Charleston, SC. . . . . . . . . . . . . . . . Water 14 44.9 16.3 28.6 36.4Port of Norfolk Harbor, VA . . . . . . . . . . . . . Water 15 43.0 18.9 24.0 44.0Port of El Paso, TX . . . . . . . . . . . . . . . . . . Land 16 42.3 17.9 24.4 42.3San Francisco International Airport . . . . . . Air 17 39.8 21.0 18.8 52.8Miami International Airport, FL . . . . . . . . . Air 18 39.1 27.5 11.7 70.2Dallas-Forth Worth Airport, TX . . . . . . . . . Air 19 35.8 14.9 20.9 41.6Anchorage, AK . . . . . . . . . . . . . . . . . . . . . Air 20 34.7 8.4 26.2 24.3Port of Oakland, CA . . . . . . . . . . . . . . . . . . Water 21 33.8 12.7 21.1 37.6Port of Seattle, WA . . . . . . . . . . . . . . . . . . Water 22 33.4 7.9 25.5 23.8Port of New Orleans, LA . . . . . . . . . . . . . . Water 23 32.9 18.5 14.4 56.4Atlanta, GA . . . . . . . . . . . . . . . . . . . . . . . . Air 24 32.3 11.5 20.8 35.6Port of Baltimore, MD . . . . . . . . . . . . . . . . Water 25 30.1 10.7 19.4 35.6Port of Otay Mesa Station, CA. . . . . . . . . . Land 26 28.6 9.4 19.2 32.9Cleveland, OH . . . . . . . . . . . . . . . . . . . . . . Air 27 26.8 15.7 11.2 58.3Port of Tacoma, WA . . . . . . . . . . . . . . . . . . Water 28 25.2 6.0 19.2 23.8Port of Philadelphia, PA . . . . . . . . . . . . . . . Water 29 23.3 2.8 20.5 11.9San Juan International Airport, PR . . . . . . Air 30 21.9 13.7 8.3 62.3Washington Dulles Airport, DC . . . . . . . . . Air 31 20.4 5.8 14.5 28.6Annapolis, MD . . . . . . . . . . . . . . . . . . . . . . Water 32 19.4 – 19.4 –Port of Champlain-Rouses Pt., NY . . . . . . Land 33 19.2 7.9 11.3 41.3Port of Hidalgo, TX. . . . . . . . . . . . . . . . . . . Land 34 19.1 8.5 10.6 44.5Port of Corpus Christi, TX . . . . . . . . . . . . . Water 35 18.7 4.0 14.7 21.3Port of Miami, FL . . . . . . . . . . . . . . . . . . . . Water 36 18.5 9.1 9.5 49.0Port of Morgan City, LA . . . . . . . . . . . . . . . Water 37 17.1 0.2 16.8 1.4Port of Port Everglades, FL . . . . . . . . . . . . Water 38 16.3 9.5 6.8 58.5Port of Nogales, AZ . . . . . . . . . . . . . . . . . . Land 39 16.2 5.9 10.3 36.7Port of Gramery, LA . . . . . . . . . . . . . . . . . . Water 40 16.1 9.7 6.4 60.1Port of Pembina, ND . . . . . . . . . . . . . . . . . Land 41 15.3 8.7 6.6 56.7Blaine, WA . . . . . . . . . . . . . . . . . . . . . . . . . Land 42 14.6 9.1 5.5 62.6Chicago, IL. . . . . . . . . . . . . . . . . . . . . . . . . Land 43 14.0 – 14.0 –Port of Jacksonville, FL . . . . . . . . . . . . . . . Water 44 13.5 6.0 7.5 44.4Texas City, Texas . . . . . . . . . . . . . . . . . . . . Water 45 13.3 2.7 10.6 20.6Port Arthur, TX . . . . . . . . . . . . . . . . . . . . . . Water 46 13.1 2.3 10.8 17.8Houston Intercontinental Airport, TX . . . . . Air 47 12.7 7.2 5.5 56.7Eagle Pass, TX . . . . . . . . . . . . . . . . . . . . . Land 48 12.5 4.6 7.9 36.6Newark, NJ . . . . . . . . . . . . . . . . . . . . . . . . Air 49 12.4 4.1 8.3 32.9Beaumont, TX . . . . . . . . . . . . . . . . . . . . . . Water 50 12.2 2.5 9.7 20.4
– Represents zero. X Not applicable. Source: Air and Water: U.S. Department of Commerce, U.S. Census Bureau, Foreign Trade Division, USA Trade
Online, special tabulation, available at <http://data.usatradeonline.gov/> as of December 2010. Air and Water: U.S. Department of Commerce, U.S. Census Bureau, Foreign Trade Division, USA Trade Online, special tabulation, available at <http://data.usatradeonline.gov/> as of December 2010. Land: U.S. Department of Transportation, Research and Innovative Technology Administration, Bureau of Transportation Statistics, TransBorder Freight Data, special tabulation, available at <http://www.bts.gov/programs/international/transborder/> as of March 2011.
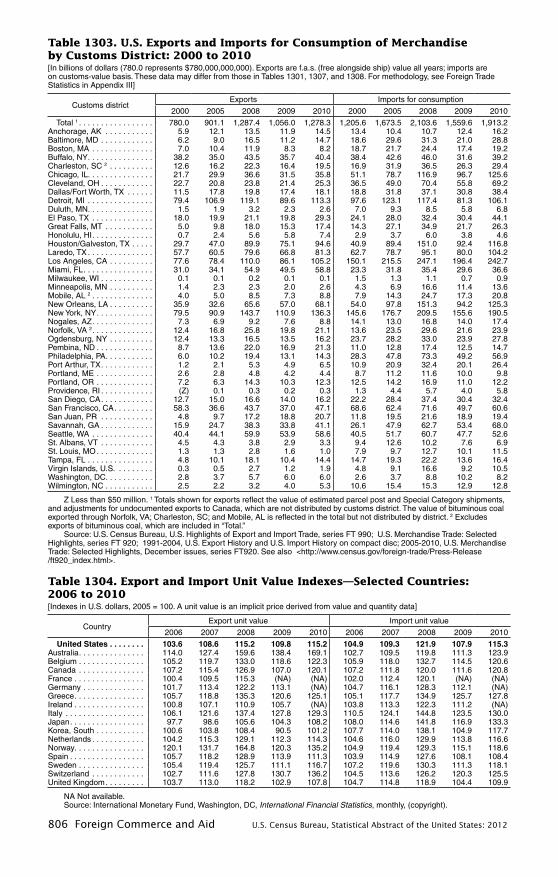
806 Foreign Commerce and Aid U.S. Census Bureau, Statistical Abstract of the United States: 2012
Table 1304. Export and Import Unit Value Indexes—Selected Countries: 2006 to 2010[Indexes in U.S. dollars, 2005 = 100. A unit value is an implicit price derived from value and quantity data]
CountryExport unit value Import unit value
2006 2007 2008 2009 2010 2006 2007 2008 2009 2010
United States . . . . . . . . 103 .6 108 .6 115 .2 109 .8 115 .2 104 .9 109 .3 121 .9 107 .9 115 .3Australia . . . . . . . . . . . . . . . 114.0 127.4 159.6 138.4 169.1 102.7 109.5 119.8 111.3 123.9Belgium . . . . . . . . . . . . . . . 105.2 119.7 133.0 118.6 122.3 105.9 118.0 132.7 114.5 120.6Canada . . . . . . . . . . . . . . . 107.2 115.4 126.9 107.0 120.1 107.2 111.8 120.0 111.6 120.8France . . . . . . . . . . . . . . . . 100.4 109.5 115.3 (NA) (NA) 102.0 112.4 120.1 (NA) (NA)Germany . . . . . . . . . . . . . . 101.7 113.4 122.2 113.1 (NA) 104.7 116.1 128.3 112.1 (NA)Greece . . . . . . . . . . . . . . . . 105.7 118.8 135.3 120.6 125.1 105.1 117.7 134.9 125.7 127.8Ireland . . . . . . . . . . . . . . . . 100.8 107.1 110.9 105.7 (NA) 103.8 113.3 122.3 111.2 (NA)Italy . . . . . . . . . . . . . . . . . . 106.1 121.6 137.4 127.8 129.3 110.5 124.1 144.8 123.5 130.0Japan . . . . . . . . . . . . . . . . . 97.7 98.6 105.6 104.3 108.2 108.0 114.6 141.8 116.9 133.3Korea, South . . . . . . . . . . . 100.6 103.8 108.4 90.5 101.2 107.7 114.0 138.1 104.9 117.7Netherlands . . . . . . . . . . . . 104.2 115.3 129.1 112.3 114.3 104.6 116.0 129.9 113.8 116.6Norway. . . . . . . . . . . . . . . . 120.1 131.7 164.8 120.3 135.2 104.9 119.4 129.3 115.1 118.6Spain . . . . . . . . . . . . . . . . . 105.7 118.2 128.9 113.9 111.3 103.9 114.9 127.6 108.1 108.4Sweden . . . . . . . . . . . . . . . 105.4 119.4 125.7 111.1 116.7 107.2 119.6 130.3 111.3 118.1Switzerland . . . . . . . . . . . . 102.7 111.6 127.8 130.7 136.2 104.5 113.6 126.2 120.3 125.5United Kingdom . . . . . . . . . 103.7 113.0 118.2 102.9 107.8 104.7 114.8 118.9 104.4 109.9
NA Not available.Source: International Monetary Fund, Washington, DC, International Financial Statistics, monthly, (copyright).
Table 1303. U.S. Exports and Imports for Consumption of Merchandise by Customs District: 2000 to 2010[In billions of dollars (780.0 represents $780,000,000,000). Exports are f.a.s. (free alongside ship) value all years; imports are on customs-value basis. These data may differ from those in Tables 1301, 1307, and 1308. For methodology, see Foreign Trade Statistics in Appendix III]
Customs districtExports Imports for consumption
2000 2005 2008 2009 2010 2000 2005 2008 2009 2010
Total 1 . . . . . . . . . . . . . . . . . 780.0 901.1 1,287.4 1,056.0 1,278.3 1,205.6 1,673.5 2,103.6 1,559.6 1,913.2Anchorage, AK . . . . . . . . . . . 5.9 12.1 13.5 11.9 14.5 13.4 10.4 10.7 12.4 16.2Baltimore, MD . . . . . . . . . . . . 6.2 9.0 16.5 11.2 14.7 18.6 29.6 31.3 21.0 28.8Boston, MA . . . . . . . . . . . . . . 7.0 10.4 11.9 8.3 8.2 18.7 21.7 24.4 17.4 19.2Buffalo, NY . . . . . . . . . . . . . . . 38.2 35.0 43.5 35.7 40.4 38.4 42.6 46.0 31.6 39.2Charleston, SC 2 . . . . . . . . . . 12.6 16.2 22.3 16.4 19.5 16.9 31.9 36.5 26.3 29.4Chicago, IL. . . . . . . . . . . . . . . 21.7 29.9 36.6 31.5 35.8 51.1 78.7 116.9 96.7 125.6Cleveland, OH . . . . . . . . . . . . 22.7 20.8 23.8 21.4 25.3 36.5 49.0 70.4 55.8 69.2Dallas/Fort Worth, TX . . . . . . 11.5 17.8 19.8 17.4 18.1 18.8 31.8 37.1 30.8 38.4Detroit, MI . . . . . . . . . . . . . . . 79.4 106.9 119.1 89.6 113.3 97.6 123.1 117.4 81.3 106.1Duluth, MN . . . . . . . . . . . . . . . 1.5 1.9 3.2 2.3 2.6 7.0 9.3 8.5 5.8 6.8El Paso, TX . . . . . . . . . . . . . . 18.0 19.9 21.1 19.8 29.3 24.1 28.0 32.4 30.4 44.1Great Falls, MT . . . . . . . . . . . 5.0 9.8 18.0 15.3 17.4 14.3 27.1 34.9 21.7 26.3Honolulu, HI . . . . . . . . . . . . . . 0.7 2.4 5.6 5.8 7.4 2.9 3.7 6.0 3.8 4.6Houston/Galveston, TX . . . . . 29.7 47.0 89.9 75.1 94.6 40.9 89.4 151.0 92.4 116.8Laredo, TX . . . . . . . . . . . . . . . 57.7 60.5 79.6 66.8 81.3 62.7 78.7 95.1 80.0 104.2Los Angeles, CA . . . . . . . . . . 77.6 78.4 110.0 86.1 105.2 150.1 215.5 247.1 196.4 242.7Miami, FL . . . . . . . . . . . . . . . . 31.0 34.1 54.9 49.5 58.8 23.3 31.8 35.4 29.6 36.6Milwaukee, WI . . . . . . . . . . . . 0.1 0.1 0.2 0.1 0.1 1.5 1.3 1.1 0.7 0.9Minneapolis, MN . . . . . . . . . . 1.4 2.3 2.3 2.0 2.6 4.3 6.9 16.6 11.4 13.6Mobile, AL 2 . . . . . . . . . . . . . . 4.0 5.0 8.5 7.3 8.8 7.9 14.3 24.7 17.3 20.8New Orleans, LA . . . . . . . . . . 35.9 32.6 65.6 57.0 68.1 54.0 97.8 151.3 94.2 125.3New York, NY . . . . . . . . . . . . . 79.5 90.9 143.7 110.9 136.3 145.6 176.7 209.5 155.6 190.5Nogales, AZ . . . . . . . . . . . . . . 7.3 6.9 9.2 7.6 8.8 14.1 13.0 16.8 14.0 17.4Norfolk, VA 2 . . . . . . . . . . . . . . 12.4 16.8 25.8 19.8 21.1 13.6 23.5 29.6 21.6 23.9Ogdensburg, NY . . . . . . . . . . 12.4 13.3 16.5 13.5 16.2 23.7 28.2 33.0 23.9 27.8Pembina, ND . . . . . . . . . . . . . 8.7 13.6 22.0 16.9 21.3 11.0 12.8 17.4 12.5 14.7Philadelphia, PA . . . . . . . . . . . 6.0 10.2 19.4 13.1 14.3 28.3 47.8 73.3 49.2 56.9Port Arthur, TX . . . . . . . . . . . . 1.2 2.1 5.3 4.9 6.5 10.9 20.9 32.4 20.1 26.4Portland, ME . . . . . . . . . . . . . 2.6 2.8 4.8 4.2 4.4 8.7 11.2 11.6 10.0 9.8Portland, OR . . . . . . . . . . . . . 7.2 6.3 14.3 10.3 12.3 12.5 14.2 16.9 11.0 12.2Providence, RI . . . . . . . . . . . . (Z) 0.1 0.3 0.2 0.3 1.3 4.4 5.7 4.0 5.8San Diego, CA . . . . . . . . . . . . 12.7 15.0 16.6 14.0 16.2 22.2 28.4 37.4 30.4 32.4San Francisco, CA . . . . . . . . . 58.3 36.6 43.7 37.0 47.1 68.6 62.4 71.6 49.7 60.6San Juan, PR . . . . . . . . . . . . 4.8 9.7 17.2 18.8 20.7 11.8 19.5 21.6 18.9 19.4Savannah, GA . . . . . . . . . . . . 15.9 24.7 38.3 33.8 41.1 26.1 47.9 62.7 53.4 68.0Seattle, WA . . . . . . . . . . . . . . 40.4 44.1 59.9 53.9 58.6 40.5 51.7 60.7 47.7 52.6St. Albans, VT . . . . . . . . . . . . 4.5 4.3 3.8 2.9 3.3 9.4 12.6 10.2 7.6 6.9St. Louis, MO . . . . . . . . . . . . . 1.3 1.3 2.8 1.6 1.0 7.9 9.7 12.7 10.1 11.5Tampa, FL . . . . . . . . . . . . . . . 4.8 10.1 18.1 10.4 14.4 14.7 19.3 22.2 13.6 16.4Virgin Islands, U.S. . . . . . . . . 0.3 0.5 2.7 1.2 1.9 4.8 9.1 16.6 9.2 10.5Washington, DC. . . . . . . . . . . 2.8 3.7 5.7 6.0 6.0 2.6 3.7 8.8 10.2 8.2Wilmington, NC . . . . . . . . . . . 2.5 2.2 3.2 4.0 5.3 10.6 15.4 15.3 12.9 12.8
Z Less than $50 million. 1 Totals shown for exports reflect the value of estimated parcel post and Special Category shipments, and adjustments for undocumented exports to Canada, which are not distributed by customs district. The value of bituminous coal exported through Norfolk, VA; Charleston, SC; and Mobile, AL is reflected in the total but not distributed by district. 2 Excludes exports of bituminous coal, which are included in “Total.”
Source: U.S. Census Bureau, U.S. Highlights of Export and Import Trade, series FT 990; U.S. Merchandise Trade: Selected Highlights, series FT 920; 1991-2004, U.S. Export History and U.S. Import History on compact disc; 2005-2010, U.S. Merchandise Trade: Selected Highlights, December issues, series FT920. See also <http://www.census.gov/foreign-trade/Press-Release /ft920_index.html>.
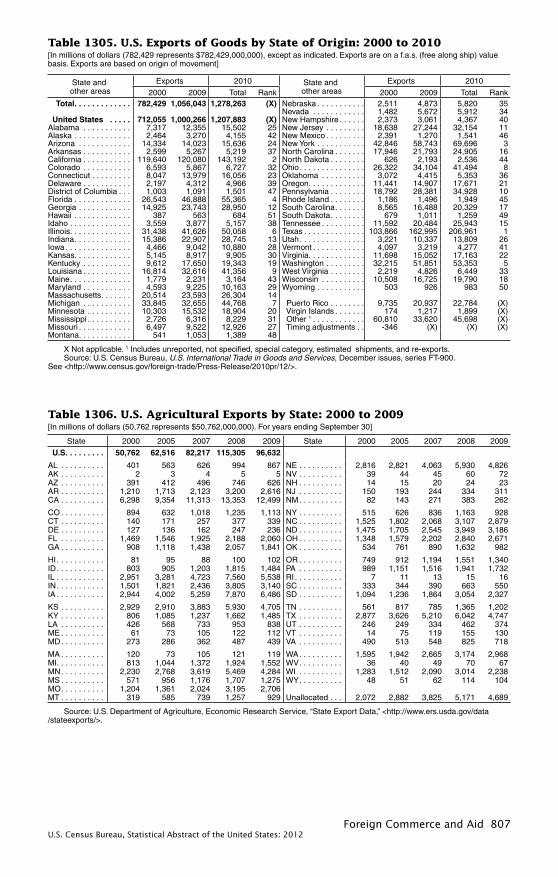
Foreign Commerce and Aid 807U.S. Census Bureau, Statistical Abstract of the United States: 2012
Table 1306. U.S. Agricultural Exports by State: 2000 to 2009[In millions of dollars (50,762 represents $50,762,000,000). For years ending September 30]
State 2000 2005 2007 2008 2009 State 2000 2005 2007 2008 2009
U .S . . . . . . . . . 50,762 62,516 82,217 115,305 96,632
AL . . . . . . . . . . 401 563 626 994 867 NE . . . . . . . . . . 2,816 2,821 4,063 5,930 4,826AK . . . . . . . . . . 2 3 4 5 5 NV . . . . . . . . . . 39 44 45 60 72AZ . . . . . . . . . . 391 412 496 746 626 NH . . . . . . . . . . 14 15 20 24 23AR . . . . . . . . . . 1,210 1,713 2,123 3,200 2,616 NJ . . . . . . . . . . 150 193 244 334 311CA . . . . . . . . . . 6,298 9,354 11,313 13,353 12,499 NM . . . . . . . . . . 82 143 271 383 262
CO . . . . . . . . . . 894 632 1,018 1,235 1,113 NY . . . . . . . . . . 515 626 836 1,163 928CT . . . . . . . . . . 140 171 257 377 339 NC . . . . . . . . . . 1,525 1,802 2,068 3,107 2,879DE . . . . . . . . . . 127 136 162 247 236 ND . . . . . . . . . . 1,475 1,705 2,545 3,949 3,186FL . . . . . . . . . . 1,469 1,546 1,925 2,188 2,060 OH . . . . . . . . . . 1,348 1,579 2,202 2,840 2,671GA . . . . . . . . . . 908 1,118 1,438 2,057 1,841 OK . . . . . . . . . . 534 761 890 1,632 982
HI . . . . . . . . . . . 81 95 88 100 102 OR . . . . . . . . . . 749 912 1,194 1,551 1,340ID . . . . . . . . . . . 803 905 1,203 1,815 1,484 PA . . . . . . . . . . 989 1,151 1,516 1,941 1,732IL . . . . . . . . . . . 2,951 3,281 4,723 7,560 5,538 RI . . . . . . . . . . . 7 11 13 15 16IN . . . . . . . . . . . 1,501 1,821 2,436 3,805 3,140 SC . . . . . . . . . . 333 344 390 663 550IA . . . . . . . . . . . 2,944 4,002 5,259 7,870 6,486 SD . . . . . . . . . . 1,094 1,236 1,864 3,054 2,327
KS . . . . . . . . . . 2,929 2,910 3,883 5,930 4,705 TN . . . . . . . . . . 561 817 785 1,365 1,202KY . . . . . . . . . . 806 1,085 1,237 1,662 1,485 TX . . . . . . . . . . 2,877 3,626 5,210 6,042 4,747LA . . . . . . . . . . 426 568 733 953 838 UT . . . . . . . . . . 246 249 334 462 374ME . . . . . . . . . . 61 73 105 122 112 VT . . . . . . . . . . 14 75 119 155 130MD . . . . . . . . . . 273 286 362 487 439 VA . . . . . . . . . . 490 513 548 825 718
MA . . . . . . . . . . 120 73 105 121 119 WA . . . . . . . . . . 1,595 1,942 2,665 3,174 2,968MI . . . . . . . . . . . 813 1,044 1,372 1,924 1,552 WV . . . . . . . . . . 36 40 49 70 67MN . . . . . . . . . . 2,230 2,768 3,619 5,469 4,284 WI . . . . . . . . . . 1,283 1,512 2,090 3,014 2,238MS . . . . . . . . . . 571 956 1,176 1,707 1,275 WY . . . . . . . . . . 48 51 62 114 104MO . . . . . . . . . . 1,204 1,361 2,024 3,195 2,706MT . . . . . . . . . . 319 585 739 1,257 929 Unallocated . . . 2,072 2,882 3,825 5,171 4,689
Source: U.S. Department of Agriculture, Economic Research Service, “State Export Data,” <http://www.ers.usda.gov/data /stateexports/>.
Table 1305. U.S. Exports of Goods by State of Origin: 2000 to 2010[In millions of dollars (782,429 represents $782,429,000,000), except as indicated. Exports are on a f.a.s. (free along ship) value basis. Exports are based on origin of movement]
X Not applicable. 1 Includes unreported, not specified, special category, estimated shipments, and re-exports.Source: U.S. Census Bureau, U .S . International Trade in Goods and Services, December issues, series FT-900.
See <http://www.census.gov/foreign-trade/Press-Release/2010pr/12/>.
State and other areas
Exports 2010
2000 2009 Total Rank Total . . . . . . . . . . . . . 782,429 1,056,043 1,278,263 (X)
United States . . . . . 712,055 1,000,266 1,207,883 (X)Alabama . . . . . . . . . . . 7,317 12,355 15,502 25Alaska . . . . . . . . . . . . . 2,464 3,270 4,155 42Arizona . . . . . . . . . . . . 14,334 14,023 15,636 24Arkansas . . . . . . . . . . . 2,599 5,267 5,219 37California . . . . . . . . . . . 119,640 120,080 143,192 2Colorado . . . . . . . . . . . 6,593 5,867 6,727 32Connecticut . . . . . . . . . 8,047 13,979 16,056 23Delaware . . . . . . . . . . . 2,197 4,312 4,966 39District of Columbia . . . 1,003 1,091 1,501 47Florida . . . . . . . . . . . . . 26,543 46,888 55,365 4Georgia . . . . . . . . . . . . 14,925 23,743 28,950 12Hawaii . . . . . . . . . . . . . 387 563 684 51Idaho . . . . . . . . . . . . . . 3,559 3,877 5,157 38Illinois . . . . . . . . . . . . . . 31,438 41,626 50,058 6Indiana . . . . . . . . . . . . . 15,386 22,907 28,745 13Iowa . . . . . . . . . . . . . . . 4,466 9,042 10,880 28Kansas . . . . . . . . . . . . . 5,145 8,917 9,905 30Kentucky . . . . . . . . . . . 9,612 17,650 19,343 19Louisiana . . . . . . . . . . . 16,814 32,616 41,356 9Maine . . . . . . . . . . . . . . 1,779 2,231 3,164 43Maryland . . . . . . . . . . . 4,593 9,225 10,163 29Massachusetts . . . . . . . 20,514 23,593 26,304 14Michigan . . . . . . . . . . . 33,845 32,655 44,768 7Minnesota . . . . . . . . . . 10,303 15,532 18,904 20Mississippi . . . . . . . . . . 2,726 6,316 8,229 31Missouri . . . . . . . . . . . . 6,497 9,522 12,926 27Montana . . . . . . . . . . . . 541 1,053 1,389 48
State and other areas
Exports 2010
2000 2009 Total Rank Nebraska . . . . . . . . . . . 2,511 4,873 5,820 35Nevada . . . . . . . . . . . . 1,482 5,672 5,912 34New Hampshire . . . . . . 2,373 3,061 4,367 40New Jersey . . . . . . . . . 18,638 27,244 32,154 11New Mexico . . . . . . . . . 2,391 1,270 1,541 46New York . . . . . . . . . . . 42,846 58,743 69,696 3North Carolina . . . . . . . 17,946 21,793 24,905 16North Dakota . . . . . . . . 626 2,193 2,536 44Ohio . . . . . . . . . . . . . . . 26,322 34,104 41,494 8Oklahoma . . . . . . . . . . 3,072 4,415 5,353 36Oregon . . . . . . . . . . . . . 11,441 14,907 17,671 21Pennsylvania . . . . . . . . 18,792 28,381 34,928 10Rhode Island . . . . . . . . 1,186 1,496 1,949 45South Carolina . . . . . . . 8,565 16,488 20,329 17South Dakota . . . . . . . . 679 1,011 1,259 49Tennessee . . . . . . . . . . 11,592 20,484 25,943 15Texas . . . . . . . . . . . . . . 103,866 162,995 206,961 1Utah . . . . . . . . . . . . . . . 3,221 10,337 13,809 26Vermont . . . . . . . . . . . . 4,097 3,219 4,277 41Virginia . . . . . . . . . . . . . 11,698 15,052 17,163 22Washington . . . . . . . . . 32,215 51,851 53,353 5West Virginia . . . . . . . . 2,219 4,826 6,449 33Wisconsin . . . . . . . . . . 10,508 16,725 19,790 18Wyoming . . . . . . . . . . . 503 926 983 50
Puerto Rico . . . . . . . . 9,735 20,937 22,784 (X) Virgin Islands . . . . . . . 174 1,217 1,899 (X) Other 1 . . . . . . . . . . . . 60,810 33,620 45,698 (X) Timing adjustments . . -346 (X) (X) (X)
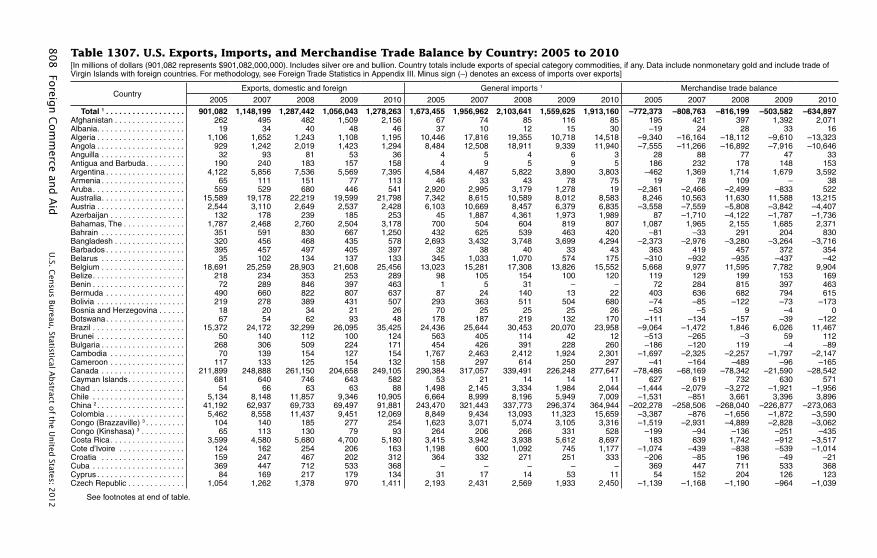
80
8 Fo
reign C
om
merce an
d A
id U
.S. Cen
sus Bu
reau, Statistical A
bstract o
f the U
nited
States: 20
12
Table 1307. U.S. Exports, Imports, and Merchandise Trade Balance by Country: 2005 to 2010[In millions of dollars (901,082 represents $901,082,000,000). Includes silver ore and bullion. Country totals include exports of special category commodities, if any. Data include nonmonetary gold and include trade of Virgin Islands with foreign countries. For methodology, see Foreign Trade Statistics in Appendix III. Minus sign (–) denotes an excess of imports over exports]
CountryExports, domestic and foreign General imports 1 Merchandise trade balance
2005 2007 2008 2009 2010 2005 2007 2008 2009 2010 2005 2007 2008 2009 2010
Total 1 . . . . . . . . . . . . . . . . . . 901,082 1,148,199 1,287,442 1,056,043 1,278,263 1,673,455 1,956,962 2,103,641 1,559,625 1,913,160 –772,373 –808,763 –816,199 –503,582 –634,897Afghanistan . . . . . . . . . . . . . . . . 262 495 482 1,509 2,156 67 74 85 116 85 195 421 397 1,392 2,071Albania . . . . . . . . . . . . . . . . . . . . 19 34 40 48 46 37 10 12 15 30 –19 24 28 33 16Algeria . . . . . . . . . . . . . . . . . . . . 1,106 1,652 1,243 1,108 1,195 10,446 17,816 19,355 10,718 14,518 –9,340 –16,164 –18,112 –9,610 –13,323Angola . . . . . . . . . . . . . . . . . . . . 929 1,242 2,019 1,423 1,294 8,484 12,508 18,911 9,339 11,940 –7,555 –11,266 –16,892 –7,916 –10,646Anguilla . . . . . . . . . . . . . . . . . . . 32 93 81 53 36 4 5 4 6 3 28 88 77 47 33Antigua and Barbuda . . . . . . . . . 190 240 183 157 158 4 9 5 9 5 186 232 178 148 153Argentina . . . . . . . . . . . . . . . . . . 4,122 5,856 7,536 5,569 7,395 4,584 4,487 5,822 3,890 3,803 –462 1,369 1,714 1,679 3,592Armenia . . . . . . . . . . . . . . . . . . . 65 111 151 77 113 46 33 43 78 75 19 78 109 – 38Aruba . . . . . . . . . . . . . . . . . . . . . 559 529 680 446 541 2,920 2,995 3,179 1,278 19 –2,361 –2,466 –2,499 –833 522Australia . . . . . . . . . . . . . . . . . . . 15,589 19,178 22,219 19,599 21,798 7,342 8,615 10,589 8,012 8,583 8,246 10,563 11,630 11,588 13,215Austria . . . . . . . . . . . . . . . . . . . . 2,544 3,110 2,649 2,537 2,428 6,103 10,669 8,457 6,379 6,835 –3,558 –7,559 –5,808 –3,842 –4,407Azerbaijan . . . . . . . . . . . . . . . . . 132 178 239 185 253 45 1,887 4,361 1,973 1,989 87 –1,710 –4,122 –1,787 –1,736Bahamas, The . . . . . . . . . . . . . . 1,787 2,468 2,760 2,504 3,178 700 504 604 819 807 1,087 1,965 2,155 1,685 2,371Bahrain . . . . . . . . . . . . . . . . . . . 351 591 830 667 1,250 432 625 539 463 420 –81 –33 291 204 830Bangladesh . . . . . . . . . . . . . . . . 320 456 468 435 578 2,693 3,432 3,748 3,699 4,294 –2,373 –2,976 –3,280 –3,264 –3,716Barbados . . . . . . . . . . . . . . . . . . 395 457 497 405 397 32 38 40 33 43 363 419 457 372 354Belarus . . . . . . . . . . . . . . . . . . . 35 102 134 137 133 345 1,033 1,070 574 175 –310 –932 –935 –437 –42Belgium . . . . . . . . . . . . . . . . . . . 18,691 25,259 28,903 21,608 25,456 13,023 15,281 17,308 13,826 15,552 5,668 9,977 11,595 7,782 9,904Belize . . . . . . . . . . . . . . . . . . . . . 218 234 353 253 289 98 105 154 100 120 119 129 199 153 169Benin . . . . . . . . . . . . . . . . . . . . . 72 289 846 397 463 1 5 31 – – 72 284 815 397 463Bermuda . . . . . . . . . . . . . . . . . . 490 660 822 807 637 87 24 140 13 22 403 636 682 794 615Bolivia . . . . . . . . . . . . . . . . . . . . 219 278 389 431 507 293 363 511 504 680 –74 –85 –122 –73 –173Bosnia and Herzegovina . . . . . . 18 20 34 21 26 70 25 25 25 26 –53 –5 9 –4 0Botswana . . . . . . . . . . . . . . . . . . 67 54 62 93 48 178 187 219 132 170 –111 –134 –157 –39 –122Brazil . . . . . . . . . . . . . . . . . . . . . 15,372 24,172 32,299 26,095 35,425 24,436 25,644 30,453 20,070 23,958 –9,064 –1,472 1,846 6,026 11,467Brunei . . . . . . . . . . . . . . . . . . . . 50 140 112 100 124 563 405 114 42 12 –513 –265 –3 59 112Bulgaria . . . . . . . . . . . . . . . . . . . 268 306 509 224 171 454 426 391 228 260 –186 –120 119 –4 –89Cambodia . . . . . . . . . . . . . . . . . 70 139 154 127 154 1,767 2,463 2,412 1,924 2,301 –1,697 –2,325 –2,257 –1,797 –2,147Cameroon . . . . . . . . . . . . . . . . . 117 133 125 154 132 158 297 614 250 297 –41 –164 –489 –96 –165Canada . . . . . . . . . . . . . . . . . . . 211,899 248,888 261,150 204,658 249,105 290,384 317,057 339,491 226,248 277,647 –78,486 –68,169 –78,342 –21,590 –28,542Cayman Islands . . . . . . . . . . . . . 681 640 746 643 582 53 21 14 14 11 627 619 732 630 571Chad . . . . . . . . . . . . . . . . . . . . . 54 66 63 63 88 1,498 2,145 3,334 1,984 2,044 –1,444 –2,079 –3,272 –1,921 –1,956Chile . . . . . . . . . . . . . . . . . . . . . 5,134 8,148 11,857 9,346 10,905 6,664 8,999 8,196 5,949 7,009 –1,531 –851 3,661 3,396 3,896China 2 . . . . . . . . . . . . . . . . . . . . 41,192 62,937 69,733 69,497 91,881 243,470 321,443 337,773 296,374 364,944 –202,278 –258,506 –268,040 –226,877 –273,063Colombia . . . . . . . . . . . . . . . . . . 5,462 8,558 11,437 9,451 12,069 8,849 9,434 13,093 11,323 15,659 –3,387 –876 –1,656 –1,872 –3,590Congo (Brazzaville) 3 . . . . . . . . . 104 140 185 277 254 1,623 3,071 5,074 3,105 3,316 –1,519 –2,931 –4,889 –2,828 –3,062Congo (Kinshasa) 3 . . . . . . . . . . 65 113 130 79 93 264 206 266 331 528 –199 –94 –136 –251 –435Costa Rica . . . . . . . . . . . . . . . . . 3,599 4,580 5,680 4,700 5,180 3,415 3,942 3,938 5,612 8,697 183 639 1,742 –912 –3,517Cote d’Ivoire . . . . . . . . . . . . . . . 124 162 254 206 163 1,198 600 1,092 745 1,177 –1,074 –439 –838 –539 –1,014Croatia . . . . . . . . . . . . . . . . . . . 159 247 467 202 312 364 332 271 251 333 –206 –85 196 –49 –21Cuba . . . . . . . . . . . . . . . . . . . . . 369 447 712 533 368 – – – – – 369 447 711 533 368Cyprus . . . . . . . . . . . . . . . . . . . . 84 169 217 179 134 31 17 14 53 11 54 152 204 126 123Czech Republic . . . . . . . . . . . . . 1,054 1,262 1,378 970 1,411 2,193 2,431 2,569 1,933 2,450 –1,139 –1,168 –1,190 –964 –1,039
See footnotes at end of table.
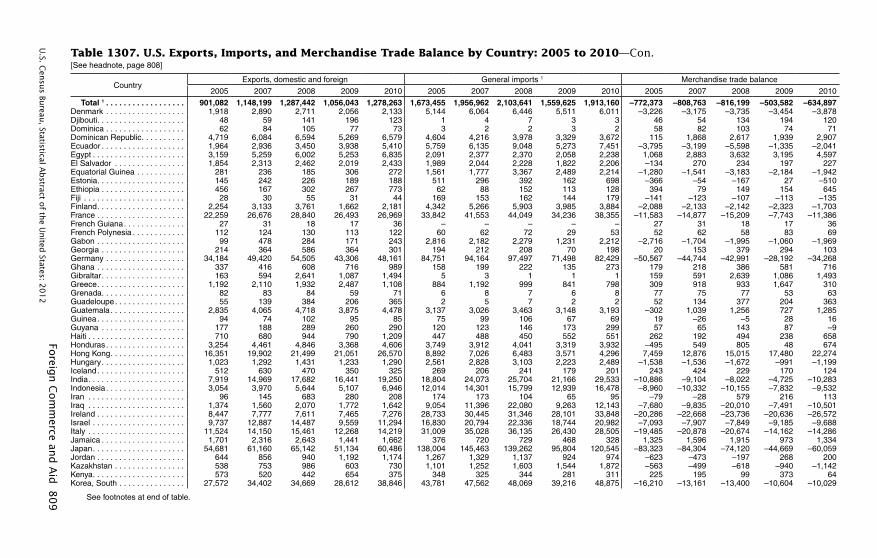
Foreig
n C
om
merce an
d A
id 8
09
U.S. C
ensu
s Bureau
, Statistical Abstract o
f the U
nited
States: 20
12
Table 1307. U.S. Exports, Imports, and Merchandise Trade Balance by Country: 2005 to 2010—Con.[See headnote, page 808]
CountryExports, domestic and foreign General imports 1 Merchandise trade balance
2005 2007 2008 2009 2010 2005 2007 2008 2009 2010 2005 2007 2008 2009 2010
Total 1 . . . . . . . . . . . . . . . . . . 901,082 1,148,199 1,287,442 1,056,043 1,278,263 1,673,455 1,956,962 2,103,641 1,559,625 1,913,160 –772,373 –808,763 –816,199 –503,582 –634,897Denmark . . . . . . . . . . . . . . . . . . 1,918 2,890 2,711 2,056 2,133 5,144 6,064 6,446 5,511 6,011 –3,226 –3,175 –3,735 –3,454 –3,878Djibouti . . . . . . . . . . . . . . . . . . . . 48 59 141 196 123 1 4 7 3 3 46 54 134 194 120Dominica . . . . . . . . . . . . . . . . . . 62 84 105 77 73 3 2 2 3 2 58 82 103 74 71Dominican Republic . . . . . . . . . . 4,719 6,084 6,594 5,269 6,579 4,604 4,216 3,978 3,329 3,672 115 1,868 2,617 1,939 2,907Ecuador . . . . . . . . . . . . . . . . . . . 1,964 2,936 3,450 3,938 5,410 5,759 6,135 9,048 5,273 7,451 –3,795 –3,199 –5,598 –1,335 –2,041Egypt . . . . . . . . . . . . . . . . . . . . . 3,159 5,259 6,002 5,253 6,835 2,091 2,377 2,370 2,058 2,238 1,068 2,883 3,632 3,195 4,597El Salvador . . . . . . . . . . . . . . . . 1,854 2,313 2,462 2,019 2,433 1,989 2,044 2,228 1,822 2,206 –134 270 234 197 227Equatorial Guinea . . . . . . . . . . . 281 236 185 306 272 1,561 1,777 3,367 2,489 2,214 –1,280 –1,541 –3,183 –2,184 –1,942Estonia . . . . . . . . . . . . . . . . . . . . 145 242 226 189 188 511 296 392 162 698 –366 –54 –167 27 –510Ethiopia . . . . . . . . . . . . . . . . . . . 456 167 302 267 773 62 88 152 113 128 394 79 149 154 645Fiji . . . . . . . . . . . . . . . . . . . . . . . 28 30 55 31 44 169 153 162 144 179 –141 –123 –107 –113 –135Finland . . . . . . . . . . . . . . . . . . . . 2,254 3,133 3,761 1,662 2,181 4,342 5,266 5,903 3,985 3,884 –2,088 –2,133 –2,142 –2,323 –1,703France . . . . . . . . . . . . . . . . . . . . 22,259 26,676 28,840 26,493 26,969 33,842 41,553 44,049 34,236 38,355 –11,583 –14,877 –15,209 –7,743 –11,386French Guiana . . . . . . . . . . . . . . 27 31 18 17 36 – – – – – 27 31 18 17 36French Polynesia . . . . . . . . . . . . 112 124 130 113 122 60 62 72 29 53 52 62 58 83 69Gabon . . . . . . . . . . . . . . . . . . . . 99 478 284 171 243 2,816 2,182 2,279 1,231 2,212 –2,716 –1,704 –1,995 –1,060 –1,969Georgia . . . . . . . . . . . . . . . . . . . 214 364 586 364 301 194 212 208 70 198 20 153 379 294 103Germany . . . . . . . . . . . . . . . . . . 34,184 49,420 54,505 43,306 48,161 84,751 94,164 97,497 71,498 82,429 –50,567 –44,744 –42,991 –28,192 –34,268Ghana . . . . . . . . . . . . . . . . . . . . 337 416 608 716 989 158 199 222 135 273 179 218 386 581 716Gibraltar . . . . . . . . . . . . . . . . . . . 163 594 2,641 1,087 1,494 5 3 1 1 1 159 591 2,639 1,086 1,493Greece . . . . . . . . . . . . . . . . . . . . 1,192 2,110 1,932 2,487 1,108 884 1,192 999 841 798 309 918 933 1,647 310Grenada . . . . . . . . . . . . . . . . . . . 82 83 84 59 71 6 8 7 6 8 77 75 77 53 63Guadeloupe . . . . . . . . . . . . . . . . 55 139 384 206 365 2 5 7 2 2 52 134 377 204 363Guatemala . . . . . . . . . . . . . . . . . 2,835 4,065 4,718 3,875 4,478 3,137 3,026 3,463 3,148 3,193 –302 1,039 1,256 727 1,285Guinea . . . . . . . . . . . . . . . . . . . . 94 74 102 95 85 75 99 106 67 69 19 –26 –5 28 16Guyana . . . . . . . . . . . . . . . . . . . 177 188 289 260 290 120 123 146 173 299 57 65 143 87 –9Haiti . . . . . . . . . . . . . . . . . . . . . . 710 680 944 790 1,209 447 488 450 552 551 262 192 494 238 658Honduras . . . . . . . . . . . . . . . . . . 3,254 4,461 4,846 3,368 4,606 3,749 3,912 4,041 3,319 3,932 –495 549 805 48 674Hong Kong . . . . . . . . . . . . . . . . . 16,351 19,902 21,499 21,051 26,570 8,892 7,026 6,483 3,571 4,296 7,459 12,876 15,015 17,480 22,274Hungary . . . . . . . . . . . . . . . . . . . 1,023 1,292 1,431 1,233 1,290 2,561 2,828 3,103 2,223 2,489 –1,538 –1,536 –1,672 –991 –1,199Iceland . . . . . . . . . . . . . . . . . . . . 512 630 470 350 325 269 206 241 179 201 243 424 229 170 124India . . . . . . . . . . . . . . . . . . . . . . 7,919 14,969 17,682 16,441 19,250 18,804 24,073 25,704 21,166 29,533 –10,886 –9,104 –8,022 –4,725 –10,283Indonesia . . . . . . . . . . . . . . . . . . 3,054 3,970 5,644 5,107 6,946 12,014 14,301 15,799 12,939 16,478 –8,960 –10,332 –10,155 –7,832 –9,532Iran . . . . . . . . . . . . . . . . . . . . . . 96 145 683 280 208 174 173 104 65 95 –79 –28 579 216 113Iraq . . . . . . . . . . . . . . . . . . . . . . 1,374 1,560 2,070 1,772 1,642 9,054 11,396 22,080 9,263 12,143 –7,680 –9,835 –20,010 –7,491 –10,501Ireland . . . . . . . . . . . . . . . . . . . . 8,447 7,777 7,611 7,465 7,276 28,733 30,445 31,346 28,101 33,848 –20,286 –22,668 –23,736 –20,636 –26,572Israel . . . . . . . . . . . . . . . . . . . . . 9,737 12,887 14,487 9,559 11,294 16,830 20,794 22,336 18,744 20,982 –7,093 –7,907 –7,849 –9,185 –9,688Italy . . . . . . . . . . . . . . . . . . . . . . 11,524 14,150 15,461 12,268 14,219 31,009 35,028 36,135 26,430 28,505 –19,485 –20,878 –20,674 –14,162 –14,286Jamaica . . . . . . . . . . . . . . . . . . . 1,701 2,316 2,643 1,441 1,662 376 720 729 468 328 1,325 1,596 1,915 973 1,334Japan . . . . . . . . . . . . . . . . . . . . . 54,681 61,160 65,142 51,134 60,486 138,004 145,463 139,262 95,804 120,545 –83,323 –84,304 –74,120 –44,669 –60,059Jordan . . . . . . . . . . . . . . . . . . . . 644 856 940 1,192 1,174 1,267 1,329 1,137 924 974 –623 –473 –197 268 200Kazakhstan . . . . . . . . . . . . . . . . 538 753 986 603 730 1,101 1,252 1,603 1,544 1,872 –563 –499 –618 –940 –1,142Kenya . . . . . . . . . . . . . . . . . . . . . 573 520 442 654 375 348 325 344 281 311 225 195 99 373 64Korea, South . . . . . . . . . . . . . . . 27,572 34,402 34,669 28,612 38,846 43,781 47,562 48,069 39,216 48,875 –16,210 –13,161 –13,400 –10,604 –10,029
See footnotes at end of table.
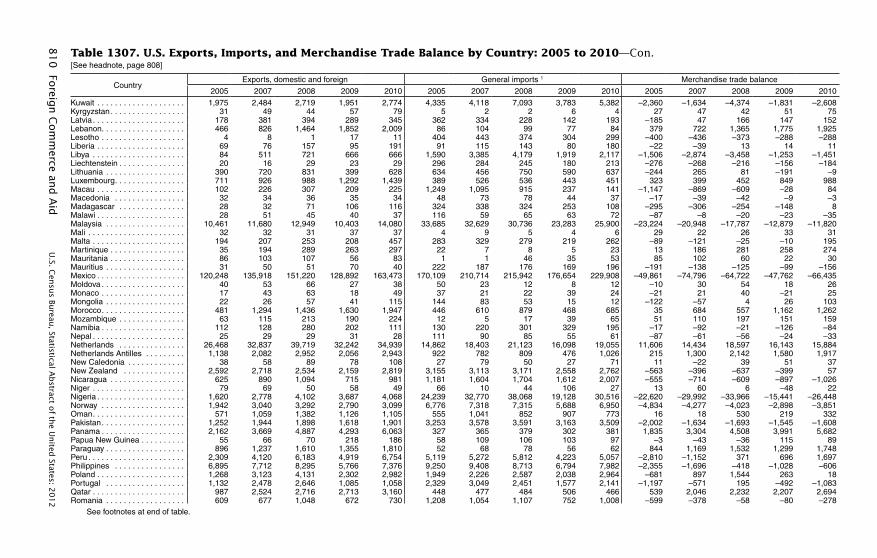
81
0 Fo
reign C
om
merce an
d A
id U
.S. Cen
sus Bu
reau, Statistical A
bstract o
f the U
nited
States: 20
12
Table 1307. U.S. Exports, Imports, and Merchandise Trade Balance by Country: 2005 to 2010—Con.[See headnote, page 808]
CountryExports, domestic and foreign General imports 1 Merchandise trade balance
2005 2007 2008 2009 2010 2005 2007 2008 2009 2010 2005 2007 2008 2009 2010
Kuwait . . . . . . . . . . . . . . . . . . . . 1,975 2,484 2,719 1,951 2,774 4,335 4,118 7,093 3,783 5,382 –2,360 –1,634 –4,374 –1,831 –2,608Kyrgyzstan . . . . . . . . . . . . . . . . . 31 49 44 57 79 5 2 2 6 4 27 47 42 51 75Latvia . . . . . . . . . . . . . . . . . . . . . 178 381 394 289 345 362 334 228 142 193 –185 47 166 147 152Lebanon. . . . . . . . . . . . . . . . . . . 466 826 1,464 1,852 2,009 86 104 99 77 84 379 722 1,365 1,775 1,925Lesotho . . . . . . . . . . . . . . . . . . . 4 8 1 17 11 404 443 374 304 299 –400 –436 –373 –288 –288Liberia . . . . . . . . . . . . . . . . . . . . 69 76 157 95 191 91 115 143 80 180 –22 –39 13 14 11Libya . . . . . . . . . . . . . . . . . . . . . 84 511 721 666 666 1,590 3,385 4,179 1,919 2,117 –1,506 –2,874 –3,458 –1,253 –1,451Liechtenstein . . . . . . . . . . . . . . . 20 16 29 23 29 296 284 245 180 213 –276 –268 –216 –156 –184Lithuania . . . . . . . . . . . . . . . . . . 390 720 831 399 628 634 456 750 590 637 –244 265 81 –191 –9Luxembourg . . . . . . . . . . . . . . . . 711 926 988 1,292 1,439 389 526 536 443 451 323 399 452 849 988Macau . . . . . . . . . . . . . . . . . . . . 102 226 307 209 225 1,249 1,095 915 237 141 –1,147 –869 –609 –28 84Macedonia . . . . . . . . . . . . . . . . 32 34 36 35 34 48 73 78 44 37 –17 –39 –42 –9 –3Madagascar . . . . . . . . . . . . . . . 28 32 71 106 116 324 338 324 253 108 –295 –306 –254 –148 8Malawi . . . . . . . . . . . . . . . . . . . . 28 51 45 40 37 116 59 65 63 72 –87 –8 –20 –23 –35Malaysia . . . . . . . . . . . . . . . . . . 10,461 11,680 12,949 10,403 14,080 33,685 32,629 30,736 23,283 25,900 –23,224 –20,948 –17,787 –12,879 –11,820Mali . . . . . . . . . . . . . . . . . . . . . . 32 32 31 37 37 4 9 5 4 6 29 22 26 33 31Malta . . . . . . . . . . . . . . . . . . . . . 194 207 253 208 457 283 329 279 219 262 –89 –121 –25 –10 195Martinique . . . . . . . . . . . . . . . . . 35 194 289 263 297 22 7 8 5 23 13 186 281 258 274Mauritania . . . . . . . . . . . . . . . . . 86 103 107 56 83 1 1 46 35 53 85 102 60 22 30Mauritius . . . . . . . . . . . . . . . . . . 31 50 51 70 40 222 187 176 169 196 –191 –138 –125 –99 –156Mexico . . . . . . . . . . . . . . . . . . . . 120,248 135,918 151,220 128,892 163,473 170,109 210,714 215,942 176,654 229,908 –49,861 –74,796 –64,722 –47,762 –66,435Moldova . . . . . . . . . . . . . . . . . . . 40 53 66 27 38 50 23 12 8 12 –10 30 54 18 26Monaco . . . . . . . . . . . . . . . . . . . 17 43 63 18 49 37 21 22 39 24 –21 21 40 –21 25Mongolia . . . . . . . . . . . . . . . . . . 22 26 57 41 115 144 83 53 15 12 –122 –57 4 26 103Morocco . . . . . . . . . . . . . . . . . . . 481 1,294 1,436 1,630 1,947 446 610 879 468 685 35 684 557 1,162 1,262Mozambique . . . . . . . . . . . . . . . 63 115 213 190 224 12 5 17 39 65 51 110 197 151 159Namibia . . . . . . . . . . . . . . . . . . . 112 128 280 202 111 130 220 301 329 195 –17 –92 –21 –126 –84Nepal . . . . . . . . . . . . . . . . . . . . . 25 29 29 31 28 111 90 85 55 61 –87 –61 –56 –24 –33Netherlands . . . . . . . . . . . . . . . 26,468 32,837 39,719 32,242 34,939 14,862 18,403 21,123 16,098 19,055 11,606 14,434 18,597 16,143 15,884Netherlands Antilles . . . . . . . . . 1,138 2,082 2,952 2,056 2,943 922 782 809 476 1,026 215 1,300 2,142 1,580 1,917New Caledonia . . . . . . . . . . . . . 38 58 89 78 108 27 79 50 27 71 11 –22 39 51 37New Zealand . . . . . . . . . . . . . . 2,592 2,718 2,534 2,159 2,819 3,155 3,113 3,171 2,558 2,762 –563 –396 –637 –399 57Nicaragua . . . . . . . . . . . . . . . . . 625 890 1,094 715 981 1,181 1,604 1,704 1,612 2,007 –555 –714 –609 –897 –1,026Niger . . . . . . . . . . . . . . . . . . . . . 79 69 50 58 49 66 10 44 106 27 13 60 6 –48 22Nigeria . . . . . . . . . . . . . . . . . . . . 1,620 2,778 4,102 3,687 4,068 24,239 32,770 38,068 19,128 30,516 –22,620 –29,992 –33,966 –15,441 –26,448Norway . . . . . . . . . . . . . . . . . . . 1,942 3,040 3,292 2,790 3,099 6,776 7,318 7,315 5,688 6,950 –4,834 –4,277 –4,023 –2,898 –3,851Oman . . . . . . . . . . . . . . . . . . . . . 571 1,059 1,382 1,126 1,105 555 1,041 852 907 773 16 18 530 219 332Pakistan . . . . . . . . . . . . . . . . . . . 1,252 1,944 1,898 1,618 1,901 3,253 3,578 3,591 3,163 3,509 –2,002 –1,634 –1,693 –1,545 –1,608Panama . . . . . . . . . . . . . . . . . . . 2,162 3,669 4,887 4,293 6,063 327 365 379 302 381 1,835 3,304 4,508 3,991 5,682Papua New Guinea . . . . . . . . . . 55 66 70 218 186 58 109 106 103 97 –3 –43 –36 115 89Paraguay . . . . . . . . . . . . . . . . . . 896 1,237 1,610 1,355 1,810 52 68 78 56 62 844 1,169 1,532 1,299 1,748Peru . . . . . . . . . . . . . . . . . . . . . . 2,309 4,120 6,183 4,919 6,754 5,119 5,272 5,812 4,223 5,057 –2,810 –1,152 371 696 1,697Philippines . . . . . . . . . . . . . . . . 6,895 7,712 8,295 5,766 7,376 9,250 9,408 8,713 6,794 7,982 –2,355 –1,696 –418 –1,028 –606Poland . . . . . . . . . . . . . . . . . . . . 1,268 3,123 4,131 2,302 2,982 1,949 2,226 2,587 2,038 2,964 –681 897 1,544 263 18Portugal . . . . . . . . . . . . . . . . . . 1,132 2,478 2,646 1,085 1,058 2,329 3,049 2,451 1,577 2,141 –1,197 –571 195 –492 –1,083Qatar . . . . . . . . . . . . . . . . . . . . . 987 2,524 2,716 2,713 3,160 448 477 484 506 466 539 2,046 2,232 2,207 2,694Romania . . . . . . . . . . . . . . . . . . 609 677 1,048 672 730 1,208 1,054 1,107 752 1,008 –599 –378 –58 –80 –278
See footnotes at end of table.
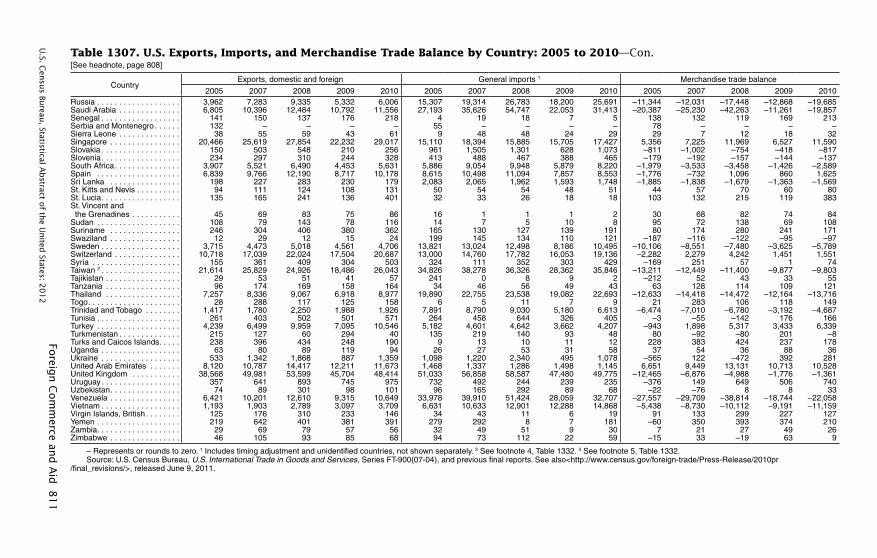
Foreig
n C
om
merce an
d A
id 8
11
U.S. C
ensu
s Bureau
, Statistical Abstract o
f the U
nited
States: 20
12
Table 1307. U.S. Exports, Imports, and Merchandise Trade Balance by Country: 2005 to 2010—Con.[See headnote, page 808]
CountryExports, domestic and foreign General imports 1 Merchandise trade balance
2005 2007 2008 2009 2010 2005 2007 2008 2009 2010 2005 2007 2008 2009 2010Russia . . . . . . . . . . . . . . . . . . . 3,962 7,283 9,335 5,332 6,006 15,307 19,314 26,783 18,200 25,691 –11,344 –12,031 –17,448 –12,868 –19,685Saudi Arabia . . . . . . . . . . . . . . 6,805 10,396 12,484 10,792 11,556 27,193 35,626 54,747 22,053 31,413 –20,387 –25,230 –42,263 –11,261 –19,857Senegal . . . . . . . . . . . . . . . . . . 141 150 137 176 218 4 19 18 7 5 138 132 119 169 213Serbia and Montenegro . . . . . . 132 – – – – 55 – – – – 78 – – – –Sierra Leone . . . . . . . . . . . . . . 38 55 59 43 61 9 48 48 24 29 29 7 12 18 32Singapore . . . . . . . . . . . . . . . . 20,466 25,619 27,854 22,232 29,017 15,110 18,394 15,885 15,705 17,427 5,356 7,225 11,969 6,527 11,590Slovakia . . . . . . . . . . . . . . . . . . 150 503 548 210 256 961 1,505 1,301 628 1,073 –811 –1,002 –754 –418 –817Slovenia . . . . . . . . . . . . . . . . . . 234 297 310 244 328 413 488 467 388 465 –179 –192 –157 –144 –137South Africa . . . . . . . . . . . . . . . 3,907 5,521 6,490 4,453 5,631 5,886 9,054 9,948 5,879 8,220 –1,979 –3,533 –3,458 –1,426 –2,589Spain . . . . . . . . . . . . . . . . . . . 6,839 9,766 12,190 8,717 10,178 8,615 10,498 11,094 7,857 8,553 –1,776 –732 1,096 860 1,625Sri Lanka . . . . . . . . . . . . . . . . 198 227 283 230 179 2,083 2,065 1,962 1,593 1,748 –1,885 –1,838 –1,679 –1,363 –1,569St. Kitts and Nevis . . . . . . . . . . 94 111 124 108 131 50 54 54 48 51 44 57 70 60 80St. Lucia . . . . . . . . . . . . . . . . . . 135 165 241 136 401 32 33 26 18 18 103 132 215 119 383St. Vincent and the Grenadines . . . . . . . . . . . 45 69 83 75 86 16 1 1 1 2 30 68 82 74 84Sudan . . . . . . . . . . . . . . . . . . . 108 79 143 78 116 14 7 5 10 8 95 72 138 69 108Suriname . . . . . . . . . . . . . . . . 246 304 406 380 362 165 130 127 139 191 80 174 280 241 171Swaziland . . . . . . . . . . . . . . . . 12 29 12 15 24 199 145 134 110 121 –187 –116 –122 –95 –97Sweden . . . . . . . . . . . . . . . . . . 3,715 4,473 5,018 4,561 4,706 13,821 13,024 12,498 8,186 10,495 –10,106 –8,551 –7,480 –3,625 –5,789Switzerland . . . . . . . . . . . . . . . 10,718 17,039 22,024 17,504 20,687 13,000 14,760 17,782 16,053 19,136 –2,282 2,279 4,242 1,451 1,551Syria . . . . . . . . . . . . . . . . . . . . 155 361 409 304 503 324 111 352 303 429 –169 251 57 1 74Taiwan 2 . . . . . . . . . . . . . . . . . . 21,614 25,829 24,926 18,486 26,043 34,826 38,278 36,326 28,362 35,846 –13,211 –12,449 –11,400 –9,877 –9,803Tajikistan . . . . . . . . . . . . . . . . . 29 53 51 41 57 241 0 8 9 2 –212 52 43 33 55Tanzania . . . . . . . . . . . . . . . . . 96 174 169 158 164 34 46 56 49 43 63 128 114 109 121Thailand . . . . . . . . . . . . . . . . . 7,257 8,336 9,067 6,918 8,977 19,890 22,755 23,538 19,082 22,693 –12,633 –14,418 –14,472 –12,164 –13,716Togo . . . . . . . . . . . . . . . . . . . . . 28 288 117 125 158 6 5 11 7 9 21 283 106 118 149Trinidad and Tobago . . . . . . . . 1,417 1,780 2,250 1,988 1,926 7,891 8,790 9,030 5,180 6,613 –6,474 –7,010 –6,780 –3,192 –4,687Tunisia . . . . . . . . . . . . . . . . . . . 261 403 502 501 571 264 458 644 326 405 –3 –55 –142 176 166Turkey . . . . . . . . . . . . . . . . . . . 4,239 6,499 9,959 7,095 10,546 5,182 4,601 4,642 3,662 4,207 –943 1,898 5,317 3,433 6,339Turkmenistan . . . . . . . . . . . . . . 215 127 60 294 40 135 219 140 93 48 80 –92 –80 201 –8Turks and Caicos Islands. . . . . 238 396 434 248 190 9 13 10 11 12 228 383 424 237 178Uganda . . . . . . . . . . . . . . . . . . 63 80 89 119 94 26 27 53 31 58 37 54 36 88 36Ukraine . . . . . . . . . . . . . . . . . . 533 1,342 1,868 887 1,359 1,098 1,220 2,340 495 1,078 –565 122 –472 392 281United Arab Emirates . . . . . . . 8,120 10,787 14,417 12,211 11,673 1,468 1,337 1,286 1,498 1,145 6,651 9,449 13,131 10,713 10,528United Kingdom . . . . . . . . . . . 38,568 49,981 53,599 45,704 48,414 51,033 56,858 58,587 47,480 49,775 –12,465 –6,876 –4,988 –1,776 –1,361Uruguay . . . . . . . . . . . . . . . . . . 357 641 893 745 975 732 492 244 239 235 –376 149 649 506 740Uzbekistan . . . . . . . . . . . . . . . . 74 89 301 98 101 96 165 292 89 68 –22 –76 8 8 33Venezuela . . . . . . . . . . . . . . . . 6,421 10,201 12,610 9,315 10,649 33,978 39,910 51,424 28,059 32,707 –27,557 –29,709 –38,814 –18,744 –22,058Vietnam . . . . . . . . . . . . . . . . . . 1,193 1,903 2,789 3,097 3,709 6,631 10,633 12,901 12,288 14,868 –5,438 –8,730 –10,112 –9,191 –11,159Virgin Islands, British . . . . . . . . 125 176 310 233 146 34 43 11 6 19 91 133 299 227 127Yemen . . . . . . . . . . . . . . . . . . . 219 642 401 381 391 279 292 8 7 181 –60 350 393 374 210Zambia . . . . . . . . . . . . . . . . . . . 29 69 79 57 56 32 49 51 9 30 7 21 27 49 26Zimbabwe . . . . . . . . . . . . . . . . 46 105 93 85 68 94 73 112 22 59 –15 33 –19 63 9
– Represents or rounds to zero. 1 Includes timing adjustment and unidentified countries, not shown separately. 2 See footnote 4, Table 1332. 3 See footnote 5, Table 1332.Source: U.S. Census Bureau, U .S . International Trade in Goods and Services, Series FT-900(07-04), and previous final reports. See also<http://www.census.gov/foreign-trade/Press-Release/2010pr
/final_revisions/>, released June 9, 2011.
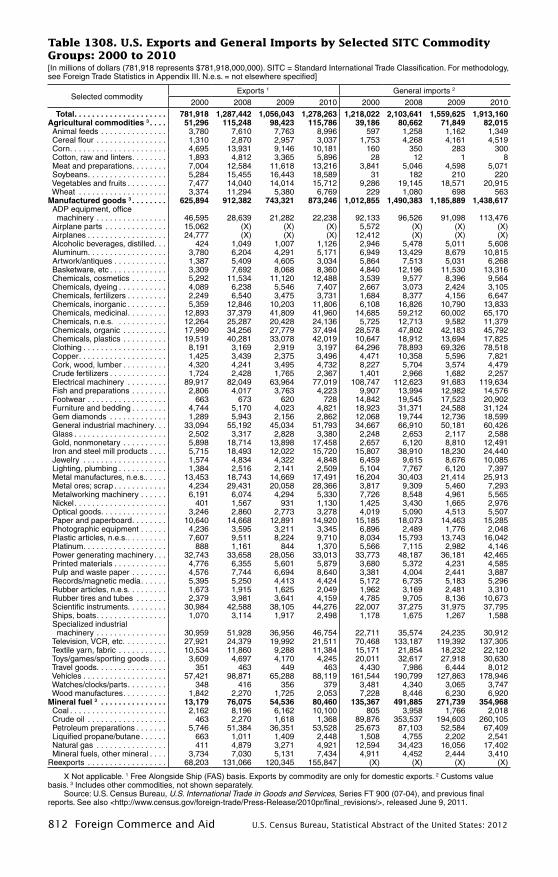
812 Foreign Commerce and Aid U.S. Census Bureau, Statistical Abstract of the United States: 2012
Table 1308. U.S. Exports and General Imports by Selected SITC Commodity Groups: 2000 to 2010[In millions of dollars (781,918 represents $781,918,000,000). SITC = Standard International Trade Classification. For methodology, see Foreign Trade Statistics in Appendix III. N.e.s. = not elsewhere specified]
Selected commodityExports 1 General imports 2
2000 2008 2009 2010 2000 2008 2009 2010
Total . . . . . . . . . . . . . . . . . . . . . 781,918 1,287,442 1,056,043 1,278,263 1,218,022 2,103,641 1,559,625 1,913,160Agricultural commodities 3 . . . . 51,296 115,248 98,423 115,786 39,186 80,662 71,849 82,015 Animal feeds . . . . . . . . . . . . . . . 3,780 7,610 7,763 8,996 597 1,258 1,162 1,349 Cereal flour . . . . . . . . . . . . . . . . 1,310 2,870 2,957 3,037 1,753 4,268 4,161 4,519 Corn . . . . . . . . . . . . . . . . . . . . . . 4,695 13,931 9,146 10,181 160 350 283 300 Cotton, raw and linters . . . . . . . . 1,893 4,812 3,365 5,896 28 12 1 8 Meat and preparations . . . . . . . . 7,004 12,584 11,618 13,216 3,841 5,046 4,598 5,071 Soybeans . . . . . . . . . . . . . . . . . . 5,284 15,455 16,443 18,589 31 182 210 220 Vegetables and fruits . . . . . . . . . 7,477 14,040 14,014 15,712 9,286 19,145 18,571 20,915 Wheat . . . . . . . . . . . . . . . . . . . . 3,374 11,294 5,380 6,769 229 1,080 698 563Manufactured goods 3 . . . . . . . . 625,894 912,382 743,321 873,246 1,012,855 1,490,383 1,185,889 1,438,617 ADP equipment, office machinery . . . . . . . . . . . . . . . . 46,595 28,639 21,282 22,238 92,133 96,526 91,098 113,476 Airplane parts . . . . . . . . . . . . . . 15,062 (X) (X) (X) 5,572 (X) (X) (X) Airplanes . . . . . . . . . . . . . . . . . . 24,777 (X) (X) (X) 12,412 (X) (X) (X) Alcoholic beverages, distilled . . . 424 1,049 1,007 1,126 2,946 5,478 5,011 5,608 Aluminum . . . . . . . . . . . . . . . . . . 3,780 6,204 4,291 5,171 6,949 13,429 8,679 10,815 Artwork/antiques . . . . . . . . . . . . 1,387 5,409 4,605 3,034 5,864 7,513 5,031 6,268 Basketware, etc . . . . . . . . . . . . . 3,309 7,692 8,068 8,360 4,840 12,196 11,530 13,316 Chemicals, cosmetics . . . . . . . . 5,292 11,534 11,120 12,488 3,539 9,577 8,396 9,564 Chemicals, dyeing . . . . . . . . . . . 4,089 6,238 5,546 7,407 2,667 3,073 2,424 3,105 Chemicals, fertilizers . . . . . . . . . 2,249 6,540 3,475 3,731 1,684 8,377 4,156 6,647 Chemicals, inorganic . . . . . . . . . 5,359 12,846 10,203 11,806 6,108 16,826 10,790 13,833 Chemicals, medicinal . . . . . . . . . 12,893 37,379 41,809 41,960 14,685 59,212 60,002 65,170 Chemicals, n.e.s. . . . . . . . . . . . 12,264 25,287 20,428 24,136 5,725 12,713 9,582 11,379 Chemicals, organic . . . . . . . . . . 17,990 34,256 27,779 37,494 28,578 47,802 42,183 45,792 Chemicals, plastics . . . . . . . . . . 19,519 40,281 33,078 42,019 10,647 18,912 13,694 17,825 Clothing . . . . . . . . . . . . . . . . . . . 8,191 3,169 2,919 3,197 64,296 78,893 69,326 78,518 Copper . . . . . . . . . . . . . . . . . . . . 1,425 3,439 2,375 3,496 4,471 10,358 5,596 7,821 Cork, wood, lumber . . . . . . . . . . 4,320 4,241 3,495 4,732 8,227 5,704 3,574 4,479 Crude fertilizers . . . . . . . . . . . . . 1,724 2,428 1,765 2,367 1,401 2,966 1,682 2,257 Electrical machinery . . . . . . . . . 89,917 82,049 63,964 77,019 108,747 112,623 91,683 119,634 Fish and preparations . . . . . . . . 2,806 4,017 3,763 4,223 9,907 13,994 12,982 14,576 Footwear . . . . . . . . . . . . . . . . . . 663 673 620 728 14,842 19,545 17,523 20,902 Furniture and bedding . . . . . . . . 4,744 5,170 4,023 4,821 18,923 31,371 24,588 31,124 Gem diamonds . . . . . . . . . . . . . 1,289 5,943 2,156 2,862 12,068 19,744 12,736 18,599 General industrial machinery . . . 33,094 55,192 45,034 51,793 34,667 66,910 50,181 60,426 Glass . . . . . . . . . . . . . . . . . . . . . 2,502 3,317 2,828 3,380 2,248 2,653 2,117 2,588 Gold, nonmonetary . . . . . . . . . . 5,898 18,714 13,898 17,458 2,657 6,120 8,810 12,491 Iron and steel mill products . . . . 5,715 18,493 12,022 15,720 15,807 38,910 18,230 24,440 Jewelry . . . . . . . . . . . . . . . . . . . 1,574 4,834 4,322 4,848 6,459 9,615 8,676 10,085 Lighting, plumbing . . . . . . . . . . . 1,384 2,516 2,141 2,509 5,104 7,767 6,120 7,397 Metal manufactures, n.e.s. . . . . . 13,453 18,743 14,669 17,491 16,204 30,403 21,414 25,913 Metal ores; scrap . . . . . . . . . . . . 4,234 29,431 20,058 28,366 3,817 9,309 5,460 7,293 Metalworking machinery . . . . . . 6,191 6,074 4,294 5,330 7,726 8,548 4,961 5,565 Nickel . . . . . . . . . . . . . . . . . . . . . 401 1,567 931 1,130 1,425 3,430 1,665 2,976 Optical goods . . . . . . . . . . . . . . . 3,246 2,860 2,773 3,278 4,019 5,090 4,513 5,507 Paper and paperboard . . . . . . . . 10,640 14,668 12,891 14,920 15,185 18,073 14,463 15,285 Photographic equipment . . . . . . 4,236 3,595 3,211 3,345 6,896 2,489 1,776 2,048 Plastic articles, n.e.s. . . . . . . . . . 7,607 9,511 8,224 9,710 8,034 15,793 13,743 16,042 Platinum . . . . . . . . . . . . . . . . . . . 888 1,161 844 1,370 5,566 7,115 2,982 4,146 Power generating machinery . . . 32,743 33,658 28,056 33,013 33,773 48,187 36,181 42,465 Printed materials . . . . . . . . . . . . 4,776 6,355 5,601 5,879 3,680 5,372 4,231 4,585 Pulp and waste paper . . . . . . . . 4,576 7,744 6,694 8,640 3,381 4,004 2,441 3,887 Records/magnetic media . . . . . . 5,395 5,250 4,413 4,424 5,172 6,735 5,183 5,296 Rubber articles, n.e.s . . . . . . . . . 1,673 1,915 1,625 2,049 1,962 3,169 2,481 3,310 Rubber tires and tubes . . . . . . . 2,379 3,981 3,641 4,159 4,785 9,705 8,136 10,673 Scientific instruments. . . . . . . . . 30,984 42,588 38,105 44,276 22,007 37,275 31,975 37,795 Ships, boats . . . . . . . . . . . . . . . . 1,070 3,114 1,917 2,498 1,178 1,675 1,267 1,588 Specialized industrial machinery . . . . . . . . . . . . . . . . 30,959 51,928 36,956 46,754 22,711 35,574 24,235 30,912 Television, VCR, etc. . . . . . . . . . 27,921 24,379 19,992 21,511 70,468 133,187 119,392 137,305 Textile yarn, fabric . . . . . . . . . . . 10,534 11,860 9,288 11,384 15,171 21,854 18,232 22,120 Toys/games/sporting goods . . . . 3,609 4,697 4,170 4,245 20,011 32,617 27,918 30,630 Travel goods . . . . . . . . . . . . . . . . 351 463 449 463 4,430 7,986 6,444 8,012 Vehicles . . . . . . . . . . . . . . . . . . . 57,421 98,871 65,288 88,119 161,544 190,799 127,863 178,946 Watches/clocks/parts . . . . . . . . . 348 416 356 379 3,481 4,340 3,065 3,747 Wood manufactures . . . . . . . . . . 1,842 2,270 1,725 2,053 7,228 8,446 6,230 6,920Mineral fuel 3 . . . . . . . . . . . . . . . 13,179 76,075 54,536 80,460 135,367 491,885 271,739 354,968 Coal . . . . . . . . . . . . . . . . . . . . . . 2,162 8,196 6,162 10,100 805 3,958 1,766 2,018 Crude oil . . . . . . . . . . . . . . . . . . 463 2,270 1,618 1,368 89,876 353,537 194,603 260,105 Petroleum preparations . . . . . . . 5,746 51,384 36,351 53,528 25,673 87,103 52,584 67,409 Liquified propane/butane . . . . . . 663 1,011 1,409 2,448 1,508 4,755 2,202 2,541 Natural gas . . . . . . . . . . . . . . . . 411 4,879 3,271 4,921 12,594 34,423 16,056 17,402 Mineral fuels, other mineral . . . . 3,734 7,030 5,131 7,434 4,911 4,452 2,444 3,410Reexports . . . . . . . . . . . . . . . . . . 68,203 131,066 120,345 155,847 (X) (X) (X) (X)
X Not applicable. 1 Free Alongside Ship (FAS) basis. Exports by commodity are only for domestic exports. 2 Customs value basis. 3 Includes other commodities, not shown separately.
Source: U.S. Census Bureau, U .S . International Trade in Goods and Services, Series FT 900 (07-04), and previous final reports. See also <http://www.census.gov/foreign-trade/Press-Release/2010pr/final_revisions/>, released June 9, 2011.
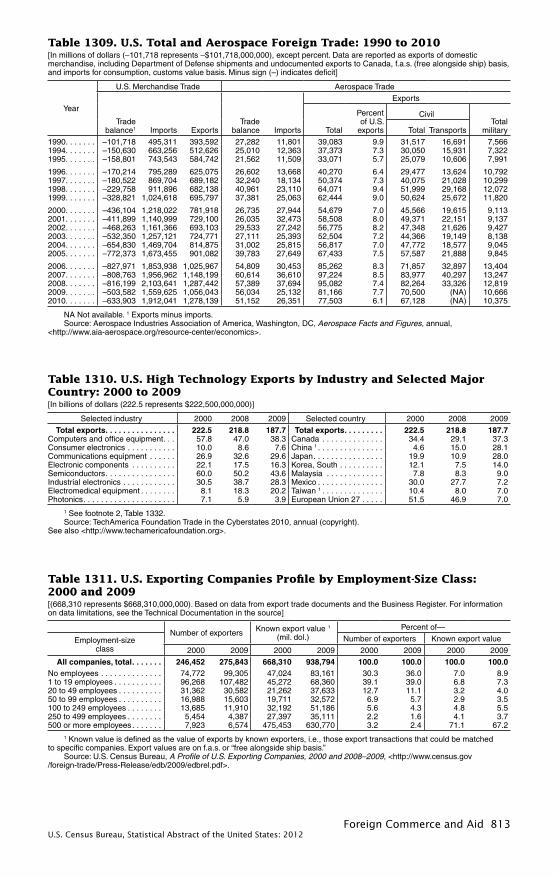
Foreign Commerce and Aid 813U.S. Census Bureau, Statistical Abstract of the United States: 2012
Table 1309. U.S. Total and Aerospace Foreign Trade: 1990 to 2010[In millions of dollars (–101,718 represents –$101,718,000,000), except percent. Data are reported as exports of domestic merchandise, including Department of Defense shipments and undocumented exports to Canada, f.a.s. (free alongside ship) basis, and imports for consumption, customs value basis. Minus sign (–) indicates deficit]
Year
U.S. Merchandise Trade Aerospace Trade
Trade balance1 Imports Exports
Trade balance Imports
Exports
Total
Percent of U.S.
exports
CivilTotal
military Total Transports
1990. . . . . . . –101,718 495,311 393,592 27,282 11,801 39,083 9.9 31,517 16,691 7,566 1994. . . . . . . –150,630 663,256 512,626 25,010 12,363 37,373 7.3 30,050 15,931 7,3221995. . . . . . . –158,801 743,543 584,742 21,562 11,509 33,071 5.7 25,079 10,606 7,991
1996. . . . . . . –170,214 795,289 625,075 26,602 13,668 40,270 6.4 29,477 13,624 10,7921997. . . . . . . –180,522 869,704 689,182 32,240 18,134 50,374 7.3 40,075 21,028 10,2991998. . . . . . . –229,758 911,896 682,138 40,961 23,110 64,071 9.4 51,999 29,168 12,0721999. . . . . . . –328,821 1,024,618 695,797 37,381 25,063 62,444 9.0 50,624 25,672 11,820
2000. . . . . . . –436,104 1,218,022 781,918 26,735 27,944 54,679 7.0 45,566 19,615 9,1132001. . . . . . . –411,899 1,140,999 729,100 26,035 32,473 58,508 8.0 49,371 22,151 9,1372002. . . . . . . –468,263 1,161,366 693,103 29,533 27,242 56,775 8.2 47,348 21,626 9,4272003. . . . . . . –532,350 1,257,121 724,771 27,111 25,393 52,504 7.2 44,366 19,149 8,1382004. . . . . . . –654,830 1,469,704 814,875 31,002 25,815 56,817 7.0 47,772 18,577 9,0452005. . . . . . . –772,373 1,673,455 901,082 39,783 27,649 67,433 7.5 57,587 21,888 9,845
2006. . . . . . . –827,971 1,853,938 1,025,967 54,809 30,453 85,262 8.3 71,857 32,897 13,4042007. . . . . . . –808,763 1,956,962 1,148,199 60,614 36,610 97,224 8.5 83,977 40,297 13,2472008. . . . . . . –816,199 2,103,641 1,287,442 57,389 37,694 95,082 7.4 82,264 33,326 12,8192009. . . . . . . –503,582 1,559,625 1,056,043 56,034 25,132 81,166 7.7 70,500 (NA) 10,6662010. . . . . . . –633,903 1,912,041 1,278,139 51,152 26,351 77,503 6.1 67,128 (NA) 10,375
NA Not available. 1 Exports minus imports.Source: Aerospace Industries Association of America, Washington, DC, Aerospace Facts and Figures, annual,
<http://www.aia-aerospace.org/resource-center/economics>.
Table 1311. U.S. Exporting Companies Profile by Employment-Size Class: 2000 and 2009[(668,310 represents $668,310,000,000). Based on data from export trade documents and the Business Register. For information on data limitations, see the Technical Documentation in the source]
Number of exporters Known export value 1
(mil. dol.)Percent of—
Employment-size class
Number of exporters Known export value
2000 2009 2000 2009 2000 2009 2000 2009
All companies, total . . . . . . . 246,452 275,843 668,310 938,794 100 .0 100 .0 100 .0 100 .0No employees . . . . . . . . . . . . . . 74,772 99,305 47,024 83,161 30.3 36.0 7.0 8.91 to 19 employees . . . . . . . . . . . 96,268 107,482 45,272 68,360 39.1 39.0 6.8 7.320 to 49 employees . . . . . . . . . . 31,362 30,582 21,262 37,633 12.7 11.1 3.2 4.050 to 99 employees . . . . . . . . . . 16,988 15,603 19,711 32,572 6.9 5.7 2.9 3.5100 to 249 employees . . . . . . . . 13,685 11,910 32,192 51,186 5.6 4.3 4.8 5.5250 to 499 employees . . . . . . . . 5,454 4,387 27,397 35,111 2.2 1.6 4.1 3.7500 or more employees . . . . . . . 7,923 6,574 475,453 630,770 3.2 2.4 71.1 67.2
1 Known value is defined as the value of exports by known exporters, i.e., those export transactions that could be matchedto specific companies. Export values are on f.a.s. or “free alongside ship basis.”
Source: U.S. Census Bureau, A Profile of U .S . Exporting Companies, 2000 and 2008–2009, <http://www.census.gov/foreign-trade/Press-Release/edb/2009/edbrel.pdf>.
Table 1310. U.S. High Technology Exports by Industry and Selected Major Country: 2000 to 2009[In billions of dollars (222.5 represents $222,500,000,000)]
Selected industry 2000 2008 2009 Selected country 2000 2008 2009
Total exports . . . . . . . . . . . . . . . . 222 .5 218 .8 187 .7 Total exports . . . . . . . . . 222 .5 218 .8 187 .7Computers and office equipment . . . 57.8 47.0 38.3 Canada . . . . . . . . . . . . . . 34.4 29.1 37.3Consumer electronics . . . . . . . . . . . 10.0 8.6 7.6 China 1 . . . . . . . . . . . . . . . 4.6 15.0 28.1Communications equipment . . . . . . 26.9 32.6 29.6 Japan . . . . . . . . . . . . . . . . 19.9 10.9 28.0Electronic components . . . . . . . . . . 22.1 17.5 16.3 Korea, South . . . . . . . . . . 12.1 7.5 14.0Semiconductors . . . . . . . . . . . . . . . . 60.0 50.2 43.6 Malaysia . . . . . . . . . . . . . 7.8 8.3 9.0Industrial electronics . . . . . . . . . . . . 30.5 38.7 28.3 Mexico . . . . . . . . . . . . . . . 30.0 27.7 7.2Electromedical equipment . . . . . . . . 8.1 18.3 20.2 Taiwan 1 . . . . . . . . . . . . . . 10.4 8.0 7.0Photonics . . . . . . . . . . . . . . . . . . . . . 7.1 5.9 3.9 European Union 27 . . . . . 51.5 46.9 7.0
1 See footnote 2, Table 1332.Source: TechAmerica Foundation Trade in the Cyberstates 2010, annual (copyright).
See also <http://www.techamericafoundation.org>.
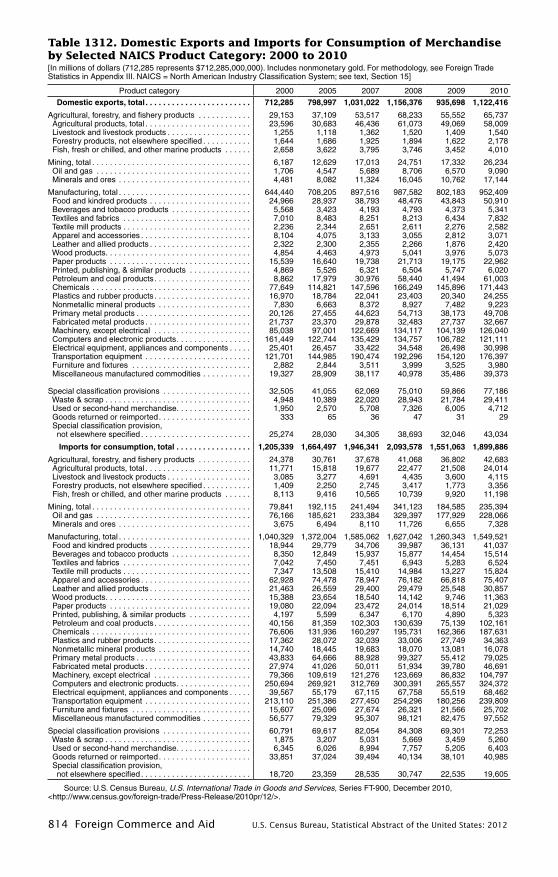
814 Foreign Commerce and Aid U.S. Census Bureau, Statistical Abstract of the United States: 2012
Table 1312. Domestic Exports and Imports for Consumption of Merchandise by Selected NAICS Product Category: 2000 to 2010[In millions of dollars (712,285 represents $712,285,000,000). Includes nonmonetary gold. For methodology, see Foreign Trade Statistics in Appendix III. NAICS = North American Industry Classification System; see text, Section 15]
Product category 2000 2005 2007 2008 2009 2010
Domestic exports, total . . . . . . . . . . . . . . . . . . . . . . . . 712,285 798,997 1,031,022 1,156,376 935,698 1,122,416
Agricultural, forestry, and fishery products . . . . . . . . . . . . 29,153 37,109 53,517 68,233 55,552 65,737 Agricultural products, total . . . . . . . . . . . . . . . . . . . . . . . . 23,596 30,683 46,436 61,073 49,069 58,009 Livestock and livestock products . . . . . . . . . . . . . . . . . . . 1,255 1,118 1,362 1,520 1,409 1,540 Forestry products, not elsewhere specified . . . . . . . . . . . 1,644 1,686 1,925 1,894 1,622 2,178 Fish, fresh or chilled, and other marine products . . . . . . 2,658 3,622 3,795 3,746 3,452 4,010
Mining, total . . . . . . . . . . . . . . . . . . . . . . . . . . . . . . . . . . . . 6,187 12,629 17,013 24,751 17,332 26,234 Oil and gas . . . . . . . . . . . . . . . . . . . . . . . . . . . . . . . . . . . 1,706 4,547 5,689 8,706 6,570 9,090 Minerals and ores . . . . . . . . . . . . . . . . . . . . . . . . . . . . . . 4,481 8,082 11,324 16,045 10,762 17,144
Manufacturing, total . . . . . . . . . . . . . . . . . . . . . . . . . . . . . . 644,440 708,205 897,516 987,582 802,183 952,409 Food and kindred products . . . . . . . . . . . . . . . . . . . . . . . 24,966 28,937 38,793 48,476 43,843 50,910 Beverages and tobacco products . . . . . . . . . . . . . . . . . . 5,568 3,423 4,193 4,793 4,373 5,341 Textiles and fabrics . . . . . . . . . . . . . . . . . . . . . . . . . . . . . 7,010 8,483 8,251 8,213 6,434 7,832 Textile mill products . . . . . . . . . . . . . . . . . . . . . . . . . . . . . 2,236 2,344 2,651 2,611 2,276 2,582 Apparel and accessories . . . . . . . . . . . . . . . . . . . . . . . . . 8,104 4,075 3,133 3,055 2,812 3,071 Leather and allied products . . . . . . . . . . . . . . . . . . . . . . . 2,322 2,300 2,355 2,266 1,876 2,420 Wood products . . . . . . . . . . . . . . . . . . . . . . . . . . . . . . . . . 4,854 4,463 4,973 5,041 3,976 5,073 Paper products . . . . . . . . . . . . . . . . . . . . . . . . . . . . . . . . 15,539 16,640 19,738 21,713 19,175 22,962 Printed, publishing, & similar products . . . . . . . . . . . . . . 4,869 5,526 6,321 6,504 5,747 6,020 Petroleum and coal products . . . . . . . . . . . . . . . . . . . . . . 8,862 17,979 30,976 58,440 41,494 61,003 Chemicals . . . . . . . . . . . . . . . . . . . . . . . . . . . . . . . . . . . . 77,649 114,821 147,596 166,249 145,896 171,443 Plastics and rubber products . . . . . . . . . . . . . . . . . . . . . . 16,970 18,784 22,041 23,403 20,340 24,255 Nonmetallic mineral products . . . . . . . . . . . . . . . . . . . . . 7,830 6,663 8,372 8,927 7,482 9,223 Primary metal products . . . . . . . . . . . . . . . . . . . . . . . . . . 20,126 27,455 44,623 54,713 38,173 49,708 Fabricated metal products . . . . . . . . . . . . . . . . . . . . . . . . 21,737 23,370 29,878 32,483 27,737 32,667 Machinery, except electrical . . . . . . . . . . . . . . . . . . . . . . 85,038 97,001 122,669 134,117 104,139 126,040 Computers and electronic products . . . . . . . . . . . . . . . . . 161,449 122,744 135,429 134,757 106,782 121,111 Electrical equipment, appliances and components . . . . . 25,401 26,457 33,422 34,548 26,498 30,998 Transportation equipment . . . . . . . . . . . . . . . . . . . . . . . . 121,701 144,985 190,474 192,296 154,120 176,397 Furniture and fixtures . . . . . . . . . . . . . . . . . . . . . . . . . . . 2,882 2,844 3,511 3,999 3,525 3,980 Miscellaneous manufactured commodities . . . . . . . . . . . 19,327 28,909 38,117 40,978 35,486 39,373
Special classification provisions . . . . . . . . . . . . . . . . . . . . 32,505 41,055 62,069 75,010 59,866 77,186 Waste & scrap . . . . . . . . . . . . . . . . . . . . . . . . . . . . . . . . . 4,948 10,389 22,020 28,943 21,784 29,411 Used or second-hand merchandise . . . . . . . . . . . . . . . . . 1,950 2,570 5,708 7,326 6,005 4,712 Goods returned or reimported . . . . . . . . . . . . . . . . . . . . . 333 65 36 47 31 29 Special classification provision, not elsewhere specified . . . . . . . . . . . . . . . . . . . . . . . . . 25,274 28,030 34,305 38,693 32,046 43,034
Imports for consumption, total . . . . . . . . . . . . . . . . . 1,205,339 1,664,497 1,946,341 2,093,578 1,551,063 1,899,886
Agricultural, forestry, and fishery products . . . . . . . . . . . . 24,378 30,761 37,678 41,068 36,802 42,683 Agricultural products, total . . . . . . . . . . . . . . . . . . . . . . . . 11,771 15,818 19,677 22,477 21,508 24,014 Livestock and livestock products . . . . . . . . . . . . . . . . . . . 3,085 3,277 4,691 4,435 3,600 4,115 Forestry products, not elsewhere specified . . . . . . . . . . . 1,409 2,250 2,745 3,417 1,773 3,356 Fish, fresh or chilled, and other marine products . . . . . . 8,113 9,416 10,565 10,739 9,920 11,198
Mining, total . . . . . . . . . . . . . . . . . . . . . . . . . . . . . . . . . . . . 79,841 192,115 241,494 341,123 184,585 235,394 Oil and gas . . . . . . . . . . . . . . . . . . . . . . . . . . . . . . . . . . . 76,166 185,621 233,384 329,397 177,929 228,066 Minerals and ores . . . . . . . . . . . . . . . . . . . . . . . . . . . . . . 3,675 6,494 8,110 11,726 6,655 7,328
Manufacturing, total . . . . . . . . . . . . . . . . . . . . . . . . . . . . . . 1,040,329 1,372,004 1,585,062 1,627,042 1,260,343 1,549,521 Food and kindred products . . . . . . . . . . . . . . . . . . . . . . . 18,944 29,779 34,706 39,987 36,131 41,037 Beverages and tobacco products . . . . . . . . . . . . . . . . . . 8,350 12,849 15,937 15,877 14,454 15,514 Textiles and fabrics . . . . . . . . . . . . . . . . . . . . . . . . . . . . . 7,042 7,450 7,451 6,943 5,283 6,524 Textile mill products . . . . . . . . . . . . . . . . . . . . . . . . . . . . . 7,347 13,508 15,410 14,984 13,227 15,824 Apparel and accessories . . . . . . . . . . . . . . . . . . . . . . . . . 62,928 74,478 78,947 76,182 66,818 75,407 Leather and allied products . . . . . . . . . . . . . . . . . . . . . . . 21,463 26,559 29,400 29,479 25,548 30,857 Wood products . . . . . . . . . . . . . . . . . . . . . . . . . . . . . . . . . 15,388 23,654 18,540 14,142 9,746 11,363 Paper products . . . . . . . . . . . . . . . . . . . . . . . . . . . . . . . . 19,080 22,094 23,472 24,014 18,514 21,029 Printed, publishing, & similar products . . . . . . . . . . . . . . 4,197 5,599 6,347 6,170 4,890 5,323 Petroleum and coal products . . . . . . . . . . . . . . . . . . . . . . 40,156 81,359 102,303 130,639 75,139 102,161 Chemicals . . . . . . . . . . . . . . . . . . . . . . . . . . . . . . . . . . . . 76,606 131,936 160,297 195,731 162,366 187,631 Plastics and rubber products . . . . . . . . . . . . . . . . . . . . . . 17,362 28,072 32,039 33,006 27,749 34,363 Nonmetallic mineral products . . . . . . . . . . . . . . . . . . . . . 14,740 18,445 19,683 18,070 13,081 16,078 Primary metal products . . . . . . . . . . . . . . . . . . . . . . . . . . 43,833 64,666 88,928 99,327 55,412 79,025 Fabricated metal products . . . . . . . . . . . . . . . . . . . . . . . . 27,974 41,026 50,011 51,934 39,780 46,691 Machinery, except electrical . . . . . . . . . . . . . . . . . . . . . . 79,366 109,619 121,276 123,669 86,832 104,797 Computers and electronic products . . . . . . . . . . . . . . . . . 250,694 269,921 312,769 300,391 265,557 324,372 Electrical equipment, appliances and components . . . . . 39,567 55,179 67,115 67,758 55,519 68,462 Transportation equipment . . . . . . . . . . . . . . . . . . . . . . . . 213,110 251,386 277,450 254,296 180,256 239,809 Furniture and fixtures . . . . . . . . . . . . . . . . . . . . . . . . . . . 15,607 25,096 27,674 26,321 21,566 25,702 Miscellaneous manufactured commodities . . . . . . . . . . . 56,577 79,329 95,307 98,121 82,475 97,552
Special classification provisions . . . . . . . . . . . . . . . . . . . . 60,791 69,617 82,054 84,308 69,301 72,253 Waste & scrap . . . . . . . . . . . . . . . . . . . . . . . . . . . . . . . . . 1,875 3,207 5,031 5,669 3,459 5,260 Used or second-hand merchandise . . . . . . . . . . . . . . . . . 6,345 6,026 8,994 7,757 5,205 6,403 Goods returned or reimported . . . . . . . . . . . . . . . . . . . . . 33,851 37,024 39,494 40,134 38,101 40,985 Special classification provision, not elsewhere specified . . . . . . . . . . . . . . . . . . . . . . . . . 18,720 23,359 28,535 30,747 22,535 19,605
Source: U.S. Census Bureau, U .S . International Trade in Goods and Services, Series FT-900, December 2010, <http://www.census.gov/foreign-trade/Press-Release/2010pr/12/>.
ContentsTable 1286. U.S. International Transactions by Type of Transaction: 1990 to 2010 792Table 1286. U.S. International Transactions by Type of Transaction: 1990 to 2010—Con. 793[In millions of dollars (706,975 represents $706,975,000,000). Minus sign (–) indicates debits] 793Table 1287. U.S. Balances on International Transactions by Area and Selected Country: 2009 and 2010 795Table 1288. Private International Service Transactions by Selected Type of Service and Selected Country: 2000 to
2010 795Table 1289. International Investment Position by Type of Investment: 2000 to 2010 796Table 1290. U.S. Reserve Assets: 1990 to 2010 796Table 1291. Foreign Direct Investment Position in the United States on a Historical-Cost Basis by Selected Country,
2000 to 2010, and by Industry, 2010 797Table 1292. U.S. Majority-Owned Affiliates of Foreign Companies—Selected Financial and Operating Data by Industry
of Affiliate: 2008 797Table 1293. Foreign Direct Investment in the United States—Property, Plant, and Equipment and Employment of
Majority-Owned U.S. Affiliates of Foreign Companies by State: 2002 to 2008 798Table 1294. U.S. Businesses Acquired or Established by Foreign Direct Investors—Investment Outlays by Industry of
U.S. Business Enterprise and Country of Ultimate Beneficial Owner: 2000 to 2008 799
Table 1295. U.S. Direct Investment Position Abroad, Capital Outflows, and Income by Industry of Foreign Affiliates: 2000 to 2010 799
Table 1296. U.S. Direct Investment Position Abroad on a Historical-Cost Basis by Selected Country: 2000 to 2010 800
Table 1297. U.S. Government Foreign Grants and Credits by Type and Country: 2000 to 2010 801Table 1297. U.S. Government Foreign Grants and Credits by Type and Country: 2000 to 2010—Con. 802Table 1298. U.S. Foreign Economic and Military Aid Programs: 1980 to 2009 802Table 1299. U.S. Foreign Economic and Military Aid by Major Recipient Country: 2001 to 2009 803Table 1300. U.S. International Trade in Goods and Services: 2000 to 2010 804Table 1301. U.S. International Trade in Goods by Related Parties:
2000 to 2010 804Table 1302. U.S. Freight Gateways—Value of Shipments: 2009 805Table 1303. U.S. Exports and Imports for Consumption of Merchandise
by Customs District: 2000 to 2010 806Table 1304. Export and Import Unit Value Indexes—Selected Countries:
2006 to 2010 806Table 1305. U.S. Exports of Goods by State of Origin: 2000 to 2010 807Table 1306. U.S. Agricultural Exports by State: 2000 to 2009 807Table 1307. U.S. Exports, Imports, and Merchandise Trade Balance by Country: 2005 to 2010 808Table 1307. U.S. Exports, Imports, and Merchandise Trade Balance by Country: 2005 to 2010—Con. 809Table 1307. U.S. Exports, Imports, and Merchandise Trade Balance by Country: 2005 to 2010—Con. 810Table 1307. U.S. Exports, Imports, and Merchandise Trade Balance by Country: 2005 to 2010—Con. 811Table 1308. U.S. Exports and General Imports by Selected SITC Commodity Groups: 2000 to 2010 812Table 1309. U.S. Total and Aerospace Foreign Trade: 1990 to 2010 813Table 1310. U.S. High Technology Exports by Industry and Selected Major Country: 2000 to 2009 813Table 1311. U.S. Exporting Companies Profile by Employment-Size Class:
2000 and 2009 813Table 1312. Domestic Exports and Imports for Consumption of Merchandise by Selected NAICS Product Category:
2000 to 2010 814