Embed Size (px)
Citation preview
312 Chapter 2 Functions and Graphs
Objectives � Find the distance
between two points. � Find the midpoint of a
line segment. � Write the standard form
of a circle’s equation. � Give the center and
radius of a circle whose equation is in standard form.
� Convert the general form of a circle’s equation to standard form.
Distance and Midpoint Formulas; Circles SECTION 2.8
translate a circle’s geometric defi nition into an algebraic equation. To do this, we must fi rst develop a formula for the distance between any two points in rectangular coordinates.
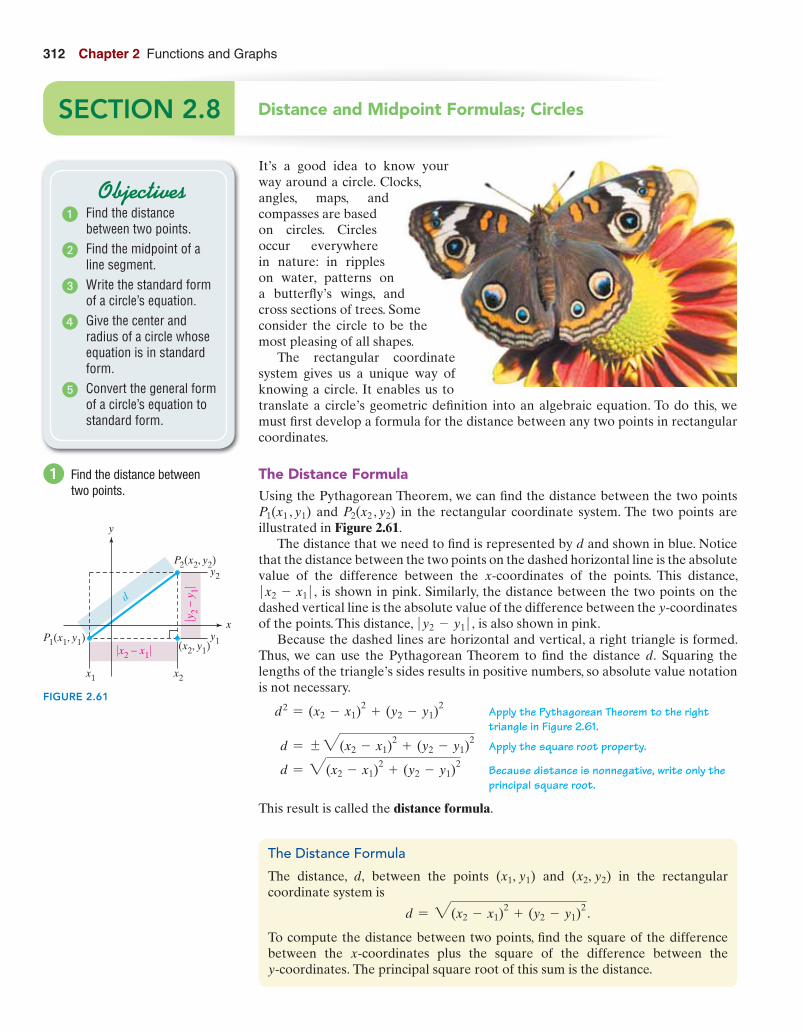
The Distance Formula Using the Pythagorean Theorem, we can fi nd the distance between the two points P1(x1 , y1) and P2(x2 , y2) in the rectangular coordinate system. The two points are illustrated in Figure 2.61 .
The distance that we need to fi nd is represented by d and shown in blue. Notice that the distance between the two points on the dashed horizontal line is the absolute value of the difference between the x@coordinates of the points. This distance, � x2 - x1 � , is shown in pink. Similarly, the distance between the two points on the dashed vertical line is the absolute value of the difference between the y@coordinatesof the points. This distance, � y2 - y1 � , is also shown in pink.
Because the dashed lines are horizontal and vertical, a right triangle is formed. Thus, we can use the Pythagorean Theorem to fi nd the distance d. Squaring the lengths of the triangle’s sides results in positive numbers, so absolute value notation is not necessary.
d2 = (x2 - x1)2 + (y2 - y1)
2 Apply the Pythagorean Theorem to the right triangle in Figure 2.61 .
d = {3(x2 - x1)2 + (y2 - y1)
2 Apply the square root property.
d = 3(x2 - x1)2 + (y2 - y1)
2 Because distance is nonnegative, write only the principal square root.
This result is called the distance formula .
I t’s a good idea to know your way around a circle. Clocks, angles, maps, and compasses are based on circles. Circles occur everywhere in nature: in ripples on water, patterns on a butterfl y’s wings, and cross sections of trees. Some consider the circle to be the most pleasing of all shapes.
The rectangular coordinate system gives us a unique way of knowing a circle. It enables us to
� Find the distance between two points.
d
x
y
�x2 − x1�
�y2 −
y1�
y1
x1 x2
(x2, y1)P1(x1, y1)
P2(x2, y2)y2
FIGURE 2.61
The Distance Formula
The distance, d, between the points (x1, y1) and (x2, y2) in the rectangular coordinate system is
d = 3(x2 - x1)2 + (y2 - y1)
2 .
To compute the distance between two points, fi nd the square of the difference between the x@coordinates plus the square of the difference between the y@coordinates. The principal square root of this sum is the distance.
M06_BLIT2281_06_SE_02-hr.indd 312 13/09/12 5:43 PM
Section 2.8 Distance and Midpoint Formulas; Circles 313
When using the distance formula, it does not matter which point you call (x1, y1) and which you call (x2, y2).
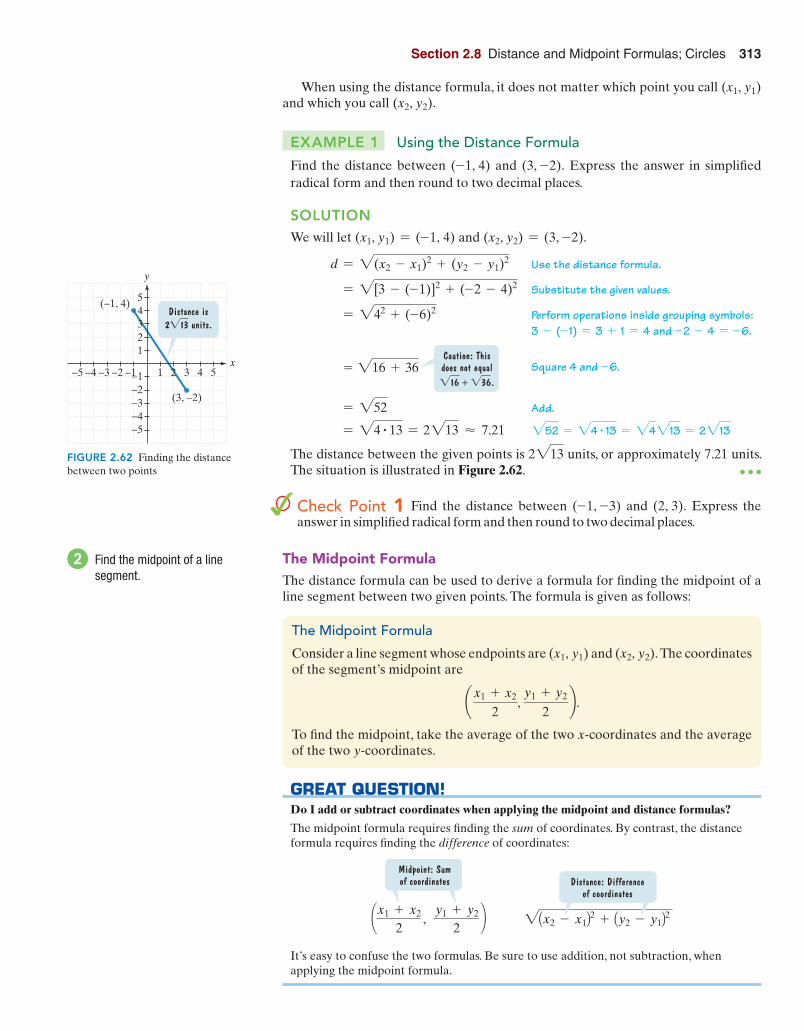
EXAMPLE 1 Using the Distance Formula
Find the distance between (-1, 4) and (3, -2). Express the answer in simplifi ed radical form and then round to two decimal places.
SOLUTION We will let (x1, y1) = (-1, 4) and (x2, y2) = (3, -2).
d = 2(x2 - x1)2 + (y2 - y1)
2 Use the distance formula.
= 2[3 - (-1)]2 + (-2 - 4)2 Substitute the given values.
= 242 + (-6)2 Perform operations inside grouping symbols: 3 - (- 1) = 3 + 1 = 4 and -2 - 4 = -6.
=216+36Caution: Thisdoes not equal�16 + �36.
Square 4 and
-6.
= 252 Add.
= 24 # 13 = 2213 � 7.21 252 = 24 # 13 = 24213 = 2213
The distance between the given points is 2213 units, or approximately 7.21 units. The situation is illustrated in Figure 2.62 . ● ● ●
Check Point 1 Find the distance between (-1, -3) and (2, 3). Express the answer in simplifi ed radical form and then round to two decimal places.
The Midpoint Formula The distance formula can be used to derive a formula for fi nding the midpoint of a line segment between two given points. The formula is given as follows:
(3, −2)
(−1, 4)
x
y
1 2 3 4 5−1
12345
−2−3−4−5
−1−2−3−4−5
Distance is2�13 units.
FIGURE 2.62 Finding the distance between two points
� Find the midpoint of a line segment.
The Midpoint Formula
Consider a line segment whose endpoints are (x1, y1) and (x2, y2). The coordinates of the segment’s midpoint are
¢ x1 + x2
2,
y1 + y2
2≤.
To fi nd the midpoint, take the average of the two x@coordinates and the average of the two y@coordinates.
GREAT QUESTION! Do I add or subtract coordinates when applying the midpoint and distance formulas?
The midpoint formula requires fi nding the sum of coordinates. By contrast, the distance formula requires fi nding the difference of coordinates:
a b
Midpoint: Sumof coordinates
x1+x2
2
y1+y2
2, 2Ax2-x1B2+Ay2-y1B2
Distance: Differenceof coordinates
It’s easy to confuse the two formulas. Be sure to use addition, not subtraction, when applying the midpoint formula.
M06_BLIT2281_06_SE_02-hr.indd 313 13/09/12 5:43 PM
314 Chapter 2 Functions and Graphs
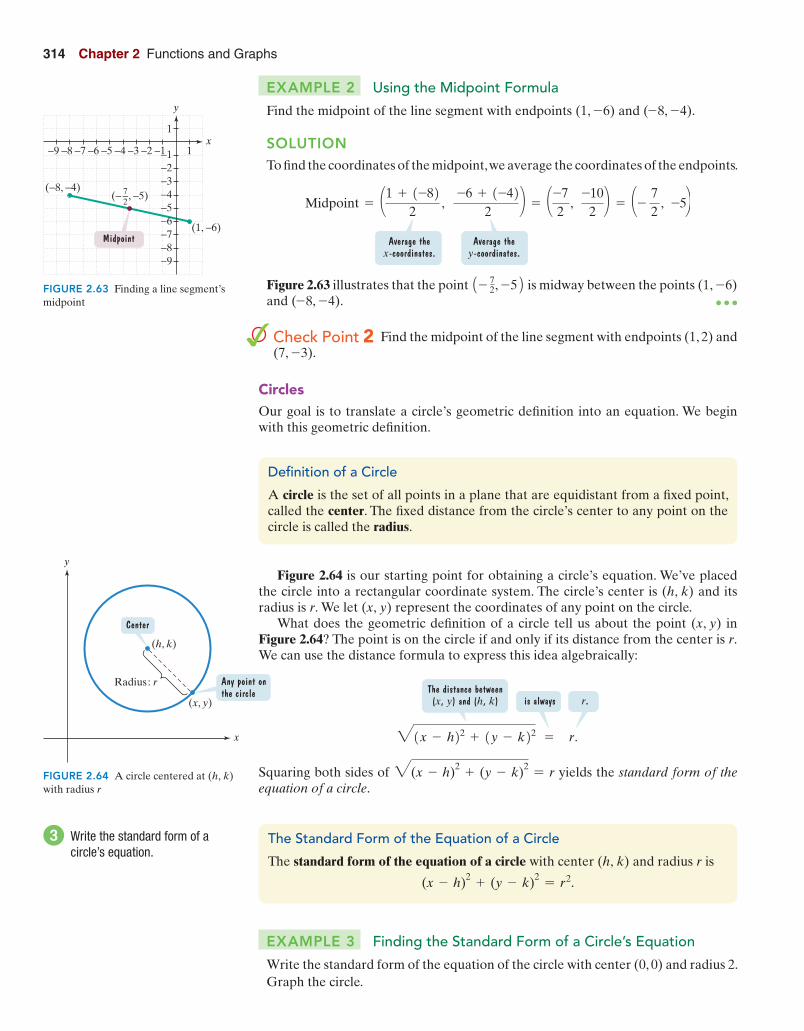
EXAMPLE 2 Using the Midpoint Formula
Find the midpoint of the line segment with endpoints (1, -6) and (-8, -4).
SOLUTION To fi nd the coordinates of the midpoint, we average the coordinates of the endpoints.
a ab b–7
2
1+(–8)
2
–6+(–4)
2Midpoint= = –5, ,
–10
2a b7
2= ,
Average thex-coordinates.
Average they-coordinates.
–
Figure 2.63 illustrates that the point 1- 72, -52 is midway between the points (1, -6) and (-8, -4). ● ● ●
Check Point 2 Find the midpoint of the line segment with endpoints (1, 2) and (7, -3).
Circles Our goal is to translate a circle’s geometric defi nition into an equation. We begin with this geometric defi nition.
x
y
1−1−2−3
1
−4−5−6−7−8−9
−1−2−3−4−5−6−7−8−9
(1, −6)
(−8, −4)
Midpoint
(−−, −5)72
FIGURE 2.63 Finding a line segment’s midpoint
y
x
Center
(h, k)
Radius: r Any point onthe circle
(x, y)
FIGURE 2.64 A circle centered at (h, k) with radius r
Defi nition of a Circle
A circle is the set of all points in a plane that are equidistant from a fi xed point, called the center . The fi xed distance from the circle’s center to any point on the circle is called the radius .
Figure 2.64 is our starting point for obtaining a circle’s equation. We’ve placed the circle into a rectangular coordinate system. The circle’s center is (h, k) and its radius is r. We let (x, y) represent the coordinates of any point on the circle.
What does the geometric defi nition of a circle tell us about the point (x, y) in Figure 2.64 ? The point is on the circle if and only if its distance from the center is r. We can use the distance formula to express this idea algebraically:
3(x-h)2+(y-k)2 = r.
The distance between(x, y) and (h, k) is always r.
Squaring both sides of 3(x - h)2 + (y - k)2 = r yields the standard form of the equation of a circle .
� Write the standard form of a circle’s equation.
The Standard Form of the Equation of a Circle
The standard form of the equation of a circle with center (h, k) and radius r is
(x - h)2 + (y - k)2 = r2.
EXAMPLE 3 Finding the Standard Form of a Circle’s Equation
Write the standard form of the equation of the circle with center (0, 0) and radius 2. Graph the circle.
M06_BLIT2281_06_SE_02-hr.indd 314 13/09/12 5:43 PM
Section 2.8 Distance and Midpoint Formulas; Circles 315
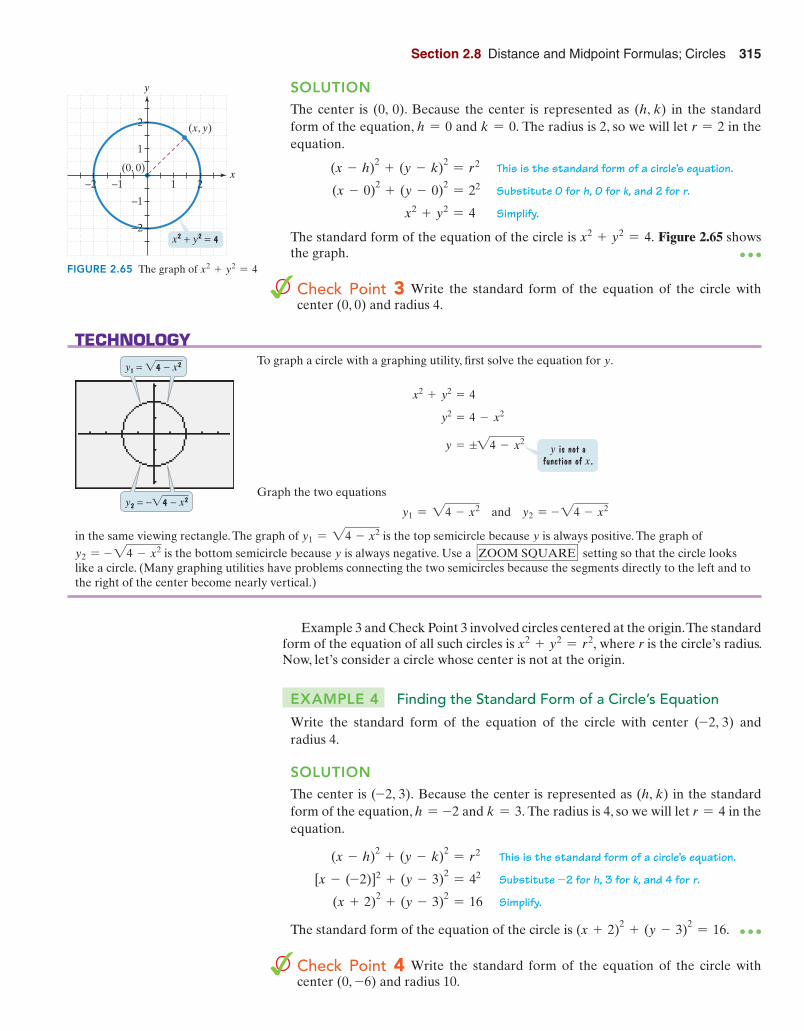
SOLUTION The center is (0, 0). Because the center is represented as (h, k) in the standard form of the equation, h = 0 and k = 0. The radius is 2, so we will let r = 2 in the equation.
(x - h)2 + (y - k)2 = r2 This is the standard form of a circle’s equation.
(x - 0)2 + (y - 0)2 = 22 Substitute 0 for h, 0 for k, and 2 for r.
x2 + y2 = 4 Simplify.
The standard form of the equation of the circle is x2 + y2 = 4. Figure 2.65 shows the graph. ● ● ●
Check Point 3 Write the standard form of the equation of the circle with center (0, 0) and radius 4.
1
2
−1
−2
1 2−1−2
y
x
x2 + y2 = 4
(x, y)
(0, 0)
FIGURE 2.65 The graph of x2 + y2 = 4
TECHNOLOGY To graph a circle with a graphing utility, fi rst solve the equation for y.
y=—24-x2
y2=4-x2
x2+y2=4
y is not afunction of x.
Graph the two equations
y1 = 24 - x2 and y2 = -24 - x2
in the same viewing rectangle. The graph of y1 = 24 - x2 is the top semicircle because y is always positive. The graph of y2 = -24 - x2 is the bottom semicircle because y is always negative. Use a � ZOOM SQUARE � setting so that the circle looks like a circle. (Many graphing utilities have problems connecting the two semicircles because the segments directly to the left and to the right of the center become nearly vertical.)
y1 = �4 − x2
y2 = −�4 − x2
Example 3 and Check Point 3 involved circles centered at the origin. The standard form of the equation of all such circles is x2 + y2 = r2, where r is the circle’s radius. Now, let’s consider a circle whose center is not at the origin.
EXAMPLE 4 Finding the Standard Form of a Circle’s Equation
Write the standard form of the equation of the circle with center (-2, 3) and radius 4.
SOLUTION The center is (-2, 3). Because the center is represented as (h, k) in the standard form of the equation, h = -2 and k = 3. The radius is 4, so we will let r = 4 in the equation.
(x - h)2 + (y - k)2 = r2 This is the standard form of a circle’s equation.
[x - (-2)]2 + (y - 3)2 = 42 Substitute -2 for h, 3 for k, and 4 for r.
(x + 2)2 + (y - 3)2 = 16 Simplify.
The standard form of the equation of the circle is (x + 2)2 + (y - 3)2 = 16. ● ● ●
Check Point 4 Write the standard form of the equation of the circle with center (0, -6) and radius 10.
M06_BLIT2281_06_SE_02-hr.indd 315 13/09/12 5:43 PM
316 Chapter 2 Functions and Graphs
EXAMPLE 5 Using the Standard Form of a Circle’s Equation to Graph the Circle
a. Find the center and radius of the circle whose equation is
(x - 2)2 + (y + 4)2 = 9.
b. Graph the equation. c. Use the graph to identify the relation’s domain and range.
SOLUTION a. We begin by fi nding the circle’s center, (h, k), and its radius, r. We can fi nd
the values for h, k, and r by comparing the given equation to the standard form of the equation of a circle, (x - h)2 + (y - k)2 = r2.
(x - 2)2 + (y + 4)2 = 9
This is (x − h)2,
with h = 2.This is (y − k)2,
with k = −4.This is r 2,with r = 3.
(x-2)2+(y-(–4))2=32
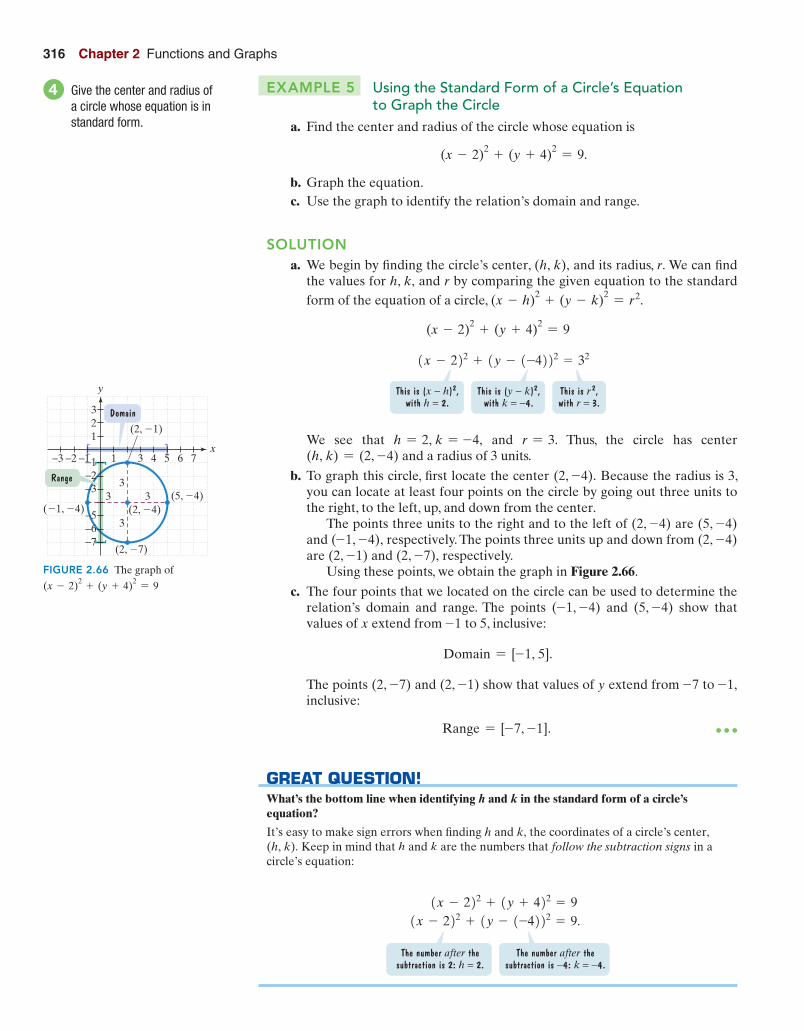
We see that h = 2, k = -4, and r = 3. Thus, the circle has center (h, k) = (2, -4) and a radius of 3 units.
b. To graph this circle, fi rst locate the center (2, -4). Because the radius is 3, you can locate at least four points on the circle by going out three units to the right, to the left, up, and down from the center.
The points three units to the right and to the left of (2, -4) are (5, -4) and (-1, -4), respectively. The points three units up and down from (2, -4) are (2, -1) and (2, -7), respectively.
Using these points, we obtain the graph in Figure 2.66 .
c. The four points that we located on the circle can be used to determine the relation’s domain and range. The points (-1, -4) and (5, -4) show that values of x extend from -1 to 5, inclusive:
Domain = [-1, 5].
The points (2, -7) and (2, -1) show that values of y extend from -7 to -1, inclusive:
Range = [-7, -1]. ● ● ●
� Give the center and radius of a circle whose equation is in standard form.
−1
123
−2−3
−7−6−5
1 3 4 765−1−2−3
y
x
(2, �4)(5, �4)
(�1, �4)
(2, �1)
(2, �7)
3
3
33
Domain
Range
FIGURE 2.66 The graph of (x - 2)2 + (y + 4)2 = 9
GREAT QUESTION! What’s the bottom line when identifying h and k in the standard form of a circle’s equation?
It’s easy to make sign errors when fi nding h and k, the coordinates of a circle’s center, (h, k). Keep in mind that h and k are the numbers that follow the subtraction signs in a circle’s equation:
(x-2)2+(y-(–4))2=9.
(x-2)2+(y+4)2=9
The number after thesubtraction is 2: h = 2.
The number after thesubtraction is −4: k = −4.
M06_BLIT2281_06_SE_02-hr.indd 316 13/09/12 5:43 PM
Section 2.8 Distance and Midpoint Formulas; Circles 317
Check Point 5 a. Find the center and radius of the circle whose equation is
(x + 3)2 + (y - 1)2 = 4.
b. Graph the equation.
c. Use the graph to identify the relation’s domain and range.
If we square x - 2 and y + 4 in the standard form of the equation in Example 5, we obtain another form for the circle’s equation.
(x - 2)2 + (y + 4)2 = 9 This is the standard form of the equation in Example 5.
x2 - 4x + 4 + y2 + 8y + 16 = 9 Square x - 2 and y + 4.
x2 + y2 - 4x + 8y + 20 = 9 Combine constants and rearrange terms.
x2 + y2 - 4x + 8y + 11 = 0 Subtract 9 from both sides.
This result suggests that an equation in the form x2 + y2 + Dx + Ey + F = 0 can represent a circle. This is called the general form of the equation of a circle .
The General Form of the Equation of a Circle
The general form of the equation of a circle is
x2 + y2 + Dx + Ey + F = 0,
where D, E, and F are real numbers.
We can convert the general form of the equation of a circle to the standard form (x - h)2 + (y - k)2 = r2. We do so by completing the square on x and y. Let’s see how this is done.
EXAMPLE 6 Converting the General Form of a Circle’s Equation to Standard Form and Graphing the Circle
Write in standard form and graph: x2 + y2 + 4x - 6y - 23 = 0.
SOLUTION Because we plan to complete the square on both x and y, let’s rearrange the terms so that x@terms are arranged in descending order, y@terms are arranged in descending order, and the constant term appears on the right.
x2 + y2 + 4x - 6y - 23 = 0 This is the given equation.
(x2 + 4x ) + (y2 - 6y ) = 23 Rewrite in anticipation of completing the square.
(x2+4x+4)+(y2-6y+9)=23+4+9
Remember that numbers added on the leftside must also be added on the right side.
GREAT QUESTION! Egad! I forgot how to complete the square. Any suggestions?
To complete the square, on x2 + bx, take half the coeffi cient of x. Then square this number. By adding the square of half the coeffi cient of x, a perfect square trinomial will result. For more detail, see Section 1.5, pages 148–149.
� Convert the general form of a circle’s equation to standard form.
Complete the square on x: 12# 4 = 2
and 22 = 4, so add 4 to both sides. Complete the square on y: 12 (-6) = -3 and (-3)2 = 9, so add 9 to both sides.
(x + 2)2 + (y - 3)2 = 36 Factor on the left and add on the right.
M06_BLIT2281_06_SE_02-hr.indd 317 13/09/12 5:43 PM
318 Chapter 2 Functions and Graphs
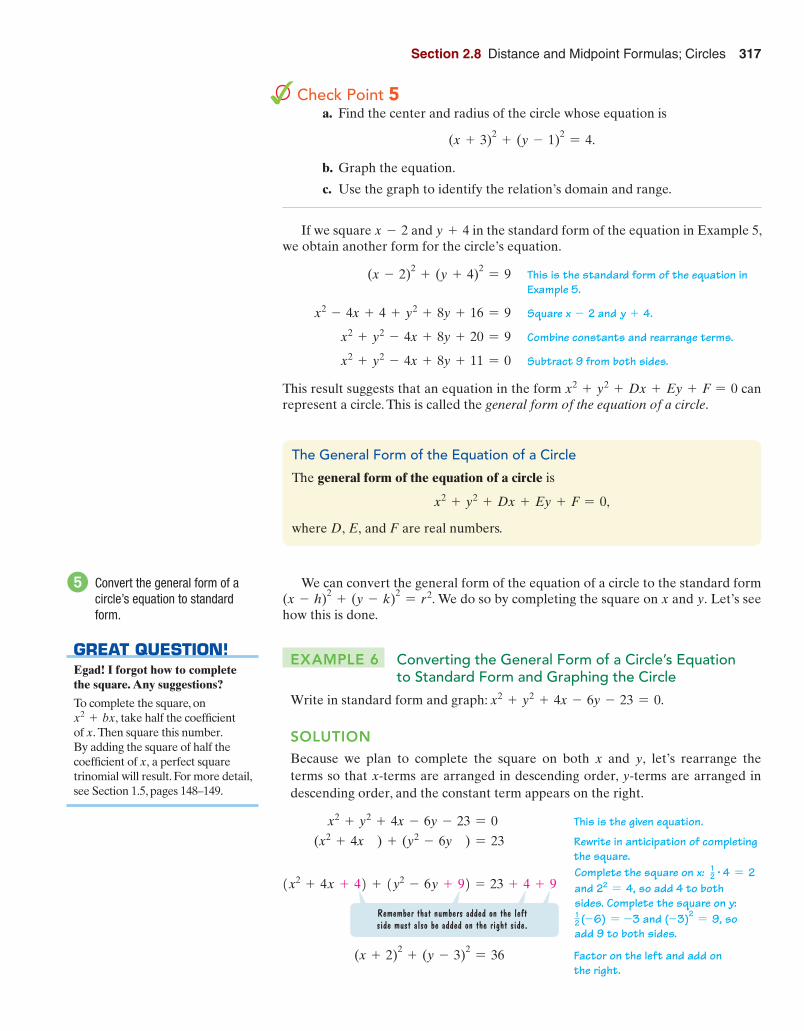
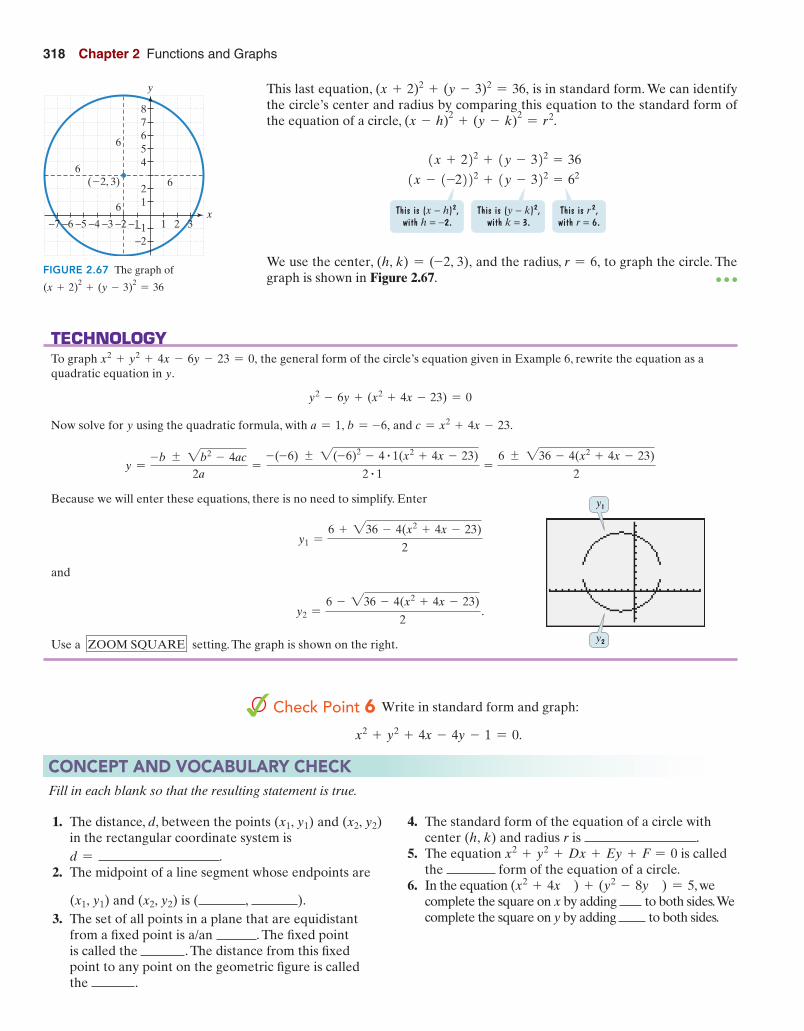
This last equation, (x + 2)2 + (y - 3)2 = 36, is in standard form. We can identify the circle’s center and radius by comparing this equation to the standard form of the equation of a circle, (x - h)2 + (y - k)2 = r2.
This is (x − h)2,
with h = −2.This is (y − k)2,
with k = 3.This is r 2,with r = 6.
(x-(–2))2+(y-3)2=62
(x+2)2+(y-3)2=36
We use the center, (h, k) = (-2, 3), and the radius, r = 6, to graph the circle. The graph is shown in Figure 2.67 . ● ● ●
−1
12
4
8765
−2
1 2 3−1−2−3−4−7 −6 −5
y
x
(�2, 3)
6
6
66
FIGURE 2.67 The graph of
(x + 2)2 + (y - 3)2 = 36
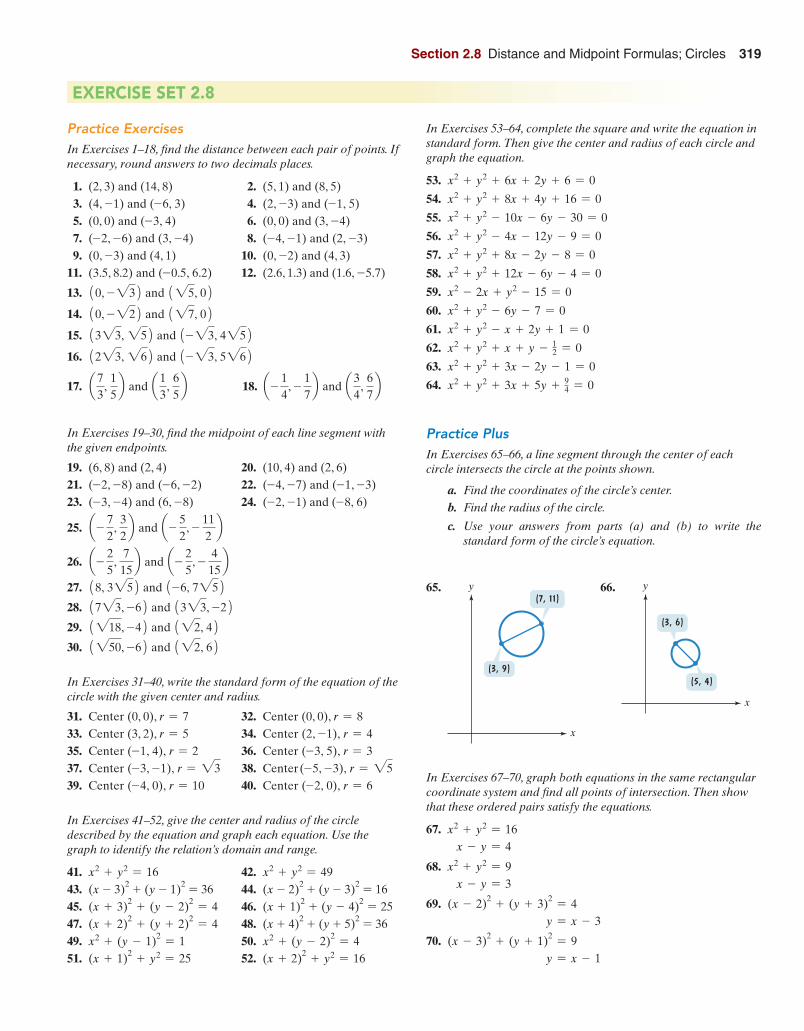
TECHNOLOGY To graph x2 + y2 + 4x - 6y - 23 = 0, the general form of the circle’s equation given in Example 6, rewrite the equation as a quadratic equation in y.
y2 - 6y + (x2 + 4x - 23) = 0
Now solve for y using the quadratic formula, with a = 1, b = -6, and c = x2 + 4x - 23.
y =-b { 2b2 - 4ac
2a=
-(-6) { 2(-6)2 - 4 # 1(x2 + 4x - 23)
2 # 1 =6 { 236 - 4(x2 + 4x - 23)
2
Because we will enter these equations, there is no need to simplify. Enter
y1 =6 + 236 - 4(x2 + 4x - 23)
2
and
y2 =6 - 236 - 4(x2 + 4x - 23)
2.
Use a � ZOOM SQUARE � setting. The graph is shown on the right.
y1
y2
Check Point 6 Write in standard form and graph:
x2 + y2 + 4x - 4y - 1 = 0.
1. The distance, d, between the points (x1, y1) and (x2, y2) in the rectangular coordinate system is d = .
2. The midpoint of a line segment whose endpoints are
(x1, y1) and (x2, y2) is ( , ). 3. The set of all points in a plane that are equidistant
from a fi xed point is a/an . The fi xed point is called the . The distance from this fi xed point to any point on the geometric fi gure is called the .
4. The standard form of the equation of a circle with center (h, k) and radius r is .
5. The equation x2 + y2 + Dx + Ey + F = 0 is called the form of the equation of a circle.
6. In the equation (x2 + 4x ) + (y2 - 8y ) = 5 , we complete the square on x by adding to both sides. We complete the square on y by adding to both sides.
Fill in each blank so that the resulting statement is true.
CONCEPT AND VOCABULARY CHECK
M06_BLIT2281_06_SE_02-hr.indd 318 13/09/12 5:43 PM
Section 2.8 Distance and Midpoint Formulas; Circles 319
Practice Exercises In Exercises 1–18, fi nd the distance between each pair of points. If necessary, round answers to two decimals places.
1. (2, 3) and (14, 8) 2. (5, 1) and (8, 5) 3. (4, -1) and (-6, 3) 4. (2, -3) and (-1, 5) 5. (0, 0) and (-3, 4) 6. (0, 0) and (3, -4) 7. (-2, -6) and (3, -4) 8. (-4, -1) and (2, -3)
9. (0, -3) and (4, 1) 10. (0, -2) and (4, 3) 11. (3.5, 8.2) and (-0.5, 6.2) 12. (2.6, 1.3) and (1.6, -5.7)
13. 10, -232 and 125, 02 14. 10, -222 and 127, 02
15. 1323, 252 and 1-23, 4252 16. 1223, 262 and 1-23, 5262 17. a7
3,
15b and a1
3,
65b 18. a-
14
, - 17b and a3
4,
67b
In Exercises 19–30, fi nd the midpoint of each line segment with the given endpoints.
19. (6, 8) and (2, 4) 20. (10, 4) and (2, 6) 21. (-2, -8) and (-6, -2) 22. (-4, -7) and (-1, -3) 23. (-3, -4) and (6, -8) 24. (-2, -1) and (-8, 6)
25. a- 72
, 32b and a-
52
, - 112b
26. a- 25
, 7
15b and a-
25
, - 4
15b
27. 18, 3252 and 1-6, 7252 28. 1723, -62 and 1323, -22 29. 1218, -42 and 122, 42
30. 1250, -62 and 122, 62
In Exercises 31–40, write the standard form of the equation of the circle with the given center and radius.
31. Center (0, 0), r = 7 32. Center (0, 0), r = 8 33. Center (3, 2), r = 5 34. Center (2, -1), r = 4 35. Center (-1, 4), r = 2 36. Center (-3, 5), r = 3 37. Center (-3, -1), r = 23 38. Center (-5, -3), r = 25 39. Center (-4, 0), r = 10 40. Center (-2, 0), r = 6
In Exercises 41–52, give the center and radius of the circle described by the equation and graph each equation. Use the graph to identify the relation’s domain and range.
41. x2 + y2 = 16 42. x2 + y2 = 49 43. (x - 3)2 + (y - 1)2 = 36 44. (x - 2)2 + (y - 3)2 = 16 45. (x + 3)2 + (y - 2)2 = 4 46. (x + 1)2 + (y - 4)2 = 25 47. (x + 2)2 + (y + 2)2 = 4 48. (x + 4)2 + (y + 5)2 = 36 49. x2 + (y - 1)2 = 1 50. x2 + (y - 2)2 = 4 51. (x + 1)2 + y2 = 25 52. (x + 2)2 + y2 = 16
EXERCISE SET 2.8
In Exercises 53–64, complete the square and write the equation in standard form. Then give the center and radius of each circle and graph the equation.
53. x2 + y2 + 6x + 2y + 6 = 0
54. x2 + y2 + 8x + 4y + 16 = 0
55. x2 + y2 - 10x - 6y - 30 = 0
56. x2 + y2 - 4x - 12y - 9 = 0
57. x2 + y2 + 8x - 2y - 8 = 0
58. x2 + y2 + 12x - 6y - 4 = 0
59. x2 - 2x + y2 - 15 = 0
60. x2 + y2 - 6y - 7 = 0
61. x2 + y2 - x + 2y + 1 = 0
62. x2 + y2 + x + y - 12 = 0
63. x2 + y2 + 3x - 2y - 1 = 0
64. x2 + y2 + 3x + 5y + 94 = 0
Practice Plus In Exercises 65–66, a line segment through the center of each circle intersects the circle at the points shown.
a. Find the coordinates of the circle’s center.
b. Find the radius of the circle.
c. Use your answers from parts (a) and (b) to write the standard form of the circle’s equation.
65.
x
y(7, 11)
(3, 9)
66.
x
y
(3, 6)
(5, 4)
In Exercises 67–70, graph both equations in the same rectangular coordinate system and fi nd all points of intersection. Then show that these ordered pairs satisfy the equations.
67. x2 + y2 = 16 x - y = 4
68. x2 + y2 = 9 x - y = 3
69. (x - 2)2 + (y + 3)2 = 4 y = x - 3
70. (x - 3)2 + (y + 1)2 = 9 y = x - 1
M06_BLIT2281_06_SE_02-hr.indd 319 13/09/12 5:43 PM
320 Chapter 2 Functions and Graphs
Application Exercises The cellphone screen shows coordinates of six cities from a rectangular coordinate system placed on North America by long-distance telephone companies. Each unit in this system represents 20.1 mile.
In Exercises 71–72, use this information to fi nd the distance, to the nearest mile, between each pair of cities.
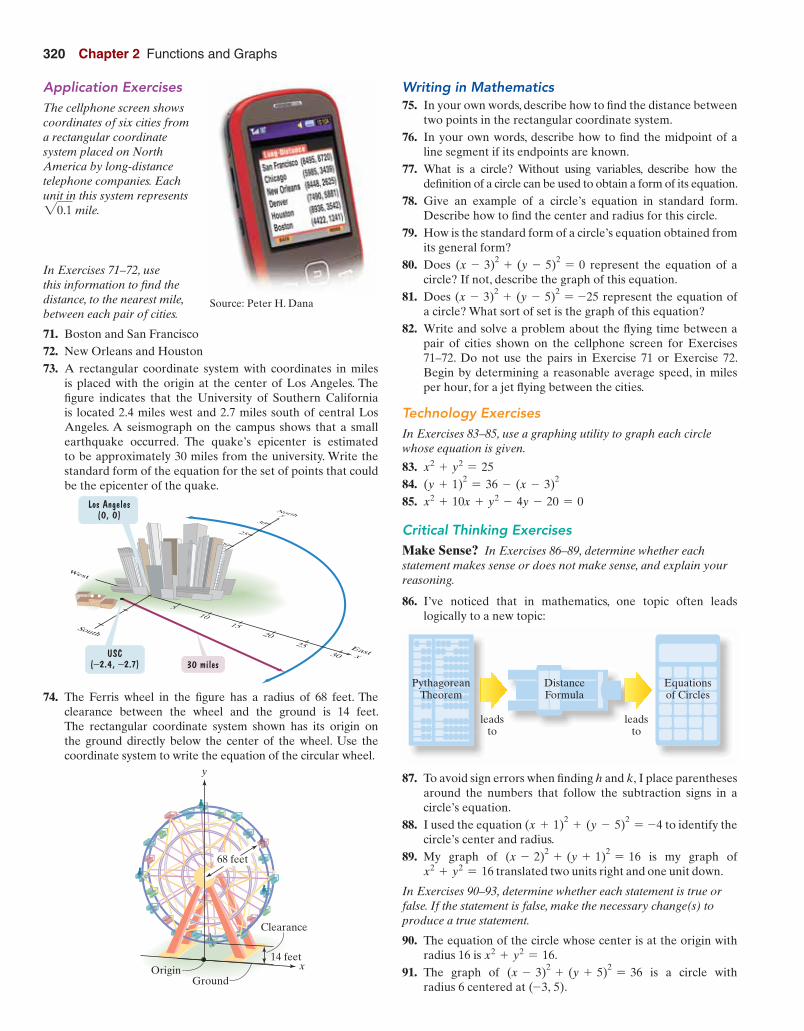
71. Boston and San Francisco 72. New Orleans and Houston 73. A rectangular coordinate system with coordinates in miles
is placed with the origin at the center of Los Angeles. The fi gure indicates that the University of Southern California is located 2.4 miles west and 2.7 miles south of central Los Angeles. A seismograph on the campus shows that a small earthquake occurred. The quake’s epicenter is estimated to be approximately 30 miles from the university. Write the standard form of the equation for the set of points that could be the epicenter of the quake.
30 miles
Los Angeles(0, 0)
USC(−2.4, −2.7)
74. The Ferris wheel in the fi gure has a radius of 68 feet. The
clearance between the wheel and the ground is 14 feet. The rectangular coordinate system shown has its origin on the ground directly below the center of the wheel. Use the coordinate system to write the equation of the circular wheel.
Origin
Clearance
14 feetx
Ground
68 feet
y
Writing in Mathematics 75. In your own words, describe how to fi nd the distance between
two points in the rectangular coordinate system. 76. In your own words, describe how to fi nd the midpoint of a
line segment if its endpoints are known. 77. What is a circle? Without using variables, describe how the
defi nition of a circle can be used to obtain a form of its equation. 78. Give an example of a circle’s equation in standard form.
Describe how to fi nd the center and radius for this circle. 79. How is the standard form of a circle’s equation obtained from
its general form? 80. Does (x - 3)2 + (y - 5)2 = 0 represent the equation of a
circle? If not, describe the graph of this equation. 81. Does (x - 3)2 + (y - 5)2 = -25 represent the equation of
a circle? What sort of set is the graph of this equation? 82. Write and solve a problem about the fl ying time between a
pair of cities shown on the cellphone screen for Exercises 71–72. Do not use the pairs in Exercise 71 or Exercise 72. Begin by determining a reasonable average speed, in miles per hour, for a jet fl ying between the cities.
Technology Exercises In Exercises 83–85, use a graphing utility to graph each circle whose equation is given.
83. x2 + y2 = 25 84. (y + 1)2 = 36 - (x - 3)2 85. x2 + 10x + y2 - 4y - 20 = 0
Critical Thinking Exercises Make Sense? In Exercises 86–89, determine whether each statement makes sense or does not make sense, and explain your reasoning.
86. I’ve noticed that in mathematics, one topic often leads logically to a new topic:
leadsto
leadsto
PythagoreanTheorem
Equationsof Circles
DistanceFormula
87. To avoid sign errors when fi nding h and k, I place parentheses
around the numbers that follow the subtraction signs in a circle’s equation.
88. I used the equation (x + 1)2 + (y - 5)2 = -4 to identify the circle’s center and radius.
89. My graph of (x - 2)2 + (y + 1)2 = 16 is my graph of x2 + y2 = 16 translated two units right and one unit down.
In Exercises 90–93, determine whether each statement is true or false. If the statement is false, make the necessary change(s) to produce a true statement.
90. The equation of the circle whose center is at the origin with radius 16 is x2 + y2 = 16.
91. The graph of (x - 3)2 + (y + 5)2 = 36 is a circle with radius 6 centered at (-3, 5).
Source: Peter H. Dana
M06_BLIT2281_06_SE_02-hr.indd 320 13/09/12 5:43 PM
Summary, Review, and Test 321
96. Find the area of the donut-shaped region bounded by the graphs of (x - 2)2 + (y + 3)2 = 25 and (x - 2)2 + (y + 3)2 = 36.
97. A tangent line to a circle is a line that intersects the circle at exactly one point. The tangent line is perpendicular to the radius of the circle at this point of contact. Write an equation in point-slope form for the line tangent to the circle whose equation is x2 + y2 = 25 at the point (3, -4).
Preview Exercises Exercises 98–100 will help you prepare for the material covered in the fi rst section of the next chapter.
In Exercises 98–99, solve each quadratic equation by the method of your choice.
98. 0 = -2(x - 3)2 + 8 99. -x2 - 2x + 1 = 0 100. Use the graph of f(x) = x2 to graph g(x) = (x + 3)2 + 1.
92. The graph of (x - 4) + (y + 6) = 25 is a circle with radius 5 centered at (4, -6).
93. The graph of (x - 3)2 + (y + 5)2 = -36 is a circle with radius 6 centered at (3, -5).
94. Show that the points A(1, 1 + d), B(3, 3 + d), and C(6, 6 + d) are collinear (lie along a straight line) by showing that the distance from A to B plus the distance from B to Cequals the distance from A to C.
95. Prove the midpoint formula by using the following procedure. a. Show that the distance between (x1, y1) and ¢x1 + x2
2,
y1 + y2
2≤ is equal to the distance between
(x2, y2) and ¢x1 + x2
2,
y1 + y2
2≤.
b. Use the procedure from Exercise 94 and the distances from part (a) to show that the points (x1, y1) , ¢x1 + x2
2,
y1 + y2
2≤, and (x2, y2) are collinear.
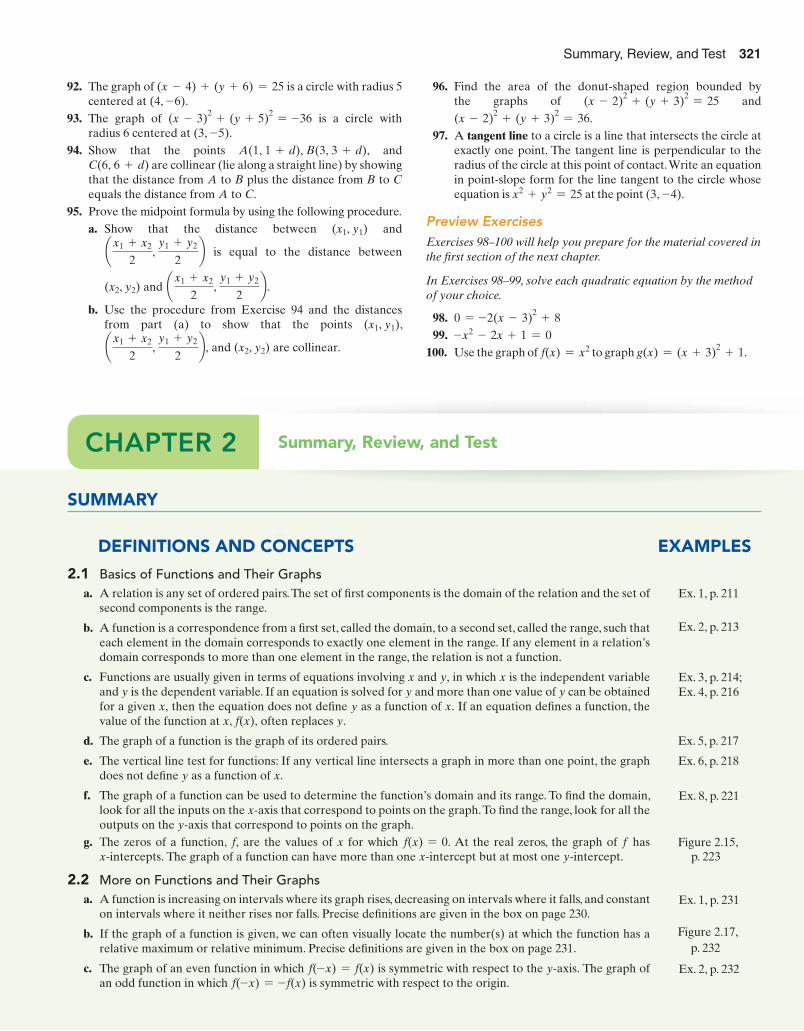
Summary, Review, and Test CHAPTER 2
SUMMARY
DEFINITIONS AND CONCEPTS EXAMPLES
2.1 Basics of Functions and Their Graphs a. A relation is any set of ordered pairs. The set of fi rst components is the domain of the relation and the set of
second components is the range.
b. A function is a correspondence from a fi rst set, called the domain, to a second set, called the range, such that each element in the domain corresponds to exactly one element in the range. If any element in a relation’s domain corresponds to more than one element in the range, the relation is not a function.
c. Functions are usually given in terms of equations involving x and y, in which x is the independent variable and y is the dependent variable. If an equation is solved for y and more than one value of y can be obtained for a given x, then the equation does not defi ne y as a function of x. If an equation defi nes a function, the value of the function at x, f(x), often replaces y.
d. The graph of a function is the graph of its ordered pairs. Ex. 5, p. 217
e. The vertical line test for functions: If any vertical line intersects a graph in more than one point, the graph does not defi ne y as a function of x.
f. The graph of a function can be used to determine the function’s domain and its range. To fi nd the domain, look for all the inputs on the x@axis that correspond to points on the graph. To fi nd the range, look for all the outputs on the y@axis that correspond to points on the graph.
g. The zeros of a function, f, are the values of x for which f(x) = 0. At the real zeros, the graph of f has x@intercepts. The graph of a function can have more than one x@intercept but at most one y@intercept.
2.2 More on Functions and Their Graphs a. A function is increasing on intervals where its graph rises, decreasing on intervals where it falls, and constant
on intervals where it neither rises nor falls. Precise defi nitions are given in the box on page 230.
b. If the graph of a function is given, we can often visually locate the number(s) at which the function has a relative maximum or relative minimum. Precise defi nitions are given in the box on page 231.
c. The graph of an even function in which f(-x) = f(x) is symmetric with respect to the y@axis. The graph of an odd function in which f(-x) = - f(x) is symmetric with respect to the origin.
Ex. 1, p. 211
Ex. 2, p. 213
Ex. 3, p. 214; Ex. 4, p. 216
Ex. 6, p. 218
Ex. 8, p. 221
Figure 2.15, p. 223
Ex. 1, p. 231
Figure 2.17, p. 232
Ex. 2, p. 232
M06_BLIT2281_06_SE_02-hr.indd 321 13/09/12 5:43 PM
322 Chapter 2 Functions and Graphs322 Chapter 2 Functions and Graphs
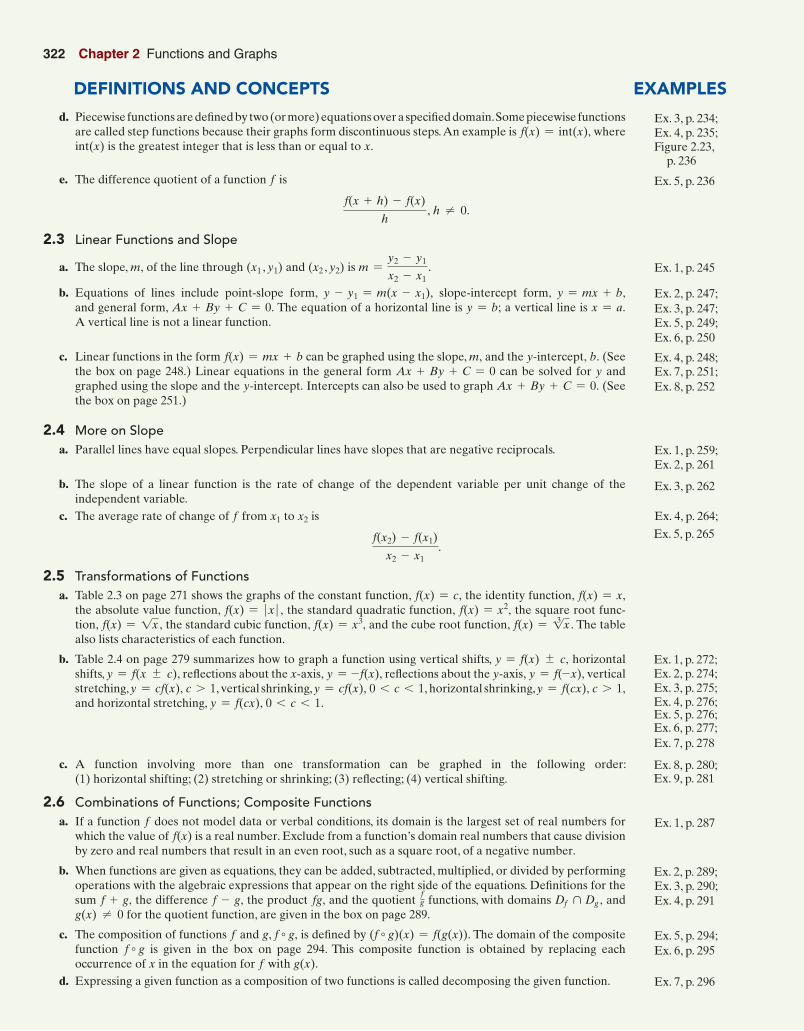
2.4 More on Slope a. Parallel lines have equal slopes. Perpendicular lines have slopes that are negative reciprocals.
b. The slope of a linear function is the rate of change of the dependent variable per unit change of the independent variable.
c. The average rate of change of f from x1 to x2 is
f(x2) - f(x1)
x2 - x1.
2.5 Transformations of Functions a. Table 2.3 on page 271 shows the graphs of the constant function, f(x) = c, the identity function, f(x) = x,
the absolute value function, f(x) = � x � , the standard quadratic function, f(x) = x2, the square root func-tion, f(x) = 1x , the standard cubic function, f(x) = x3, and the cube root function, f(x) = 13 x . The table also lists characteristics of each function.
b. Table 2.4 on page 279 summarizes how to graph a function using vertical shifts, y = f(x) { c, horizontal shifts, y = f(x { c), refl ections about the x@axis, y = - f(x), refl ections about the y@axis, y = f(-x), vertical stretching, y = cf(x), c 7 1, vertical shrinking, y = cf(x), 0 6 c 6 1, horizontal shrinking, y = f(cx), c 7 1, and horizontal stretching, y = f(cx), 0 6 c 6 1.
c. A function involving more than one transformation can be graphed in the following order: (1) horizontal shifting; (2) stretching or shrinking; (3) refl ecting; (4) vertical shifting.
2.6 Combinations of Functions; Composite Functions a. If a function f does not model data or verbal conditions, its domain is the largest set of real numbers for
which the value of f(x) is a real number. Exclude from a function’s domain real numbers that cause division by zero and real numbers that result in an even root, such as a square root, of a negative number.
b. When functions are given as equations, they can be added, subtracted, multiplied, or divided by performing operations with the algebraic expressions that appear on the right side of the equations. Defi nitions for the sum f + g, the difference f - g, the product fg, and the quotient
fg functions, with domains Df � Dg , and
g(x) � 0 for the quotient function, are given in the box on page 289.
c. The composition of functions f and g, f � g, is defi ned by (f � g)(x) = f(g(x)). The domain of the composite function f � g is given in the box on page 294. This composite function is obtained by replacing each occurrence of x in the equation for f with g(x).
d. Expressing a given function as a composition of two functions is called decomposing the given function.
Ex. 2, p. 247;
Ex. 1, p. 245
Ex. 3, p. 247; Ex. 5, p. 249; Ex. 6, p. 250
Ex. 4, p. 248; Ex. 7, p. 251; Ex. 8, p. 252
Ex. 1, p. 259; Ex. 2, p. 261
Ex. 3, p. 262
Ex. 4, p. 264;
Ex. 5, p. 265
Ex. 1, p. 272; Ex. 2, p. 274; Ex. 3, p. 275; Ex. 4, p. 276; Ex. 5, p. 276; Ex. 6, p. 277; Ex. 7, p. 278
Ex. 8, p. 280; Ex. 9, p. 281
Ex. 1, p. 287
Ex. 2, p. 289; Ex. 3, p. 290; Ex. 4, p. 291
Ex. 5, p. 294; Ex. 6, p. 295
Ex. 7, p. 296
DEFINITIONS AND CONCEPTS EXAMPLES
Ex. 3, p. 234; Ex. 4, p. 235; Figure 2.23,
p. 236
Ex. 5, p. 236
d. Piecewise functions are defi ned by two (or more) equations over a specifi ed domain. Some piecewise functions are called step functions because their graphs form discontinuous steps. An example is f(x) = int(x), where int(x) is the greatest integer that is less than or equal to x.
e. The difference quotient of a function f is
f(x + h) - f(x)
h, h � 0.
2.3 Linear Functions and Slope
a. The slope, m, of the line through (x1 , y1) and (x2 , y2) is m =y2 - y1
x2 - x1.
b. Equations of lines include point-slope form, y - y1 = m(x - x1), slope-intercept form, y = mx + b, and general form, Ax + By + C = 0. The equation of a horizontal line is y = b; a vertical line is x = a. A vertical line is not a linear function.
c. Linear functions in the form f(x) = mx + b can be graphed using the slope, m, and the y@intercept, b. (See the box on page 248.) Linear equations in the general form Ax + By + C = 0 can be solved for y and graphed using the slope and the y@intercept. Intercepts can also be used to graph Ax + By + C = 0. (See the box on page 251.)
M06_BLIT2281_06_SE_02-hr.indd 322 13/09/12 5:43 PM
Section 2.8 Summary, Review, and Test 323 Summary, Review, and Test 323
Ex. 1, p. 302
Ex. 2, p. 304; Ex. 3, p. 304; Ex. 4, p. 305 Ex. 5, p. 306
Ex. 6, p. 307; Ex. 7, p. 308
Ex. 1, p. 313
Ex. 2, p. 314
Ex. 3, p. 314; Ex. 4, p. 315; Ex. 5, p. 316
Ex. 6, p. 317
DEFINITIONS AND CONCEPTS EXAMPLES
2.7 Inverse Functions a. If f(g(x)) = x and g(f(x)) = x, function g is the inverse of function f, denoted f -1 and read ;f9inverse.<
Thus, to show that f and g are inverses of each other, one must show that f(g(x)) = x and g(f(x)) = x.
b. The procedure for fi nding a function’s inverse uses a switch-and-solve strategy. Switch x and y, and then solve for y. The procedure is given in the box on page 303.
c. The horizontal line test for inverse functions: A function f has an inverse that is a function, f -1, if there is no horizontal line that intersects the graph of the function f at more than one point.
d. A one-to-one function is one in which no two different ordered pairs have the same second component. Only one-to-one functions have inverse functions.
e. If the point (a, b) is on the graph of f, then the point (b, a) is on the graph of f -1. The graph of f -1 is a refl ection of the graph of f about the line y = x.
2.8 Distance and Midpoint Formulas; Circles a. The distance, d, between the points (x1 , y1) and (x2 , y2) is given by d = 3(x2 - x1)
2 + (y2 - y1)2 .
b. The midpoint of the line segment whose endpoints are (x1 , y1) and (x2 , y2) is the point with coordinates
¢x1 + x2
2,y1 + y2
2≤.
c. The standard form of the equation of a circle with center (h, k) and radius r is (x - h)2 + (y - k)2 = r2.
d. The general form of the equation of a circle is x2 + y2 + Dx + Ey + F = 0. e. To convert from the general form to the standard form of a circle’s equation, complete the square on x and y.
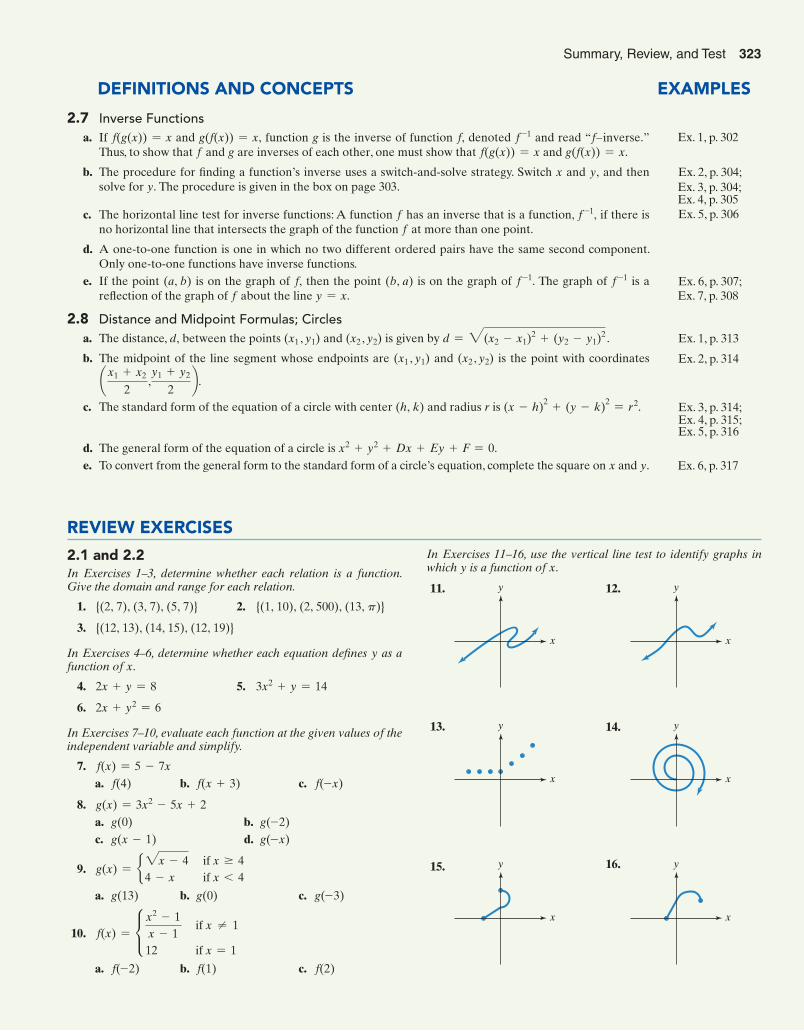
2.1 and 2.2 In Exercises 1–3, determine whether each relation is a function. Give the domain and range for each relation.
1. {(2, 7), (3, 7), (5, 7)} 2. {(1, 10), (2, 500), (13, p)}
3. {(12, 13), (14, 15), (12, 19)}
In Exercises 4–6, determine whether each equation defi nes y as a function of x.
4. 2x + y = 8 5. 3x2 + y = 14
6. 2x + y2 = 6
In Exercises 7–10, evaluate each function at the given values of the independent variable and simplify.
7. f(x) = 5 - 7x a. f(4) b. f(x + 3) c. f(-x)
8. g(x) = 3x2 - 5x + 2 a. g(0) b. g(-2) c. g(x - 1) d. g(-x)
9. g(x) = b2x - 4 if x Ú 44 - x if x 6 4
a. g(13) b. g(0) c. g(-3)
10.
f(x) = c x2 - 1
x - 1if x � 1
12 if x = 1
a. f(-2) b. f(1) c. f(2)
REVIEW EXERCISES
11.
x
y 12.
x
y
13.
x
y 14.
x
y
15.
x
y 16.
x
y
In Exercises 11–16, use the vertical line test to identify graphs in which y is a function of x.
M06_BLIT2281_06_SE_02-hr.indd 323 13/09/12 5:43 PM
324 Chapter 2 Functions and Graphs324 Chapter 2 Functions and Graphs
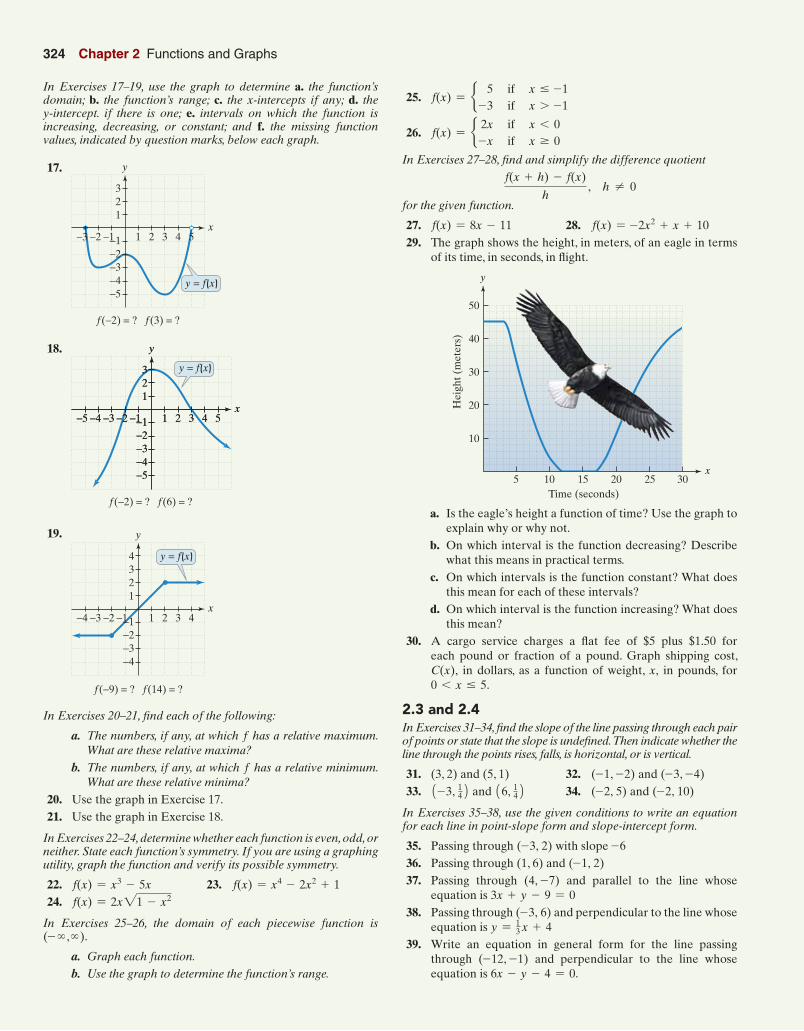
25. f(x) = b 5 if x … -1-3 if x 7 -1
26. f(x) = b 2x if x 6 0-x if x Ú 0
In Exercises 27–28, fi nd and simplify the difference quotient
f(x + h) - f(x)
h, h � 0
for the given function.
27. f(x) = 8x - 11 28. f(x) = -2x2 + x + 10 29. The graph shows the height, in meters, of an eagle in terms
of its time, in seconds, in fl ight.
Time (seconds)5 10 15 20 3025
y
x
Hei
ght (
met
ers)
10
20
30
50
40
a. Is the eagle’s height a function of time? Use the graph to explain why or why not.
b. On which interval is the function decreasing? Describe what this means in practical terms.
c. On which intervals is the function constant? What does this mean for each of these intervals?
d. On which interval is the function increasing? What does this mean?
30. A cargo service charges a fl at fee of $5 plus $1.50 for each pound or fraction of a pound. Graph shipping cost, C(x), in dollars, as a function of weight, x, in pounds, for 0 6 x … 5.
2.3 and 2.4 In Exercises 31–34, fi nd the slope of the line passing through each pair of points or state that the slope is undefi ned. Then indicate whether the line through the points rises, falls, is horizontal, or is vertical.
31. (3, 2) and (5, 1) 32. (-1, -2) and (-3, -4) 33. 1-3, 142 and 16, 142 34. (-2, 5) and (-2, 10)
In Exercises 35–38, use the given conditions to write an equation for each line in point-slope form and slope-intercept form.
35. Passing through (-3, 2) with slope -6 36. Passing through (1, 6) and (-1, 2) 37. Passing through (4, -7) and parallel to the line whose
equation is 3x + y - 9 = 0 38. Passing through (-3, 6) and perpendicular to the line whose
equation is y = 13 x + 4
39. Write an equation in general form for the line passing through (-12, -1) and perpendicular to the line whose equation is 6x - y - 4 = 0.
In Exercises 17–19, use the graph to determine a. the function’s domain; b. the function’s range; c. the x-intercepts if any; d. the y-intercept. if there is one; e. intervals on which the function is increasing, decreasing, or constant; and f. the missing function values, indicated by question marks, below each graph.
17.
−1
123
−2−3−4−5
1 2 3 4 5−1−2−3
y
x
y = f(x)
f(−2) = ? f(3) = ?
18.
−1
123
−2−3−4−5
1 2 3 4 5−1−2−3−4−5
y
x−1
123
−2−3−4−5
1 2 3 4 5−1−2−3−4−5
y
x
y = f(x)
f(−2) = ? f(6) = ?
19.
−1
1234
−2−3−4
1 2 3 4−1−2−3−4
y
x
y = f(x)
f(−9) = ? f(14) = ?
In Exercises 20–21, fi nd each of the following:
a. The numbers, if any, at which f has a relative maximum. What are these relative maxima?
b. The numbers, if any, at which f has a relative minimum. What are these relative minima?
20. Use the graph in Exercise 17. 21. Use the graph in Exercise 18.
In Exercises 22–24, determine whether each function is even, odd, or neither. State each function’s symmetry. If you are using a graphing utility, graph the function and verify its possible symmetry.
22. f(x) = x3 - 5x 23. f(x) = x4 - 2x2 + 1 24. f(x) = 2x21 - x2
In Exercises 25–26, the domain of each piecewise function is (- � ,�).
a. Graph each function.
b. Use the graph to determine the function’s range.
M06_BLIT2281_06_SE_02-hr.indd 324 13/09/12 5:43 PM
Section 2.8 Summary, Review, and Test 325 Summary, Review, and Test 325
In Exercises 40–43, give the slope and y@intercept of each line whose equation is given. Then graph the line.
40. y = 25 x - 1 41. f(x) = -4x + 5
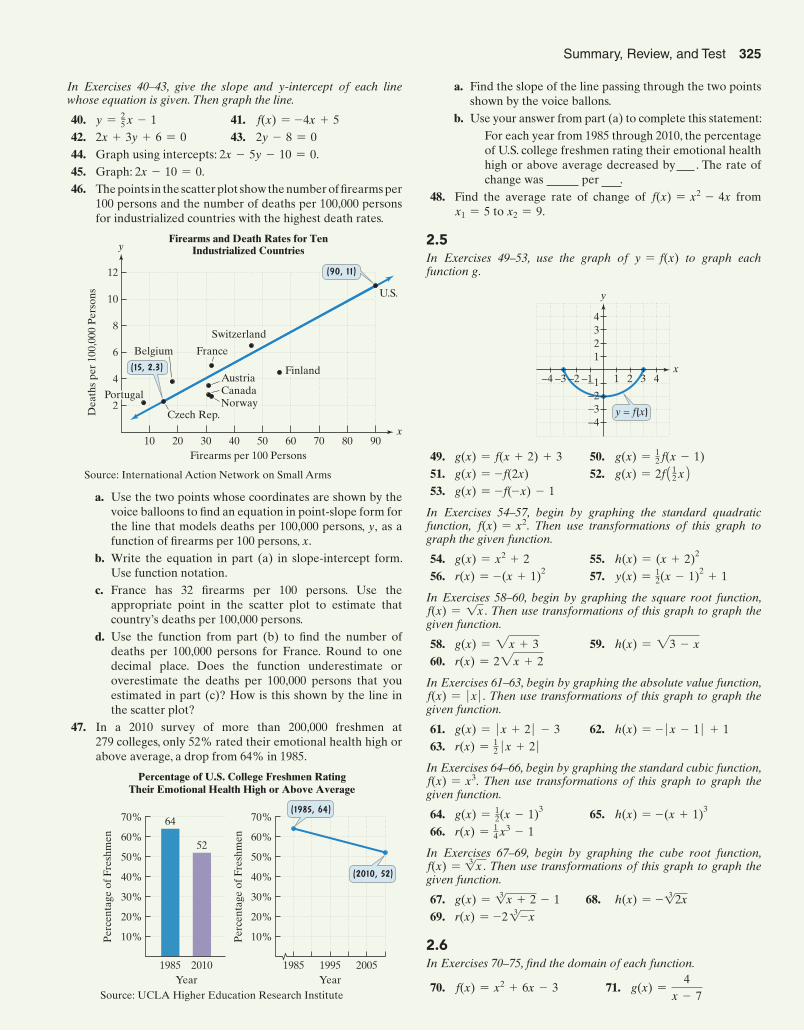
42. 2x + 3y + 6 = 0 43. 2y - 8 = 0 44. Graph using intercepts: 2x - 5y - 10 = 0. 45. Graph: 2x - 10 = 0. 46. The points in the scatter plot show the number of fi rearms per
100 persons and the number of deaths per 100,000 personsfor industrialized countries with the highest death rates.
Firearms and Death Rates for TenIndustrialized Countries
Firearms per 100 Persons9020 40 806010 30 7050
2
4
6
8
10
12
Dea
ths
per
100,
000
Per
sons
(15, 2.3)
(90, 11)
U.S.
Finland
Switzerland
France
Austria
Belgium
Czech Rep.
Portugal CanadaNorway
y
x
Source: International Action Network on Small Arms
a. Use the two points whose coordinates are shown by the voice balloons to fi nd an equation in point-slope form for the line that models deaths per 100,000 persons, y, as a function of fi rearms per 100 persons, x.
b. Write the equation in part (a) in slope-intercept form. Use function notation.
c. France has 32 fi rearms per 100 persons. Use the appropriate point in the scatter plot to estimate that country’s deaths per 100,000 persons.
d. Use the function from part (b) to fi nd the number of deaths per 100,000 persons for France. Round to one decimal place. Does the function underestimate or overestimate the deaths per 100,000 persons that you estimated in part (c)? How is this shown by the line in the scatter plot?
47. In a 2010 survey of more than 200,000 freshmen at 279 colleges, only 52% rated their emotional health high or above average, a drop from 64% in 1985.
70%
60%
50%
40%
30%
20%
Percentage of U.S. College Freshmen RatingTheir Emotional Health High or Above Average
Year2010
52
1985
64
10%
70%
60%
50%
40%
30%
20%
10%Per
cent
age
of F
resh
men
Per
cent
age
of F
resh
men
Year200519951985
(1985, 64)
(2010, 52)
Source: UCLA Higher Education Research Institute
a. Find the slope of the line passing through the two points shown by the voice ballons.
b. Use your answer from part (a) to complete this statement: For each year from 1985 through 2010, the percentage
of U.S. college freshmen rating their emotional health high or above average decreased by . The rate of change was per .
48. Find the average rate of change of f(x) = x2 - 4x from x1 = 5 to x2 = 9.
2.5 In Exercises 49–53, use the graph of y = f(x) to graph each function g.
−1
1234
−2−3−4
1 2 3 4−1−2−3−4
y
x
y = f(x)
49. g(x) = f(x + 2) + 3 50. g(x) = 12 f(x - 1)
51. g(x) = - f(2x) 52. g(x) = 2f112 x2
53. g(x) = - f(-x) - 1
In Exercises 54–57, begin by graphing the standard quadratic function, f(x) = x2. Then use transformations of this graph to graph the given function.
54. g(x) = x2 + 2 55. h(x) = (x + 2)2 56. r(x) = -(x + 1)2 57. y(x) = 1
2(x - 1)2 + 1
In Exercises 58–60, begin by graphing the square root function, f(x) = 1x . Then use transformations of this graph to graph the given function.
58. g(x) = 2x + 3 59. h(x) = 23 - x 60. r(x) = 22x + 2
In Exercises 61–63, begin by graphing the absolute value function, f(x) = � x � . Then use transformations of this graph to graph the given function.
61. g(x) = � x + 2 � - 3 62. h(x) = - � x - 1 � + 1 63. r(x) = 1
2 � x + 2 �
In Exercises 64–66, begin by graphing the standard cubic function, f(x) = x3. Then use transformations of this graph to graph the given function.
64. g(x) = 12(x - 1)3 65. h(x) = -(x + 1)3
66. r(x) = 14 x3 - 1
In Exercises 67–69, begin by graphing the cube root function, f(x) = 31x . Then use transformations of this graph to graph the given function.
67. g(x) = 31x + 2 - 1 68. h(x) = - 312x 69. r(x) = -2 31-x
2.6 In Exercises 70–75, fi nd the domain of each function.
70. f(x) = x2 + 6x - 3 71. g(x) =4
x - 7
M06_BLIT2281_06_SE_02-hr.indd 325 13/09/12 5:43 PM
326 Chapter 2 Functions and Graphs326 Chapter 2 Functions and Graphs
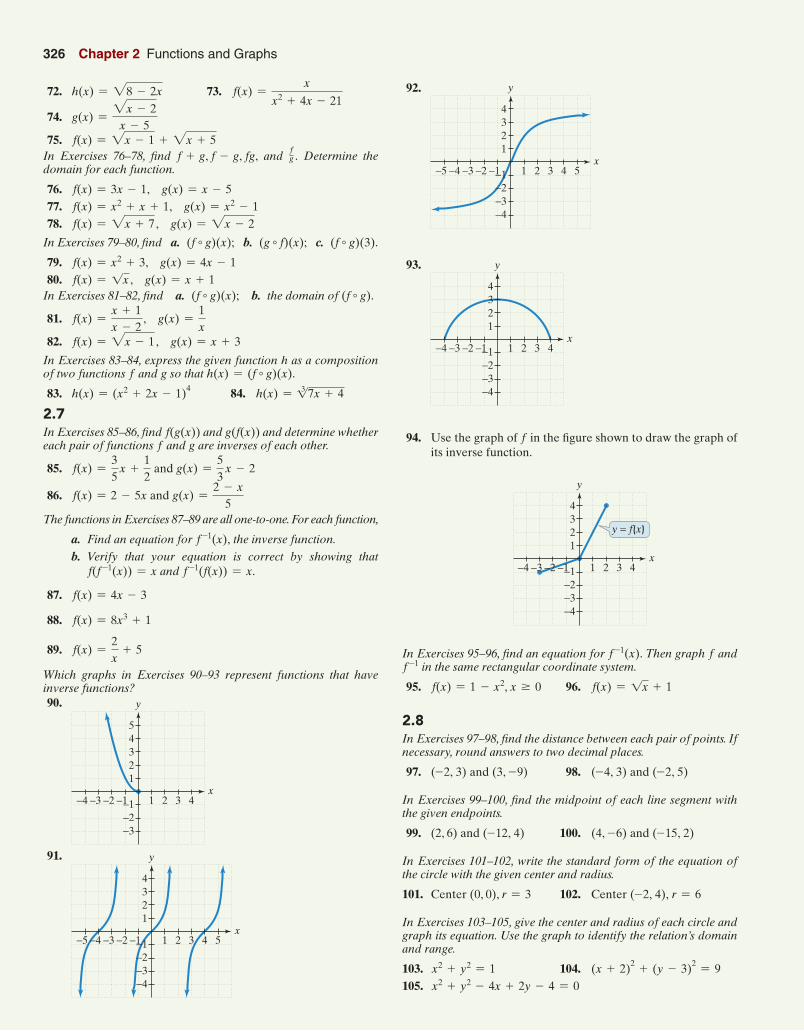
92.
−1
1234
−2−3−4
1 2 3 4 5−1−2−3−4−5
y
x
93.
−1
1234
−2−3−4
1 2 3 4−1−2−3−4
y
x
94. Use the graph of f in the fi gure shown to draw the graph of its inverse function.
−1
1234
−2−3−4
1 2 3 4−1−2−3−4
y
x
y = f(x)
In Exercises 95–96, fi nd an equation for f -1(x). Then graph f and f -1 in the same rectangular coordinate system.
95. f(x) = 1 - x2, x Ú 0 96. f(x) = 1x + 1
2.8 In Exercises 97–98, fi nd the distance between each pair of points. If necessary, round answers to two decimal places.
97. (-2, 3) and (3, -9) 98. (-4, 3) and (-2, 5)
In Exercises 99–100, fi nd the midpoint of each line segment with the given endpoints.
99. (2, 6) and (-12, 4) 100. (4, -6) and (-15, 2)
In Exercises 101–102, write the standard form of the equation of the circle with the given center and radius.
101. Center (0, 0), r = 3 102. Center (-2, 4), r = 6
In Exercises 103–105, give the center and radius of each circle and graph its equation. Use the graph to identify the relation’s domain and range.
103. x2 + y2 = 1 104. (x + 2)2 + (y - 3)2 = 9 105. x2 + y2 - 4x + 2y - 4 = 0
72. h(x) = 28 - 2x 73. f(x) =x
x2 + 4x - 21
74. g(x) =2x - 2x - 5
75. f(x) = 2x - 1 + 2x + 5 In Exercises 76–78, fi nd f + g, f - g, fg, and
fg . Determine the
domain for each function.
76. f(x) = 3x - 1, g(x) = x - 5 77. f(x) = x2 + x + 1, g(x) = x2 - 1 78. f(x) = 2x + 7, g(x) = 2x - 2
In Exercises 79–80, fi nd a. (f � g)(x); b. (g � f)(x); c. (f � g)(3).
79. f(x) = x2 + 3, g(x) = 4x - 1 80. f(x) = 1x , g(x) = x + 1 In Exercises 81–82, fi nd a. (f � g)(x); b. the domain of (f � g).
81. f(x) =x + 1x - 2
, g(x) =1x
82. f(x) = 2x - 1, g(x) = x + 3
In Exercises 83–84, express the given function h as a composition of two functions f and g so that h(x) = (f � g)(x).
83. h(x) = (x2 + 2x - 1)4 84. h(x) = 317x + 4
2.7 In Exercises 85–86, fi nd f(g(x)) and g(f(x)) and determine whether each pair of functions f and g are inverses of each other.
85. f(x) =35
x +12
and g(x) =53
x - 2
86. f(x) = 2 - 5x and g(x) =2 - x
5
The functions in Exercises 87–89 are all one-to-one. For each function,
a. Find an equation for f -1(x), the inverse function.
b. Verify that your equation is correct by showing that f(f -1(x)) = x and f -1(f(x)) = x.
87. f(x) = 4x - 3
88. f(x) = 8x3 + 1
89. f(x) =2x
+ 5
Which graphs in Exercises 90–93 represent functions that have inverse functions? 90.
−1
12345
−2−3
1 2 3 4−1−2−3−4
y
x
91.
−1
1234
−2−3−4
1 2 3 4 5−1−2−3−4−5
y
x
M06_BLIT2281_06_SE_02-hr.indd 326 13/09/12 5:43 PM
Section 2.8 Summary, Review, and Test 327 Summary, Review, and Test 327
CHAPTER 2 TEST 1. List by letter all relations that are not functions. a. {(7, 5), (8, 5), (9, 5)} b. {(5, 7), (5, 8), (5, 9)} c. y
x
d. x2 + y2 = 100 e. y
x�5 5
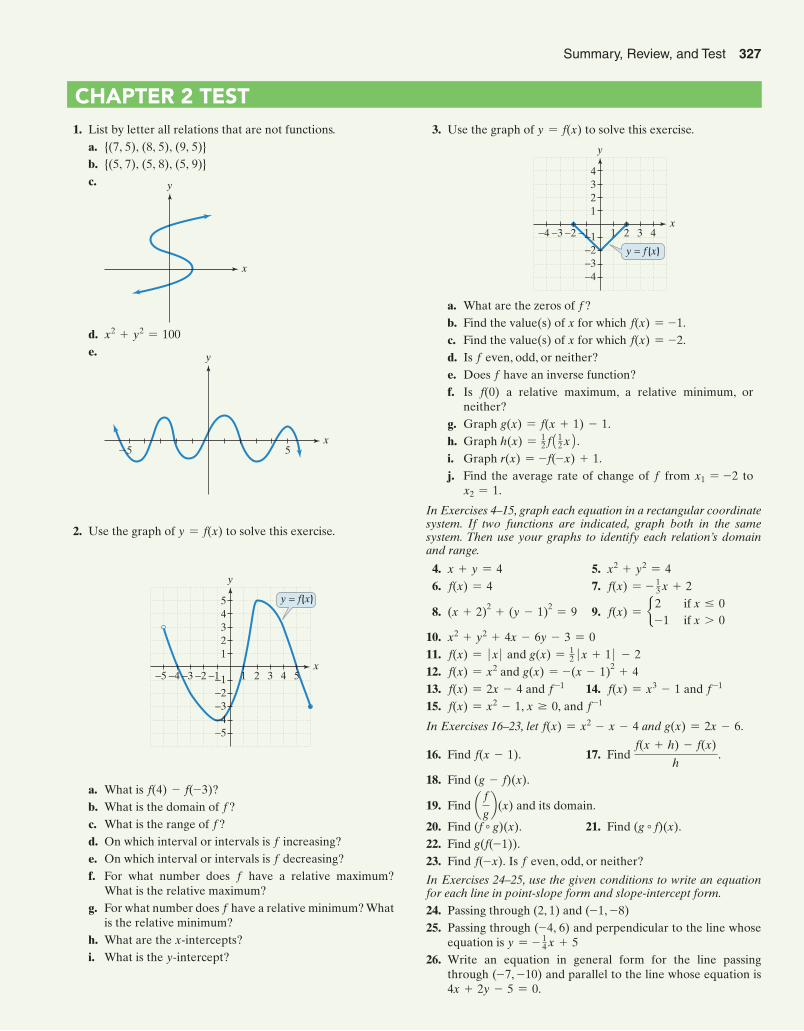
2. Use the graph of y = f(x) to solve this exercise.
−1
12345
−2−3−4−5
1 2 3 4 5−1−2−3−4−5
y
x
y = f(x)
a. What is f(4) - f(-3)? b. What is the domain of f ? c. What is the range of f ? d. On which interval or intervals is f increasing? e. On which interval or intervals is f decreasing? f. For what number does f have a relative maximum?
What is the relative maximum? g. For what number does f have a relative minimum? What
is the relative minimum? h. What are the x@intercepts? i. What is the y@intercept?
3. Use the graph of y = f(x) to solve this exercise.
x
y
1 2 3 4−1
1234
−2−3−4
−1−2−3−4
y = f (x)
a. What are the zeros of f ? b. Find the value(s) of x for which f(x) = -1. c. Find the value(s) of x for which f(x) = -2. d. Is f even, odd, or neither? e. Does f have an inverse function? f. Is f(0) a relative maximum, a relative minimum, or
neither? g. Graph g(x) = f(x + 1) - 1. h. Graph h(x) = 1
2 f112 x2.
i. Graph r(x) = - f(-x) + 1. j. Find the average rate of change of f from x1 = -2 to
x2 = 1.
In Exercises 4–15, graph each equation in a rectangular coordinate system. If two functions are indicated, graph both in the same system. Then use your graphs to identify each relation’s domain and range.
4. x + y = 4 5. x2 + y2 = 4 6. f(x) = 4 7. f(x) = - 13 x + 2
8. (x + 2)2 + (y - 1)2 = 9 9. f(x) = b 2 if x … 0-1 if x 7 0
10. x2 + y2 + 4x - 6y - 3 = 0 11. f(x) = � x � and g(x) = 1
2 � x + 1 � - 2 12. f(x) = x2 and g(x) = -(x - 1)2 + 4 13. f(x) = 2x - 4 and f -1 14. f(x) = x3 - 1 and f -1 15. f(x) = x2 - 1, x Ú 0, and f -1
In Exercises 16–23, let f(x) = x2 - x - 4 and g(x) = 2x - 6.
16. Find f(x - 1). 17. Find f(x + h) - f(x)
h.
18. Find (g - f)(x).
19. Find a f
gb(x) and its domain.
20. Find (f � g)(x). 21. Find (g � f)(x). 22. Find g(f(-1)). 23. Find f(-x). Is f even, odd, or neither?
In Exercises 24–25, use the given conditions to write an equation for each line in point-slope form and slope-intercept form.
24. Passing through (2, 1) and (-1, -8) 25. Passing through (-4, 6) and perpendicular to the line whose
equation is y = - 14 x + 5 26. Write an equation in general form for the line passing
through (-7, -10) and parallel to the line whose equation is 4x + 2y - 5 = 0.
M06_BLIT2281_06_SE_02-hr.indd 327 13/09/12 5:43 PM
328 Chapter 2 Functions and Graphs328 Chapter 2 Functions and Graphs
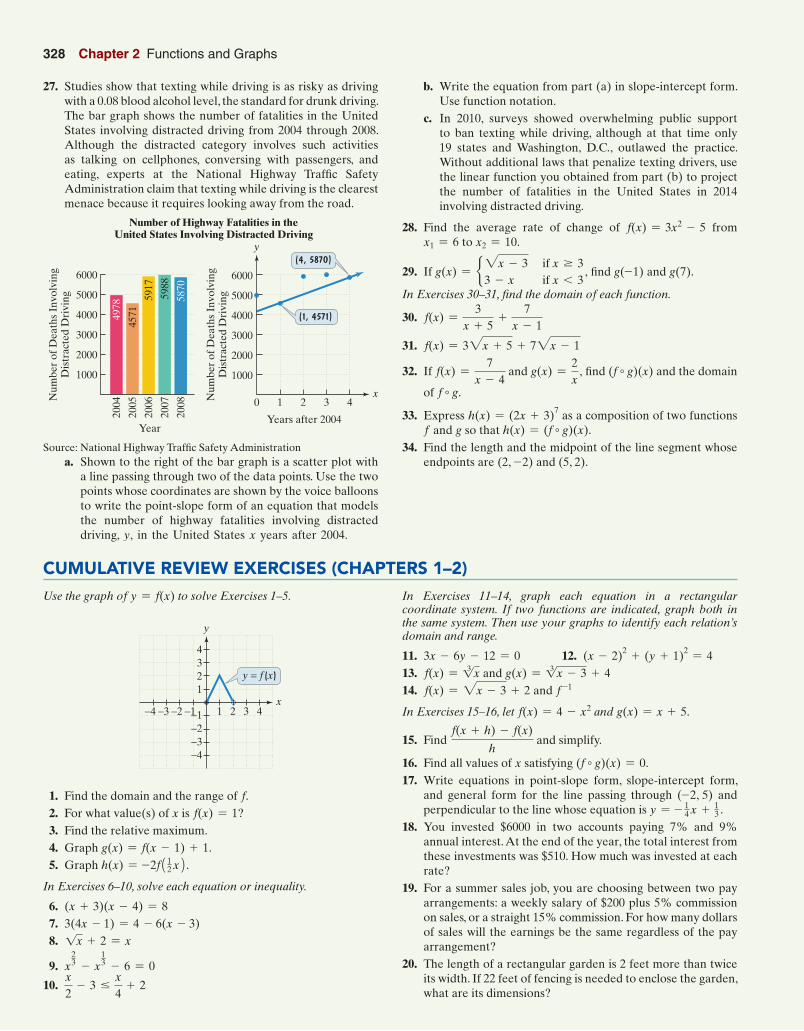
b. Write the equation from part (a) in slope-intercept form. Use function notation.
c. In 2010, surveys showed overwhelming public support to ban texting while driving, although at that time only 19 states and Washington, D.C., outlawed the practice. Without additional laws that penalize texting drivers, use the linear function you obtained from part (b) to project the number of fatalities in the United States in 2014 involving distracted driving.
28. Find the average rate of change of f(x) = 3x2 - 5 from x1 = 6 to x2 = 10.
29. If g(x) = b2x - 3 if x Ú 33 - x if x 6 3
, fi nd g(-1) and g(7).
In Exercises 30–31, fi nd the domain of each function.
30. f(x) =3
x + 5+
7x - 1
31. f(x) = 32x + 5 + 72x - 1
32. If f(x) =7
x - 4 and g(x) =
2x
, fi nd (f � g)(x) and the domain
of f � g.
33. Express h(x) = (2x + 3)7 as a composition of two functions f and g so that h(x) = (f � g)(x).
34. Find the length and the midpoint of the line segment whose endpoints are (2, -2) and (5, 2).
27. Studies show that texting while driving is as risky as driving with a 0.08 blood alcohol level, the standard for drunk driving. The bar graph shows the number of fatalities in the United States involving distracted driving from 2004 through 2008. Although the distracted category involves such activities as talking on cellphones, conversing with passengers, and eating, experts at the National Highway Traffi c Safety Administration claim that texting while driving is the clearest menace because it requires looking away from the road.
Number of Highway Fatalities in theUnited States Involving Distracted Driving
6000
5000
4000
3000
2000
2008
2007
5870
5988
2006
5917
2005
4571
2004
4978
Num
ber
of D
eath
s In
volv
ing
Dis
trac
ted
Dri
ving
Num
ber
of D
eath
s In
volv
ing
Dis
trac
ted
Dri
ving
Year
3 421
Years after 2004
0
1000
5000
6000
4000
3000
2000
1000
x
y
(1, 4571)
(4, 5870)
Source: National Highway Traffi c Safety Administration a. Shown to the right of the bar graph is a scatter plot with
a line passing through two of the data points. Use the two points whose coordinates are shown by the voice balloons to write the point-slope form of an equation that models the number of highway fatalities involving distracted driving, y, in the United States x years after 2004.
CUMULATIVE REVIEW EXERCISES (CHAPTERS 1–2)
Use the graph of y = f(x) to solve Exercises 1–5.
x
y
1 2 3 4−1
1234
−2−3−4
−1−2−3−4
y = f (x)
1. Find the domain and the range of f. 2. For what value(s) of x is f(x) = 1? 3. Find the relative maximum. 4. Graph g(x) = f(x - 1) + 1. 5. Graph h(x) = -2f11
2 x2. In Exercises 6–10, solve each equation or inequality.
6. (x + 3)(x - 4) = 8 7. 3(4x - 1) = 4 - 6(x - 3) 8. 1x + 2 = x
9. x
23
- x
13
- 6 = 0
10. x2
- 3 …x4
+ 2
In Exercises 11–14, graph each equation in a rectangular coordinate system. If two functions are indicated, graph both in the same system. Then use your graphs to identify each relation’s domain and range.
11. 3x - 6y - 12 = 0 12. (x - 2)2 + (y + 1)2 = 4 13. f(x) = 31x and g(x) = 31x - 3 + 4 14. f(x) = 2x - 3 + 2 and f -1
In Exercises 15–16, let f(x) = 4 - x2 and g(x) = x + 5.
15. Find f(x + h) - f(x)
h and simplify.
16. Find all values of x satisfying (f � g)(x) = 0. 17. Write equations in point-slope form, slope-intercept form,
and general form for the line passing through (-2, 5) and perpendicular to the line whose equation is y = - 14 x + 1
3 . 18. You invested $6000 in two accounts paying 7% and 9%
annual interest. At the end of the year, the total interest from these investments was $510. How much was invested at each rate?
19. For a summer sales job, you are choosing between two pay arrangements: a weekly salary of $200 plus 5% commission on sales, or a straight 15% commission. For how many dollars of sales will the earnings be the same regardless of the pay arrangement?
20. The length of a rectangular garden is 2 feet more than twice its width. If 22 feet of fencing is needed to enclose the garden, what are its dimensions?
M06_BLIT2281_06_SE_02-hr.indd 328 13/09/12 5:43 PM