Embed Size (px)
Citation preview

Noise, Vibration, and Harshness - Course 472 49
An organized, systematic procedure is important in any type of diagnosis.
It is the most efficient/cost effective way to resolve complaints the first
time. NVH complaints are sensed by feeling or hearing and are
therefore, very subjective in nature.
A good systematic diagnostic procedure is critical to deal with
these types of complaints because the symptoms may not clearly point
to the condition. Systematic diagnostic procedures will help you
successfully resolve NVH conditions as they do with difficult computer
and electrical problems.
Elements incorporated in a systematic diagnostic procedure are:
• An organized process of elimination which prioritizes activities
to quickly isolate the condition
• A thorough visual inspection for obvious conditions or clues to
help diagnose the condition
In order to apply these elements to NVH troubleshooting, a solid
understanding of the NVH theory in Section 1 is important. Diagnosis
applies the theory to isolate the condition. An incorrect diagnosis
usually results from a poor diagnostic procedure, a lack of
understanding on how the system works or both.
This section of the course will address in detail the first three items of
the NVH diagnostic procedure:
• Verify the complaint
• Classify the complaint
• Road test with NVH analyzer
Practice implementing the NVH diagnostic procedure will be
accomplished by following two customer complaint scenarios or
case studies.
• The first scenario is incorporated in this section of the technician
handbook.
• The second is part of the worksheet activities.
Section 2
NVH DIAGNOSTIC PROCEDURES
Introduction
NOTE
www.cargeek.ir
www.cargeek.ir

Section 2
50 TOYOTA Technical Training
Fig. 2-1
www.cargeek.ir
www.cargeek.ir

NVH Diagnostic Procedures
Noise, Vibration, and Harshness - Course 472 51
In order to help illustrate the concept of NVH diagnosis we will apply the
principles outlined above to a customer complaint involving a 4Runner.
Each topic in this section will be applied to the scenario and at the end
of the section the condition will be resolved.
The details of the diagnostic scenario are contained in the following
repair order. They are also included in each procedure and illustration
as it applies.
Repair Orderfor 4Runner
Fig. 2-2
Case Study:Background
www.cargeek.ir
www.cargeek.ir

Section 2
52 TOYOTA Technical Training
Each area of this section includes a worksheet which is based on a
customer complaint scenario. Your instructor has created a similar
problem in a shop vehicle for you to troubleshoot.
Detailed information and instructions for the worksheets will be
provided by your instructor. Upon completion of each worksheet, the
complaint should be resolved on the shop vehicles.
Verification of the customer complaint is a key starting point in an
NVH diagnostic procedure for two reasons:
• If the complaint can’t be verified, a plan can be implemented that
involves satisfying the customer through education or returning the
vehicle for service when the complaint can be duplicated.
• It is important that the technician experiences exactly what the
customer is complaining about and knows what is involved to
satisfy the customer.
There are three courses of action to successfully resolve an NVH
complaint:
1. Customer consultation
2. Technician diagnosis and repair
3. Technical assistance for non−serviceable conditions
Starting a diagnostic procedure implies that there is a problem with
the vehicle. The service department is then committed to the second
or third course of action. If it is discovered after the diagnosis
begins that the complaint was not verified, then it is difficult to step
back to the first course of action and customer satisfaction is very
difficult.
The earlier the appropriate course of action is chosen the more likely a
positive service experience will occur.
Case Study:Background
Continued
Verify theCustomerComplaint
www.cargeek.ir
www.cargeek.ir

NVH Diagnostic Procedures
Noise, Vibration, and Harshness - Course 472 53
www.cargeek.ir
www.cargeek.ir

Section 2
54 TOYOTA Technical Training
The Interview sheet is a tool designed to solve one of the largest
problems identified in NVH service, poor communication. Proper
communication helps you educate the customer and ensures an
appropriate course of action can be taken.
Research involving unresolved NVH complaints indicates that
technicians often start a diagnosis without knowing the exact details
of the complaint. This results from a lack of communication with the
customer which wastes time or causes a missed diagnosis.
Good communication skills include:
• Description or terminology that mean the same thing to all
parties involved.
• Time to help the customer clarify the complaint. (The customer
is not expected to know the technical terms of the automotive
industry).
• Information collected in an organized manner.
A customer, when properly interviewed, can provide a wealth of
information to start the diagnosis and process of elimination.
It is important to determine if the person bringing the vehicle in for
service is the primary operator of the vehicle. Often, vehicles are
brought in for service by someone who has no knowledge of the complaint.
The interview process is designed to help the customer focus on details
of the NVH complaint and vehicle conditions when the complaint occurs.
The interview sheet provides a format to communicate these
conditions using standard NVH terminology.
Verification of the complaint is also a critical area of diagnosis, when
the condition is intermittent or only occurs under specific
conditions.
For example:
Noises from suspension components may be much more pronounced
at ambient temperatures below 40°F. If these temperature conditions
are not present at the time of diagnosis, the technician may not
experience the complaint to the same degree as the customer.
The technician needs to experience the condition and be able to
duplicate it in order to accurately diagnose it. The more details that are
available, the more likely the condition can be found quickly.
An additional benefit of the interview sheet is the documentation of the
communication with the customer. It provides a history of the
service experience. In the event the complaint can’t be verified, this
documentation will provide valuable information in the event of
subsequent service visit.
Customer InterviewSheet
www.cargeek.ir
www.cargeek.ir
NVH Diagnostic Procedures
Noise, Vibration, and Harshness - Course 472 55
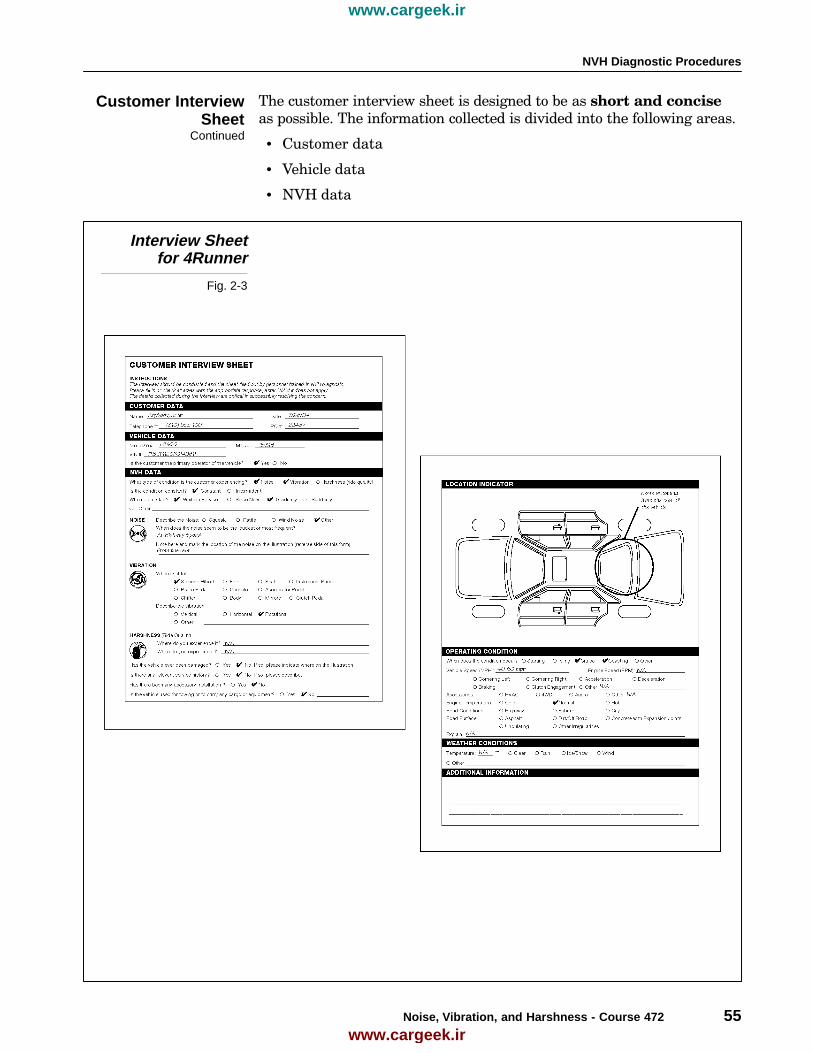
The customer interview sheet is designed to be as short and concise
as possible. The information collected is divided into the following areas.
• Customer data
• Vehicle data
• NVH data
Interview Sheetfor 4Runner
Fig. 2-3
Customer InterviewSheet
Continued
www.cargeek.ir
www.cargeek.ir

Section 2
56 TOYOTA Technical Training
Customer and vehicle data are for obvious logistical and
administrative purposes. The value of this data becomes clear if future
tracking of the customer, the vehicle or an NVH condition is required.
Customer andVehicle Data
Fig. 2-4
The NVH data is organized to provide the details of the complaint
and data on conditions present when the complaint occurs.
Communication is the key objective of the interview sheet and should
be done by trained service personnel to provide assistance and
clarification. Technician involvement in the interview may be required
to allow direct communication and minimize problems created by
passing information through a third person.
Begin the interview by asking the customer to classify the concern
by selecting one or more of the following:
• Noise
• Vibration
• Harshness
The next question determines whether the condition is constant or
intermittent.
The customer should also be asked if the complaint has developed
while operating the vehicle or whether it has been present since the
vehicle was new. This information will be useful to the technician in
determining which course of action to select, either technician
diagnosis or technical assistance.
Customer InterviewSheet
Continued
www.cargeek.ir
www.cargeek.ir

NVH Diagnostic Procedures
Noise, Vibration, and Harshness - Course 472 57
The customer is provided with a list of possible locations with a few
details specific to each location.
For example:
If the steering wheel is the location then there are three possible
types of steering wheel vibrations:
• Vertical
• Horizontal
• Rotational
Using this information, in conjunction with the classification flow
chart (discussed later), will considerably reduce the large list of
possible causes of the condition.
NVH Data
Fig. 2-5
Customer InterviewSheet
Continued
www.cargeek.ir
www.cargeek.ir

Section 2
58 TOYOTA Technical Training
The conditions section of the interview sheet is designed to collect
data for the following subjects:
• Operating conditions
• Vehicle conditions
• Road conditions
• Weather conditions
Each of these areas have specific conditions to select, which will provide
the technician with the details necessary to duplicate the complaint.
Each area has space provided to record information on unique
complaints or conditions that fall outside the parameters outlined in
the interview sheet.
The interviewer should cover all areas that apply to the complaint. N/A
should be entered in areas that do not apply, indicating to the technician
that the customer considered the subject and did not over look it.
The customers should be aware of the key role they play in resolving
the complaint.
Vehicle andOperating
Conditions
Fig. 2-6
Customer InterviewSheet
Continued
www.cargeek.ir
www.cargeek.ir

NVH Diagnostic Procedures
Noise, Vibration, and Harshness - Course 472 59
At this point in the diagnosis the technician has:
• A completed repair order
• A completed interview sheet
• Verified the complaint
• Chosen one of three course of actions
The technician can now proceed with a plan for customer consultation or
NVH diagnosis equipped with a strong background of the complaint.
In the 4Runner scenario the customer has filled in the customer and
vehicle data sections. This has to be reviewed to make sure that it is
completely filled out.
The customer has indicated to the interviewer that he is the primary
driver and has experienced the complaint.
The NVH data indicates the following areas have been selected during
the interview:
Classify
• Noise other than squeak, rattle or wind noise
• Vibration
They are both constant and started gradually. The vibration is felt
in the steering wheel and is rotational. The sound is heard in the
rear of the vehicle.
Operating conditions
• 40 − 60 MPH
• Cruise
• Coasting
It is also important to note that the following data has not been selected:
• Since new
• Vehicle condition section
• Road condition section
• Engine RPM
• Weather condition section
The fact that these areas were marked N/A indicates that the condition
has developed while in service, engine speed does not effect it and
that it is always there once the vehicle speed range is reached.
For the purposes of this scenario the technician has gone for a short ride
with the customer and has verified that the complaint does exist as
described.
The technician has also chosen the second option, technician
diagnosis and repair, based on the information and verification
available. The technician agrees that an unacceptable condition does
Summary
Case study: Part I
www.cargeek.ir
www.cargeek.ir

Section 2
60 TOYOTA Technical Training
exist. The customer has indicated that the vehicle has recently developed
the condition.
www.cargeek.ir
www.cargeek.ir

NVH Diagnostic Procedures
Noise, Vibration, and Harshness - Course 472 61
www.cargeek.ir
www.cargeek.ir

Section 2
62 TOYOTA Technical Training
WORKSHEET #1Verification of the Customer complaint
Vehicle Year/Prod. Date Engine Transmission
Diagnostic Description:
It is critical for the technician to experience the complaint for it to be successfully resolved. The CustomerInterview Sheet is a tool , used by trained NVH service personnel, to collect the details associated with thecustomer complaint. With the information from the interview the technician can easily duplicate thesymptom and gain valuable insight for diagnosis.
Your instructor has created typical NVH conditions in the shop vehicles. The completion of worksheets 1,2, 4A and 4B will provide practice using the NVH diagnostic procedures and resolve the conditions onthese vehicles. Worksheets 3A, 3B and 3C will provide experience using the NVH Analyzer .
Your instructor will also act as the customer providing the information necessaryto complete the first step, the customer interview (Copy Attached).
Customer InterviewSheet
Fig. 2-7
Verify the Complaint
NOTE
www.cargeek.ir
www.cargeek.ir

NVH Diagnostic Procedures
Noise, Vibration, and Harshness - Course 472 63
Instructions
1. Conduct the customer interview with the customer/instructor by asking all the questions on the attachedsheet.
2. Your instructor will act like a customer and may not understand the question or the terminology used. Besure to provide clarification and explanations as necessary.
You may need to ask probing questions to determine if the customer understandsthe questions. They may not easily indicate that they don’t understand.
The questions asked during this process may prompt the customer to provideadditional, valuable information that they may not normally think of as important.You are the NVH expert, not the customer.
It is important that the interview be conducted and the sheet filled out bypersonnel trained in NVH service. The customers should not be left to fill out thesheet on their own. Trained personnel can provide assistance, as necessary, toensure high quality information about the complaint.
3. When the interview is complete, review all the data collected and answer the following questions. If thereview or the following questions identify a lack of information, conduct that portion of the interview again.
4. Take a quick test drive with the customer to experience the complaint and determine what needs to bedone to satisfy the customer.
5. Refer to the Technician Handbook for additional information to answer the following questions.
Questions
1. What is the difference between a test drive with the customer and a road test performed during diagnosis?
2. What is the reason for knowing who is the primary operator of the vehicle?
NOTE
www.cargeek.ir
www.cargeek.ir

Section 2
64 TOYOTA Technical Training
Questions (continued)
3. If the person who brings the vehicle in for service is not the primary operator, what is your plan of action ?
4. What value is it to have precise vehicle data when conducting a road test ? (i.e. year, trans, axle, tire size)
5. What is the value of knowing:
• Service History
• Damage History
• Accessory installation
6. If the customer indicates that there has been one of the above situations with the vehicle (question #5),what would your next questions include ? Please list and explain.
Where would you record this information?
www.cargeek.ir
www.cargeek.ir

NVH Diagnostic Procedures
Noise, Vibration, and Harshness - Course 472 65
Questions (continued)
7. What is the pitfall associated with assuming the customer understands the meaning of NVH terms, suchas “harshness”.
8. When should the operating conditions be determined to maximize a positive service experience and why?
9. What information is provided when the interviewer enters N/A as an answer?
10. What is the advantage to filling in the final details the customer could not answer, during the test drive?
11. What is the value of having the interviewer and customer review and sign the interview sheet?
www.cargeek.ir
www.cargeek.ir

Section 2
66 TOYOTA Technical Training
Conclusions
1. List the information from the interview sheet that is relevant to resolving the complaint. Briefly explaineach.
2. From the information gathered at this point, what test drive techniques are necessary to duplicate thesymptoms? Explain.
3. Based on the information collected from the interview sheet and the test drive, which of the following courseof actions would you choose and why?
• Customer Consultation
• Technician Diagnosis and Repair
• Technical Assistance for non-serviceable conditions
4. If customer consultation is chosen, what is your plan of action ? Explain.
www.cargeek.ir
www.cargeek.ir

NVH Diagnostic Procedures
Noise, Vibration, and Harshness - Course 472 67
5. What is the pitfall associated with starting a diagnosis before the verification process is complete?
www.cargeek.ir
www.cargeek.ir

Section 2
68 TOYOTA Technical Training
www.cargeek.ir
www.cargeek.ir

NVH Diagnostic Procedures
Noise, Vibration, and Harshness - Course 472 69
www.cargeek.ir
www.cargeek.ir

Section 2
70 TOYOTA Technical Training
During diagnosis a technician has to take a large list of possible NVH
conditions and, through a process of elimination, find the one that
applies to the situation.
SymptomsClassification
Flow Chart
Fig. 2-8
Classify theComplaint
www.cargeek.ir
www.cargeek.ir
NVH Diagnostic Procedures
Noise, Vibration, and Harshness - Course 472 71
Once the complaint has been classified, a specific diagnostic approach
can be applied which will identify the source. This eliminates random
diagnosis resulting in wasted time, confusion and frustration.
A further advantage of this organized style of diagnosis is that it allows
the technician to trace the steps. The point where a decision was
made, which led to a wrong, diagnosis can be identified. Only the
necessary procedures need to be repeated to successfully find the
condition.
Classification is done by collecting information about the complaint
that is unique to the condition. Each step in the process eliminates
possibilities until there is only one left.
Efficient diagnosis prioritizes the procedures that eliminates the
largest number of possibilities first. This process will minimize the
number of tests required and will be less likely to send the technician
looking in the wrong direction.
The four tools available in the classification process are:
• Customer interview sheet
• Flow chart for classification
• Road test
• NVH Analyzer
With the data collected from the complaint verification and interview
sheet, the technician can follow a path through the flow chart by
making yes or no decisions at each level of the chart.
If a decision can’t be clearly made at a specific point in the chart, then
a point has been identified where more information is needed, and
exactly what that information has to include.
Successful completion of the flow chart will provide the technician with
a classification for the symptoms which can be associated with
specific characteristics. These specific characteristics can only be
caused by one area on a vehicle and pinpoint diagnosis can be
focused on that area for the cause and repair (See Section 1 for the
specific characteristics).
Classify theComplaint
Continued
www.cargeek.ir
www.cargeek.ir

Section 2
72 TOYOTA Technical Training
WORKSHEET #2Classify the complaint
Vehicle Year/Prod. Date Engine Transmission
Diagnostic Description:
The recent emphasis placed on NVH in automobiles has brought with it a new vocabulary . In addition,quality communication from the customer to the technician, has been identified as one of the major areasof concern for successful NVH service.
Standardized NVH terminology is very important to ensure that everyone understands the conditions in thesame way. The flow chart is a tool used by the technician to identify the symptom from the data collectedduring the interview and the test drive.
When the proper symptom is selected from the list, there are specific characteristics associated with theterm which are helpful in diagnosis. For example, the frequency of the symptom.
Classification FlowChart
Fig. 2-9
Symptoms Classification Flow Chart
www.cargeek.ir
www.cargeek.ir
NVH Diagnostic Procedures
Noise, Vibration, and Harshness - Course 472 73
Instructions
As indicated in worksheet #1, this worksheet is the second worksheet designed to:
• provide an opportunity to practice the NVH diagnostic procedure
• resolve the condition placed in the shop vehicles.
1. Use the information collected on the customer interview sheet and the test drive (worksheet #1) to answerthe questions at each branch of the flow chart. (attached)
2. If you cannot clearly answer the questions on the sheet then you have identified an area that requires moreinformation. Determine if it has to be collected from the customer/instructor or another test drive.
3. Review the characteristics of each symptom on the symptom chart (Section 1 of the student handbook) andanswer the following questions.
Questions
1. How many symptoms were identified?
2. List the symptom/s below.
3. Is the symptom/s noise, vibration, harshness or a combination?
4. What are the frequencies associated with the symptom/s?
5. Why will knowing the frequency be helpful during diagnosis ?
6. What other things are you familiar with in your daily life which operate at the same frequency? Why is thishelpful in diagnosis?
7. Are the symptoms engine speed related, vehicle speed related or both?
www.cargeek.ir
www.cargeek.ir

Section 2
74 TOYOTA Technical Training
Questions (continued)
8. What conditions , listed on the symptom chart (Section 1) are the same as gathered during the interviewsheet and the test drive?
What conditions are different ?
9. List the possible causes from the symptom chart (Section 1) that are most likely in this case. Explain.
10. What is the vibrating system related to the symptom?
• Vibrating force:
• Resonance system:
• Transmission system:
• Vibrating body:
11. Does the vibrating system from the symptoms chart (Section 1) and the one associated with this case match ?
12. Remember, not all cases follow a text book situation exactly, the chart serves as a guide for most cases.
What is your plan of action in the event that the case being diagnosed is not exactly the same as thesymptoms outlined in the chart?
Conclusions
The information generated with this flow chart will be used with the customer interview sheet, the NVHanalyzer, and the road test to classify the complaint and identify the possible source of the vibration orsound. (engine, driveline or wheels)
A successful pinpoint diagnosis can be done with solid background information on the complaint.
www.cargeek.ir
www.cargeek.ir

NVH Diagnostic Procedures
Noise, Vibration, and Harshness - Course 472 75
www.cargeek.ir
www.cargeek.ir

Section 2
76 TOYOTA Technical Training
www.cargeek.ir
www.cargeek.ir

NVH Diagnostic Procedures
Noise, Vibration, and Harshness - Course 472 77
After the technician has verified the complaint, the classification flow
chart is used to establish that there are two areas or classifications, for
the symptoms.
• Steering shimmy
• Body booming
In the first level of the flow chart there are four choices:
• Driving (coasting)
• Take−off
• Standing
• Braking
Driving was selected because the symptoms occur between 40 − 60 MPH.
The second level asks if the symptoms are related to vibration or noise.
In this case both areas need to be considered because there is a
vibration in the steering wheel and a noise from the rear of the
4Runner.
The next level under vibration asks for the speed. The vibration is noticed
first at about 40 MPH which is considered to be medium speed.
The chart next asks if the steering wheel vibrates in the direction of
rotation. The term to describe this symptom is steering shimmy.
The next level after noise asks for speed. In this case the noise is most
noticeable at speeds above 50 MPH. Driving at medium or high speed
is the choice that best fits the noise symptom.
Next, you are asked if the noise varies or is unrelated to road condition.
Unrelated best fits in this case. The customer noted, and the verification
indicated, that the noise is always there once the proper speed is reached.
The sound is best described as a low and heavy sound as opposed to
high clear sound and is related to vehicle speed.
The final question relating to noise asks if it is continuous or cyclic. The
noise in the 4Runner scenario is described as being continuous which
points to a body booming classification for the noise.
This may seem to be a complex way to arrive at a description of a
symptom. But using this process and the flow chart insures that the
proper terms are being used and mean the same thing to everyone
involved.
In addition, there are very specific causes associated with each of these
classifications which help the technician narrow down the list of
possibilities. If the wrong term is used it could lead to a pinpoint
diagnosis in the wrong area, wasting time.
Case study: Part II
www.cargeek.ir
www.cargeek.ir

Section 2
78 TOYOTA Technical Training
Diagnostic road testing is done after the complaint has been verified.
Customers are helpful in verifying the complaint but do not need to be
part of the complete diagnostic process. Unfortunately, some diagnostic
procedures do not separate the verification of the complaint from the
road test. The road test is designed to help isolate the condition after
it has been verified. Data collected from a customer and data collected
from a road test are different and serve two different functions.
During the road test, the technician duplicates the complaint under
several specific operating conditions. This is done to identify unique
characteristics which will help classify the complaint. In addition to
duplicating the complaint, the technician should try to change or
eliminate the symptom using techniques such as different speeds,
RPM, load or other operating conditions.
Road TestProcedures
Fig. 2-10
Road Test
www.cargeek.ir
www.cargeek.ir

NVH Diagnostic Procedures
Noise, Vibration, and Harshness - Course 472 79
The road test is designed to get the most information in the shortest
amount of time. It is also part of a process of elimination reducing a
large list of possibilities to the one causing the complaint.
The condition of the vehicle must not be modified prior to the
road test. A thorough visual inspection may find conditions such as low
tire inflation. Properly inflating the tires prior to the road test may
modify the vehicle to the point that the symptoms may be effected.
Once the complaint has been verified the road test can be modified
specifically to the complaint. Only conditions that apply to the
complaint need to be duplicated.
For example:
If the condition occurs at a specific speed then road test parameters
that do not apply to that condition do not need to be performed, like
engine idle in Neutral or Park.
Road TestContinued
www.cargeek.ir
www.cargeek.ir

Section 2
80 TOYOTA Technical Training
During the road test, the ability to quantify the frequency and the
level of the vibration or sound is very useful for diagnosis. It also
provides an objective basis for comparison.
Knowing the frequency of the condition will help classify the
symptom. The large list of possibilities can be reduced considerably due
to the fact that only specific components operate at specific frequencies.
A vibration analyzer, such as the Toyota NVH Analyzer, can measure
the level of a specific frequency vibration or sound. This level can be
recorded and compared to known good vehicles as well as the complaint
vehicle, after the repair has been performed.
If a frequency analyzer is not available, experience with known
vibrations is helpful in diagnosis. This approach, however, is very
subjective when comparing levels of noise or vibration (See Section 1
for details).
NVH Analyzer
Fig. 2-11
Collecting, Readingand Analyzing
NVH Data
www.cargeek.ir
www.cargeek.ir

NVH Diagnostic Procedures
Noise, Vibration, and Harshness - Course 472 81
The Diagnostic tool set includes an extensive Operator’s Manual
with operating instructions for each program card. These references
provide an excellent resource for the following information:
• Hardware
• Features
• Operating precautions
• Getting started
• Using the RS232 and instrumentation ports
The appendices provide valuable additional information to help the
operator get the most out of the Diagnostic Tool Set (See operator’s
manual table of contents).
The operating instructions provide details on the NVH Analyzer
functionality. When one of the program cards is selected, the
instructions will walk the operator through the menu selections and
key strokes until the appropriate data is displayed. It will also explain
how to move through the different displays, modify the displays and
how to pause or snapshot the data. Interpreting the data is left to
the technician.
Toyota DiagnosticTool Set Manual
Fig. 2-11b
Collecting, Readingand Analyzing
NVH DataContinued
www.cargeek.ir
www.cargeek.ir

Section 2
82 TOYOTA Technical Training
WORKSHEET #3AGetting Started with the NVH Analyzer
Description:
The NVH Analyzer is designed to be very user friendly , with the minimal menu selections required toselect the vehicle and access the data displays.
This worksheet is designed to orient you to the NVH menus and the active keys on the analyzer.
Toyota DiagnosticTester
Fig. 2-12
The NVH Analyzer Set-up
www.cargeek.ir
www.cargeek.ir
NVH Diagnostic Procedures
Noise, Vibration, and Harshness - Course 472 83
Instructions
1. Install the NVH Training Software card.
2. Refer to the NVH section of the Diagnostic Tool Set Operator’s Manual (Sections 1.0 - 3.0) and follow theprocedures outlined to familiarize yourself with the operators manual, menu structure, active keys, andfunctions.
• 1.0 Getting Ready
• 2.0 Vehicle and System Selection
• 3.0 NVH Main Menu
3. Press the key frequently to familiarize yourself with the help information available in the software. Usethe key to return to the menu or data displays.
4. Perform the selection procedures on the following vehicles and note the different selections required toaccess the NVH data displays.
• 93 4Runner, 3VZ-E-4WD, AXLE G254, MT 10.5R15
• 93 Supra
• 93 Tercel, 4speed MT and AT
5. Repeat a vehicle selection from above using the “LAST VEHICLE” selection. Note the menus eliminatedusing this selection compared to the “NEW VEHICLE” selection.
An auxiliary power source is recommended during this worksheet to avoidinterruptions from a dead battery. (Refer to the operators manual section,“Powering the Diagnostic Tester”)
Questions
1. Which key moves forward through the menu structure?
2. Which key moves back through the menu structure?
3. What are the two ways to select “NVH” on the Function Select Menu?
4. What is the purpose of selecting the vehicle specific year, engine, transmission, etc.?
5. What effect will the wrong vehicle or vehicle parameters selection have on diagnosis ? How will you know?
6. What is the advantage to using the “LAST VEHICLE” selection when possible?
HELP
EXIT
NOTE
www.cargeek.ir
www.cargeek.ir
Section 2
84 TOYOTA Technical Training
Questions (continued)
7. List the resources available to verify the vehicle axle ratio.
8. Under what conditions would the axle ratio need to be changed ? Be specific.
9. List three useful pieces of information available on the vehicles parameters screen. Explain.
10. Does the tool tell you where to connect the data link cable on the vehicle selected?
If so, which screen?
11. What is your plan of action if you get the “NVH Signal Conditioner Failure” screen? Explain.
12. What is the printer “Baud Rate” default value?
Where did you find the answer?
13. How many unit conversions can be modified?
List the ones applicable to NVH.
14. What type of information is available through “help”?
www.cargeek.ir
www.cargeek.ir

NVH Diagnostic Procedures
Noise, Vibration, and Harshness - Course 472 85
www.cargeek.ir
www.cargeek.ir
Section 2
86 TOYOTA Technical Training
WORKSHEET #3BGetting Started with the NVH Analyzer
Description:
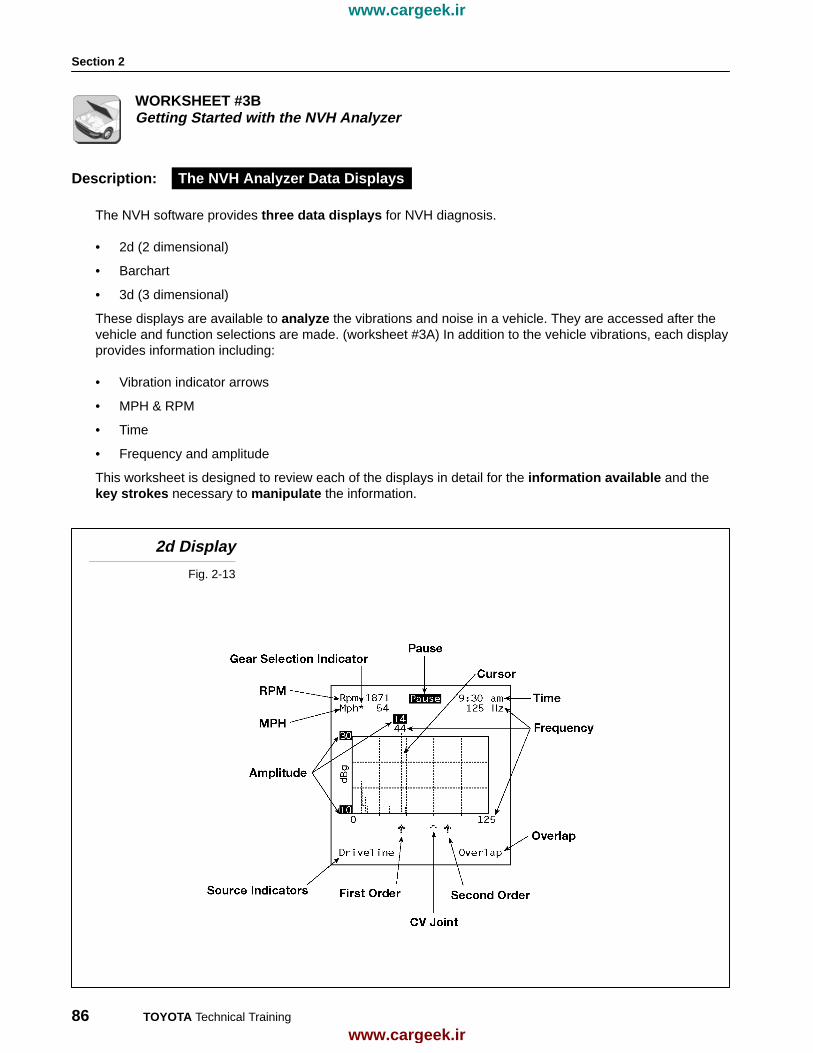
The NVH software provides three data displays for NVH diagnosis.
• 2d (2 dimensional)
• Barchart
• 3d (3 dimensional)
These displays are available to analyze the vibrations and noise in a vehicle. They are accessed after thevehicle and function selections are made. (worksheet #3A) In addition to the vehicle vibrations, each displayprovides information including:
• Vibration indicator arrows
• MPH & RPM
• Time
• Frequency and amplitude
This worksheet is designed to review each of the displays in detail for the information available and thekey strokes necessary to manipulate the information.
2d Display
Fig. 2-13
The NVH Analyzer Data Displays
www.cargeek.ir
www.cargeek.ir

NVH Diagnostic Procedures
Noise, Vibration, and Harshness - Course 472 87
Instructions
1. Install the NVH training software card.
2. Perform the set-up procedures outlined in the NVH section of the operator’s manual (Sections 1.0 - 3.0).
• 93 Previa, 4wd AT
• 93 Celica, 5S-FE, convertible
• 93 Corolla, 4A-FE, DLX
3. Refer to Sections 4.0 - 6.0 for details relating to each of the displays and functions.
• 4.0 NVH Displays
• 5.0 Pause Mode
• 6.0 Data Record
4. Practice manipulating the displays with the active keys to learn the range and function of the dataavailable for diagnosis.
Questions
1. What do the two axises represent on the 2d display?
• Vertical
• Horizontal
2. What are the active keys on the 2d display that change the:
• amplitude
• frequency (for each direction)
• source indicator (engine, driveline and wheel)
• cursor
3. How many ranges or bands are available for:
• Amplitude
• Frequency
4. If the time is not correct how is it changed ?
5. What is the value of the time indicator on the display or a screen print?
www.cargeek.ir
www.cargeek.ir

Section 2
88 TOYOTA Technical Training
Questions (continued)
6. If the “no data” indicator is displayed adjacent to the MPH and RPM indicators, what is your plan of action ?Explain.
7. If the vehicle requires a manual gear selection, how is it indicated on the display?
8. What is the key to enter the gear selection display?
9. What is the key required to change the vibration source indicators (selected component)?
10. Why do some vehicles require gear selection while others do not ?
11. What is the default gear selection if none is selected?
12. What effect will using the default gear position have in diagnosis?
13. Which active key changes the three NVH Data displays?
14. How many events are displayed on the barchart and 3d display?
15. Which line is the most recent event on both the:
• barchart
• 3d display
www.cargeek.ir
www.cargeek.ir

NVH Diagnostic Procedures
Noise, Vibration, and Harshness - Course 472 89
Questions (continued)
16. On the barchart display, is the total dBg displayed:
A. the sum of the engine, driveline, and wheel dBs
B. or the greatest level of total vibration felt in the vehicle (engine, driveline, and wheel levels arecompared to the total)
17. How do you change the amplitude scale factor on the barchart display?
What is the range?
18. What is the function of the RCV key?
www.cargeek.ir
www.cargeek.ir

Section 2
90 TOYOTA Technical Training
WORKSHEET #3CGetting Started with the NVH Analyzer
Description:
NVH data analysis is the key to using the NVH Analyzer in the diagnostic process. The ability to accuratelyidentify the “spikes” associated with the vibration, causing the customer complaint, will contribute to yoursuccess and customer satisfaction.
The NVH training simulation software contains pre-recorded vehicles with typical vibration characteristicsand customer complaint vibrations . Specific scenarios are selected by choosing one of the followingvehicles on the vehicle select screen.
• 93 Truck 3VZ-E 4WD G254 AT STREAM 31
• 93 Truck 3VZ-E 4WD G254 AT STREAM 73
• 93 Truck 3VZ-E 4WD G254 AT STREAM 76
• 93 Camry 5S-FE AT STREAM 35
• 93 Camry 5S-FE AT STREAM 72
• 93 Landcruiser STREAM 30
The NVH data analysis worksheet is designed to utilize the NVH training software to provide practiceanalyzing vibrations . The software allows this activity to take place in the classroom where everyone canbenefit from the same scenarios, discussions and direction from the instructor.
2d Display
Fig. 2-14
NVH Data Analysis
www.cargeek.ir
www.cargeek.ir

NVH Diagnostic Procedures
Noise, Vibration, and Harshness - Course 472 91
Instructions
1. Install the NVH training simulation software and go through the function and vehicle selection menus .Use the skills developed in worksheet #3A.
Follow the directions from your instructor in selecting the vehicles. The directions willinclude details from the customer interview sheet and the symptomsclassification flow chart .
2. Observe the data displayed on each of the three displays. Use the skills developed inworksheet #3B to manipulate the screens to observe the clearest view of the data.
For example:
Changing the amplitude to a higher scale may eliminate vibrations that are normal.Changing the frequency range may make low frequency wheel vibrations easier toread.
The scenarios were recorded for the length of time required to capture arepresentative sample . The software will display the data in a continuous loop .Watch the RPM and MPH indicators to determine the beginning of the loop.
3. Select each of the three source indicators and identify the spikes above eacharrow on the 2d and 3d displays.
4. Compare what is indicated on the 2d and 3d displays to the data indicated on thebarchart display.
5. When you have identified the spike that is associated with the symptom perform asave and screen print of all the displays. Attach to the sheet provided.
6. Formulate a plan for a thorough road test that you would perform to determine ifyour conclusions are correct. Base the plan on the information from:
• the customer interview sheet
• the symptoms classification flow chart
• the data viewed in the scenario
Place your answer in the space provided on the attached sheet.
The ability to anticipate what spikes you should find is very helpful in diagnosis. It makesit easier and more efficient to plan the display manipulations and the road test.
7. Answer the questions as you review the scenarios and place your answers for 1-10on the chart (attached).
Questions
1. Based on the information from the customer interview and the symptom classification, indicate what type ofvibration you expect to see on the display prior to reviewing the NVH data.
• engine 1st order 2nd order 3rd order 4th order
• driveline 1st order 2nd order 3rd order 4th order
• wheels 1st order 2nd order 3rd order 4th order
NOTE
NOTE
NOTE
www.cargeek.ir
www.cargeek.ir

Section 2
92 TOYOTA Technical Training
Questions (continued)
2. Observing the spikes in question, what frequency range would best display the spikes? Explain.
3. While viewing data on the 2d display, are there any spikes shown at frequencies greater then 125 Hz?
4. What amplitude range will clearly display the larger spikes and eliminate the normal vibrations?
5. Which scenarios indicate an overlap condition?
6. Which indicators are overlapping?
7. What would your plan of action be for a road test to determine which source was causing the spike? Bespecific.
8. Which source shows the greatest level of energy on the barchart display?
9. After reviewing the displays which are the vibrations of concern ?
10. What are your conclusions and plan of action from the symptom information and NVH data on this vehicle?
www.cargeek.ir
www.cargeek.ir

NVH Diagnostic Procedures
Noise, Vibration, and Harshness - Course 472 93
Conclusion
1. Why were the three sources of vibration (engine, driveline and wheel) selected for indication by the NVHAnalyzer?
2. When is a comparison of amplitude level from vehicle to vehicle of little value?
3. What is the value of recording the amplitude level of the vibration causing the complaint before the repair?
4. How do you obtain the exact frequency and amplitude of any spike displayed?
5. What is your plan if you find a significantly large spike that is not over an arrow?
6. What type of vibrations and sounds are the technician expected to repair? Give examples.
Explain.
7. What type of vibrations and sounds are beyond the scope of the technician? Give examples.
Explain.
www.cargeek.ir
www.cargeek.ir

Section 2
94 TOYOTA Technical Training
Questions (continued)
8. What is the value of the diagnostic procedures and the NVH Analyzer when dealing with vibrations thatrequire assistance?
9. List the information necessary prior to calling for assistance.
10. On the Stored Data Blocks screen which is the most current stored data and where is the default positionof the cursor?
11. How many data blocks can be stored?
What are the active keys required to store data?
12. What happens if you hit to save paused data and the all the blocks are full ?
13. When do you get the “Review Old Data” screen?
Under what conditions does it appear?
14. What are the two ways to delete data saved?
15. What is missing when analyzing data on the training software compared to analyzing data during the RoadTest?
ENTER
www.cargeek.ir
www.cargeek.ir

NVH Diagnostic Procedures
Noise, Vibration, and Harshness - Course 472 95
QUESTION 1. ANTICIPATEDVIBRATION
2. BESTFREQUENCY
3. “SPIKES”ABOVE 125 Hz
4. BESTAMPLITUDE
VEHICLEVIBRATION
SOURCE/ORDERFREQUENCY
RANGEABOVE 125 Hz
YES/NOAMPLITUDE
RANGE
LANDCRUISER (30) / Hz Hz dBg
YES/NO
TRUCK A (33) / Hz Hz dBg
YES/NO
TRUCK B (73) / Hz Hz dBg
YES/NO
TRUCK C (76) / Hz Hz dBg
YES/NO
CAMRY A (35) / Hz Hz dBg
YES/NO
CAMRY B (72) / Hz Hz dBg
YES/NO
SYMPTOM 1
LANDCRUISER (30)
TRUCK A (33)
TRUCK B (73)
TRUCK C (76)
CAMRY A (35)
CAMRY B (72)
www.cargeek.ir
www.cargeek.ir

Section 2
96 TOYOTA Technical Training
5. OVERLAP YES/NO6 INDICATORS
8. BARCHARTLEVEL
9. ACTUALVIBRATIONS
10. CONCLUSIONSPLAN OF6. INDICATORS
7. PLAN OF ACTIONLEVEL VIBRATIONS
SOURCE/ORDERPLAN OFACTION
YES/NO ENGINEDRIVELINEDRIVELINEWHEELSWHEELS
YES/NO ENGINEDRIVELINEDRIVELINEWHEELSWHEELS
YES/NO ENGINEDRIVELINEDRIVELINEWHEELSWHEELS
YES/NO ENGINEDRIVELINEDRIVELINEWHEELSWHEELS
YES/NO ENGINEDRIVELINEDRIVELINEWHEELSWHEELS
YES/NO ENGINEDRIVELINEDRIVELINEWHEELSWHEELS
SYMPTOM 2
www.cargeek.ir
www.cargeek.ir

NVH Diagnostic Procedures
Noise, Vibration, and Harshness - Course 472 97
2D BARCHART 3D
LANDCRUISER (30)
ATTACHSCREEN PRINT
HERE
ATTACHSCREEN PRINT
HERE
ATTACHSCREEN PRINT
HERE
COMMENTS
CAMRY A (35)
ATTACHSCREEN PRINT
HERE
ATTACHSCREEN PRINT
HERE
ATTACHSCREEN PRINT
HERE
COMMENTS
CAMRY B (72)
ATTACHSCREEN PRINT
HERE
ATTACHSCREEN PRINT
HERE
ATTACHSCREEN PRINT
HERE
COMMENTS
www.cargeek.ir
www.cargeek.ir

Section 2
98 TOYOTA Technical Training
2D BARCHART 3D
TRUCK A (33)
ATTACHSCREEN PRINT
HERE
ATTACHSCREEN PRINT
HERE
ATTACHSCREEN PRINT
HERE
COMMENTS
TRUCK B (73)
ATTACHSCREEN PRINT
HERE
ATTACHSCREEN PRINT
HERE
ATTACHSCREEN PRINT
HERE
COMMENTS
TRUCK C (76)
ATTACHSCREEN PRINT
HERE
ATTACHSCREEN PRINT
HERE
ATTACHSCREEN PRINT
HERE
COMMENTS
www.cargeek.ir
www.cargeek.ir

NVH Diagnostic Procedures
Noise, Vibration, and Harshness - Course 472 99
www.cargeek.ir
www.cargeek.ir

Section 2
100 TOYOTA Technical Training
WORKSHEET #3DDynamic NVH Data Analysis
Diagnostic Description:
The NVH training software used in worksheets #3A, #3B, and #3C provide excellent classroom training tointroduce and develop basic skills with the NVH Analyzer.
This worksheet is designed to add the dynamic element of sensing the vibration or noise while analyzingthe NVH data. Sensing the symptom while viewing the data develops the relationship between thevibration or noise and the spikes. The ability to make this relationship is key to duplicating and manipulatingthe symptom which will make diagnosis easier .
Instructions
1. Install the NVH/BREAK-OUT BOX Program Card.
2. Connect the Data Link Cable and the Accelerometer to the vehicle set up in the shop, using theOperator’s Manual.
3. Review the information from the Customer Interview Sheet and the Classification Flow Chart for the vehicleselected.
4. Use the skills gained in worksheet #3C to anticipate and develop a plan to analyze the data.
5. With the help of the instructor confirm the customer complaint in the vehicle set up in the shop.
6. Analyze the data while duplicating and manipulating the symptom, save and print a representative sampleof each display. Attach to the sheet provided.
7. Based on the complaint information and the NVH data analysis, develop a plan for a pinpoint diagnosis.
8. Remove the “bug” and retest the vehicle to confirm the “repair”. Attach a screen print to sheet provided.
Questions
1. What are your conclusions from the NVH data analysis for developing a pinpoint diagnosis plan?
2. List the advantages of being able to sense the vibration or noise while analyzing the NVH data.
Dynamic NVH Data Analysis
www.cargeek.ir
www.cargeek.ir

NVH Diagnostic Procedures
Noise, Vibration, and Harshness - Course 472 101
Questions (continued)
3. How does sensing the symptoms make the diagnosis more efficient than simply viewing the data inworksheet #3C?
4. After the “bugs” were identified would you have come to the same conclusions or a pinpoint diagnostic planin question #1? Explain.
www.cargeek.ir
www.cargeek.ir

Section 2
102 TOYOTA Technical Training
2D BARCHART 3D
BEFORE
ATTACHSCREEN PRINT
HERE
ATTACHSCREEN PRINT
HERE
ATTACHSCREEN PRINT
HERE
AFTER
ATTACHSCREEN PRINT
HERE
ATTACHSCREEN PRINT
HERE
ATTACHSCREEN PRINT
HERE
COMMENTS
www.cargeek.ir
www.cargeek.ir

NVH Diagnostic Procedures
Noise, Vibration, and Harshness - Course 472 103
Learning to associate the NVH data with vehicle vibrations takes
practice and an understanding of how the different displays provide
information. It is also helpful to understand how the displays can be
compared to one another to isolate the data that relates to the complaint.
NVH AnalyzerDisplays
Fig. 2-15
Diagnostic DisplayInterpretation Hints“VIBRATION” function
www.cargeek.ir
www.cargeek.ir

Section 2
104 TOYOTA Technical Training
The road test techniques are also valuable when using an NVH
analyzer while trying to isolate a complaint. Duplicating and
controlling the symptoms during a road test can help identify specific
data that responds in the same way as the symptom.
For safety reasons, the pause and save ( ) features are
helpful to store and review the data after the road test. It is very
difficult to safely operate the vehicle and analyze data at the same
time. A second person to operate the vehicle is also useful during a
road test, especially if the vibration is intermittent.
For example:
The 2d display (which is a two dimensional display that plots
the vibrations according to frequency and amplitude) is useful
during the test drive of an engine vibration. The driver can shift the
vehicle into neutral and coast while the technician watches or
records the vibrations. The spikes on the display that are related to
the engine should go away while the spikes that are related to the
driveline or wheels should remain.
The barchart display is a three dimensional display that shows
eleven samples of data, plotting the amount of energy of the vibrations
in the three source groups:
• Engine
• Driveline
• Wheels and tires
The barchart display makes an excellent starting point for diagnosis.
It is very helpful to determine where the most amount of energy is
generated or how the energy is distributed.
A technician can decide which of the above areas to focus on when
moving to the 2d or the 3d displays for more specific analysis of the
vibrations.
For example:
While test driving a vehicle, the barchart display may show the majority
of the energy in the area of the driveline. The technician can now
switch to the 2d display ( ), select the driveline indicators ( ),
and look for large spikes that fall above the driveline arrows. Large
spikes would indicate vibrations that would generate the high energy
levels on the bar chart display.
“VIBRATION” functionContinued
F00
F66
F11
F33
www.cargeek.ir
www.cargeek.ir

NVH Diagnostic Procedures
Noise, Vibration, and Harshness - Course 472 105
A large spike above a driveline arrow would confirm a driveline
condition. The amplitude level can be documented for future reference.
A technician can now focus the diagnosis in the driveline area.
The NVH Analyzer is designed to do the math required to associate a
specific frequency vibration with one of the three groups listed above.
It displays this by providing the terms �engine", �driveline" or �wheels"
on the display and arrows for various order vibrations. These arrows
are placed below the display pointing to the associated frequencies. A
�^" is used to depict the CV joint frequency when checking driveline
vibrations.
2d DisplayIndicators
Fig. 2-16
“VIBRATION” functionContinued
www.cargeek.ir
www.cargeek.ir

Section 2
106 TOYOTA Technical Training
When using the NVH Analyzer it is very important that the vehicle
parameters be verified for the vehicle being tested. Every effort has
been made to provide an accurate data base but there are many
variables and combinations involved with our vehicles.
Location forData Link Cable
Vehicle Parameters
93 4Runner 270
AxleRatio 4.875Engine Type V6CV No. 3SpeedCode 3.333Data Source CHKDrive Type RWD
VehicleParameters Menu
Fig. 2-17
Sticker on “B”Pillar
Fig. 2-18
“VIBRATION” functionContinued
NOTE
www.cargeek.ir
www.cargeek.ir

NVH Diagnostic Procedures
Noise, Vibration, and Harshness - Course 472 107
It is possible to have a unique situation that requires research in the
Repair Manuals, parts fiche, TSBs and NCFs to collect the
specifications necessary to modify the data base.
When the data base is accurate, the arrows will properly line up with
engine, driveline and wheel vibrations.
An LED will light and �overlap" will flash when there is a possible
overlap situation. This indicates that more then one source needs to
be considered for a vibration displayed on the screen. The arrow will
also flash indicating which spike could be caused by more than one
source.
Overlap/LEDsIndicators
Fig. 2-19
For example:
When a vehicle is operating in fourth gear on a manual
transmission it is possible for the gear ratio to be 1:1. The engine
speed and the driveline speed are the same in this case, therefore
an overlap could occur with a vibration generated by either area.
In this case an LED will light warning the technician of the overlap
condition. The technician would view the other two groups ( ) to
identify the overlap. This is done by finding the spike that has an
arrow pointing to it in more than one area (engine, driveline, wheels).
In this example, the technician could select a different gear or step
on the clutch to make the engine and driveline RPM different. This
would isolate the vibration to a specific source.
“VIBRATION” functionContinued
F33
www.cargeek.ir
www.cargeek.ir

Section 2
108 TOYOTA Technical Training
The 3d display provides a three dimensional (3d) view of the
vibrations in a vehicle by displaying 11 spectral lines (2d) which
provides a brief history of the vibrations. Each of the eleven lines
is the same as one 2d line, showing frequency and amplitude. By
stacking them, a technician can easily observe changes in the spikes
as the symptom changes.
This is helpful when road testing a vehicle with a difficult condition to
diagnosis. When the technician modifies the operating conditions of the
vehicle, while trying to control the symptoms, the 3d display will show
changes in the spike related to the complaint. Observing which spike
changes as the symptom changes can identify the area causing the
condition by looking at the arrow associated with that spike.
3d Display
Fig. 2-20
“VIBRATION” functionContinued
www.cargeek.ir
www.cargeek.ir

NVH Diagnostic Procedures
Noise, Vibration, and Harshness - Course 472 109
For example:
If you watch the normal engine firing vibrations on the 3d display,
you will note a variation in the amplitude of the vibration due to
power fluctuations of the engine. The power fluctuations are caused
by changes in the air/fuel ratio in a normal feedback system.
Each of the displays can be changed to customize the parameters and
focus in on a sample. These features allow the technician to eliminate
data that is not applicable and provide a clearer view of the data that is
relevant to the condition.
The parameters can be changed in the following way:
• Frequency band width ( ) forward & ( ) backward
• Floor and ceiling level of the amplitude scale ( )
• Engine, driveline and wheel indicators ( )
Frequency band width is adjustable to the following four ranges
using the key:
• 0 − 500 Hz
• 0 − 250 Hz
• 0 − 125 Hz
• 0 − 62.5 Hz
The frequency band width defaults to the 125 Hz scale when the
display is first selected from the vehicle parameters menu. Once in the
display, if a different scale is selected, then it remains at that level as
other displays are selected.
The scale selected is shown in two places on the 2d and 3d display as
shown in fig. 2−21 and in the upper right corner of the barchart
display.
The advantage of starting with the 125 Hz scale is that it gives a clear
view of the spikes most likely generated by a vehicle. Once a spike or
range has been identified, the appropriate band width can be selected
using the key. If the default is set at a smaller frequency band then
a spike outside that range may be overlooked. A quick check of the 500
Hz scale will reveal any spikes that may appear above the default
setting.
If there is an indicator arrow outside the frequency band selected,
there will be a flashing LED and frequency indicator to warn the
technician to check a larger frequency range for possible spikes.
“VIBRATION” functionContinued
F22 *
F22
F33
F22
F22
www.cargeek.ir
www.cargeek.ir
Section 2
110 TOYOTA Technical Training
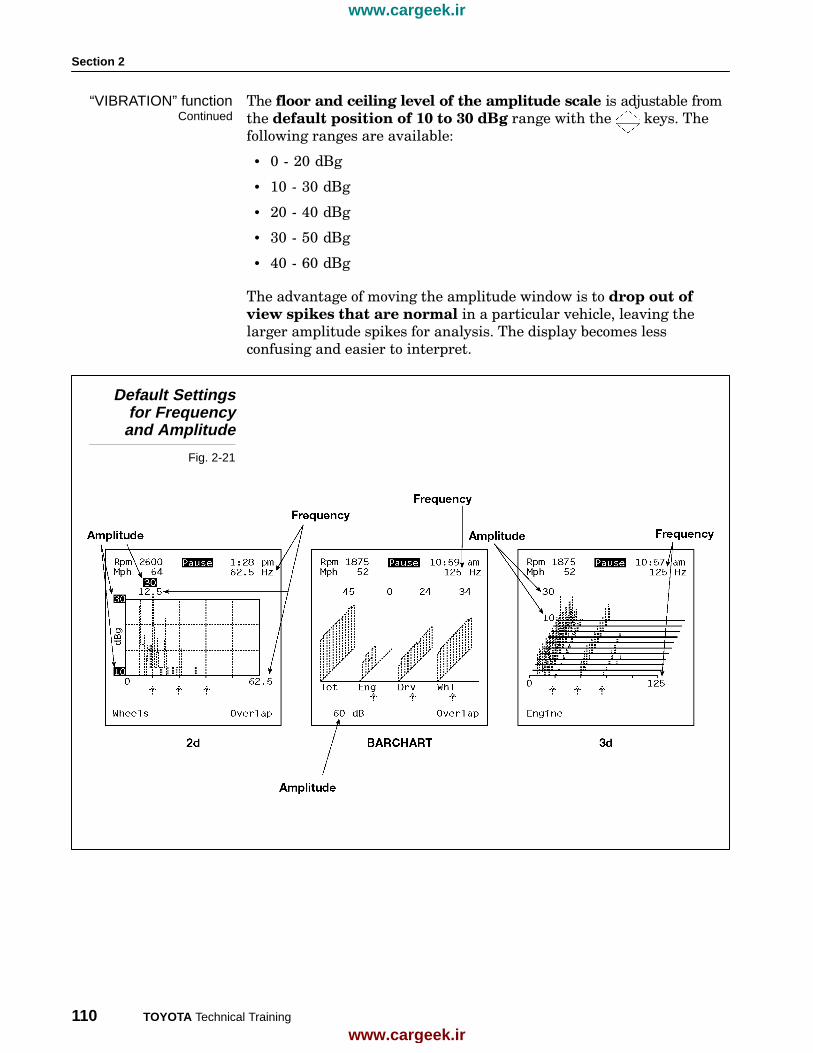
The floor and ceiling level of the amplitude scale is adjustable from
the default position of 10 to 30 dBg range with the keys. The
following ranges are available:
• 0 − 20 dBg
• 10 − 30 dBg
• 20 − 40 dBg
• 30 − 50 dBg
• 40 − 60 dBg
The advantage of moving the amplitude window is to drop out of
view spikes that are normal in a particular vehicle, leaving the
larger amplitude spikes for analysis. The display becomes less
confusing and easier to interpret.
Default Settingsfor Frequency
and Amplitude
Fig. 2-21
“VIBRATION” functionContinued
www.cargeek.ir
www.cargeek.ir

NVH Diagnostic Procedures
Noise, Vibration, and Harshness - Course 472 111
Additional display features include:
• RPM and MPH display
• Time display
• Cursor w/Hz and dBg ( )
• �NO data" indicator for RPM/MPH
The RPM and MPH are displayed in the upper left corner of the
screen. This data is collected from the data link connected to a
diagnostic connector identified in the vehicle parameter screen.
Screen Indicators
Fig. 2-22
Many NVH complaints are related to RPM or vehicle speed. The
display makes it convenient to monitor RPM and MPH from the check
connector or data stream without additional test equipment.
There are two ways the tool obtains the data for RPM and MPH. The
first is from the data stream on late model vehicles and the second
is from the IG− signal on non−data stream vehicles. The tool is able
to determine where to get the information when the vehicle is selected
by the technician. The vehicles parameters screen has a line indicating
the connector that has to be used. In addition, an asterisk is displayed
next to the MPH indicator when gear selection is required by the user.
The tool is not able to determine the gear selection when using IG−.
The technician needs to press and select the gear manually for
the driveline and wheel indicators to be accurate.
“VIBRATION” functionContinued
F88
www.cargeek.ir
www.cargeek.ir

Section 2
112 TOYOTA Technical Training
The default position for the gear selection is the highest
transmission gear available and will be accurate when driving in
that gear if a selection ( ) was not made.
Other differences between using the data stream and IG− include:
• The resolution of RPM on IG− is an actual reading, on the data
stream it changes in 25 RPM increments.
• On IG− vehicles when the RPM is below 1600 the MPH reads 0.
RPM and MPH will be displayed if:
• The vehicle is equipped with functioning IG− in the under hood
DLC1 (check connector)
• Data stream is available from the DLC1 (check connector), DLC2
(TDCL), or DLC3 (OBD2 connector)
• All connections are complete from the check connector to the NVH
Analyzer
• The NVH Analyzer is functioning properly
�NO data" indicator for RPM/MPH is a feature that appears to let the
technician know that there is no communication through the data link.
When a vehicle has both IG− and a data stream, the data stream
should be used for accuracy. Check for a DLC2 (TDCL) or DLC3
connector and use it if available.
When using DLC2 (TDCL), the NVH Analyzer must be connected to the
cigarette lighter for power. There is no B+ terminal in the DLC2 connector.
The time display provides the screen print with a time stamp which
helps differentiate and sequence multiple printouts. It helps eliminate
questions as to whether a printout applies to a specific vehicle or road
test event.
A cursor is available with the use of the keys which allows the
technician to find the exact frequency and amplitude of a particular
spike. This is done by placing the cursor directly over the spike and
reading the frequency and amplitude above the display. The indicators
move with the cursor.
The cursor moves in equal increments with each stroke of the key
or progressively faster if the key is held. If the end of the display is
reached then the cursor automatically appears at the opposite end of
the display.
Scale Increment
500 4 Hz
250 2 Hz
125 1 Hz
62.5 .5 Hz
“VIBRATION” functionContinued
F88
NOTE
NOTE
www.cargeek.ir
www.cargeek.ir

NVH Diagnostic Procedures
Noise, Vibration, and Harshness - Course 472 113
The noise selection from the main menu will function the same as
the vibration selection. The menus for vehicle setup are the same and
the noise function uses the same diagnostic displays. The exception is
in the parameters for amplitude.
• dB is used instead of dBg
• The floor and ceiling level default is 65 to 85 dB
• The following ranges are available:
45 − 75 dB
65 − 85 dB
75 − 95 dB
85 − 105 dB
95 − 115 dB
A microphone is used instead of an accelerometer as an input for
sound. The microphone is non−directional and cannot be used to
find the location of a noise.
Noise function operates the same as the vibration function because a
noise is also a vibration. The same skills used to isolate a vibration
are also used with noise.
It is important to understand that noise can also be generated by:
• Rattles
• Squeaks
• Wind
These are in addition to noises that can be generated by the three
component groups indicated by the arrows on the displays:
• Engine
• Driveline
• Wheels and tires
Rattles, squeaks and wind noise will be discussed in the last part of
Section 4 and in the Wind and Interior Noise program. The
techniques used to diagnose these areas are different than noises related
to the three major sources that the NVH Analyzer is able to display.
Rattles are usually low frequency, low amplitude and intermittent
making them difficult to identify on a vibration analyzer.
Squeaks and wind noise are usually high frequency above the 500 Hz
limit of the NVH Analyzer.
Other noises of significant amplitude, which are within the NVH
Analyzer frequency limits, can be displayed on either the vibration
or the noise selection.
“NOISE” function(option)
www.cargeek.ir
www.cargeek.ir
Section 2
114 TOYOTA Technical Training
The classification process discussed earlier is very helpful in
identifying the frequency range of a noise to determine which
diagnostic technique is most appropriate:
• For frequency ranges below 500 Hz, the NVH Analyzer can identify
one of the three sources of vibration: engine, driveline, wheels.
• For frequencies above 500 Hz, a pinpoint diagnosis for rattles,
squeaks or wind noise should be used.
The ability to control the noise, through test driving techniques, can
produce a relationship between the noise and the spike displayed on
the NVH Analyzer.
For example:
If a noise appears at a specific speed or operating condition then the
technician needs to become familiar with the data displayed when
there is no noise. When the noise appears then the spike that was
not there before should be identified. If the spike appears above a
pointer associated with a component group then diagnosis should
be directed in that area.
If the frequency of a vibration or noise spike is not associated with an
arrow, then the frequency should be multiplied by 60 to find the RPM.
The components operating at that RPM can be considered for diagnosis.
The skills developed in using the NVH Analyzer are now applied in
the next area of diagnosis, the road test.
Install NVH Analyzer to monitor and record NVH and vehicle data
(See NVH Analyzer operating and instruction manual for details).
A tachometer is recommended if a NVH Analyzer is not available and
the vehicle is not equipped with a tach. MPH can be noted from the
speedometer.
A road test course should be selected that allows for safe operating
conditions that will duplicate the customer’s complaint. Frequent use
of the same course will allow the technician to develop experience in
predicting what normal vibrations can be expected during different
aspects of the road test.
Known good vehicles should be analyzed on this course for comparison
with complaint vehicles. This will be most helpful when looking for
spikes, related to complaints, on a NVH Analyzer display.
“NOISE” function(option)
Continued
Road TestProcedures
www.cargeek.ir
www.cargeek.ir
NVH Diagnostic Procedures
Noise, Vibration, and Harshness - Course 472 115
After installing the NVH Analyzer, use the engine run−up test to
determine if the complaint is related to engine speed or vehicle speed.
With the information from the interview sheet, and the complaint
verification, try to duplicate the symptom by creating the same
vehicle and operating conditions described by the customer.
Start at idle, cold or hot, (if applicable) then increase the engine RPM
with the transmission in Park or Neutral.
If the symptoms occur, record the vibration to capture the engine
RPM, frequency and amplitude of the complaint for future
reference. Further road test procedures are not necessary.
If a vibration occurs, but does not directly relate to an engine vibration
indicator, then an accessory such as power steering, A/C, or water
pump should be considered.
These components operate at different speeds/frequencies relative to
the pulley diameter. Using the calculations outlined in Section 1 and a
photo tach, you can identify the accessory that is related to a spike on
the NVH display.
Shifting the vehicle into neutral when the symptoms occur will also
help confirm if the complaint is engine or vehicle speed related. If the
vibration goes away as the engine RPM goes to idle, further diagnosis
in the engine area is required.
Some engine related vibrations may be sensitive to load. Block the
wheels, set the brakes and raise the engine RPM with the transmission
in drive. This will apply a load on the vehicle which may cause
components to move and vibrate, that would not under normal
operating conditions. Use the 3d screen to easily recognize unusual or
different vibration.
For example:
• motor mounts
• exhaust system contact
• engine misfire
Use care not to overheat the engine or transmission.
If the above tests do not duplicate the complaint then perform the light
acceleration test. Accelerate on a smooth, level surface until the
symptoms are present. Record the vibration at the point when it is
most noticeable.
Note if the vibration changes or disappears when cruise is maintained,
after acceleration. If it occurs perform a heavy acceleration to see if the
condition can be exaggerated.
Engine Run-up Test
Brake Torque Test
CAUTION
Light Acceleration Test
www.cargeek.ir
www.cargeek.ir

Section 2
116 TOYOTA Technical Training
Some conditions require the vehicle to be under load, for example, a
propeller shaft vibration. Heavy acceleration and/or a road test course
that includes a hill will be helpful to provide the load required to
duplicate the complaint.
For example:
Loading and unloading a driveline is very helpful in isolating a
propeller shaft condition, especially when there is an overlap
indicated on the NVH Analyzer for driveline and wheels. As the
driveline loading changes a propeller shaft vibration will change. A
condition in the wheel area will tend to stay constant.
An overlap indication is indicated on the NVH Analyzer with the word
�overlap" displayed on the screen and an LED light below the screen.
When this occurs, the technician should change the vehicle
condition to eliminate the overlap and observe the spikes that
remain.
Some engine related vibrations, transmitted through the exhaust, are
also more noticeable under load than during an engine run−up test.
Cruise is often the most common operating condition of a complaint. It
is much easier to �tune" into a particular symptom when it is continuous.
In addition to constant vibrations, beating vibrations that come and go
need to be observed during cruise over a longer period of time. A
noticeable beat may occur in 4−6 second cycles.
Although the customer may indicate that the vibration occurs at a
particular speed, the road test should include several cruise speeds,
(i.e. 35, 45, 55 MPH). The speed the customer mentions may be the
most common operating speed and not the speed that produces the
greatest amplitude.
For example:
Tire vibrations are often most noticeable when they resonate with the
suspension or steering system between 40 and 55 MPH. Driveline
vibrations are often more noticeable at speeds above 50 MPH.
A road test should also include some rough road to induce energy
into the suspension that may produce vibrations or shimmy in the
steering wheel.
For example:
A leaking front strut will cause a suspension and steering system to
resonate on a rough road.
Rough road conditions may also produce noises such as squeaks or
rattles that are not as noticeable on a smooth road.
Heavy Acceleration Test
Cruise
www.cargeek.ir
www.cargeek.ir

NVH Diagnostic Procedures
Noise, Vibration, and Harshness - Course 472 117
The advantage of coasting is that it eliminates engine vibrations
and load. The vehicle environment may become quieter making it
easier to notice noises that are masked by other sounds.
Deceleration is similar to coasting with the addition of load caused by
engine compression. The load is a different force then load applied
during acceleration. This will cause components to react differently
under these conditions, producing a larger level vibration.
CV joint symptoms often appear in a turn when the joint angle
increases. In many cases, the NVH Analyzer will show an overlap with
a third order wheel vibration. Putting a load on the CV joint may
increase the level of the vibration, while the third order wheel
level would remain the same.
Turns are also helpful in identifying vibrations from components
which contact the body. Worn suspension parts may shift with a
side load.
The customer interview sheet can be very helpful to identify the need
for this type of test.
A technician may be able to reproduce a noise by simply bouncing the
vehicle up and down. It should be done at each quarter of the vehicle
while observing components and listening for sounds. A second person
is helpful during this test.
Coasting
Deceleration
Turning
Jounce Test
www.cargeek.ir
www.cargeek.ir

Section 2
118 TOYOTA Technical Training
When the symptom is at its most noticeable level, the technician can
try to control or modify the symptoms to help isolate the source.
The following chart is a list of additional items to keep in mind while
trying to diagnose a complaint. You may add items as you gain
experience with NVH diagnosis:
ÁÁÁÁÁÁÁÁÁÁÁÁÁÁÁÁÁÁÁÁÁÁÁÁÁÁ
Item ÁÁÁÁÁÁÁÁÁÁÁÁÁÁÁÁÁÁÁÁÁÁÁÁÁÁÁÁÁÁÁÁÁÁÁÁÁÁÁÁÁÁ
DescriptionÁÁÁÁÁÁÁÁÁÁÁÁÁÁÁÁÁÁÁÁÁÁÁÁÁÁÁÁÁÁÁÁÁÁÁÁÁÁÁÁÁÁÁÁÁÁÁÁÁÁÁÁÁÁÁÁÁÁÁÁÁÁÁÁÁÁÁÁÁÁÁÁÁÁÁÁÁÁÁÁÁÁÁÁÁÁÁÁÁÁÁ
Vehicles w/o locking torqueconverters
ÁÁÁÁÁÁÁÁÁÁÁÁÁÁÁÁÁÁÁÁÁÁÁÁÁÁÁÁÁÁÁÁÁÁÁÁÁÁÁÁÁÁÁÁÁÁÁÁÁÁÁÁÁÁÁÁÁÁÁÁÁÁÁÁÁÁÁÁÁÁÁÁÁÁÁÁÁÁÁÁÁÁÁÁÁÁÁÁÁÁÁÁÁÁÁÁÁÁÁÁÁÁÁÁÁÁÁÁÁÁÁÁÁÁÁÁÁÁÁÁÁÁÁÁÁÁÁÁÁÁÁÁÁÁÁÁÁÁÁÁÁÁÁÁÁÁÁ
A few of our vehicles do not have locking torque converters. TheNVH Analyzer calculates MPH using RPM and the gear ratio database. In these cases it is important to make sure the vehicle is notunder load and that stable cruise has been established for accuratedriveline and wheel arrow indicators.
ÁÁÁÁÁÁÁÁÁÁÁÁÁÁÁÁÁÁÁÁÁÁÁÁÁÁÁÁÁÁÁÁÁÁÁÁÁÁÁÁÁÁÁÁÁÁÁÁÁÁÁÁÁÁÁÁÁÁÁÁÁÁÁÁÁÁÁÁÁÁÁÁÁÁÁÁÁÁÁÁÁÁÁÁÁÁÁÁÁÁÁÁÁÁÁÁÁÁÁÁÁÁÁÁ
Brake application
ÁÁÁÁÁÁÁÁÁÁÁÁÁÁÁÁÁÁÁÁÁÁÁÁÁÁÁÁÁÁÁÁÁÁÁÁÁÁÁÁÁÁÁÁÁÁÁÁÁÁÁÁÁÁÁÁÁÁÁÁÁÁÁÁÁÁÁÁÁÁÁÁÁÁÁÁÁÁÁÁÁÁÁÁÁÁÁÁÁÁÁÁÁÁÁÁÁÁÁÁÁÁÁÁÁÁÁÁÁÁÁÁÁÁÁÁÁÁÁÁÁÁÁÁÁÁÁÁÁÁÁÁÁÁÁÁÁÁÁÁÁÁÁÁÁÁÁÁÁÁÁÁÁÁÁÁÁÁÁÁÁÁÁÁÁÁÁÁ
Lightly applying the brake at cruise may produce a vibration at wheelspeed frequency. Pedal feel is important during this procedure.
Lightly applying the parking braking will do the same as the abovebut only to the rear wheels. This can be helpful in isolating a front orrear brake condition.
Caution: Use care not to overheat the brakes in this procedure.Damage and additional vibration may result.
ÁÁÁÁÁÁÁÁÁÁÁÁÁÁÁÁÁÁÁÁÁÁÁÁÁÁÁÁÁÁÁÁÁÁÁÁÁÁÁÁÁÁÁÁÁÁÁÁÁÁÁÁÁÁÁÁÁÁÁÁÁÁÁÁÁ
4x4 vehicles
ÁÁÁÁÁÁÁÁÁÁÁÁÁÁÁÁÁÁÁÁÁÁÁÁÁÁÁÁÁÁÁÁÁÁÁÁÁÁÁÁÁÁÁÁÁÁÁÁÁÁÁÁÁÁÁÁÁÁÁÁÁÁÁÁÁÁÁÁÁÁÁÁÁÁÁÁÁÁÁÁÁÁÁÁÁÁÁÁÁÁÁÁÁÁÁÁÁÁÁÁÁÁÁÁÁ
4x4 vehicles have additional driveline components that may beengaged, disengaged or removed to determine which group iscontributing to the complaint,
ÁÁÁÁÁÁÁÁÁÁÁÁÁÁÁÁÁÁÁÁÁÁÁÁÁÁÁÁÁÁÁÁÁÁÁÁÁÁÁÁÁÁÁÁÁÁÁÁÁÁÁÁÁÁÁÁÁÁÁÁÁÁÁÁÁÁÁÁÁÁÁÁÁÁÁÁÁÁ
Accessories
ÁÁÁÁÁÁÁÁÁÁÁÁÁÁÁÁÁÁÁÁÁÁÁÁÁÁÁÁÁÁÁÁÁÁÁÁÁÁÁÁÁÁÁÁÁÁÁÁÁÁÁÁÁÁÁÁÁÁÁÁÁÁÁÁÁÁÁÁÁÁÁÁÁÁÁÁÁÁÁÁÁÁÁÁÁÁÁÁÁÁÁÁÁÁÁÁÁÁÁÁÁÁÁÁÁÁÁÁÁÁÁÁÁÁÁÁÁÁÁÁÁÁÁÁÁÁ
Turning accessories on and off may also have an impact on thesymptoms. They may cause a belt to resonate or slip. This test mayalso effect an accessory condition caused by a worn bearing,mounting or slipping A/C clutch.
ÁÁÁÁÁÁÁÁÁÁÁÁÁÁÁÁÁÁÁÁÁÁÁÁÁÁÁÁÁÁÁÁÁÁÁÁÁÁÁÁÁÁÁÁÁÁÁÁÁÁÁÁ
Electric cooling fans
ÁÁÁÁÁÁÁÁÁÁÁÁÁÁÁÁÁÁÁÁÁÁÁÁÁÁÁÁÁÁÁÁÁÁÁÁÁÁÁÁÁÁÁÁÁÁÁÁÁÁÁÁÁÁÁÁÁÁÁÁÁÁÁÁÁÁÁÁÁÁÁÁÁÁÁÁÁÁÁÁÁÁÁÁ
Cooling fans often require a specific temperature level to engage. Afan imbalance or runout condition may only be identified when thefan engages at that temperature.
ÁÁÁÁÁÁÁÁÁÁÁÁÁÁÁÁÁÁÁÁÁÁÁÁÁÁÁÁÁÁÁÁÁÁÁÁÁÁÁÁÁÁÁÁÁÁÁÁÁÁÁÁÁÁÁÁÁÁÁÁÁÁÁÁÁÁÁÁÁÁÁÁÁÁÁÁÁÁ
Power steering
ÁÁÁÁÁÁÁÁÁÁÁÁÁÁÁÁÁÁÁÁÁÁÁÁÁÁÁÁÁÁÁÁÁÁÁÁÁÁÁÁÁÁÁÁÁÁÁÁÁÁÁÁÁÁÁÁÁÁÁÁÁÁÁÁÁÁÁÁÁÁÁÁÁÁÁÁÁÁÁÁÁÁÁÁÁÁÁÁÁÁÁÁÁÁÁÁÁÁÁÁÁÁÁÁÁÁÁÁÁÁÁÁÁÁÁÁÁÁÁÁÁÁÁÁÁÁ
Symptoms relating to power steering may be temperature related.
These conditions may only be present with the system under load.For example: a vibrating high pressure hose caused by incorrectmounting or routing.
Additional Road TestConsiderations
www.cargeek.ir
www.cargeek.ir
NVH Diagnostic Procedures
Noise, Vibration, and Harshness - Course 472 119
Although the road test or a dynamometer is ideal, and sometimes the
only way to duplicate a customer complaint, the use of a lift or safety
stands can also be helpful for diagnosis.
In order for this technique to be safe and effective, the following
details must be considered:
• Verification of the customer complaint is very important to
determine when diagnosis without a road test will produce the
symptoms. Not all complaints can be duplicated without setting up
the same vehicle and operating conditions. For example, the ability
to apply a load to a system.
• To duplicate many driveline and suspension complaints the vehicle
has to be raised maintaining the correct operating angles.
New vibrations may occur on a lift that do not exist on the road. This is
due to the change in loading of the suspension and possible interaction
of the vehicle with the lift. The lift is now carrying the weight of the
vehicle not the tires and wheel bearings.
Balance is critical in safely operating a vehicle in a shop. Normal
vibrations may cause a vehicle to move out of position or fall.
• Operating one drive wheel while the other is stationary is a
technique used to isolate a symptom. The front wheels on a FR
vehicle or the rear wheels on a FF vehicle cannot simulate
operating movement and will not contribute to the vibrations in a
vehicle. This can be helpful if the vibration complaint that was
verified goes away.
It is important to remember that the wheel will rotate at twice the
speed indicated on the speedometer, due to the differential.
For example:
If the speedometer is indicating 40 MPH and one drive wheel is
stationary while the other is turning, then the turning wheel is
rotating at 80 MPH.
If the stationary wheel is on the ground the vehicle could move causing
severe damage. This is especially true in vehicles with limited slip
differentials.
Traction Control must be turned off on vehicles so equipped. Due to
the differential in wheel speed the system will activate.
The advantages of this type of diagnosis include:
• The ability to perform a good visual inspection while the vehicle
is operating. For example, observing runout of a wheel or tire.
• The ability to use tools such as a stethoscope or a screw driver to
amplify a vibration on specific components
AlternativeDiagnostic
Methods
NOTE
CAUTION
NOTE
www.cargeek.ir
www.cargeek.ir

Section 2
120 TOYOTA Technical Training
WORKSHEET #4ARoad Test
Vehicle Year/Prod. Date Engine Transmission
Diagnostic Description:
The road test is a diagnostic procedure designed to duplicate and manipulate the symptoms in order togain as much additional knowledge as possible. This knowledge will help identify the source of thesymptom by a process of elimination .
This worksheet is the third in the series of worksheets that is used to diagnose the conditions placed in theshop vehicles by your instructor.
Road TestProcedures
Fig. 2-23
Road Test with the NVH Analyzer Vibration Function
www.cargeek.ir
www.cargeek.ir
NVH Diagnostic Procedures
Noise, Vibration, and Harshness - Course 472 121
Instructions
1. The technician should use all the information collected during the Verification of the complaint (worksheet #1)and the Classification Flow Chart (worksheet #2) to establish a road test plan that is most likely toduplicate the symptom/s. The symptom/s can then be manipulated and measured with the NVH Analyzer.(Refer to Section 2 of the technician handbook.)
2. Consider the possible sources of the complaint from the information in step #1 and develop a strategy foranalyzing the NVH data during the road test.
3. Connect the NVH Analyzer to the vehicle, perform the road test and save the data relating to the symptoms.
4. Take notes regarding the road test procedures and results for review with the saved data.
For example:
Note if the symptom was most noticeable in a left turn on a hill. The analyzer will display MPH and RPMbut cannot tell you the additional information about the road test that you my have performed to duplicatethe symptom. With several possible saved samples you may become confused without good notes.
5. Review the data saved on all the displays using the skills developed during NVH data analysis worksheets#3A, #3B & #3C.
6. Identify the spikes on the 2d and 3d displays that are associated with the symptoms and compare theconclusions with the data on the barchart display.
7. Determine the source of the symptoms, including the order , that will be the focus for the pinpoint diagnosis .
8. Print the screens and attach with the space provided to support your conclusions.
9. Add the notes from the road test that will help identify the source of the complaint and the pinpointdiagnosis area.
10. Compare your results with the plan you formulated in step #1 and #2.
11. Remove the “bugs”, retest and compare your results. Attach screen print to the space provided.
Questions
1. List the road test procedures you plan to use to measure and duplicate the complaint.
2. What is the advantage of making the road test plan prior to performing the test?
3. What page in Section 2 did you find the details of the road test?
4. Outline the strategy you plan to use to analyze the NVH data during the road test.
www.cargeek.ir
www.cargeek.ir
Section 2
122 TOYOTA Technical Training
5. Where did you connect the data link cable to the vehicle?
6. How did you determine this location ?
7. Where did you locate the accelerometer and why?
8. List two items that are important to consider when positioning the accelerometer. Explain each.
9. How many people should be involved in a road test and why?
10. How many events should be saved and why?
11. What are two advantages of taking the printer along for the road test, if available?
12. How many large spikes are displayed on the 2d display?
www.cargeek.ir
www.cargeek.ir

NVH Diagnostic Procedures
Noise, Vibration, and Harshness - Course 472 123
13. Record the frequency and amplitude of the significant spikes on the chart below.
FIRST ORDERFreq/Ampl
SECOND ORDERFreq/Ampl
THIRD ORDERFreq/Ampl
ENGINE / / /
DRIVELINE / / /
WHEELS / / /
14. What is the incremental movements of the cursor on the:
• 62.5 Hz scale
• 125 Hz scale
• 250 Hz scale
• 500 Hz scale
15. What happens to the cursor if you hold your finger on the key?
16. On the barchart display which component sources indicate a large level of vibration/energy?
17. Manipulating the vibration during the road test can be seen best on which display? Explain.
18. Which display would show a beating symptom the best? Explain.
19. What is the next display you would look at once a beating symptom has been observed in question 18?Explain?
20. Which vibration changes frequency when different gears are selected with a constant vehicle speed ?
21. What are the advantages of the time indicator ? Explain.
www.cargeek.ir
www.cargeek.ir

Section 2
124 TOYOTA Technical Training
Conclusion
1. Based on the information used to set up the road test and the data from the NVH Analyzer, what is yourplan of action for the pinpoint diagnosis ?
2. Did you notice an improvement in the vehicle condition after the “bugs” were removed ?
3. Did the NVH Analyzer indicate an improvement? How much?
4. Upon discovering the “bugs” was your plan for pinpoint diagnosis on track ? Explain.
www.cargeek.ir
www.cargeek.ir

NVH Diagnostic Procedures
Noise, Vibration, and Harshness - Course 472 125
2D BARCHART 3D
BEFORE
ATTACHSCREEN PRINT
HERE
ATTACHSCREEN PRINT
HERE
ATTACHSCREEN PRINT
HERE
AFTER
ATTACHSCREEN PRINT
HERE
ATTACHSCREEN PRINT
HERE
ATTACHSCREEN PRINT
HERE
COMMENTS
www.cargeek.ir
www.cargeek.ir

Section 2
126 TOYOTA Technical Training
WORKSHEET #4BRoad Test
Vehicle Year/Prod. Date Engine Transmission
Diagnostic Description:
The microphone (optional) is added to the Toyota Diagnostic Tool Set to assist in diagnosing noisecomplaints . It uses the same menus, displays and key strokes as the vibration function.
This worksheet is designed to demonstrate the functions of the noise analyzer with the microphone.
Road TestProcedures
Fig. 2-24
Road Test with the NVH Analyzer Microphone Function
www.cargeek.ir
www.cargeek.ir

NVH Diagnostic Procedures
Noise, Vibration, and Harshness - Course 472 127
Instructions
1. On the same vehicle you diagnosed in worksheet #4A, connect the NVH Analyzer with the microphone andselect the NOISE function on the NVH MAIN MENU.
2. Road test the vehicle duplicating the symptom and review the data on all the displays.
3. Move the microphone around the vehicle and note any changes.
4. Save representative displays that provide the clearest view of the spikes associated with the complaint.
5. Print each display and compare them to the print outs captured in worksheet #4A. Attach screen print tothe space provided.
Questions
1. Are there any differences in the menu structures, key strokes or displays? Please list.
2. What frequency ranges are available for diagnosis?
3. How is the amplitude measured?
What are the ranges ?
4. When the microphone was moved around the vehicle did you note any significant change ?
5. What conclusions can you draw about the use of the microphone in finding the location of a noise?
6. Where is the best location for the microphone for noise diagnosis?
7. What types of noises can be diagnosed with the microphone? Explain.
www.cargeek.ir
www.cargeek.ir

Section 2
128 TOYOTA Technical Training
8. What type of noises cannot be diagnosed with the microphone? Explain.
9. How would you resolve noise complaints that are not diagnosed with the NVH Analyzer?
Where do you get the information ?
10. What are the similarities between the microphone and the accelerometer for diagnosis?
11. What principle in Section 1 of the text explains the phenomenon in question 10?
www.cargeek.ir
www.cargeek.ir

NVH Diagnostic Procedures
Noise, Vibration, and Harshness - Course 472 129
2D BARCHART 3D
BEFORE
ATTACHSCREEN PRINT
HERE
ATTACHSCREEN PRINT
HERE
ATTACHSCREEN PRINT
HERE
AFTER
ATTACHSCREEN PRINT
HERE
ATTACHSCREEN PRINT
HERE
ATTACHSCREEN PRINT
HERE
COMMENTS
www.cargeek.ir
www.cargeek.ir

Section 2
130 TOYOTA Technical Training
At this point in the diagnosis, the technician has used the following to
classify the complaint:
• Interview sheet
• Flow chart
• Road test with NVH Analyzer
The classification process has reduced a large list of possible symptoms
to just a few which fit the complaint.
The technician can now use the specific characteristics associated with
the symptom to perform the pinpoint diagnosis, which will be the
subject of the next section. (See Section 1 details on the characteristics
associated with a specific classification)
The interview sheet was used to choose the following road test from the
procedures outlined on the road test reference card:
• 40 − 60 MPH
• Cruise
The NVH Analyzer �Vibration Selection" was used during the road test
to capture the data. The technician selected the vibration function
because the complaint was described as a vibration and a noise. We
know that a noise is also a vibration which can be displayed on the tool.
(Section 1)
The displays shown were selected based on the information gathered
during the verification of the complaint.
• Barchart display shows the largest amount of energy divided
between the wheel and driveline areas, with very little energy
visible in the engine area.
• 2d display shows two large spikes in the 125 Hz frequency range.
− The default frequency band (125 Hz) clearly displays the two
spikes in question
− The default amplitude window eliminates spikes that may
normally appear in a 4Runner
− The cursor is moved over the spikes in question to display the
exact frequency and amplitude
− The F3 key is toggled to see if the engine, driveline or wheel
arrows line up with the spikes
− Two displays are captured and printed for future reference,
because at 55 MPH the 12 Hz frequency spike lines up with the
wheel arrow and the 54 Hz frequency spike line up with the
driveline arrow. This information supports the data shown on the
barchart display.
Summary
Case Study: Part III
www.cargeek.ir
www.cargeek.ir

NVH Diagnostic Procedures
Noise, Vibration, and Harshness - Course 472 131
The 3d display is consulted during the road test to follow the movement
of the largest spikes while the operator alters the symptoms observed
between 40 and 60 MPH. We verify that the spikes in question are
vehicle speed sensitive versus engine speed sensitive. When the driver
shifts the vehicle to neutral, at the point when the symptoms are most
noticeable, the spikes remained.
4Runner Scenario
Fig. 2-25
The data indicates that there are two possible conditions contributing
to the complaint. One in the area of wheels and the other in the area of
driveline.
The road test eliminated the engine as a source of the complaint and
maximized the symptoms for measuring.
The next section will deal with the pinpoint diagnosis of the steering
shimmy and the body booming in the driveline and wheel areas.
Case Study: Part IIIContinued
www.cargeek.ir
www.cargeek.ir