Embed Size (px)
Citation preview
- 159 -
Section 2 Modality of competition among regional economies – Self diagnosis makes regional
economies autonomous
<Key points>
1. The importance of regional economies
Revitalization of regional economies utilizing their unique characteristics is regarded as critical for the
following reasons: (i) a resilient economic structure needs to be developed that can achieve sustainable
development even in an economic environment made increasingly fluid by economic globalization; and (ii)
regions need to engage proactively in the formulation of regional economic policies in line with the reform of
local tax system, it is called “the Reform of the Three Major Policies,” which leaves regions to do what they
can do.
2. Trends in regional policies in Europe
Currently the EU has allocated one third of its total budget to regional policies and it is making efforts to
reduce disparities in the level of development among regions and to reduce the backwardness of lagging
regions.
Despite declining economic disparities among the European countries in terms of per capita GDP, there has
been little improvement in the economic imbalance among local regions.
With the enlargement of the EU, difficulties might arise regarding its regional policies. In order to address
them, the EU promotes regional policy programs to be more efficient as well as the Urban Pilot Programme
and others. This section will introduce three cases in which the local regions as a whole worked vigorously
toward their revitalization, and were able to find success by utilizing regional strengths, such as their culture,
environment and industry concentrations.
3. Trends in regional policies in Japan
While efforts at regional revitalization are expanding in each region, some argue that there are very few
cases in which regional revitalization strategies are constructed by referring back to the evaluation and analysis
of regional economic structures. Here, two cases are introduced where regional economies’ cyclical structures
have been analyzed based on limited statistical materials and original surveys.
The framework for regional economic analysis can be divided into: (i) regional economic cyclical analysis,
to grasp and analyze information on flows of people, goods, money, and information within and among; and
(ii) regionally-distinct asset analysis, to grasp and analyze “assets” possessed by the region in question, such as
concentrations of human resources and educational and cultural heritage. Integration of these two types of
analysis produces an overall picture of the regional economy and opens the way for formulation of
comprehensive regional strategies and policies without being bound by ideas from individual policy areas.
By utilizing the regional economic cyclical model, the characteristics of a particular region can be
- 160 -
understood in terms of economic cycles. Moreover, if this kind of analysis is conducted for each industry or
business category, it becomes possible for local governments to form an industrial policy that is specific to the
region.
1. The importance of regional economies
In Japan, the macroeconomic index shows a positive movement, and the overall economy is on the road to
recovery. At the same time, however, there are disparities among various regions, business sizes and business
types, regarding the degree of improvement in business conditions. In terms of region, regional economies are
becoming impoverished, as represented by such phenomena as the hollowing out of central urban districts. In
order to overcome this situation, new policy frameworks, such as “Special Zones for Structural Reform”1 and
“the Program for the Promotion of the Regional Revitalization”2 have been introduced. These are designed to
support each region in its efforts to revitalize its economy and create jobs, while competing with other regions
through use of wisdom and ingenuity. The revitalization of regional economies using such frameworks is
currently an important policy issue.
Revitalization of regional economies utilizing their unique characteristics is regarded as critical firstly
because of the development of economic globalization. Economic activities have rapidly expanded beyond
national boundaries. Companies have been broadening the choices of where to base their business activities,
and in so doing, the determining factors of such choices have probably been changing. In accordance with
these changes, each region needs to develop an attractive community using its unique characteristics and form
a resilient economic structure that can achieve sustainable development even within a fluid economic
environment caused by economic globalization.
The second reason that the revitalization of the regional economy is important is because of the
decentralization that is expected to be advanced as part of “the Reform of the Three Major Policies” that the
government is currently working on. In line with the principle of leaving to regions what they can do, regional
economic policies must be proactively formulated by the regions themselves, which are the “sites” that are
being directly affected.
In its situation in which transnational economic activities increased, the EU has a progressive example case
of emphasizing the uniqueness of the regional economy. The EU includes countries that promote greater
decentralization, such as Germany, and ever since the establishment of the European Economic Community
(EEC), its predecessor, the EU has always recognized regional policies as an important policy issue necessary
for the smooth integration of economies. Thus far, various regional policies, for instance, the “Structural Fund,”
have been implemented. In keeping with the experience of the fund, as well as the new trends in the economy,
the EU is beginning to seek to design the appropriate monitoring and evaluation methodology and improve 1 See the Headquarters for the Promotion of Special Zones for Structural Reform website for details (http://www.kantei.go.jp/foreign/policy/kouzou2/index_e.html). 2 See the Prime Minister of Japan and His Cabinet website for details of Headquarters for the Regional Revitalization (http://www.kantei.go.jp/foreign/koizumiphoto/2004/02/27chiiki_e.html).
- 161 -
efficiency in regional policies, in order to realize sustainable economic development.
In this section, we introduce firstly an overview of the experiences and recent trends found in the EU’s
regional policies. While drawing upon such information, the future direction of Japan’s regional economic
policy will be discussed, with an emphasis on the establishment of analytical and evaluation methods of its
regional economies.
2. Trends in regional policies in Europe
(1) Overview of the regional policies in the EU
Currently, the EU has allocated one-third of its budget to regional polices and aims to reduce disparities
between the levels of development of various regions and to reduce the backwardness of the least favored
regions. This is because as competition intensifies in the internal market, lower-income regions could lag
behind even further, causing greater regional disparities.
In order to deal with this situation, the EU set up two measures—the Structural Fund and the Cohesion
Fund—as ways to implement its regional policies. These funds are to spend 196 billion euros (value in 1999)
and 19 billion euros (value in 1999) respectively over the term of 2000 to 2006.3 For the Structural Fund,
approximately 70 percent of the budget is used to aid underdeveloped regions, approximately 11.5 percent for
economic and social conversion in areas experiencing structural difficulties, and approximately 12.3 percent for
modernization of training systems and the creation of employment.4 The Cohesion Fund is not allocated
according to the above objectives of the Structural Fund, but goes toward specific projects relating to
environmental and transport infrastructures in the four countries of Greece, Spain, Ireland and Portugal. Aside
from the financing provided by these two funds, the EU has other instruments for the development of countries
that have applied for EU membership, such as Romania, to cope with the enlargement to include several central
and eastern countries.
(2) Trend in regional disparities within the EU
Since the establishment of its predecessor, the EEC, the EU has recognized the reduction of regional
disparities as an important policy issue, and has put forth various types of efforts toward this goal. As a result, it
is confirmed that progress has been made in the reduction of imbalances among countries. However, when
comparing smaller units, as in among regions, it has been pointed out that the disparities have not been reduced
by much.
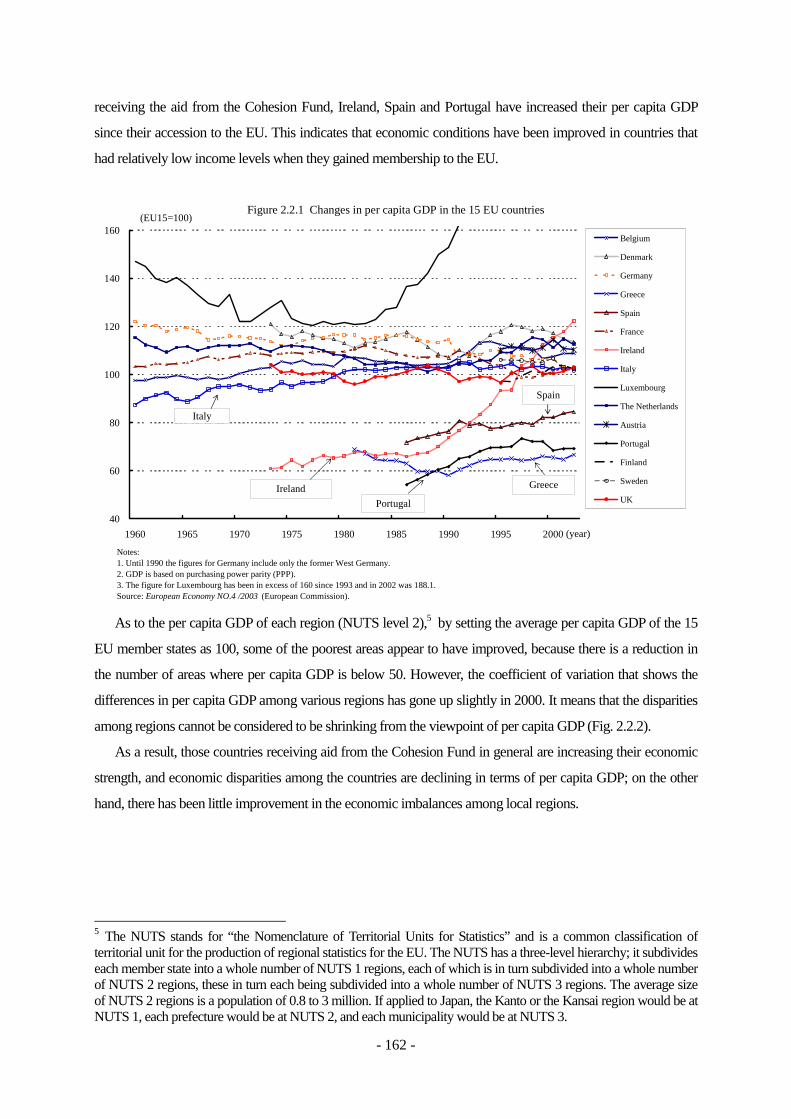
When comparing the changes in per capita GDP among member states in Figure 2.2.1, of those countries
3 EU Regional Policy Directorate-General website (http://europa.eu.int/comm/regional_policy/index_en.htm). 4 The programs are, as a rule, cofinanced by the EU and member states. The contents of the programs are decided not by the EU, but by the member states (the relevant agency of the central or regional government). In some exceptional cases, the EU takes the initiative in implementing programs, such as: (i) cross-border, transnational or interregional cooperation; (ii) regeneration of urban areas in crisis; (iii) rural development through innovative local projects; and (iv) combating discrimination and inequities in connection with labor. The total budget for the four projects was small, at 5.35 percent of the Structural Fund.
- 162 -
receiving the aid from the Cohesion Fund, Ireland, Spain and Portugal have increased their per capita GDP
since their accession to the EU. This indicates that economic conditions have been improved in countries that
had relatively low income levels when they gained membership to the EU.
Figure 2.2.1 Changes in per capita GDP in the 15 EU countries
40
60
80
100
120
140
160
1960 1965 1970 1975 1980 1985 1990 1995 2000
Belgium
Denmark
Germany
Greece
Spain
France
Ireland
Italy
Luxembourg
The Netherlands
Austria
Portugal
Finland
Sweden
UK
Notes:1. Until 1990 the figures for Germany include only the former West Germany.2. GDP is based on purchasing power parity (PPP).3. The figure for Luxembourg has been in excess of 160 since 1993 and in 2002 was 188.1.Source: European Economy NO.4 /2003 (European Commission).
(EU15=100)
Italy
PortugalIreland Greece
Spain
(year)
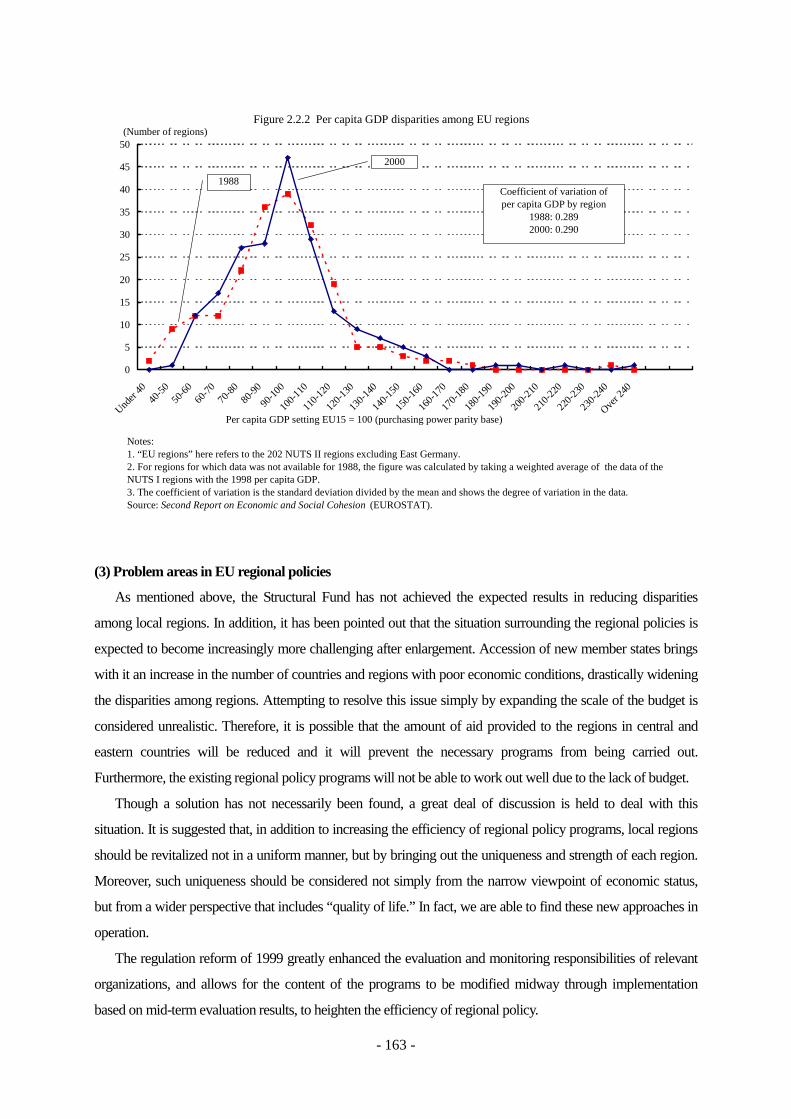
As to the per capita GDP of each region (NUTS level 2),5 by setting the average per capita GDP of the 15
EU member states as 100, some of the poorest areas appear to have improved, because there is a reduction in
the number of areas where per capita GDP is below 50. However, the coefficient of variation that shows the
differences in per capita GDP among various regions has gone up slightly in 2000. It means that the disparities
among regions cannot be considered to be shrinking from the viewpoint of per capita GDP (Fig. 2.2.2).
As a result, those countries receiving aid from the Cohesion Fund in general are increasing their economic
strength, and economic disparities among the countries are declining in terms of per capita GDP; on the other
hand, there has been little improvement in the economic imbalances among local regions.
5 The NUTS stands for “the Nomenclature of Territorial Units for Statistics” and is a common classification of territorial unit for the production of regional statistics for the EU. The NUTS has a three-level hierarchy; it subdivides each member state into a whole number of NUTS 1 regions, each of which is in turn subdivided into a whole number of NUTS 2 regions, these in turn each being subdivided into a whole number of NUTS 3 regions. The average size of NUTS 2 regions is a population of 0.8 to 3 million. If applied to Japan, the Kanto or the Kansai region would be at NUTS 1, each prefecture would be at NUTS 2, and each municipality would be at NUTS 3.
- 163 -
Figure 2.2.2 Per capita GDP disparities among EU regions
0
5
10
15
20
25
30
35
40
45
50
Under
4040
-5050
-6060
-7070
-8080
-90
90-10
0
100-1
10
110-1
20
120-1
30
130-1
40
140-1
50
150-1
60
160-1
70
170-1
80
180-1
90
190-2
00
200-2
10
210-2
20
220-2
30
230-2
40
Over 2
40
(Number of regions)
Per capita GDP setting EU15 = 100 (purchasing power parity base)
Notes:1. “EU regions” here refers to the 202 NUTS II regions excluding East Germany.2. For regions for which data was not available for 1988, the figure was calculated by taking a weighted average of the data of theNUTS I regions with the 1998 per capita GDP.3. The coefficient of variation is the standard deviation divided by the mean and shows the degree of variation in the data.Source: Second Report on Economic and Social Cohesion (EUROSTAT).
2000
1988Coefficient of variation ofper capita GDP by region
1988: 0.2892000: 0.290
(3) Problem areas in EU regional policies
As mentioned above, the Structural Fund has not achieved the expected results in reducing disparities
among local regions. In addition, it has been pointed out that the situation surrounding the regional policies is
expected to become increasingly more challenging after enlargement. Accession of new member states brings
with it an increase in the number of countries and regions with poor economic conditions, drastically widening
the disparities among regions. Attempting to resolve this issue simply by expanding the scale of the budget is
considered unrealistic. Therefore, it is possible that the amount of aid provided to the regions in central and
eastern countries will be reduced and it will prevent the necessary programs from being carried out.
Furthermore, the existing regional policy programs will not be able to work out well due to the lack of budget.
Though a solution has not necessarily been found, a great deal of discussion is held to deal with this
situation. It is suggested that, in addition to increasing the efficiency of regional policy programs, local regions
should be revitalized not in a uniform manner, but by bringing out the uniqueness and strength of each region.
Moreover, such uniqueness should be considered not simply from the narrow viewpoint of economic status,
but from a wider perspective that includes “quality of life.” In fact, we are able to find these new approaches in
operation.
The regulation reform of 1999 greatly enhanced the evaluation and monitoring responsibilities of relevant
organizations, and allows for the content of the programs to be modified midway through implementation
based on mid-term evaluation results, to heighten the efficiency of regional policy.
- 164 -
In addition to such amendment of regulations, an innovative instrument called the Urban Pilot Programme
(UPP)6 was also founded as part of the EU’s regional policies. While most of the Structural Fund is allocated
by country and each central government can decide how much it distributes to a municipal authority in the
country, the UPP II did not have such a quota system by country, therefore, each local government was able to
apply for this financial aid directly to the EU on its own initiative. The amount provided by the UPP II was
small, but it could be considered a progressive endeavor since it made use of the unique characteristics and
strengths of each region. It is important to identify its own strengths at the regional level, when formulating a
regional policy program. However, very few regions have actually been able to do this, because a local region
finds it difficult to identify its own unique points. Even so, it is the local government and the people who live in
that region that can resolve this problem. Thus, the crucial thing is to work toward the revitalization of their
own area by thinking deeply and exchanging ideas with one another.
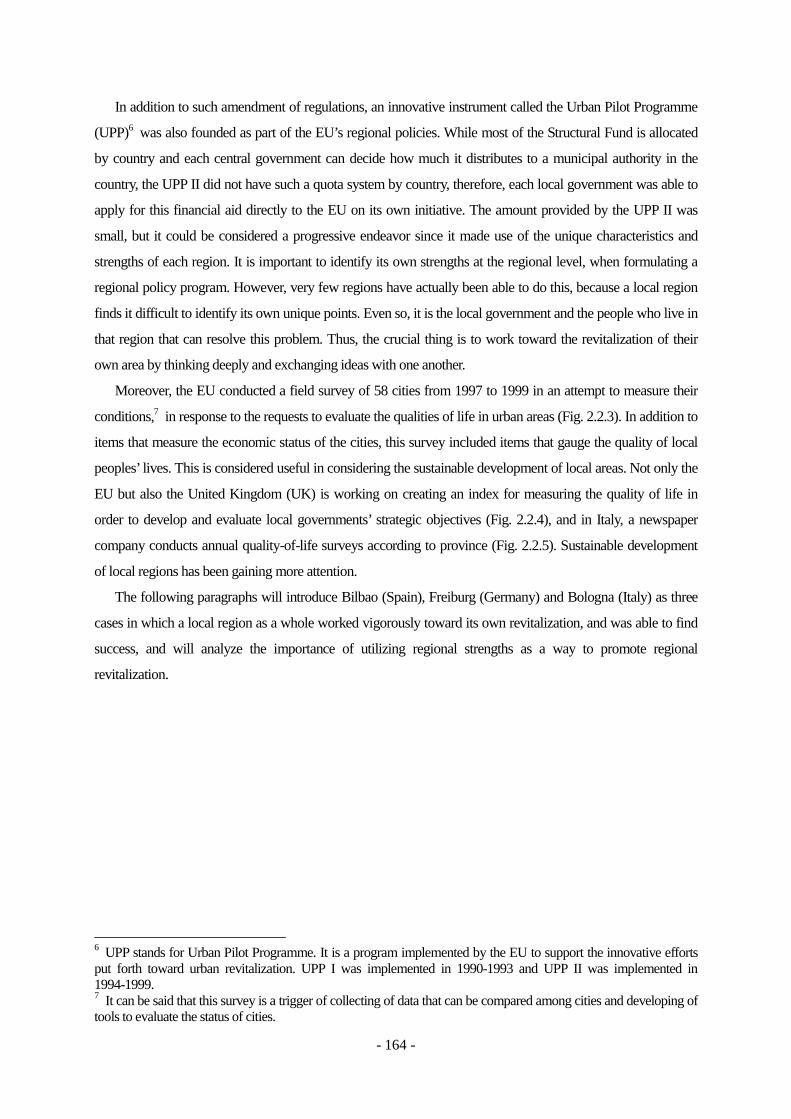
Moreover, the EU conducted a field survey of 58 cities from 1997 to 1999 in an attempt to measure their
conditions,7 in response to the requests to evaluate the qualities of life in urban areas (Fig. 2.2.3). In addition to
items that measure the economic status of the cities, this survey included items that gauge the quality of local
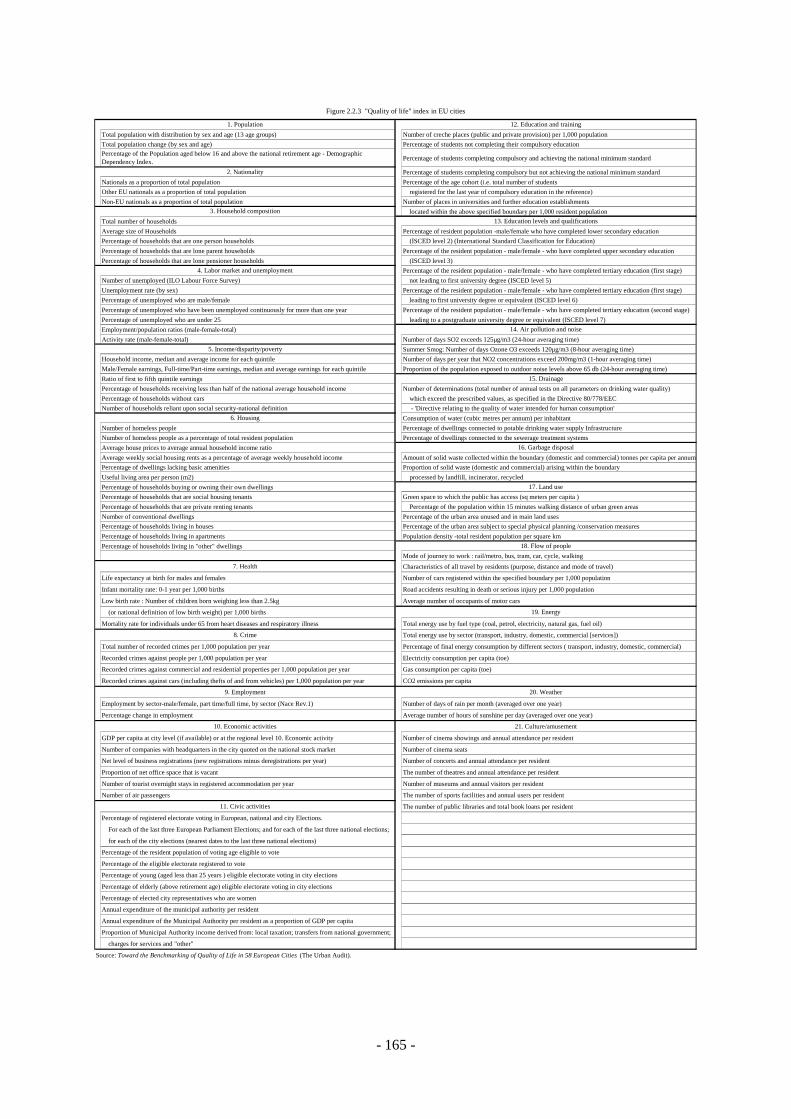
peoples’ lives. This is considered useful in considering the sustainable development of local areas. Not only the
EU but also the United Kingdom (UK) is working on creating an index for measuring the quality of life in
order to develop and evaluate local governments’ strategic objectives (Fig. 2.2.4), and in Italy, a newspaper
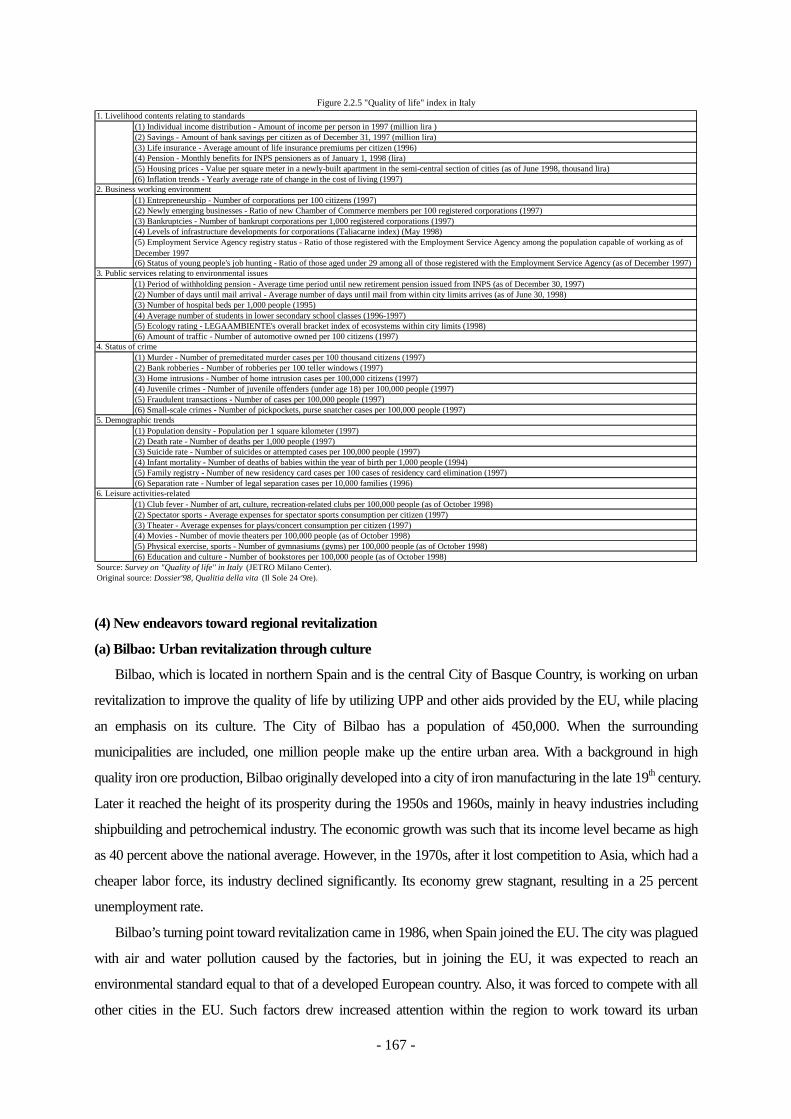
company conducts annual quality-of-life surveys according to province (Fig. 2.2.5). Sustainable development
of local regions has been gaining more attention.
The following paragraphs will introduce Bilbao (Spain), Freiburg (Germany) and Bologna (Italy) as three
cases in which a local region as a whole worked vigorously toward its own revitalization, and was able to find
success, and will analyze the importance of utilizing regional strengths as a way to promote regional
revitalization.
6 UPP stands for Urban Pilot Programme. It is a program implemented by the EU to support the innovative efforts put forth toward urban revitalization. UPP I was implemented in 1990-1993 and UPP II was implemented in 1994-1999. 7 It can be said that this survey is a trigger of collecting of data that can be compared among cities and developing of tools to evaluate the status of cities.
- 165 -
Total population with distribution by sex and age (13 age groups) Number of creche places (public and private provision) per 1,000 populationTotal population change (by sex and age) Percentage of students not completing their compulsory educationPercentage of the Population aged below 16 and above the national retirement age - DemographicDependency Index. Percentage of students completing compulsory and achieving the national minimum standard
Percentage of students completing compulsory but not achieving the national minimum standardNationals as a proportion of total population Percentage of the age cohort (i.e. total number of students Other EU nationals as a proportion of total population registered for the last year of compulsory education in the reference)Non-EU nationals as a proportion of total population Number of places in universities and further education establishments
located within the above specified boundary per 1,000 resident populationTotal number of householdsAverage size of Households Percentage of resident population -male/female who have completed lower secondary education Percentage of households that are one person households (ISCED level 2) (International Standard Classification for Education)Percentage of households that are lone parent households Percentage of the resident population - male/female - who have completed upper secondary education Percentage of households that are lone pensioner households (ISCED level 3)
Percentage of the resident population - male/female - who have completed tertiary education (first stage) Number of unemployed (ILO Labour Force Survey) not leading to first university degree (ISCED level 5)Unemployment rate (by sex) Percentage of the resident population - male/female - who have completed tertiary education (first stage) Percentage of unemployed who are male/female leading to first university degree or equivalent (ISCED level 6)Percentage of unemployed who have been unemployed continuously for more than one year Percentage of the resident population - male/female - who have completed tertiary education (second stage)Percentage of unemployed who are under 25 leading to a postgraduate university degree or equivalent (ISCED level 7)Employment/population ratios (male-female-total)Activity rate (male-female-total) Number of days SO2 exceeds 125µg/m3 (24-hour averaging time)
Summer Smog: Number of days Ozone O3 exceeds 120µg/m3 (8-hour averaging time)Household income, median and average income for each quintile Number of days per year that NO2 concentrations exceed 200mg/m3 (1-hour averaging time)Male/Female earnings, Full-time/Part-time earnings, median and average earnings for each quintile Proportion of the population exposed to outdoor noise levels above 65 db (24-hour averaging time)Ratio of first to fifth quintile earningsPercentage of households receiving less than half of the national average household income Number of determinations (total number of annual tests on all parameters on drinking water quality) Percentage of households without cars which exceed the prescribed values, as specified in the Directive 80/778/EEC Number of households reliant upon social security-national definition - 'Directive relating to the quality of water intended for human consumption'
Consumption of water (cubic metres per annum) per inhabitantNumber of homeless people Percentage of dwellings connected to potable drinking water supply InfrastructureNumber of homeless people as a percentage of total resident population Percentage of dwellings connected to the sewerage treatment systemsAverage house prices to average annual household income ratioAverage weekly social housing rents as a percentage of average weekly household income Amount of solid waste collected within the boundary (domestic and commercial) tonnes per capita per annumPercentage of dwellings lacking basic amenities Proportion of solid waste (domestic and commercial) arising within the boundary Useful living area per person (m2) processed by landfill, incinerator, recycledPercentage of households buying or owning their own dwellingsPercentage of households that are social housing tenants Green space to which the public has access (sq meters per capita ) Percentage of households that are private renting tenants Percentage of the population within 15 minutes walking distance of urban green areasNumber of conventional dwellings Percentage of the urban area unused and in main land usesPercentage of households living in houses Percentage of the urban area subject to special physical planning /conservation measuresPercentage of households living in apartments Population density -total resident population per square kmPercentage of households living in "other" dwellings
Mode of journey to work : rail/metro, bus, tram, car, cycle, walkingCharacteristics of all travel by residents (purpose, distance and mode of travel)
Life expectancy at birth for males and females Number of cars registered within the specified boundary per 1,000 population
Infant mortality rate: 0-1 year per 1,000 births Road accidents resulting in death or serious injury per 1,000 population
Low birth rate : Number of children born weighing less than 2.5kg Average number of occupants of motor cars
(or national definition of low birth weight) per 1,000 births
Mortality rate for individuals under 65 from heart diseases and respiratory illness Total energy use by fuel type (coal, petrol, electricity, natural gas, fuel oil)
Total energy use by sector (transport, industry, domestic, commercial [services])
Total number of recorded crimes per 1,000 population per year Percentage of final energy consumption by different sectors ( transport, industry, domestic, commercial)
Recorded crimes against people per 1,000 population per year Electricity consumption per capita (toe)
Recorded crimes against commercial and residential properties per 1,000 population per year Gas consumption per capita (toe)
Recorded crimes against cars (including thefts of and from vehicles) per 1,000 population per year CO2 emissions per capita
Employment by sector-male/female, part time/full time, by sector (Nace Rev.1) Number of days of rain per month (averaged over one year)
Percentage change in employment Average number of hours of sunshine per day (averaged over one year)
GDP per capita at city level (if available) or at the regional level 10. Economic activity Number of cinema showings and annual attendance per resident
Number of companies with headquarters in the city quoted on the national stock market Number of cinema seats
Net level of business registrations (new registrations minus deregistrations per year) Number of concerts and annual attendance per resident
Proportion of net office space that is vacant The number of theatres and annual attendance per resident
Number of tourist overnight stays in registered accommodation per year Number of museums and annual visitors per resident
Number of air passengers The number of sports facilities and annual users per resident
The number of public libraries and total book loans per resident
Percentage of registered electorate voting in European, national and city Elections.
For each of the last three European Parliament Elections; and for each of the last three national elections;
for each of the city elections (nearest dates to the last three national elections)
Percentage of the resident population of voting age eligible to vote
Percentage of the eligible electorate registered to vote
Percentage of young (aged less than 25 years ) eligible electorate voting in city elections
Percentage of elderly (above retirement age) eligible electorate voting in city elections
Percentage of elected city representatives who are women
Annual expenditure of the municipal authority per resident
Annual expenditure of the Municipal Authority per resident as a proportion of GDP per capita
Proportion of Municipal Authority income derived from: local taxation; transfers from national government;
charges for services and "other"
Source: Toward the Benchmarking of Quality of Life in 58 European Cities (The Urban Audit).
11. Civic activities
5. Income/disparity/poverty
6. Housing
Figure 2.2.3 "Quality of life" index in EU cities
12. Education and training
10. Economic activities
7. Health
8. Crime
9. Employment
3. Household composition
4. Labor market and unemployment
1. Population
2. Nationality
21. Culture/amusement
17. Land use
18. Flow of people
19. Energy
20. Weather
13. Education levels and qualifications
14. Air pollution and noise
15. Drainage
16. Garbage disposal
- 166 -
Economy 1 Proportion of people of working age in employment2 Proportion of people claiming unemployment benefit who have been out of work for more than a year3 Proportion of young people (18-24 year olds) in full-time education or employment4 Percentage increase or decrease in the total number of VAT registered businesses in the area5 Percentage increase or decrease in the number of local jobs
Society 6 Proportion of the population who live in wards that rank within the most deprived 10 percent and/or 25percent of wards in the country7 Percentage of population of working age who are claiming key benefits8 Proportion of children under 16 who live in low income9 a) Number of 19 year olds with Level 2 qualifications (i.e., 5 GCSEs A–C or NVQ equivalent) b) Percentage of 15 year old pupils in schools maintained by the local authority achieving 5 or moreGCSEs at grades A*-C or equivalent10 Death rate by cause (standardised mortality rate per 100,000 population in the following categories): - Cancer in under 75s - Circulatory diseases in under 75s - Suicide and undetermined injury - all ages - All accidents - all ages11 Infant mortality (number of deaths of infants under a year old and number of stillbirths - per 1,000 livebirths)12 Number of conceptions among girls aged less than 18 years13 Affordable housing (house price/earnings affordability ration)14 Number of unfit homes per 1,000 dwellings15 (a) Percentage of residents surveyed who feel 'fairly safe' or 'very safe' after dark whilst outside in thelocal authority area (b) Percentage of residents surveyed who feel 'fairly safe' or 'very safe' during the day whilst outside inthe local authority area16 Crimes committed per 1,000 households: - Domestic burglaries - Violent offences - Vehicle crimes17 Percentage of residents surveyed concerned with different types of noise in their area18 Percentage of residents surveyed satisfied with their local area as a place to live19 Percentage of residents surveyed who consider their local area is getting worse20 Number of childcare places per 1,000 population aged 0-5 not in early education21 Facilities for young people indicator(s)22 (a) Percentage of residents surveyed finding it easy to access key local services (b) Actual distance to key local services
Society (Participation towards regions) 23 Community involvement indicator(s)Environment 24 Air quality indicator
25 Climate change indicator26 Percentage of main rivers and canals rated as good or fair quality27 Household energy use (gas and electricity) per household28 Water leakage rate from main and customer pipes29 Percentage of the total tonnage of household waste arisings which have been - recycled - composted - used to recover heat, power and other energy sources - landfilled30 (a) Proportion of land stock that is derelict (b) Percentage of new housing development on previously developed land31 Percentage of highways that are either of a high or acceptable standard of cleanliness32 Annual average traffic flow per 1,000km of principal roads33 Percentage of residents surveyed who used different modes of transport, their reasons for, and distanceof, travel34 Percentage of children traveling to (a) primary school, and (b) secondary school by different modes35 The area of land designated as a Site of Special Scientific Interest (SSSI) and which is in "favourablecondition" - Number and hectares of land designated as a SSSI in a local authority area - Percentage of assessed area in favourable and unfavorable recovering condition, within SSSIs - Area of Local Nature Reserve per 1,000 population (ha) - Local species count, for example, wild birds, amphibians, water voles, etc.
Source: Quality of Life Indicators Pilot 2001/02 (Audit Commission).
Figure 2.2.4 "Quality of life" index in the UK
- 167 -
(1) Individual income distribution - Amount of income per person in 1997 (million lira )(2) Savings - Amount of bank savings per citizen as of December 31, 1997 (million lira)(3) Life insurance - Average amount of life insurance premiums per citizen (1996)(4) Pension - Monthly benefits for INPS pensioners as of January 1, 1998 (lira)(5) Housing prices - Value per square meter in a newly-built apartment in the semi-central section of cities (as of June 1998, thousand lira)(6) Inflation trends - Yearly average rate of change in the cost of living (1997)
(1) Entrepreneurship - Number of corporations per 100 citizens (1997)(2) Newly emerging businesses - Ratio of new Chamber of Commerce members per 100 registered corporations (1997)(3) Bankruptcies - Number of bankrupt corporations per 1,000 registered corporations (1997)(4) Levels of infrastructure developments for corporations (Taliacarne index) (May 1998)(5) Employment Service Agency registry status - Ratio of those registered with the Employment Service Agency among the population capable of working as ofDecember 1997(6) Status of young people's job hunting - Ratio of those aged under 29 among all of those registered with the Employment Service Agency (as of December 1997)
(1) Period of withholding pension - Average time period until new retirement pension issued from INPS (as of December 30, 1997)(2) Number of days until mail arrival - Average number of days until mail from within city limits arrives (as of June 30, 1998)(3) Number of hospital beds per 1,000 people (1995)(4) Average number of students in lower secondary school classes (1996-1997)(5) Ecology rating - LEGAAMBIENTE's overall bracket index of ecosystems within city limits (1998)(6) Amount of traffic - Number of automotive owned per 100 citizens (1997)
(1) Murder - Number of premeditated murder cases per 100 thousand citizens (1997)(2) Bank robberies - Number of robberies per 100 teller windows (1997)(3) Home intrusions - Number of home intrusion cases per 100,000 citizens (1997)(4) Juvenile crimes - Number of juvenile offenders (under age 18) per 100,000 people (1997)(5) Fraudulent transactions - Number of cases per 100,000 people (1997)(6) Small-scale crimes - Number of pickpockets, purse snatcher cases per 100,000 people (1997)
(1) Population density - Population per 1 square kilometer (1997)(2) Death rate - Number of deaths per 1,000 people (1997)(3) Suicide rate - Number of suicides or attempted cases per 100,000 people (1997)(4) Infant mortality - Number of deaths of babies within the year of birth per 1,000 people (1994)(5) Family registry - Number of new residency card cases per 100 cases of residency card elimination (1997)(6) Separation rate - Number of legal separation cases per 10,000 families (1996)
(1) Club fever - Number of art, culture, recreation-related clubs per 100,000 people (as of October 1998)(2) Spectator sports - Average expenses for spectator sports consumption per citizen (1997)(3) Theater - Average expenses for plays/concert consumption per citizen (1997)(4) Movies - Number of movie theaters per 100,000 people (as of October 1998)(5) Physical exercise, sports - Number of gymnasiums (gyms) per 100,000 people (as of October 1998)(6) Education and culture - Number of bookstores per 100,000 people (as of October 1998)
Source: Survey on "Quality of life" in Italy (JETRO Milano Center).Original source: Dossier'98, Qualitia della vita (Il Sole 24 Ore).
4. Status of crime
5. Demographic trends
6. Leisure activities-related
Figure 2.2.5 "Quality of life" index in Italy
2. Business working environment
1. Livelihood contents relating to standards
3. Public services relating to environmental issues
(4) New endeavors toward regional revitalization
(a) Bilbao: Urban revitalization through culture
Bilbao, which is located in northern Spain and is the central City of Basque Country, is working on urban
revitalization to improve the quality of life by utilizing UPP and other aids provided by the EU, while placing
an emphasis on its culture. The City of Bilbao has a population of 450,000. When the surrounding
municipalities are included, one million people make up the entire urban area. With a background in high
quality iron ore production, Bilbao originally developed into a city of iron manufacturing in the late 19th century.
Later it reached the height of its prosperity during the 1950s and 1960s, mainly in heavy industries including
shipbuilding and petrochemical industry. The economic growth was such that its income level became as high
as 40 percent above the national average. However, in the 1970s, after it lost competition to Asia, which had a
cheaper labor force, its industry declined significantly. Its economy grew stagnant, resulting in a 25 percent
unemployment rate.
Bilbao’s turning point toward revitalization came in 1986, when Spain joined the EU. The city was plagued
with air and water pollution caused by the factories, but in joining the EU, it was expected to reach an
environmental standard equal to that of a developed European country. Also, it was forced to compete with all
other cities in the EU. Such factors drew increased attention within the region to work toward its urban
- 168 -
revitalization.
The revitalization of Bilbao was based on a strategic concept that Basque Country and the City of Bilbao
formulated in cooperation in 1989. This concept focuses on substantiating quality of life, while aiming to
improve the environment and competitiveness of the city through efforts put forth jointly by the public and
private sectors. The redevelopment project was headed by “BilbaoRia 2000,” a public corporation in which
half was funded by the central government of Spain and the other by the Basque Country and other regional
governments. At the same time, “Bilbao Metropoli-30” was organized by over 100 entities, such as private
corporations, universities, the Basque Country, Bizkaia province, 29 surrounding cities including Bilbao, and
non-profit organizations (NPO). They all worked on solving problems by taking local opinions into
consideration with the following four steps: (i) extracting the problems Bilbao had, (ii) analyzing the problems,
(iii) drawing up revitalization strategies, and (iv) implementing the strategies.
This area, which had been troubled with environmental pollution, placed its focus on culture to promote
urban revitalization aiming at improving the quality of life. Bilbao’s most remarkable project was the
construction of the Guggenheim Museum in 1997. While there was local controversy over the building of such
an expensive museum that cost 13 billion yen, it received 1.3 million visitors in 1998 as its unique appearance
attracted much attention, contributing greatly to the increase of tourists and the revitalization of the city. An
international conference hall, in which opera performances and concerts are held, was also opened in 2000.
Now, the City of Bilbao is becoming recognized as the hub of the cultural industry.
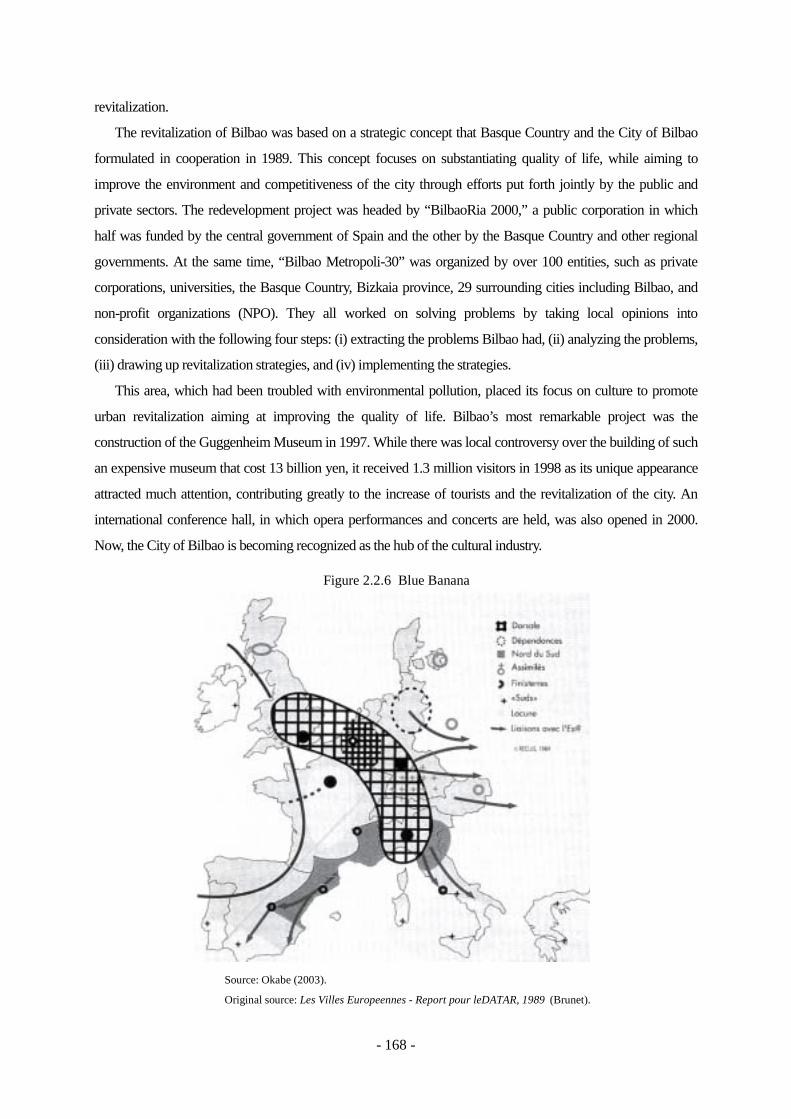
Source: Okabe (2003).
Original source: Les Villes Europeennes - Report pour leDATAR, 1989 (Brunet).
Figure 2.2.6 Blue Banana
- 169 -
A report compiled in 1989 by a regional development research agency in France also acted as a catalyst for
the revitalization. In this report, Europe was geographically separated into three zones as shown in Figure 2.2.6.
The first zone is the area with the most vitality, known as the “Blue Banana.” The second zone is the
“Mediterranean Arc,” which has strong potentials for economic development. While Bilbao was not included
in either zone, this inspired the city to take advantage of the fact that it is located at the heart of the third zone,
the “Atlantic Axis.” It decided to work toward becoming the capital of the Atlantic Axis by switching its main
industry from manufacturing to service. Under this idea, a guideline for the regional development of the
Basque Country was compiled in conjunction with its urban revitalization, which was made possible through
the construction of the Guggenheim Museum. As a result, the Basque Country has succeeded in promoting a
fresh image of itself as being “the core region of the Atlantic Axis.”8
Combined with the above efforts, the City of Bilbao also received aid from the EU’s Structural Fund. The
La Vieja district of Bilbao became a target region of UPP, which the EU established as a regional policy
program to resolve urban problems, and it was provided financial support from the Structural Fund from 1990
to 1993. Utilizing such assistance, La Vieja district developed its impoverished inner city to become the hub for
artistic activity by such means as building cultural and art centers, and inviting young artists from within the
country and abroad to live there. Although the funding ended in the first half of the 1990s, the city played a
central role in continuing the development work within this district. Besides the La Vieja district, the
Otxarkoaga district within the City of Bilbao also became a target area for UPP. Also, the City of Barakaldo,
which borders the City of Bilbao and is located within Bilbao’s urban area, was chosen as a district to receive
the aid of URBAN.9
Although the financial aid from the EU was not necessarily sufficient, having been selected as target areas
encouraged those regions in heightening their determination to work toward their own revitalization.
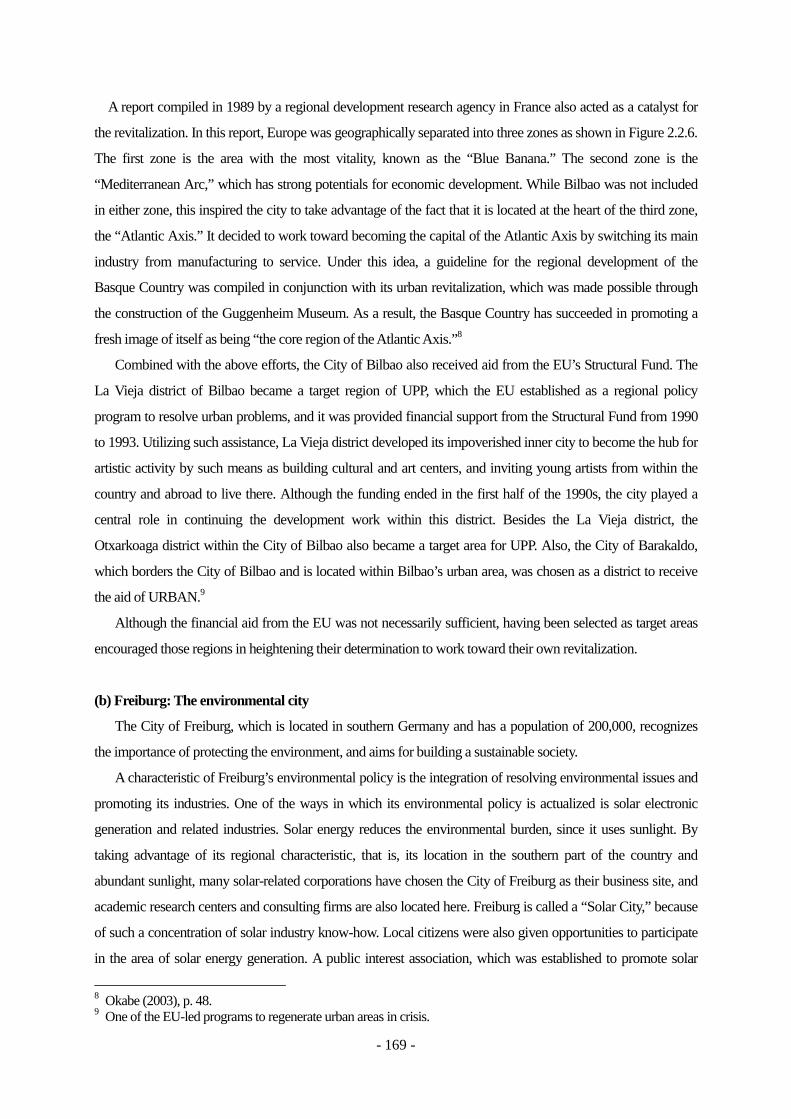
(b) Freiburg: The environmental city
The City of Freiburg, which is located in southern Germany and has a population of 200,000, recognizes
the importance of protecting the environment, and aims for building a sustainable society.
A characteristic of Freiburg’s environmental policy is the integration of resolving environmental issues and
promoting its industries. One of the ways in which its environmental policy is actualized is solar electronic
generation and related industries. Solar energy reduces the environmental burden, since it uses sunlight. By
taking advantage of its regional characteristic, that is, its location in the southern part of the country and
abundant sunlight, many solar-related corporations have chosen the City of Freiburg as their business site, and
academic research centers and consulting firms are also located here. Freiburg is called a “Solar City,” because
of such a concentration of solar industry know-how. Local citizens were also given opportunities to participate
in the area of solar energy generation. A public interest association, which was established to promote solar
8 Okabe (2003), p. 48. 9 One of the EU-led programs to regenerate urban areas in crisis.

- 170 -
energy generation, seeks out companies that provide their roof spaces of buildings free of charge and sets up
solar energy generation devices on them. Ownership of the roof spaces is divided and sold to local citizens. The
electricity that is generated on the roofs is bought up by a state-run energy supply company, and the citizens
who have ownership receive a dividend according to the amount of electricity sold. Although the citizens do
not enjoy high profitability, they become interested in environmental policies and it increasingly encourages
their participation. The city government has been working to boost the solar energy industry while keeping
with environmental protection, for example, providing advice and guidance on the above-mentioned power
purchases and furnishing the devices, and developing the low-interest loans system to promote the construction
of houses that are equipped with solar energy generation devices.
Policies developed by the German government also encourage these trends found in Freiburg. The entire
country of Germany works on increasing the ratio of recyclable energy. The “Renewable Energy Law” was
enacted in 2000, which requires electrical power business owners to buy renewable energy. Furthermore, under
the “100,000 Solar Panel Roof Program,” the German government promotes the installation of solar power
generation devices through low-interest loans and other measures. In another respect, Freiburg intends to
develop the foundation of solar energy industry as early as possible and form a cluster, so that it can capture a
large share of the market in an advantageous manner, in case the demand heightens in the future.
Aside from solar energy generation, in proceeding urban development policy relating to civilians’ lives, the
City of Freiburg takes into account sustainability. It restricts automobiles being driven into the city, and
develops the tram system. In order to encourage the use of these trams, it sells commuter passes to citizens at
low prices. Also, the use of disposable containers is restricted and the separation of trash is made thorough,
while at the same time, a cogeneration system is developed to make use of the gas produced at waste treatment
plants.
The environmental policies adopted by the City for Freiburg have been highly regarded, and the city was
selected in 1992 as “the environmental capital” of Germany. Many specialized academic agencies,
environmental federations, civic groups and non-governmental organizations (NGO) are located in Freiburg,
and are advancing their environmental efforts while together building networks. The way in which the citizens,
business organizations and the city government each take their own initiative in promoting the environmental
policies further heightens the acclaim of the city as “the environmental capital.”
(c) Bologna: The Third Italy
The central part of Italy has been achieving development based on industrial clusters utilizing indigenous
enterprises known as “the Third Italy.” However, looking back on after the Second World War, the industries in
Italy developed in its northern region (the First Italy), which is represented by Milan, Torino and Genova. At
the same time, in the southern region (the Second Italy) where development lagged behind, the government
built steel-chemical complexes and a heavy industrial area under its active development plan. Since these two
regions depended heavily on imports for primary commodities, the oil shock of the 1970s inflicted a severe
- 171 -
blow on them. Moreover these regions failed to keep up with various changes in the competitive environment,
such as diversification in consumer tastes and a shift to high-mix low-volume production, their economy
gradually grew stagnant.
As these regions began to stall in such ways, the economic development in the central region (the Third
Italy) has attracted attention. At the center of the Third Italy, Bologna, the capital city of Emilia-Romagna, is
dubbed the “Packaging Valley.” There is a cluster of machinery industry comprised mainly of packaging
machinery manufacturers, including an enterprise that accounts for roughly 70 percent of the global share in
packaging machinery for tea bags. Besides Bologna, many other production regions exist within the Third Italy,
including Carpi (knitwear) and Prato (woolen textiles). These vigorous industrial activities in the Third Italy are
largely due to its uniqueness of industrial structure. In other words, the region as a whole is able to maintain its
competitiveness by having various companies possess distinct specializations and carry out production by
formulating regional networks through skilled engineers that can meet the high demands of customers. Based
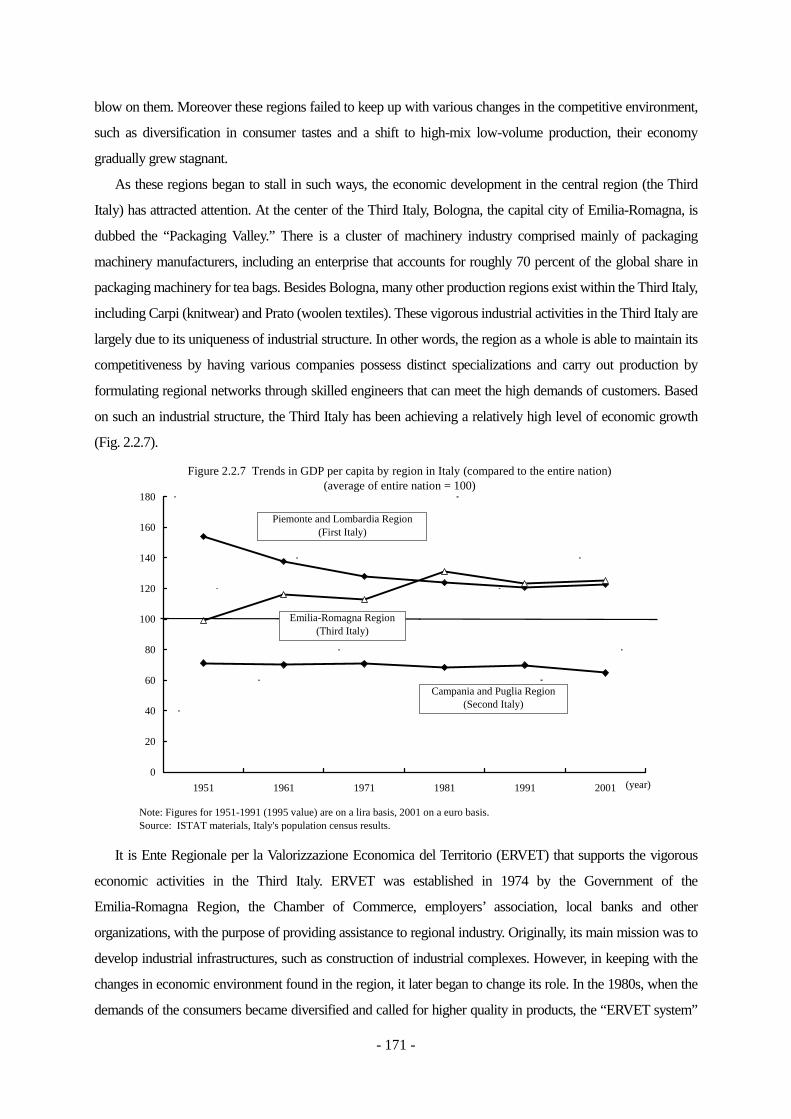
on such an industrial structure, the Third Italy has been achieving a relatively high level of economic growth
(Fig. 2.2.7).
0
20
40
60
80
100
120
140
160
180
1951 1961 1971 1981 1991 2001
Figure 2.2.7 Trends in GDP per capita by region in Italy (compared to the entire nation)(average of entire nation = 100)
Piemonte and Lombardia Region(First Italy)
Note: Figures for 1951-1991 (1995 value) are on a lira basis, 2001 on a euro basis.Source: ISTAT materials, Italy's population census results.
Campania and Puglia Region(Second Italy)
Emilia-Romagna Region(Third Italy)
(year)
It is Ente Regionale per la Valorizzazione Economica del Territorio (ERVET) that supports the vigorous
economic activities in the Third Italy. ERVET was established in 1974 by the Government of the
Emilia-Romagna Region, the Chamber of Commerce, employers’ association, local banks and other
organizations, with the purpose of providing assistance to regional industry. Originally, its main mission was to
develop industrial infrastructures, such as construction of industrial complexes. However, in keeping with the
changes in economic environment found in the region, it later began to change its role. In the 1980s, when the
demands of the consumers became diversified and called for higher quality in products, the “ERVET system”
- 172 -
was established in response. For example, in Carpi, the knitwear-producing area, a textile information center
was built through investments by ERVET and local companies. Since it is difficult for individual companies to
keep track of the trends in the fashion industry that changes at such a rapid pace, the center collects information
and assists the product development of each company. In the same manner, centers designed in accordance
with the characteristics of each industry were built in each local region. Later, in the 1990s due to the
integration of the European market, the industrial structure, which had been the strength of the Third Italy,
changed. Along with it, a lot of SMEs were consolidated or grouped. In order to maintain the strengths of the
SMEs in this region despite such recent trends, ERVET works to support in developing inter-corporate
networks, for example, there is a “virtual factory,” which produces goods by connecting small enterprises with
a computer network.10
One of the strengths of the Third Italy is its superior human resources. The level of such human resources is
maintained through the Aldini-Valeriani Institute, Italy’s oldest technical school established in 1844. This
educational institution focuses on engineering in such areas as machinery, information and electricity, and
supplies qualified personnel to the local region. In cooperation with the Chamber of Commerce and the
National Confederation of Artisans, it also established a reeducation system that is tailored to the characteristics
of the local industry. In addition, further specialized knowledge can be acquired at the University of Bologna.
With the support of related organizations such as the ERVET and the institute, the economy within the
Third Italy region has evolved. Recently its industrial structure has been transforming as in corporate
reorganizations following the integration of the EU and other changes in the market environment. However,
such reorganizations tend not to result in a pyramid-style structure of subcontractors, but rather, companies are
inclined to pursue mutual cooperation with others while drawing upon their own special characteristics. Each
company’s independence is backed by expertise and a high level of technology. As such, the Third Italy’s
uniqueness is the expertise of each company and the mutual cooperation among businesses. Also, the
government implements its regional policy while making the most of the regions and this has further drawn out
the strength of the Third Italy.
3. Trends in regional policies in Japan
We have thus far looked at the regional policies and recent new efforts carried out in Europe and especially
the EU. Next, we will take a broad overview of the development of regional policies in Japan and examine the
existing issues and efforts surrounding such regional policies.
(1) History of regional policies in Japan
During the period from the post-war restoration process to the first half of the high growth period in Japan,
economic development had the highest priority, which focuses on developing an infrastructure for the existing
10 Sasaki (2001), p. 68.
- 173 -
coastal industrial regions. As a result, the flow of population from rural to urban areas increased after which the
income disparity steadily widened. Furthermore, overconcentration in the industrialized regions came to be
realized to address.
Consequently, in the 1960s, “balanced development among regions”11 was specified as the basic principle
for Japan’s development plan. In order to disperse industry to local areas for the purpose of reducing disparities
among regions and resolving the problem of overconcentration, priority was given to the development of
infrastructure in regions other than the four major industrial areas. Later, the formulation of the New
Comprehensive National Development Plan in 1969, the enactment of the Industrial Relocation Promotion
Law in 1972 and the formulation of the Third Comprehensive National Development Plan in 1977 further
promoted the decentralization of industry and factories. As a result, from the 1960s through the 1970s, both the
flow of population to the major cities and the income disparity among prefectures generally declined. This
indicates that a certain level of success was achieved in decentralizing the industry and factories, and in
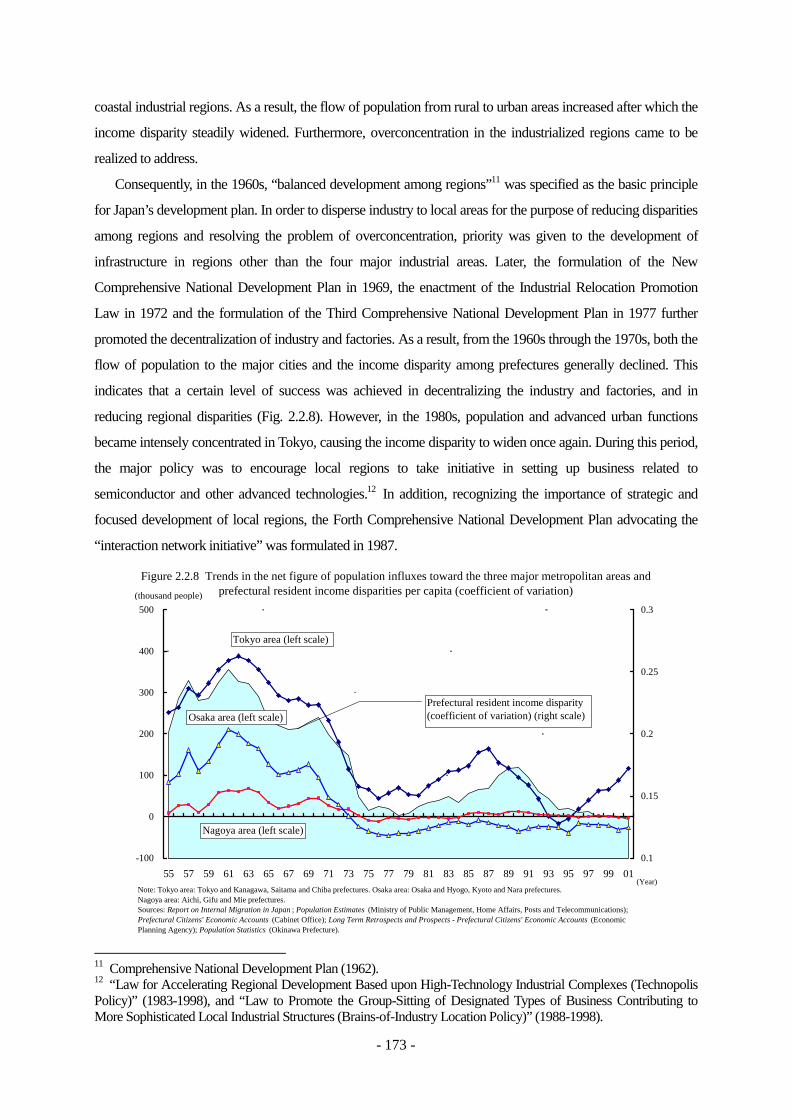
reducing regional disparities (Fig. 2.2.8). However, in the 1980s, population and advanced urban functions
became intensely concentrated in Tokyo, causing the income disparity to widen once again. During this period,
the major policy was to encourage local regions to take initiative in setting up business related to
semiconductor and other advanced technologies.12 In addition, recognizing the importance of strategic and
focused development of local regions, the Forth Comprehensive National Development Plan advocating the
“interaction network initiative” was formulated in 1987.
-100
0
100
200
300
400
500
55 57 59 61 63 65 67 69 71 73 75 77 79 81 83 85 87 89 91 93 95 97 99 010.1
0.15
0.2
0.25
0.3
(Year)Note: Tokyo area: Tokyo and Kanagawa, Saitama and Chiba prefectures. Osaka area: Osaka and Hyogo, Kyoto and Nara prefectures.Nagoya area: Aichi, Gifu and Mie prefectures.Sources: Report on Internal Migration in Japan ; Population Estimates (Ministry of Public Management, Home Affairs, Posts and Telecommunications);Prefectural Citizens' Economic Accounts (Cabinet Office); Long Term Retrospects and Prospects - Prefectural Citizens' Economic Accounts (EconomicPlanning Agency); Population Statistics (Okinawa Prefecture).
(thousand people)
Figure 2.2.8 Trends in the net figure of population influxes toward the three major metropolitan areas andprefectural resident income disparities per capita (coefficient of variation)
Nagoya area (left scale)
Osaka area (left scale)
Tokyo area (left scale)
Prefectural resident income disparity(coefficient of variation) (right scale)
11 Comprehensive National Development Plan (1962). 12 “Law for Accelerating Regional Development Based upon High-Technology Industrial Complexes (Technopolis Policy)” (1983-1998), and “Law to Promote the Group-Sitting of Designated Types of Business Contributing to More Sophisticated Local Industrial Structures (Brains-of-Industry Location Policy)” (1988-1998).
- 174 -
For this reason, in 1998, “Grand Design for the 21st Century,” which is the Fifth Comprehensive National
Development Plan, was formulated to promote the independence of local regions and creation of a beautiful
country. This plan specifies five basic tasks including “promoting the independence of regions and creating
regions which residents can take pride in.” Regarding domestic infrastructure investment, the plan points out
the importance of making investments that fully reflect the characteristic of the relevant local region while
planning for the next generation. As to industrial policies, it mentions about promoting the independence of
local regions by means of revitalizing the competitiveness of regional industries.
Moreover, the industrial concentration, which is based on the advanced technology that was in the process
of being created under the existing policies,13 was to be used as seeding for future business generation. In order
to make this possible, the “Law for Facilitating the Creation of New Business” was enacted in taking over
those existing policies in a progressive manner. Based on this law, a basic concept for creating new businesses
that utilize local resources was established at the initiative of local governments, and a comprehensive support
system for creating new businesses in local regions (regional platform) that is led by a core support agency has
been developed. In addition, an industrial cluster plan has been promoted since 2001. Under this plan,
researchers from SMEs and universities who have assembled in local regions actively interact with each other
and aim for collaborative technological development and building of new businesses. They are horizontal
collaborative relationships that would replace the Japanese keiretsu relationship. As such, in recent years,
measures for regional economic development utilizing science and technical knowledge have increased in
importance. Under such circumstances, and perhaps also due to the prolonged economic stagnation, income
disparities among different regions declined over the period from 1999 to 2001 (Fig. 2.2.8). However,
regarding population, the Tokyo Metropolitan Area has started to become overrun by new residents since the
mid-1990s. As increasing returns associated with the agglomerated population become apparent within the
metropolitan area, there is a definite possibility that the gap in income levels will widen once again.
(2) Efforts toward regional revitalization in recent years
While the past regional policies focusing on the use of unique resources in individual regions, further
efforts toward regional revitalization are being advanced. The Cabinet has taken the initiative to establish the
Headquarters for the Promotion of Special Zones for Structural Reform in 2002 and the Headquarters for the
Regional Revitalization in 2003. This was done in order to promote “structural reform in a positive manner”
that will allow local regions to resolve, from their own viewpoint, various issues they currently face, by
focusing on their potential and latent strengths.
Special Zones for Structural Reform is a system that allows local governments to carry out regulatory
reforms that are available only in their own specific regions in order to utilize their knowledge and ingenuity,
based on proposals made through the initiative of local public organizations and private businesses. By
13 The above Technopolis Policy (1983-1998) and Brains-of-Industry Location Policy (1988-1998).
- 175 -
discovering special characteristics of local regions through this system, industrial clusters and new industries
are created that are tailored to such characteristics. And it leads to the revitalization of the local economy.
Moreover, it is expected that by presenting successful cases of structural reforms carried out in specific regions,
it could be a good example of national regulatory reform14 and will revitalize the economy of the entire country.
As of March 2004, proposals were solicited a total of four times, and 324 special zones have been approved.
In order to revitalize the economy and generate employment in the local regions, the Headquarters for the
Regional Revitalization attaches importance on the various resources and strengths of the regions including
their industry, technology, human resources, tourism resources, natural environment, culture and history to
revitalize the regional communities through cultural and social interactions while making use of its knowledge
and ingenuity, and on securing sufficient employment through the sound development of private business.
Therefore, based on the “Basic Guidelines for the Promotion of Regional Revitalization,” 673 ideas were
submitted from 392 entities in January 2004. From them, selection was made on February 27, 2004 for “the
Program for the Promotion of Regional Revitalization,” with 23 adopted as measures limited to certain regions
and 118 adopted as national measures.
Regional economic policies of recent years focus on resources and strengths inherent in each region and
regional revitalization policies that make use of the knowledge found in local regions. To link such a trend to
sustainable development in a steady manner, it is perhaps necessary to first further evaluate and analyze the
relevant regional economy’s structure itself. According to the evaluation result, the strengths of the region
found as a result should be appropriately applied to develop its regional economic strategy. Of the
above-mentioned case examples found in Europe, the roles played by “Bilbao Metropoli-30” of Bilbao as well
as ERVET of Emilia-Romagna can be used as references. Furthermore, changes can also be seen in the factors
of plant location. Therefore, in addition to examining the flow of people, goods and money when conducting
the analysis, it is also necessary to evaluate a wider range of factors including human resources and quality of
life. Good examples of this are found in Europe, where urban revitalization efforts were put forth in Bilbao by
focusing on “the improvement of quality of life” and in Freiburg by focusing on “environment,” while the
Third Italy used its strength of having solid human resources in its local regions. Moreover, it is also important
to take note that efforts are being made in Europe, as seen above, to diversify the axis of evaluation for regional
policies.
While efforts at regional revitalization expand in each region, some argue that there are very few case
examples in which efforts are made toward the construction of regional revitalization by returning to evaluation
and analysis of regional economic structures in such manners as stated above. Some believe that this is because
most policy planning has tended to take place within the central government and local governments have not
had the opportunity to develop comprehensive regional economic policies on their own. Another reason could
14 Preferential measures of regulations implemented within special zones for structural reform are to be evaluated after a certain period of time, and if they are determined to be worth expanding to the national level, they will be implemented on a national scale.
- 176 -
be that statistics and methods for evaluating and analyzing regional economic structures are still undeveloped.
The following paragraphs will introduce actual cases found in Japan of structural analysis performed on our
regional economies. Based on such examples, an analytical method will be introduced for the purpose of
organizing issues when carrying out regional economic strategies, while bearing in mind the methods of
evaluating and analyzing the regional economic structure in the future.
(3) Advanced efforts in analysis of regional economic structure in Japan
This section will introduce the regional economy analyses based on a limited amount of statistical data and
independent survey. As case examples of analysis conducted by focusing on the structure of regional economic
cycle, there are two cases: (i) Council for Research on Economic Independence of the Iida-Shimoina Region,
and (ii) Akasaka Town, Okayama Prefecture.
(a) Council for Research on Economic Independence of the Iida-Shimoina Region
To grasp the economic status of the Iida-Shimoina region,15 the City of Iida, Shimoina Regional Office of
Nagano Prefecture, and local commerce industry established the Council for Research on Economic
Independence of the Iida-Shimoina Region in July 2002. This Council conducted survey research to find
answers to such questions as, “Is our own ‘regional industry’ generating enough to cover the local citizens’
living expenses and social burdens?” and “Can our regional economy survive if the current conditions are
kept?” An interim report of this research was submitted in March 2003.
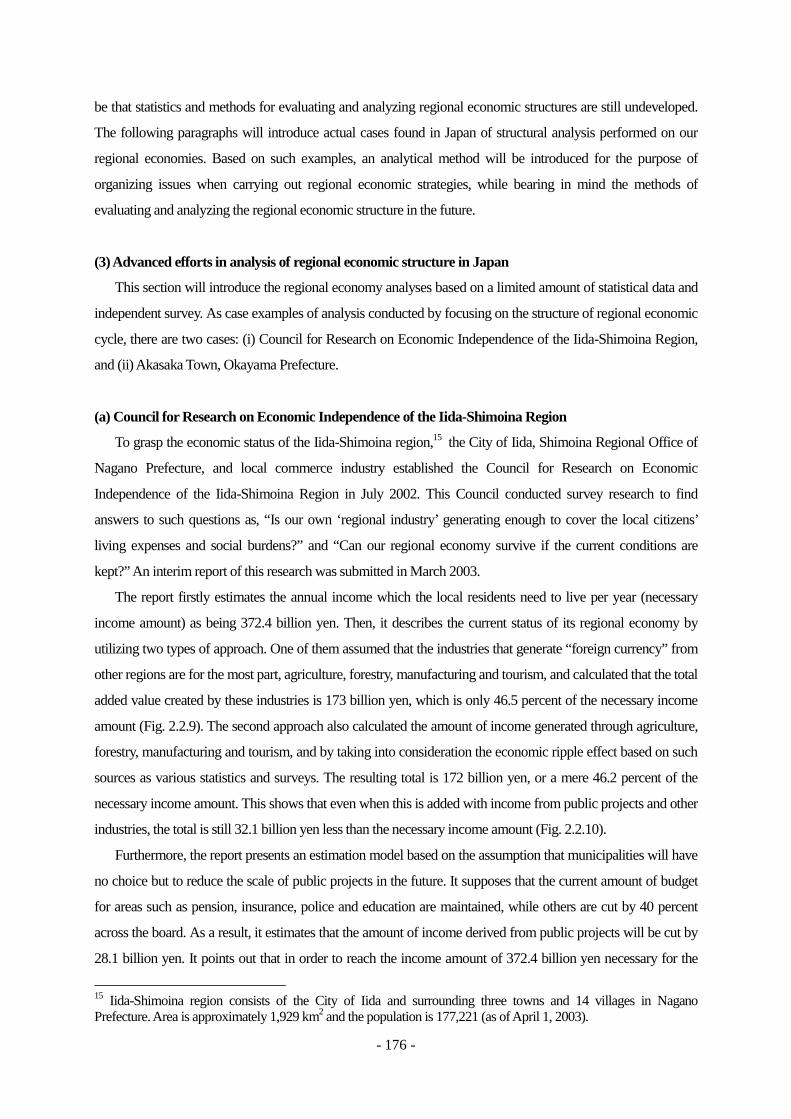
The report firstly estimates the annual income which the local residents need to live per year (necessary
income amount) as being 372.4 billion yen. Then, it describes the current status of its regional economy by
utilizing two types of approach. One of them assumed that the industries that generate “foreign currency” from
other regions are for the most part, agriculture, forestry, manufacturing and tourism, and calculated that the total
added value created by these industries is 173 billion yen, which is only 46.5 percent of the necessary income
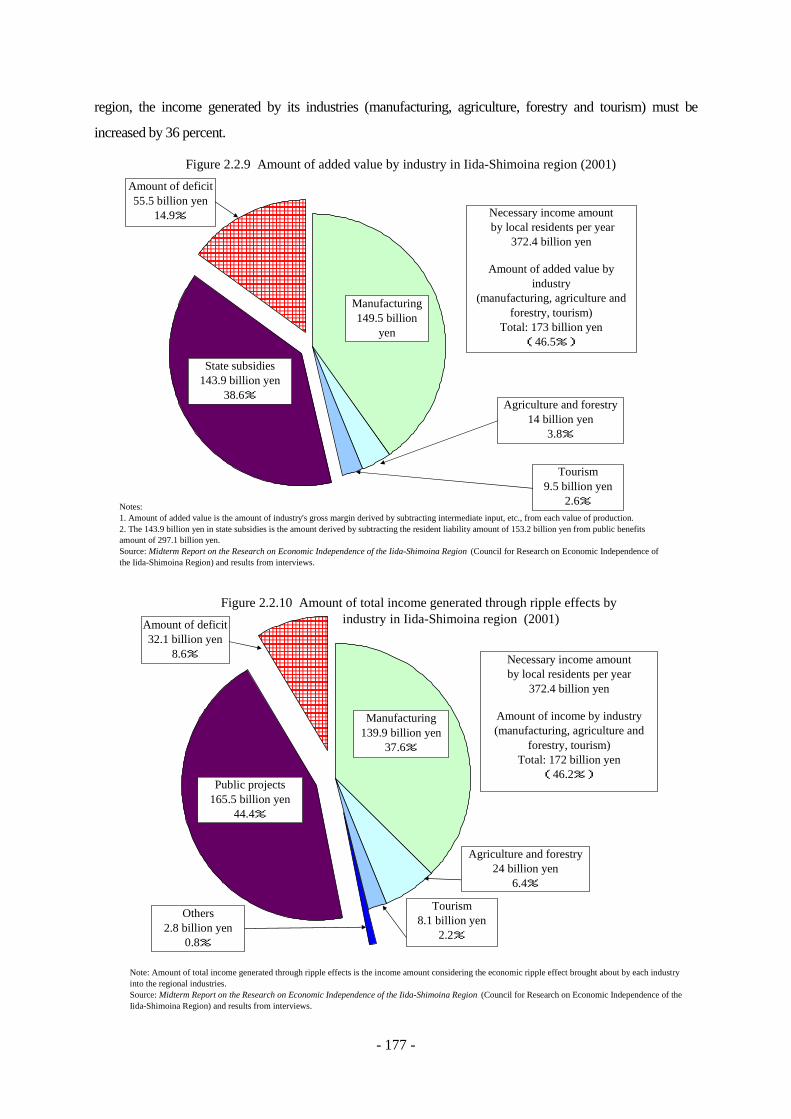
amount (Fig. 2.2.9). The second approach also calculated the amount of income generated through agriculture,
forestry, manufacturing and tourism, and by taking into consideration the economic ripple effect based on such
sources as various statistics and surveys. The resulting total is 172 billion yen, or a mere 46.2 percent of the
necessary income amount. This shows that even when this is added with income from public projects and other
industries, the total is still 32.1 billion yen less than the necessary income amount (Fig. 2.2.10).
Furthermore, the report presents an estimation model based on the assumption that municipalities will have
no choice but to reduce the scale of public projects in the future. It supposes that the current amount of budget
for areas such as pension, insurance, police and education are maintained, while others are cut by 40 percent
across the board. As a result, it estimates that the amount of income derived from public projects will be cut by
28.1 billion yen. It points out that in order to reach the income amount of 372.4 billion yen necessary for the
15 Iida-Shimoina region consists of the City of Iida and surrounding three towns and 14 villages in Nagano Prefecture. Area is approximately 1,929 km2 and the population is 177,221 (as of April 1, 2003).
- 177 -
region, the income generated by its industries (manufacturing, agriculture, forestry and tourism) must be
increased by 36 percent.
Figure 2.2.9 Amount of added value by industry in Iida-Shimoina region (2001)
Manufacturing149.5 billion
yen%
State subsidies143.9 billion yen
38.6%
Amount of deficit55.5 billion yen
14.9%
Tourism9.5 billion yen
2.6%
Agriculture and forestry14 billion yen
3.8%
Necessary income amount by local residents per year
372.4 billion yen
Amount of added value byindustry
(manufacturing, agriculture andforestry, tourism)
Total: 173 billion yen(46.5%)
Notes:1. Amount of added value is the amount of industry's gross margin derived by subtracting intermediate input, etc., from each value of production.2. The 143.9 billion yen in state subsidies is the amount derived by subtracting the resident liability amount of 153.2 billion yen from public benefitsamount of 297.1 billion yen.Source: Midterm Report on the Research on Economic Independence of the Iida-Shimoina Region (Council for Research on Economic Independence ofthe Iida-Shimoina Region) and results from interviews.
Figure 2.2.10 Amount of total income generated through ripple effects by industry in Iida-Shimoina region (2001)
Manufacturing139.9 billion yen
37.6%
Public projects165.5 billion yen
44.4%
Amount of deficit32.1 billion yen
8.6%
Tourism8.1 billion yen
2.2%
Agriculture and forestry24 billion yen
6.4%
Others2.8 billion yen
0.8%
Necessary income amountby local residents per year
372.4 billion yen
Amount of income by industry(manufacturing, agriculture and
forestry, tourism)Total: 172 billion yen
(46.2%)
Note: Amount of total income generated through ripple effects is the income amount considering the economic ripple effect brought about by each industryinto the regional industries.Source: Midterm Report on the Research on Economic Independence of the Iida-Shimoina Region (Council for Research on Economic Independence of theIida-Shimoina Region) and results from interviews.
- 178 -
Based on this awareness presented by the Council, the head of all 18 municipalities within the region and
relevant local economists gathered in November 2003 for the Conference on Creating a Self-sustainable
Economy for the Iida-Shimoina Region.” Explanation was given at the meeting based on the report that the
regional industries were only producing about half of the necessary income amount, and the region was heavily
dependent on public projects to cover the other half. It was also pointed out that the situation regarding income
for the local residents was expected to become even more difficult in the future. As a countermeasure to the
problem, some participants proposed the importance of revitalizing the manufacturing, agricultural and forestry
industries to gain income from other regions and enhance the intra-regional circulation of trade and service
industries. The analytical results of the report are expected to be used in forming future regional industry
promotion policies.
(b) Akasaka Town, Okayama Prefecture16
Akasaka Town of Okayama Prefecture questioned the effect of the existing industrial promotion and other
regional revitalization policies and suspected that the reason the policies had minimal effect may be because
“more people, goods, and money than expected were flowing out to other regions.” However, at the time, the
actual amount of outflow of such people, goods, and money was not quantitatively understood. Under such
conditions, in order to ultimately promote a revitalized “urban development” while increasing the intra-regional
circulation of economy, the town became aware that a “framework” was necessary for quantitatively
measuring the effects of its policies, and thus took action. In FY1995, it began conducting a survey entitled
“Framework for Quantitatively Understanding the Regional Economic Circulation Structure of Akasaka Town,
Okayama Prefecture, and Approximate Estimates Based on the Framework,” which has been used as an
effective empirical resource for regional policies.
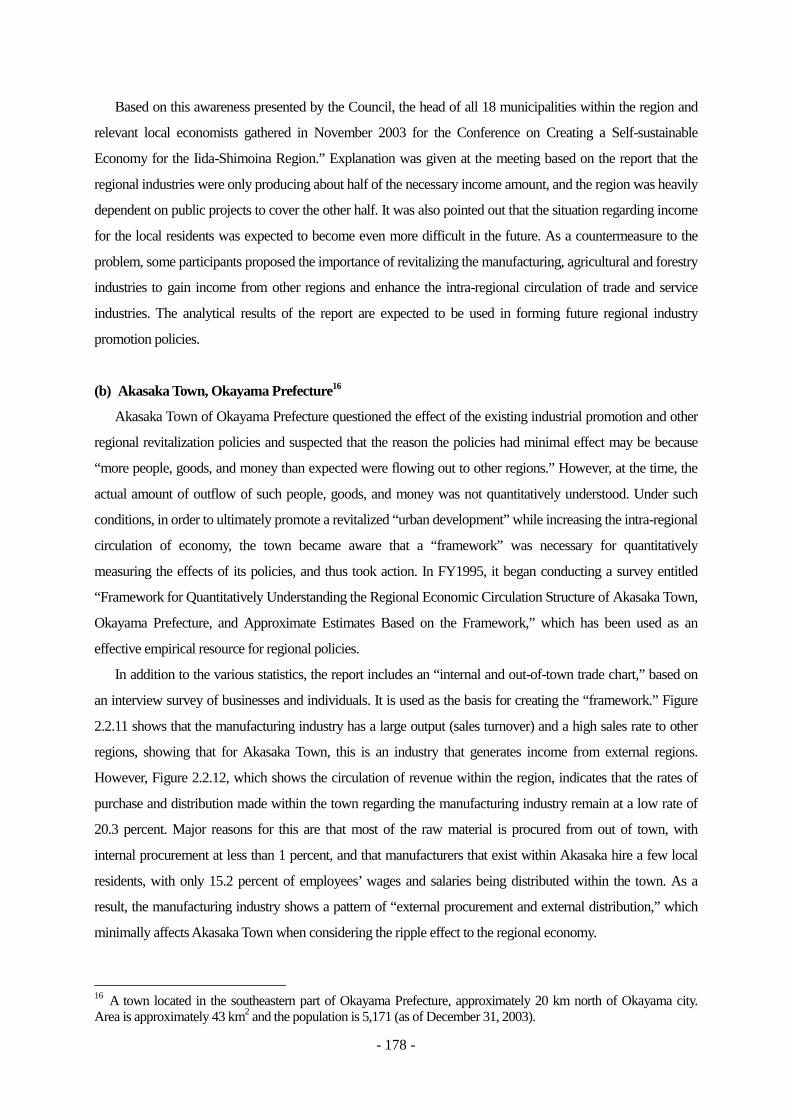
In addition to the various statistics, the report includes an “internal and out-of-town trade chart,” based on
an interview survey of businesses and individuals. It is used as the basis for creating the “framework.” Figure
2.2.11 shows that the manufacturing industry has a large output (sales turnover) and a high sales rate to other
regions, showing that for Akasaka Town, this is an industry that generates income from external regions.
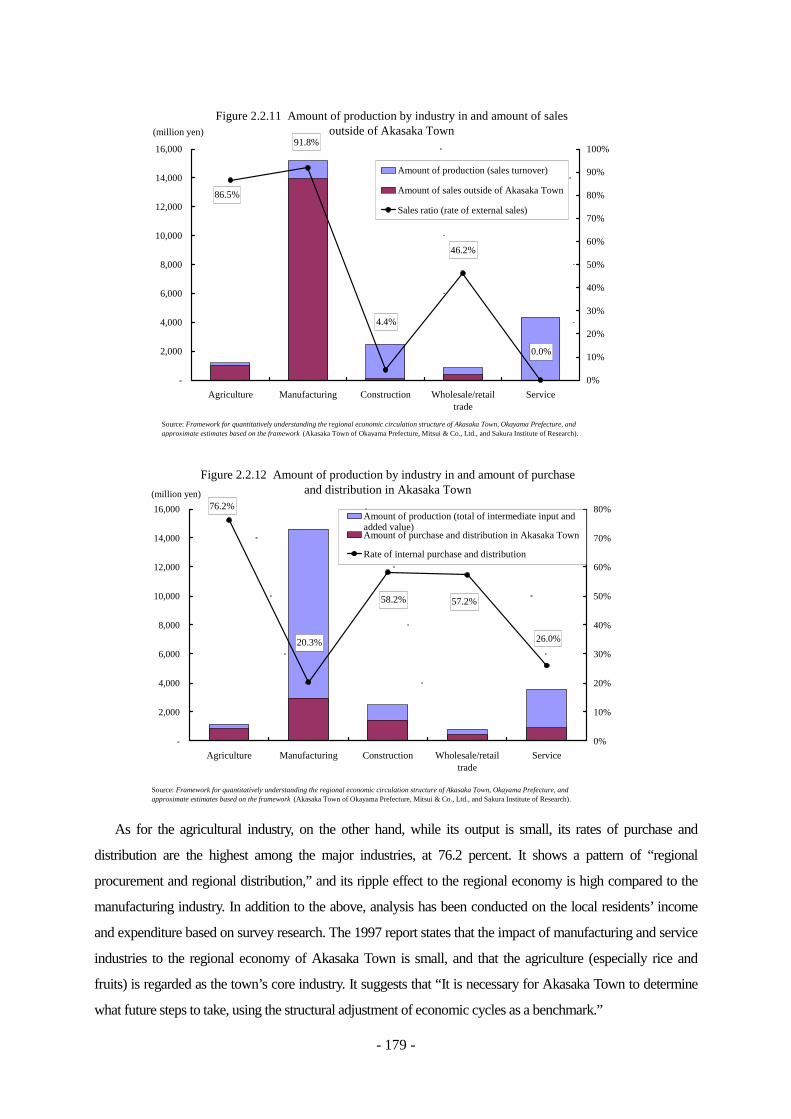
However, Figure 2.2.12, which shows the circulation of revenue within the region, indicates that the rates of
purchase and distribution made within the town regarding the manufacturing industry remain at a low rate of
20.3 percent. Major reasons for this are that most of the raw material is procured from out of town, with
internal procurement at less than 1 percent, and that manufacturers that exist within Akasaka hire a few local
residents, with only 15.2 percent of employees’ wages and salaries being distributed within the town. As a
result, the manufacturing industry shows a pattern of “external procurement and external distribution,” which
minimally affects Akasaka Town when considering the ripple effect to the regional economy.
16 A town located in the southeastern part of Okayama Prefecture, approximately 20 km north of Okayama city. Area is approximately 43 km2 and the population is 5,171 (as of December 31, 2003).
- 179 -
Figure 2.2.11 Amount of production by industry in and amount of salesoutside of Akasaka Town
0.0%
46.2%
86.5%
91.8%
4.4%
-
2,000
4,000
6,000
8,000
10,000
12,000
14,000
16,000
Agriculture Manufacturing Construction Wholesale/retailtrade
Service
(million yen)
0%
10%
20%
30%
40%
50%
60%
70%
80%
90%
100%
Amount of production (sales turnover)
Amount of sales outside of Akasaka Town
Sales ratio (rate of external sales)
Source: Framework for quantitatively understanding the regional economic circulation structure of Akasaka Town, Okayama Prefecture, andapproximate estimates based on the framework (Akasaka Town of Okayama Prefecture, Mitsui & Co., Ltd., and Sakura Institute of Research).
Figure 2.2.12 Amount of production by industry in and amount of purchaseand distribution in Akasaka Town
26.0%
57.2%
76.2%
20.3%
58.2%
-
2,000
4,000
6,000
8,000
10,000
12,000
14,000
16,000
Agriculture Manufacturing Construction Wholesale/retailtrade
Service
(million yen)
0%
10%
20%
30%
40%
50%
60%
70%
80%Amount of production (total of intermediate input andadded value)Amount of purchase and distribution in Akasaka Town
Rate of internal purchase and distribution
Source: Framework for quantitatively understanding the regional economic circulation structure of Akasaka Town, Okayama Prefecture, andapproximate estimates based on the framework (Akasaka Town of Okayama Prefecture, Mitsui & Co., Ltd., and Sakura Institute of Research).
As for the agricultural industry, on the other hand, while its output is small, its rates of purchase and
distribution are the highest among the major industries, at 76.2 percent. It shows a pattern of “regional
procurement and regional distribution,” and its ripple effect to the regional economy is high compared to the
manufacturing industry. In addition to the above, analysis has been conducted on the local residents’ income
and expenditure based on survey research. The 1997 report states that the impact of manufacturing and service
industries to the regional economy of Akasaka Town is small, and that the agriculture (especially rice and
fruits) is regarded as the town’s core industry. It suggests that “It is necessary for Akasaka Town to determine
what future steps to take, using the structural adjustment of economic cycles as a benchmark.”
- 180 -
(Project of Akasaka Natural Rice)
Simultaneous to the above-mentioned analysis,17 Akasaka Town worked on the promotion of agriculture
using the locally-produced “Asahi rice.” The policy aimed not only to simply sell the rice to outside regions,
but to also undertake the cooking and processing of rice for added value. Akasaka Natural Rice Corporation
was established as a third-sector company, with initial investments made by Akasaka Town and two private
sector businesses, and it began operations in October 1995.18 The company policy was to purchase through an
agricultural cooperative the entire volume of rice (15,000 bags) produced in Akasaka Town, excluding stock
rice and brewer’s rice, and mainly to hire farmers’ wives and other local residents as its employees. It is said
that over the nine years since its establishment, the company has bought as raw material 400,000 bags
(approximately 8 billion yen) of rice, including those from outside the region, and paid a total of approximately
1.7 billion yen in wages. In this way, the town of Akasaka is putting forth an effort in revitalizing its local
region by adding value to its agriculture, which in comparison to the manufacturing industry can affect the
regional economic cycle more strongly.
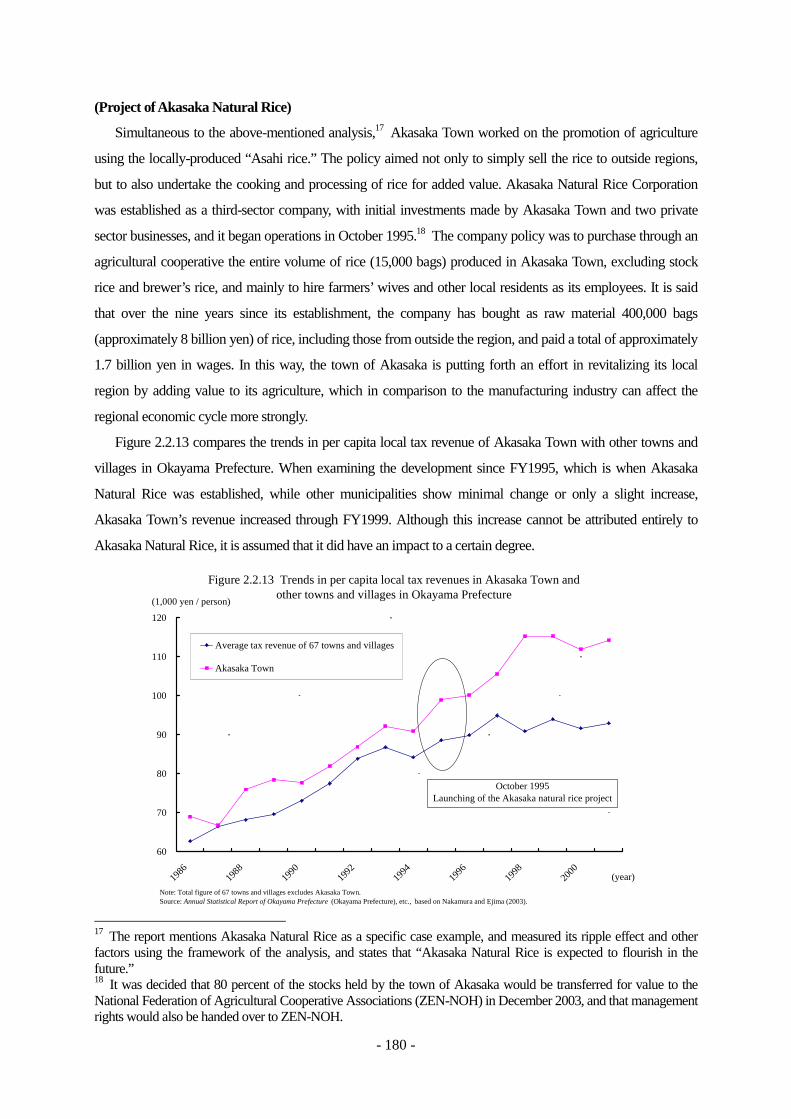
Figure 2.2.13 compares the trends in per capita local tax revenue of Akasaka Town with other towns and
villages in Okayama Prefecture. When examining the development since FY1995, which is when Akasaka
Natural Rice was established, while other municipalities show minimal change or only a slight increase,
Akasaka Town’s revenue increased through FY1999. Although this increase cannot be attributed entirely to
Akasaka Natural Rice, it is assumed that it did have an impact to a certain degree.
Figure 2.2.13 Trends in per capita local tax revenues in Akasaka Town andother towns and villages in Okayama Prefecture
60
70
80
90
100
110
120
1986
1988
1990
1992
1994
1996
1998
2000 (year)
(1,000 yen / person)
Average tax revenue of 67 towns and villages
Akasaka Town
Note: Total figure of 67 towns and villages excludes Akasaka Town.Source: Annual Statistical Report of Okayama Prefecture (Okayama Prefecture), etc., based on Nakamura and Ejima (2003).
October 1995Launching of the Akasaka natural rice project
17 The report mentions Akasaka Natural Rice as a specific case example, and measured its ripple effect and other factors using the framework of the analysis, and states that “Akasaka Natural Rice is expected to flourish in the future.” 18 It was decided that 80 percent of the stocks held by the town of Akasaka would be transferred for value to the National Federation of Agricultural Cooperative Associations (ZEN-NOH) in December 2003, and that management rights would also be handed over to ZEN-NOH.
- 181 -
(4) Toward new regional economic analysis
(a) Concept of regional economic analysis
The previous section introduced efforts put forth by certain regions in analyzing their own regional
economies. In order to develop these efforts in the future and allow them to be utilized in other regions as well,
this section will organize the framework for regional economic analysis, and describe its methods. First
regional economic analysis will be divided into: (i) regional economic cyclical analysis, to grasp and analyze
information on flows of people, goods,19 money, and information within and among regions; and (ii)
regionally-distinct asset analysis, to grasp and analyze information on “assets” possessed by the region such as
concentrations of human resources and educational and cultural heritage in the region. It can be said that the
former is based on a concept of “flow,” and the latter on a concept of “stock.”
Analysis that took place at the Council for Research on Economic Independence of the Iida-Shimoina
region was of the former type. In Bilbao (quality of life), Freiburg (environment and solar energy), and the
Third Italy (network among SMEs, technology and human resources), the strengths of the region in question
were identified and used to reach policy objectives, fall under the latter type. In Akasaka Town, the former type
of analysis was conducted, and later, “Asahi rice” (and its processed goods) was utilized as “the region’s
regionally-distinct asset” to obtain “foreign currency”. As a result, both types of analysis were integrated.
As the case in Akasaka Town shows, it is necessary to integrate and use both “the regional economic
cyclical analysis” and “the regionally-distinct asset analysis.” This is because the former type examines
whether it is possible for the regional economic structure to acquire “foreign currency” and at the same time
achieve sustainable development, by keeping close watch and analyzing the flows of people, goods, money,
and information within and among the region, and the purpose of the latter type is to determine the
regionally-distinct resources (“strengths”) that will obtain the “foreign currency.” In a manner of speaking, the
latter is like a company’s “intellectual property,” while the former corresponds to the financial report of the
company, in that it records the transactions and profits generated as a result of using the “intellectual property.”
In this way, the integration of these two types of analysis produces an overall picture of the regional
economy and opens the way for formulation of comprehensive regional strategies and policies which cover
various aspects without being bound by a vertical administrative system. In an evaluation process, it will allow
for the implemented policies to be evaluated in a more detailed and practical manner, as opposed to a process
which is based on a uniform national index defined by each policy area without any collaboration among them.
The evaluation can be carried out from the viewpoint of the individual region whether its unique characteristics
are actually being strengthened. Furthermore, local government can use the evaluation results of implemented
policies as feedback, to understand further the local characteristics. The case of Akasaka Town can also be
considered an example of such a process as it continues to analyze its unique characteristics by measuring the
19 “Goods” here not only represent general “products” that are produced by manufacturers, but services as well. Therefore, it should normally be indicated as “goods and services,” but for the purpose of simplicity, the term “goods” will uniformly be used.
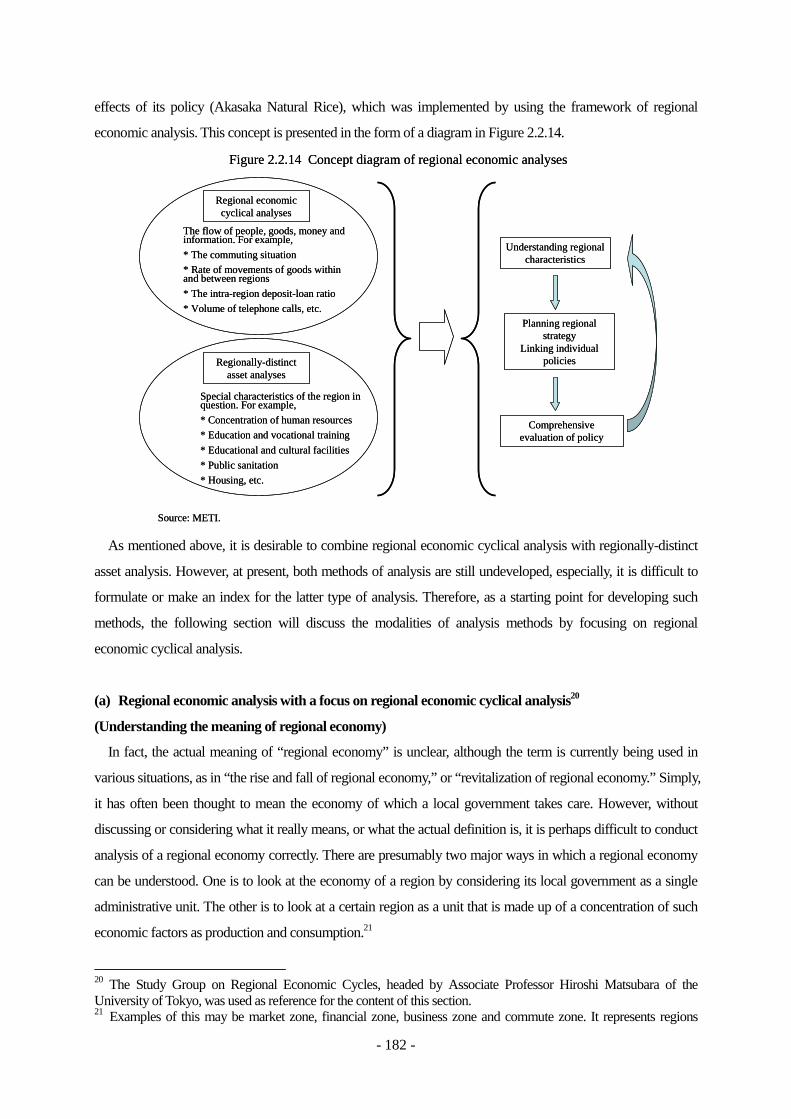
- 182 -
effects of its policy (Akasaka Natural Rice), which was implemented by using the framework of regional
economic analysis. This concept is presented in the form of a diagram in Figure 2.2.14.
As mentioned above, it is desirable to combine regional economic cyclical analysis with regionally-distinct
asset analysis. However, at present, both methods of analysis are still undeveloped, especially, it is difficult to
formulate or make an index for the latter type of analysis. Therefore, as a starting point for developing such
methods, the following section will discuss the modalities of analysis methods by focusing on regional
economic cyclical analysis.
(a) Regional economic analysis with a focus on regional economic cyclical analysis20
(Understanding the meaning of regional economy)
In fact, the actual meaning of “regional economy” is unclear, although the term is currently being used in
various situations, as in “the rise and fall of regional economy,” or “revitalization of regional economy.” Simply,
it has often been thought to mean the economy of which a local government takes care. However, without
discussing or considering what it really means, or what the actual definition is, it is perhaps difficult to conduct
analysis of a regional economy correctly. There are presumably two major ways in which a regional economy
can be understood. One is to look at the economy of a region by considering its local government as a single
administrative unit. The other is to look at a certain region as a unit that is made up of a concentration of such
economic factors as production and consumption.21
20 The Study Group on Regional Economic Cycles, headed by Associate Professor Hiroshi Matsubara of the University of Tokyo, was used as reference for the content of this section. 21 Examples of this may be market zone, financial zone, business zone and commute zone. It represents regions
Figure 2.2.14 Concept diagram of regional economic analyses
Source: METI.
Regional economic cyclical analyses
The flow of people, goods, money and information. For example, * The commuting situation* Rate of movements of goods within and between regions* The intra-region deposit-loan ratio* Volume of telephone calls, etc.
Regionally-distinct asset analyses
Special characteristics of the region in question. For example,* Concentration of human resources* Education and vocational training* Educational and cultural facilities* Public sanitation* Housing, etc.
Understanding regional characteristics
Planning regional strategy
Linking individual policies
Comprehensive evaluation of policy
- 183 -
The former definition has a one-to-one correspondence with an administrative body, which makes it easy to
use in implementing and evaluating regional economic policies. The latter is beneficial for performing
thorough economic analyses. In light of the purpose of developing a method of economic analysis, the latter
definition will be used for the following sections, since those regions that have sufficient urban concentration
are considered “urban areas,”22 the concept of “urban employment areas,”23 which breaks down the country
into 269 units based on the flow of commuters between municipalities, will be used to discuss the analysis
method of regional economies based on each urban areas.24
(Analysis method and regional economic cyclical model)
In most of the existing regional economic analyses, industrial structure and interindustrial relations were
analyzed within a selected region. The area analyzed was for the most part limited to the industry of a particular
region, and characteristics and problems would be pointed out, and policy issues would be proposed within that
limited scope.
In contrast, the analysis of a regional economic cyclical structure introduced in this section not only looks
within a particular region but also its relationship with other regions. By analyzing the flow of people, goods,
money and information within and among regions, this method aims to identify the mechanism of regional
economic growth and decline.
Figure 2.2.15 schematizes the flows of people, goods, money and information within and among regional
economies as a regional economic cyclical model. In this diagram, while assuming that the regional city is a
center of the urban employment areas, the vertical axis shows the relationships among urban and agricultural
areas by listing them in the order of city centers and suburbs in big cities, regional cities and agricultural
districts. The regional economy is indicated by a circle placed at the location of the regional cities.25 The
industrial sectors that make up the relevant regional economy, as a typical case, include manufacturing,
commerce and service, construction, and agriculture, forestry and fishery, yet it depends on the regions. The
common flows of people, goods, money and information are shown using arrows.26
determined in line with economic activities and lifestyle activities. 22 Kanemoto and Tokuoka (2002) state that other points that need to be taken into consideration in defining an urban area are: (i) a standard for defining a city that is as simple as possible; (ii) standard that is based not on subjective but on objective judgment; and (iii) standard that will allow the urban area to be understood as a unit. 23 Concept proposed by Kanemoto and Tokuoka (2002). In 2000, they broke down the country into 113 metropolitan employment areas, and 156 micropolitan employment areas. For more details, refer to Kanemoto and Tokuoka (2002), as well as their website (http://www.e.u-tokyo.ac.jp/~kanemoto/MEA/uea_frame_e.htm). 24 In Japan, no comprehensive statistical data based on urban areas have been compiled, although there are some that have been put together through the efforts of researchers. The statistics of urban areas discussed in the section are, unless otherwise stated, the total of statistics compiled by local governments that make up the urban area in question. 25 This figure shows a case in which the main branch of the factory is located outside of the region. If the main branch of a factory is located within the region, the flow of money and others that are related to the main branch will take place mainly within the region. 26 Although there are many other directions both within and outside the region in which various people, goods, money and information could flow in and out of, the flows that are shown here are generally based on the regional economic cyclical analysis discussed in this section.
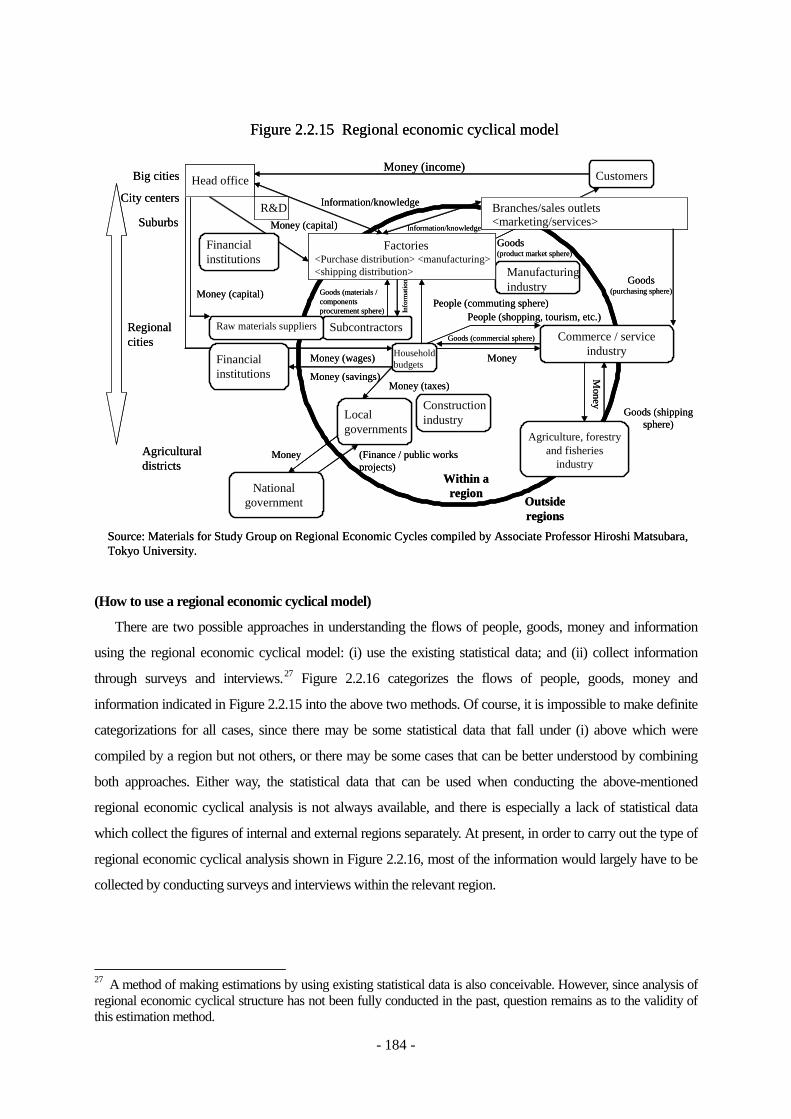
- 184 -
(How to use a regional economic cyclical model)
There are two possible approaches in understanding the flows of people, goods, money and information
using the regional economic cyclical model: (i) use the existing statistical data; and (ii) collect information
through surveys and interviews.27 Figure 2.2.16 categorizes the flows of people, goods, money and
information indicated in Figure 2.2.15 into the above two methods. Of course, it is impossible to make definite
categorizations for all cases, since there may be some statistical data that fall under (i) above which were
compiled by a region but not others, or there may be some cases that can be better understood by combining
both approaches. Either way, the statistical data that can be used when conducting the above-mentioned
regional economic cyclical analysis is not always available, and there is especially a lack of statistical data
which collect the figures of internal and external regions separately. At present, in order to carry out the type of
regional economic cyclical analysis shown in Figure 2.2.16, most of the information would largely have to be
collected by conducting surveys and interviews within the relevant region.
27 A method of making estimations by using existing statistical data is also conceivable. However, since analysis of regional economic cyclical structure has not been fully conducted in the past, question remains as to the validity of this estimation method.
Figure 2.2.15 Regional economic cyclical model
Source: Materials for Study Group on Regional Economic Cycles compiled by Associate Professor Hiroshi Matsubara, Tokyo University.
Goods (shipping sphere)
Big cities
City centers
Suburbs
Regional cities
Agricultural districts
National government
Agriculture, forestry and fisheries
industry
Local governments
Construction industry
Commerce / service industryHousehold
budgets
Within a region
Outside regions
Raw materials suppliers Subcontractors
Manufacturing industry
Factories<Purchase distribution> <manufacturing> <shipping distribution>
Head office
Branches/sales outlets<marketing/services>
CustomersMoney (income)
R&D Information/knowledge
Information/knowledge
Goods(product market sphere)
Goods (purchasing sphere)
Money
Money (Finance / public works projects)
Money (taxes)
People (commuting sphere)People (shopping, tourism, etc.)
Goods (commercial sphere)
MoneyMoney (wages)
Financial institutions
Money (capital)
Info
rmat
ion
Goods (materials / components procurement sphere)
Money (capital)
Financial institutions Money (savings)
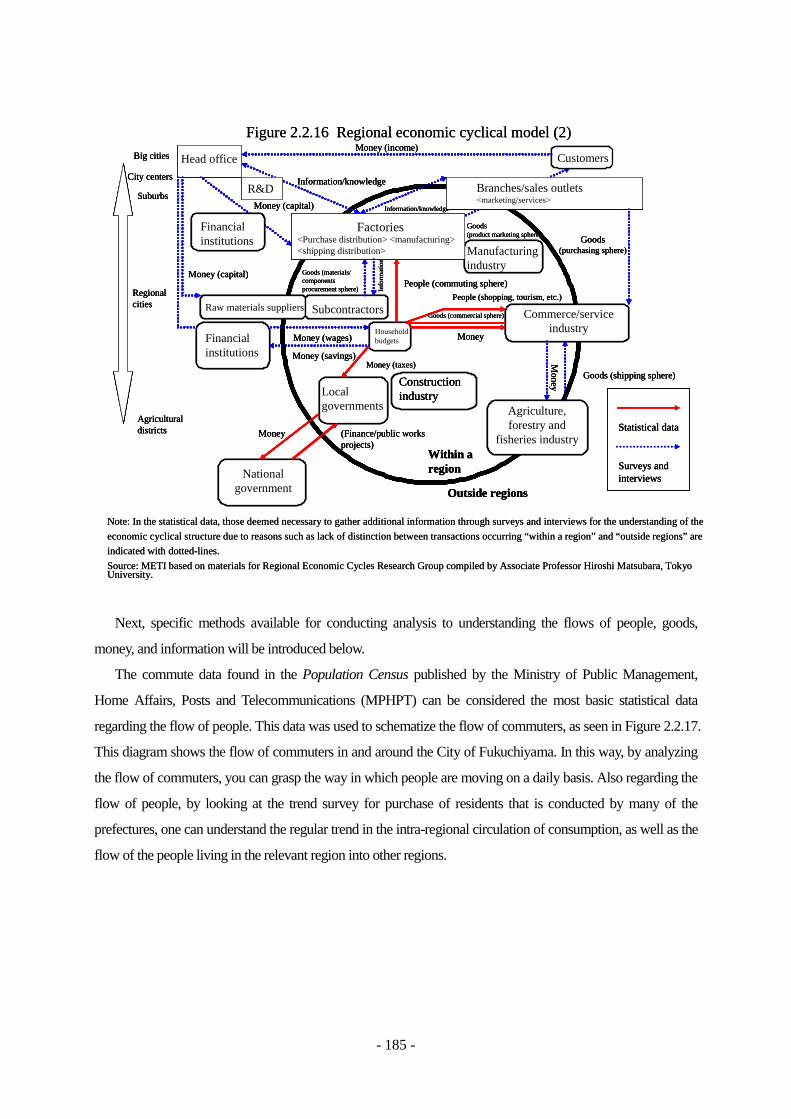
- 185 -
Next, specific methods available for conducting analysis to understanding the flows of people, goods,
money, and information will be introduced below.
The commute data found in the Population Census published by the Ministry of Public Management,
Home Affairs, Posts and Telecommunications (MPHPT) can be considered the most basic statistical data
regarding the flow of people. This data was used to schematize the flow of commuters, as seen in Figure 2.2.17.
This diagram shows the flow of commuters in and around the City of Fukuchiyama. In this way, by analyzing
the flow of commuters, you can grasp the way in which people are moving on a daily basis. Also regarding the
flow of people, by looking at the trend survey for purchase of residents that is conducted by many of the
prefectures, one can understand the regular trend in the intra-regional circulation of consumption, as well as the
flow of the people living in the relevant region into other regions.
Figure 2.2.16 Regional economic cyclical model (2)
Note: In the statistical data, those deemed necessary to gather additional information through surveys and interviews for the understanding of the economic cyclical structure due to reasons such as lack of distinction between transactions occurring “within a region” and “outside regions” are indicated with dotted-lines.Source: METI based on materials for Regional Economic Cycles Research Group compiled by Associate Professor Hiroshi Matsubara, Tokyo University.
Statistical data
Surveys and interviews
Big cities
City centers
Suburbs
国
農林水産業
地方自治体
商業・サービス業家計
原材料供給業者 外注関連業者
製造業
工場
<購買物流><製造><出荷物流>
本社
支店・営業所<マーケティング><サービス>
顧客
R&DInformation/knowledge
Information/knowledge
Goods(product marketing sphere) Goods
(purchasing sphere)
Goods (shipping sphere)
Money (Finance/public works projects)
Money (taxes)
People (commuting sphere)People (shopping, tourism, etc.)
Money (wages)
金融機関
Money (capital)
Goods (materials/ components procurement sphere) In
form
atio
n
Money (capital)
金融機関 Money (savings)
Regional cities
Agricultural districts
National government
Agriculture, forestry and
fisheries industry
Local governments
Construction industry
Commerce/service industryHousehold
budgets
Within a region
Outside regions
Raw materials suppliers Subcontractors
Manufacturing industry
Factories<Purchase distribution> <manufacturing> <shipping distribution>
Head office
Branches/sales outlets<marketing/services>
CustomersMoney (income)
R&D
Money
Money
Financial institutions
Financial institutions
Goods (commercial sphere)
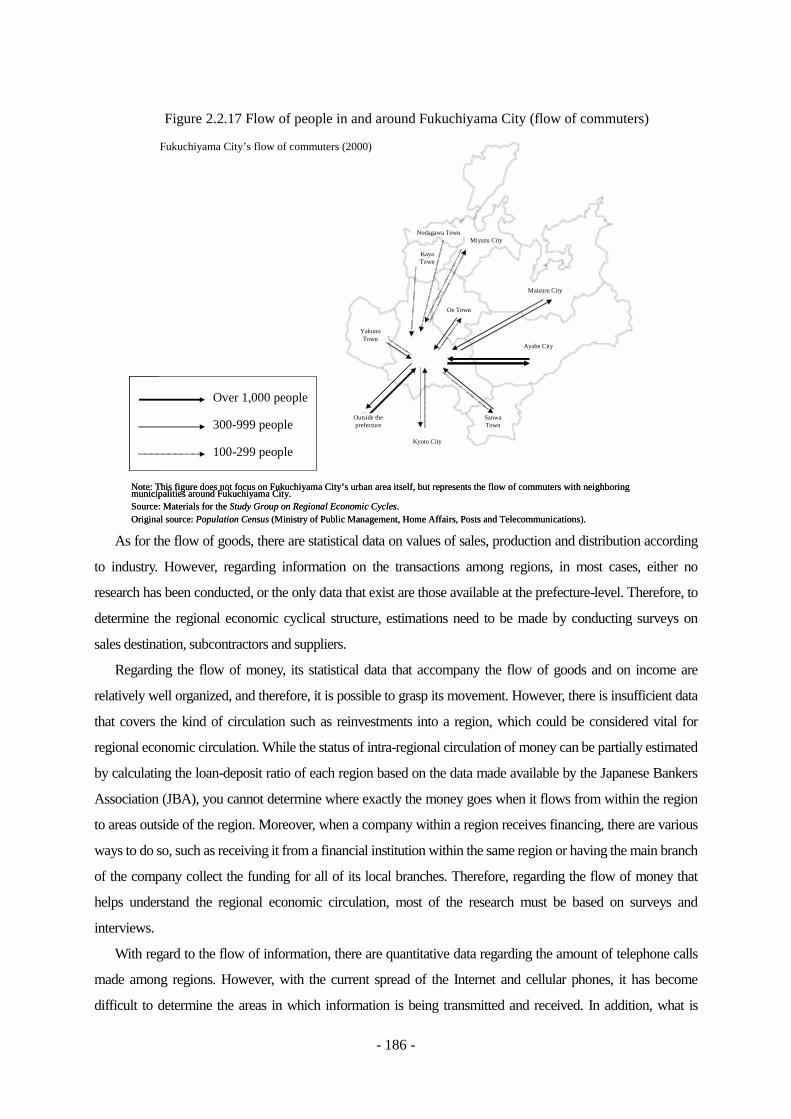
- 186 -
As for the flow of goods, there are statistical data on values of sales, production and distribution according
to industry. However, regarding information on the transactions among regions, in most cases, either no
research has been conducted, or the only data that exist are those available at the prefecture-level. Therefore, to
determine the regional economic cyclical structure, estimations need to be made by conducting surveys on
sales destination, subcontractors and suppliers.
Regarding the flow of money, its statistical data that accompany the flow of goods and on income are
relatively well organized, and therefore, it is possible to grasp its movement. However, there is insufficient data
that covers the kind of circulation such as reinvestments into a region, which could be considered vital for
regional economic circulation. While the status of intra-regional circulation of money can be partially estimated
by calculating the loan-deposit ratio of each region based on the data made available by the Japanese Bankers
Association (JBA), you cannot determine where exactly the money goes when it flows from within the region
to areas outside of the region. Moreover, when a company within a region receives financing, there are various
ways to do so, such as receiving it from a financial institution within the same region or having the main branch
of the company collect the funding for all of its local branches. Therefore, regarding the flow of money that
helps understand the regional economic circulation, most of the research must be based on surveys and
interviews.
With regard to the flow of information, there are quantitative data regarding the amount of telephone calls
made among regions. However, with the current spread of the Internet and cellular phones, it has become
difficult to determine the areas in which information is being transmitted and received. In addition, what is
Over 1,000 people
300-999 people
100-299 peopleKyoto City
Sanwa Town
Oe Town
Ayabe City
Yakuno Town
Maizuru City
Outside the prefecture
Kaya Town
Nodagawa TownMiyazu City
Fukuchiyama City’s flow of commuters (2000)
Note: This figure does not focus on Fukuchiyama City’s urban area itself, but represents the flow of commuters with neighboring municipalities around Fukuchiyama City. Source: Materials for the Study Group on Regional Economic Cycles. Original source: Population Census (Ministry of Public Management, Home Affairs, Posts and Telecommunications).
Figure 2.2.17 Flow of people in and around Fukuchiyama City (flow of commuters)
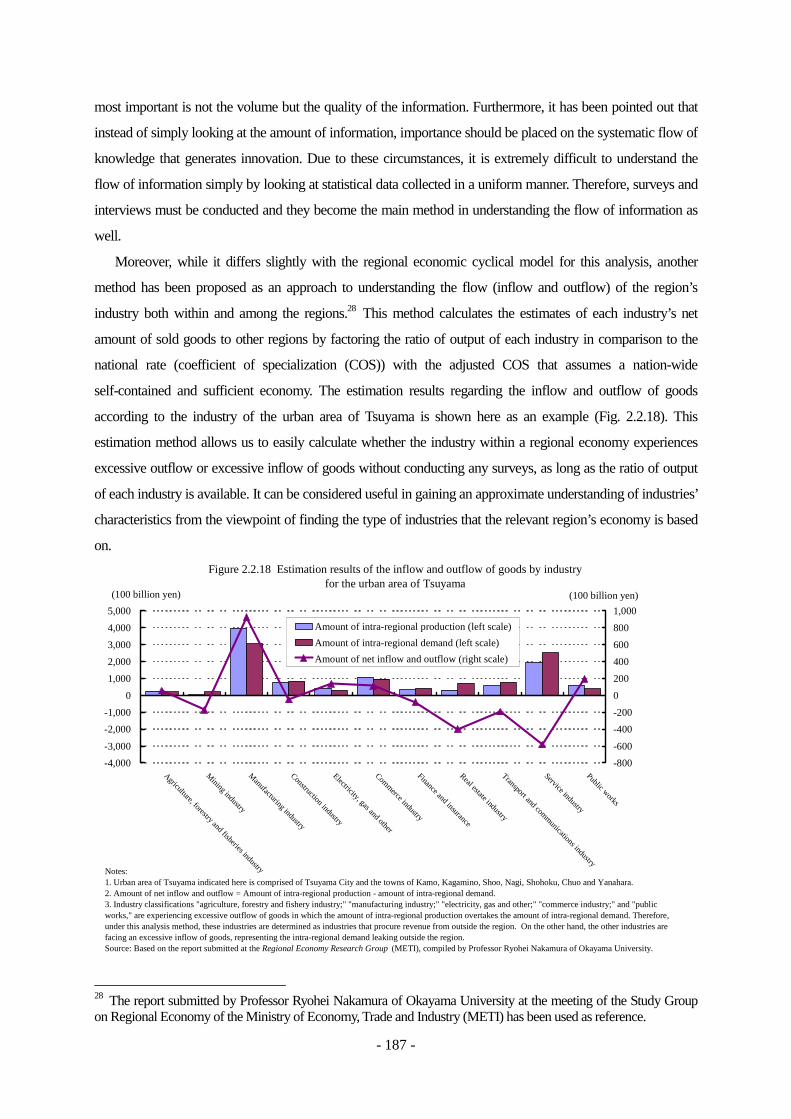
- 187 -
most important is not the volume but the quality of the information. Furthermore, it has been pointed out that
instead of simply looking at the amount of information, importance should be placed on the systematic flow of
knowledge that generates innovation. Due to these circumstances, it is extremely difficult to understand the
flow of information simply by looking at statistical data collected in a uniform manner. Therefore, surveys and
interviews must be conducted and they become the main method in understanding the flow of information as
well.
Moreover, while it differs slightly with the regional economic cyclical model for this analysis, another
method has been proposed as an approach to understanding the flow (inflow and outflow) of the region’s
industry both within and among the regions.28 This method calculates the estimates of each industry’s net
amount of sold goods to other regions by factoring the ratio of output of each industry in comparison to the
national rate (coefficient of specialization (COS)) with the adjusted COS that assumes a nation-wide
self-contained and sufficient economy. The estimation results regarding the inflow and outflow of goods
according to the industry of the urban area of Tsuyama is shown here as an example (Fig. 2.2.18). This
estimation method allows us to easily calculate whether the industry within a regional economy experiences
excessive outflow or excessive inflow of goods without conducting any surveys, as long as the ratio of output
of each industry is available. It can be considered useful in gaining an approximate understanding of industries’
characteristics from the viewpoint of finding the type of industries that the relevant region’s economy is based
on.
-4,000-3,000
-2,000-1,000
0
1,000
2,000
3,000
4,000
5,000
Agriculture, forestry and fisheries industry
Mining industry
Manufacturing industry
Construction industry
Electricity, gas and other
Commerce industry
Finance and insurance
Real estate industry
Transport and communications industry
Service industry
Public works
(100 billion yen)
-800-600
-400-200
0
200
400
600
800
1,000(100 billion yen)
Amount of intra-regional production (left scale)Amount of intra-regional demand (left scale)Amount of net inflow and outflow (right scale)
Notes:1. Urban area of Tsuyama indicated here is comprised of Tsuyama City and the towns of Kamo, Kagamino, Shoo, Nagi, Shohoku, Chuo and Yanahara.2. Amount of net inflow and outflow = Amount of intra-regional production - amount of intra-regional demand.3. Industry classifications "agriculture, forestry and fishery industry;" "manufacturing industry;" "electricity, gas and other;" "commerce industry;" and "publicworks," are experiencing excessive outflow of goods in which the amount of intra-regional production overtakes the amount of intra-regional demand. Therefore,under this analysis method, these industries are determined as industries that procure revenue from outside the region. On the other hand, the other industries arefacing an excessive inflow of goods, representing the intra-regional demand leaking outside the region.Source: Based on the report submitted at the Regional Economy Research Group (METI), compiled by Professor Ryohei Nakamura of Okayama University.
Figure 2.2.18 Estimation results of the inflow and outflow of goods by industryfor the urban area of Tsuyama
28 The report submitted by Professor Ryohei Nakamura of Okayama University at the meeting of the Study Group on Regional Economy of the Ministry of Economy, Trade and Industry (METI) has been used as reference.
- 188 -
(Utilizing the regional economic cyclical model)
Under the regional economic cyclical analysis, those industries that sell products to and gain income from
external regions are considered core industries that support the regional economy. In contrast, those which exist
by depending on the circulation of income within the region are considered non-core industries. Conducting
analysis based on such classification clarifies how the income generated by the core industries through the
production and distribution of “goods (and services)” is being circulated within the regional economy that
includes non-core industries. Moreover, analyzing each the flow of people, goods, money and information
using the regional economic cyclical model makes it possible for a region to understand its own characteristics
from the aspect of economic circulation. It can clarify such questions as whether a region has a relatively
cyclical economy or whether it depends more heavily on transactions with other regions, and if so what type of
transactions with other regions in particular are indispensable for the region’s economy, and what type of
transactions are lacking. Furthermore, conducting such analysis according to industry and business type should
be useful in formulating detailed, region-specific industrial policies.
(c) Future issues regarding regional economic analysis
There is no doubt that the regional economic policy of Japan is moving in the direction of each individual
region exercising its knowledge, thinking strategically and efficiently expanding its own industry, thus putting
the regions on track to establish robust regional economic structures. To realize this, we must start by treating
each regional economy as an individual system, and understand its cyclical structure and strengths. This is the
only way in which we can determine in a specific manner “how the local regions can survive” (independence
of regional economy).
To make such an approach possible, it is desirable that the above-mentioned regional economic cyclical
analysis and other methods of analysis and evaluation are established, and that the corresponding statistical data
are made easily accessible. However, in reality, it is difficult to obtain the statistical data necessary to analyze
fully the regional economic cyclical structures for reasons mentioned above. Therefore, the development of
statistical data on “flows” that support the analysis of such regional economic cyclical structures can be
considered issues to tackle in the future. Furthermore, as seen in Figure 2.2.14, in order to conduct a
comprehensive regional economic analysis, not only a regional economic cyclical analysis but
regionally-distinct asset analysis is also necessary. However, its analysis method is still undeveloped, as in the
case of intellectual asset evaluation of businesses. Since the analysis method of regionally distinct assets has
some aspects in common with the intellectual asset evaluation of companies, it is expected that considerations
be made while both areas are together worked on in developing these methods.