Embed Size (px)
Citation preview

331
Section 2 Global value chains
In the previous section, we surveyed trends in Japan’s trade and investments. In their background
lies the flow of goods (GVC: Global Value Chains) that connects Japan’s domestic companies and their
overseas affiliates. Although Japan’s trade includes not a small part which has no relation with GVC, it
is important to grasp the trends, because more than half of the exports of domestic manufacturers are
carried out from parent companies to their overseas affiliates. In this section, we will examine the actual
status of GVC with Japan at its center.
1. Overseas development of Japanese companies
Japanese companies have actively expanded overseas direct investment and pushed forward
overseas development through the establishment of overseas affiliates. According to the data of Basic
Survey on Overseas Business Activities (Ministry of Economy, Trade and Industry), the number of
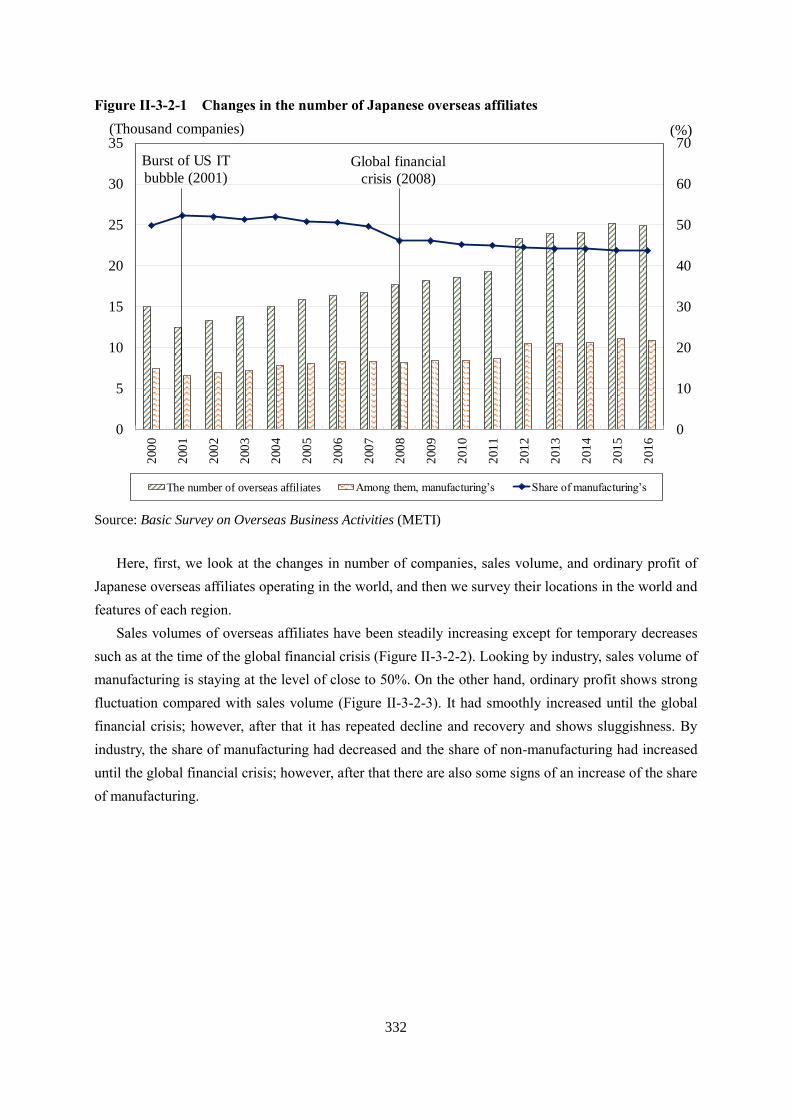
overseas affiliates of Japanese companies has steadily increased as a trend, although it showed a
temporary decline at economic shocks such as the global financial crisis, and currently around 25
thousand companies in total are operating overseas all over the world (manufacturing: around 11
thousand, non-manufacturing: around 14 thousand) (Figure II-3-2-1). Looking at the data by industry,
the number of companies in the manufacturing industry amounts to less than 50%, and since the global
financial crisis the non-manufacturing industry has been gradually increasing its share.242
242 In Figure II-3-2-1, the number of affiliates and sales volume appear to be increasing drastically in
FY2012, because the capturing rate at survey implementation increased.
332
Figure II-3-2-1 Changes in the number of Japanese overseas affiliates
Source: Basic Survey on Overseas Business Activities (METI)
Here, first, we look at the changes in number of companies, sales volume, and ordinary profit of
Japanese overseas affiliates operating in the world, and then we survey their locations in the world and
features of each region.
Sales volumes of overseas affiliates have been steadily increasing except for temporary decreases
such as at the time of the global financial crisis (Figure II-3-2-2). Looking by industry, sales volume of
manufacturing is staying at the level of close to 50%. On the other hand, ordinary profit shows strong
fluctuation compared with sales volume (Figure II-3-2-3). It had smoothly increased until the global
financial crisis; however, after that it has repeated decline and recovery and shows sluggishness. By
industry, the share of manufacturing had decreased and the share of non-manufacturing had increased
until the global financial crisis; however, after that there are also some signs of an increase of the share
of manufacturing.
0
10
20
30
40
50
60
70
0
5
10
15
20
25
30
352
00
0
200
1
200
2
200
3
200
4
200
5
200
6
200
7
200
8
200
9
201
0
201
1
201
2
201
3
201
4
201
5
201
6
The number of overseas affiliates Among them, manufacturing’s Share of manufacturing’s
(Thousand companies)
Global financial
crisis (2008)
(%)
Burst of US IT
bubble (2001)

333
Figure II-3-2-2 Changes in sales of Japanese overseas affiliates
Source: Basic Survey on Overseas Business Activities (METI)
Figure II-3-2-3 Changes in ordinary profit of Japanese overseas affiliates
Source: Basic Survey on Overseas Business Activities (METI)
0
10
20
30
40
50
60
0
50
100
150
200
250
3002
00
0
200
1
200
2
200
3
200
4
200
5
200
6
200
7
200
8
200
9
201
0
201
1
201
2
201
3
201
4
201
5
201
6
Sales amount Among them, manufacturing’s Ratio of manufacturing’s
(Trillion yen)
Global financial
crisis (2008)
(%)
0
10
20
30
40
50
60
70
0
2
4
6
8
10
12
14
200
0
200
1
200
2
200
3
200
4
200
5
200
6
200
7
200
8
200
9
201
0
201
1
201
2
201
3
201
4
201
5
201
6
Ordinary profit Among them, manufacturing’s Ratio of manufacturing’s
(Trillion yen)
Global financial
crisis (2008)
(%)

334
In such circumstances, the overseas production ratio of Japanese manufacturing has been
maintaining an upward trend, and the importance of overseas operation has been increasing (Figure II-
3-2-4). Most recently, the overseas production ratio is 23.8%, so close to a quarter of total production of
Japanese manufacturing in the world is carried out overseas.243 If you focus on Japanese companies
having overseas affiliates, nearly 40% of their production is carried out overseas. By industry,
transportation equipment, general-purpose machinery, information and communication electronics
equipment, etc. are actively expanding overseas operation with high overseas production ratios (Figure
II-3-2-5).
Figure II-3-2-4 Overseas production ratio of Japanese Manufacturing
Note: All domestic corporation bases. Sales of domestic corporations are from data of Financial
Statements Statistics of Corporations by Industry (Ministry of Finance). Solely manufacturers are
picked up for both overseas and domestic.
Overseas production ratio = Sales of overseas affiliates / (sales of overseas affiliates + sales of
domestic corporations)
Source: Basic Survey on Overseas Business Activities (METI)
243 Calculated from FY2016 sales of corporations belonging to the manufacturing. The ratio of sales of
overseas manufacturing affiliates (around 124 trillion yen) against total sales (around 519 trillion yen)
of domestic manufacturing corporations (around 396 trillion yen) and overseas manufacturing
affiliates (around 124 trillion yen).
0
10
20
30
40
50
0
40
80
120
160
200
200
0
200
1
200
2
200
3
200
4
200
5
200
6
200
7
200
8
200
9
201
0
201
1
201
2
201
3
201
4
201
5
201
6
Sales amount of overseas affiliates Overseas ratio (all domestic corporation base)
Overseas ratio (overseas operating corporation base)
(Trillion yen) (%)
Global financial
crisis (2008)
123.6 Trillion yen
23.8%
38.0%

335
Figure II-3-2-5 Overseas production ratio of Japanese manufacturing affiliates (by industry,
FY2016)
Note: All domestic corporation bases. Sales of domestic corporations are from data of Financial Statements
Statistics of Corporations by Industry (MOF). Solely manufacturers are picked up for both overseas
and domestic.
Overseas production ratio = Sales of overseas affiliates / (sales of overseas affiliates + sales of
domestic corporations)
Source: Basic Survey on Overseas Business Activities (METI)
As the destination of overseas operation, the presence of the Asian region is increasing. Looking at
changes in the number of affiliates established by region, in manufacturing industries, the number of
establishments remains unchanged in the U.S. and Europe, but it is increasing in Asia (Figure II-3-2-6).
Among Asian countries, the number in China is increasing remarkably and rapidly, and that in ASEAN
countries is gradually increasing.244
244 In this section, “China” indicates only the mainland and excludes Hong Kong unless otherwise stated.
0
10
20
30
40
50
Tra
nsp
ort
atio
n e
qu
ipm
ent
Gen
eral
-purp
ose
mac
hin
ery
Info
rmati
on
an
d c
om
mu
nic
atio
n
elec
tronic
s eq
uip
men
t
Man
ufa
ctu
rin
g
Non-f
erro
us
met
als
Ch
emic
als
Iron a
nd s
teel
Cer
amic
, st
on
e, a
nd
cla
y p
rod
uct
s
Busi
nes
s ori
ente
d m
achin
ery
Ele
ctri
cal
mac
hin
ery
Pro
du
ctio
n m
ach
iner
y
Mis
cell
aneo
us
indust
ries
Tex
tile
s
Food
Lu
mb
er,
wo
od
, p
aper
, an
d p
ulp
Pet
role
um
and c
oal
Met
al p
rod
uct
s
(%)

336
Figure II-3-2-6 Changes in the number of Japanese overseas affiliates by region of the
establishment
Source: Basic Survey on Overseas Business Activities (METI)
Looking at the most recent point of time (FY2016), about 8,300 companies, nearly 80% of Japanese
manufacturers in the world outside Japan, are located in the Asian region, and particularly many of them
are located in China and ASEAN countries (Table II-3-2-7, Figure II-3-2-8). By industry, machinery
manufacturing industries such as transportation equipment and information and communication
electronics equipment account for one half, followed by iron and steel, chemicals, etc. Also, as we
describe later, not only companies mainly manufacturing final goods but also companies manufacturing
a lot of intermediate goods are developing in the Asian region, which suggests that industrial
agglomerations procuring goods from Japan as well as exchanging intermediate goods in the domestic
local market have been formed. It can be said that as the characteristics in the Asian region there are
many relatively small sized companies compared with companies in the U.S./Europe. In the Asian region,
around 8,200 non-manufacturing companies are located, accounting for close to 60% of Japanese non-
manufacturing companies in the world outside Japan, with smaller share compared with that of
manufacturing. Among the non-manufacturing sector, wholesale trade accounts for more than 50%,
followed by services and transport (Figure II-3-2-9). It can be understood in a way that in Asian countries
manufacturers have expanded as the core, and in most cases the commerce, services, distribution, and
logistics-related industries which support those manufacturers have been developing.
0
1
2
3
4
5
6
0
2
4
6
8
10
12
14
16
200
0
200
1
200
2
200
3
200
4
200
5
200
6
200
7
200
8
200
9
201
0
201
1
201
2
201
3
201
4
201
5
201
6
200
0
200
1
200
2
200
3
200
4
200
5
200
6
200
7
200
8
200
9
201
0
201
1
201
2
201
3
201
4
201
5
201
6
Whole world China (right axis) ASEAN4 (right axis)
U.S. (right axis) Europe (right axis)
(Thousand companies) (Thousand companies)
(Manufacturing) (Non-manufacturing)

337
Table II-3-2-7 The number of Japanese overseas affiliates (FY2016)
(Unit: company)
All
regions U.S. Asia
Europe
China ASEAN10
All industries 24,959 2,998 16,512 6,363 6,662 2,900
Manufacturing industries 10,919 1,109 8,325 3,745 3,345 850
Chemicals 1,107 135 801 316 316 123
Iron and steel/non-ferrous metals
1,260 99 1,056 457 481 37
General-purpose machinery
1,561 179 1,150 568 376 160
Electrical/information and communication machinery
1,710 140 1,378 663 479 131
Transportation equipment
2,364 312 1,606 631 754 207
Non-manufacturing industries
14,040 1,889 8,187 2,618 3,317 2,050
Information and communications
837 138 574 226 251 93
Transport 1,447 97 745 220 381 148
Wholesale trade 7,005 858 4,369 1,426 1,516 1,145
Retail trade 680 95 428 164 150 118
Services 2,346 463 1,246 413 530 342
Source: Basic Survey on Overseas Business Activities (METI)
Figure II-3-2-8 Regional distribution of Japanese overseas affiliates (FY2016)
0% 20% 40% 60% 80% 100%
Manufacturing
Non-
manufacturing
Asia U.S. Europe Others
338
Source: Basic Survey on Overseas Business Activities (METI)
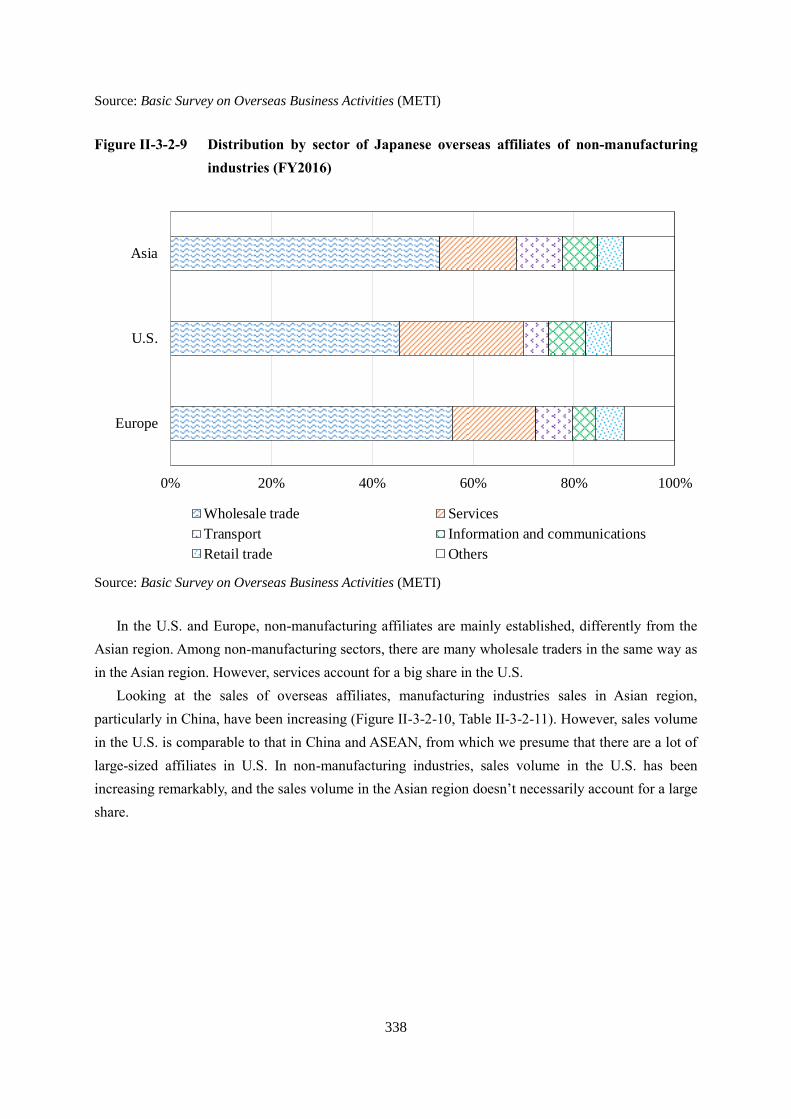
Figure II-3-2-9 Distribution by sector of Japanese overseas affiliates of non-manufacturing
industries (FY2016)
Source: Basic Survey on Overseas Business Activities (METI)
In the U.S. and Europe, non-manufacturing affiliates are mainly established, differently from the
Asian region. Among non-manufacturing sectors, there are many wholesale traders in the same way as
in the Asian region. However, services account for a big share in the U.S.
Looking at the sales of overseas affiliates, manufacturing industries sales in Asian region,
particularly in China, have been increasing (Figure II-3-2-10, Table II-3-2-11). However, sales volume
in the U.S. is comparable to that in China and ASEAN, from which we presume that there are a lot of
large-sized affiliates in U.S. In non-manufacturing industries, sales volume in the U.S. has been
increasing remarkably, and the sales volume in the Asian region doesn’t necessarily account for a large
share.
0% 20% 40% 60% 80% 100%
Asia
U.S.
Europe
Wholesale trade Services
Transport Information and communications
Retail trade Others

339
Figure II-3-2-10 Sales changes of Japanese overseas affiliates by region
Source: Basic Survey on Overseas Business Activities (METI)
Source: Basic Survey on Overseas Business Activities (METI)
0
10
20
30
40
50
60
0
30
60
90
120
150
18020
00
20
01
20
02
20
03
20
04
20
05
20
06
20
07
20
08
20
09
20
10
20
11
20
12
20
13
20
14
20
15
20
16
(Manufacturing)
Whole world China (right axis) ASEAN4 (right axis)
U.S. (right axis) Europe (right axis)
(Trillion yen) (Trillion yen)
Global financial
crisis (2008)
0
10
20
30
40
50
60
0
30
60
90
120
150
180
20
00
20
01
20
02
20
03
20
04
20
05
20
06
20
07
20
08
20
09
20
10
20
11
20
12
20
13
20
14
20
15
20
16
(Non-manufacturing)
Whole world China (right axis) ASEAN4 (right axis)
U.S. (right axis) Europe (right axis)
(Trillion yen) (Trillion yen)
Global financial
crisis (2008)

340
Table II-3-2-11 Sales of Japanese overseas affiliates (FY2016)
(Unit: billion yen)
All
regions U.S. Asia
Europe
China ASEAN10
All industries 257,647 80,759 111,885 39,701 50,253 36,561
Manufacturing industries
123,636 30,316 67,203 27,419 28,340 13,156
Food/textiles/lumber 7,598 1,213 4,643 2,775 1,561 835
Chemicals 8,840 2,509 4,100 882 1,932 1,625
Iron and steel/non-ferrous metals
6,809 965 4,603 1,994 2,141 582
General-purpose machinery
9,662 2,376 5,634 2,583 1,992 1,455
Electrical/information and communication machinery
18,113 3,558 12,623 5,304 4,162 1,656
Transportation equipment
64,267 17,043 31,590 12,468 14,653 5,533
Non-manufacturing industries
134,011 50,443 44,683 12,282 21,913 23,404
Information and communications
2,844 530 943 162 505 1,312
Transport 2,788 359 1,381 536 593 308
Wholesale trade 95,198 33,283 35,254 10,044 16,534 19,344
Retail trade 8,066 5,455 1,826 578 696 414
Services 11,830 7,117 3,181 557 2,131 757
Note: Small-sized sectors are combined. For example, General-purpose machinery shows the total of
general-purpose machinery, production machinery, and business oriented machinery.
Source: Basic Survey on Overseas Business Activities (METI)
Although annual ordinary profit has been fluctuating greatly, the manufacturing industries have been
expanding profit in the Asian region, and the non-manufacturing industries account for a large share in
the U.S., in the same way as with sales (Figure II-3-2-12, Table II-3-2-13). However, particularly in the
non-manufacturing industries, after the global financial crisis, profit has not grown as expected in the
Asian region and Europe.

341
Figure II-3-2-12 Ordinary profit of Japanese overseas affiliates by region
Source: Basic Survey on Overseas Business Activities (METI)
Table II-3-2-13 Ordinary profit of Japanese overseas affiliates by main industry/ region
(FY2016)
(Unit: billion yen)
All
regions U.S. Asia
Europe
China ASEAN10
All industries 12,221 2,618 6,208 2,424 2,676 1,281
Manufacturing industries 6,712 1,232 4,479 1,889 1,818 507
Food/textiles/lumber 501 91 280 129 117 77
Chemicals 1,170 494 353 65 167 160
Iron and steel/non-ferrous metals
234 60 155 61 78 17
General-purpose machinery
517 113 348 162 134 57
Electrical/information and communication machinery
665 93 550 237 205 18
Transportation equipment
3,237 346 2,486 1,114 996 142
Non-manufacturing industries
5,508 1,386 1,729 535 857 774
Information and communications
95 6 29 8 4 57
Transport 119 17 46 19 17 25
Wholesale trade 2,282 597 1,211 431 543 272
0
1
2
3
4
0
2
4
6
8
1020
00
20
01
20
02
20
03
20
04
20
05
20
06
20
07
20
08
20
09
20
10
20
11
20
12
20
13
20
14
20
15
20
16
20
00
20
01
20
02
20
03
20
04
20
05
20
06
20
07
20
08
20
09
20
10
20
11
20
12
20
13
20
14
20
15
20
16
Whole world China (right axis) ASEAN4 (right axis)
U.S. (right axis) Europe (right axis)
(Trillion yen) (Trillion yen)
Global financial
crisis (2008)
Global financial
crisis (2008)
(Manufacturing) (Non-manufacturing)

342
Retail trade 93 63 14 ▲ 14 20 11
Services 791 414 245 50 149 186
Notes: 1. Small-sized sectors are combined. For example, General-purpose machinery shows the total of
general-purpose machinery, production machinery, and business oriented machinery.
2. In case of concealed data, numerical values are displayed substituting with similar data to the
utmost. For example, the U.S.’s data are substituted with North America’s.
Source: Basic Survey on Overseas Business Activities (METI)
Further, moving forward from by region to by country, the number of affiliates in China is
remarkably the most, followed by Asian counties such as Thailand, Indonesia, and Vietnam (Figure II-
3-2-14). Actually, among the top ten countries, nine of them are Asian countries. Also, sales volume is
displayed as well; two countries, the U.S. (the top) and China (second) are remarkable, leaving followers,
Thailand (third) and others, in the far distance. Looking at the top 10 countries for sales, in addition to
Asian countries, Mexico (fifth) and Canada (seventh) are listed. This suggests the existence of GVC
with the U.S. at its center. Among European countries U.K. (ninth) is listed as one of the top 10 countries.
Figure II-3-2-14 Development of Japanese manufacturing overseas affiliates by country
(FY2016)
Note: Top 20 countries/areas are displayed in descending order of the number of affiliates.
Source: Basic Survey on Overseas Business Activities (METI)
We look at the profit ratio of Japanese overseas affiliates. In FY2016, ordinary profit ratio in the
Asian region is on a level higher than the U.S. and Europe (Figure II-3-2-15). By industry, the ratio of
the manufacturing is higher than that of non-manufacturing, for all regions.
0
10
20
30
40
0
1
2
3
4
Ch
ina
Th
aila
nd
U.S
.
Indon
esia
Vie
tnam
Mal
aysi
a
Taiw
an
Repub
lic
of
Kore
a
Ph
ilip
pin
es
India
Ho
ng K
ong
Sin
gapore
Mex
ico
U.K
.
Bra
zil
Germ
any
Fra
nce
Canad
a
Neth
erl
ands
Italy
The number of affiliates
Sales amount (right axis)
(Thousand companies) (Trillion yen)
(1)
(6)
(4)
(3)
(2)
(9)(8) (10) (7)(5)
* Countries are listed in descending order
of the number of affiliates.
For reference, the order of sales amount is displayed in the parentheses.

343
Figure II-3-2-15 Ordinary profit ratio of Japanese overseas affiliates (FY2016)
Source: Basic Survey on Overseas Business Activities (METI)
2. Development of GVC with Asia in its center
Our examination has shown that Japanese overseas affiliates have been expanding in both number
of affiliates and sales volume in the Asian region, with manufacturing at the center. From here we move
the analysis forward while focusing on Japanese overseas affiliates in the Asian region.
First, we will look at features (part suppliers or contractors of assembling work, size of enterprises,
intra-firm transaction ratio, etc.) of Japanese manufacturing overseas affiliates operating in the Asian
region in comparison with affiliates located in Europe and the U.S.
Then we examine the GVC with Asia at its center from two viewpoints. Firstly, from the viewpoint
of Japanese overseas affiliates, we will consider procurement from Japan, sales destinations of products,
etc. Secondly, from the viewpoint of value added exported from Japan, we survey final demand places,
and the flow of Japan’s value added.
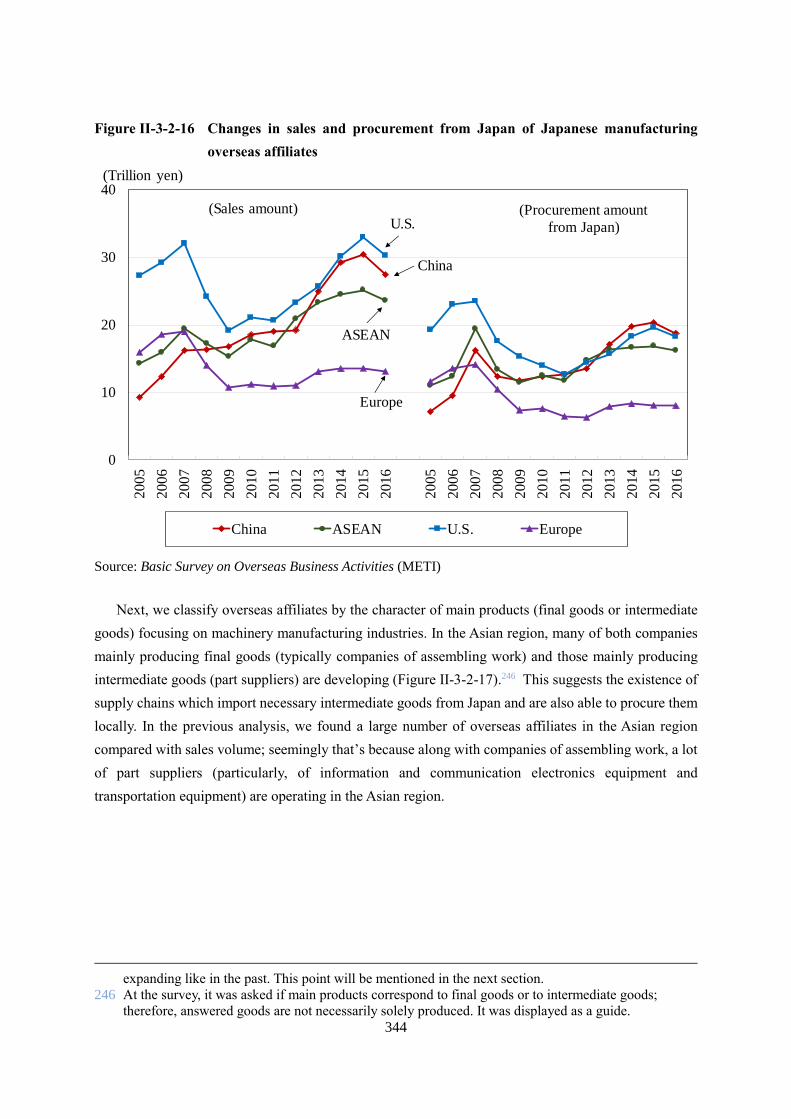
To begin with, from the viewpoint of Japanese manufacturing overseas affiliates, we look at sales
volume and procurement volume from Japan (exports from Japan) by location region. Initially, sales of
overseas affiliates located in the U.S. accounted for a large share; however, it drastically declined
triggered by the global financial crisis, and the current situation indicates that sales in the Asian region,
particularly in China, have been catching up (Figure II-3-2-16). In addition to the increase of sales of
overseas affiliates in the Asian region, their procurement amount from Japan has also been expanding
in general.245
245 Taking a closer look, as local procurement has expanded, procurement from Japan has not been
0
2
4
6
8
10
All regions U.S. Asia China ASEAN Europe
Total Manufacturing Non-manufacturing
(%)
344
Figure II-3-2-16 Changes in sales and procurement from Japan of Japanese manufacturing
overseas affiliates
Source: Basic Survey on Overseas Business Activities (METI)
Next, we classify overseas affiliates by the character of main products (final goods or intermediate
goods) focusing on machinery manufacturing industries. In the Asian region, many of both companies
mainly producing final goods (typically companies of assembling work) and those mainly producing
intermediate goods (part suppliers) are developing (Figure II-3-2-17).246 This suggests the existence of
supply chains which import necessary intermediate goods from Japan and are also able to procure them
locally. In the previous analysis, we found a large number of overseas affiliates in the Asian region
compared with sales volume; seemingly that’s because along with companies of assembling work, a lot
of part suppliers (particularly, of information and communication electronics equipment and
transportation equipment) are operating in the Asian region.
expanding like in the past. This point will be mentioned in the next section.
246 At the survey, it was asked if main products correspond to final goods or to intermediate goods;
therefore, answered goods are not necessarily solely produced. It was displayed as a guide.
0
10
20
30
40
20
05
2006
2007
20
08
2009
20
10
2011
20
12
2013
2014
20
15
2016
2005
2006
2007
2008
20
09
2010
20
11
2012
2013
2014
2015
20
16
China ASEAN U.S. Europe
(Trillion yen)
(Sales amount) (Procurement amount
from Japan)U.S.
Europe
China
ASEAN

345
Figure II-3-2-17 The number of Japanese overseas affiliates (machinery manufacturing) by
main products (FY2016)
Notes: 1. Asked if main products are final goods or intermediate goods.
2. Here, manufacturing companies of machinery are displayed. About 9,000 manufacturers
answered, and among them, machinery manufacturers total about 4,700 companies.
3. General-purpose machinery indicates the total of general-purpose machinery, production
machinery, and business oriented machinery.
Source: Basic Survey on Overseas Business Activities (METI)
Actual comparison of company size of overseas affiliates (manufacturing) by location region is
displayed in Figure II-3-2-18. It can be seen that affiliates established in the Asian region account for a
greater share of companies with a small-sized capital base in comparison with affiliates in Europe and
the U.S.
0
200
400
600
800
1,000
1,200
Final goods Intermediategoods
Final goods Intermediategoods
Final goods Intermediategoods
Final goods Intermediategoods
China ASEAN4 U.S. Europe
General machinery
Electrical machinery
Information and communication electronicsequipment
Transportation equipment
(Companies)

346
Figure II-3-2-18 Distribution of company size of Japanese overseas affiliates (FY2016)
Source: Basic Survey on Overseas Business Activities (METI)
Further, let’s consider from the standpoint of parent companies in Japan. Overseas affiliates’
procurement from Japan corresponds to the export of intermediate goods such as key components to
overseas affiliates from the standpoint of parent companies. Export to affiliated companies (intra-
company transactions), which have capital relationships in general, account for a large share of export
of domestic manufacturers.247 According to Basic Survey of Japanese Business Structure and Activities
(METI), the exports of domestic manufacturers to overseas affiliates accounted for 56% of their total
exports in FY2016 (Figure II-3-2-19).
247 In Basic Survey of Japanese Business Structure and Activities, parent companies, affiliates, and
associated companies are regarded as affiliated companies. Here, affiliates are companies of which
more than 50% of voting rights are owned by a company (parent company). Also, affiliates encompass
a company of which more than 50% of voting rights are owned by the affiliates or by the parent
company and the affiliates in total, and a company which is substantially controlled over its operations
even when 50% or less of voting rights are owned. Associated companies are companies of which
voting rights of 20% or more and 50% or less are owned by a company (parent company). Also, a
company on which the parent company has great effect through owning 15% or more of its voting
rights is considered an associated company. Additionally, in the case of foreign-affiliated companies
located in Japan, exports to affiliated companies includes exports to its parent company located in its
home country.
0
10
20
30
40
50
10 million
or less
10 - 30
million30 – 50
million
50 – 100
million
100 – 300
million
300 –
1,000
million
1 – 10
billion
10 – 100
billion
More than
100 billion
Asia
Europe
U.S.
(%)
The share of affiliates with a small-sized
capital base in Asia is higher than that in
Europe and U.S.

347
Figure II-3-2-19 Exports of domestic manufacturing companies (to affiliated/non-affiliated
companies)
Source: Basic Survey of Japanese Business Structure and Activities (METI)
Looking over time, because exports to non-affiliated companies increased faster in the 2000s until
the global financial crisis, the share of exports to affiliated companies gradually decreased. However,
after the global financial crisis, while exports to non-affiliated companies didn’t grow as expected,
exports to affiliated companies increased steadily. As a result, the share of exports to affiliated companies
(intra-company transactions) has been increasing.
Looking at the share to affiliated companies by location regions, the share to the affiliates in North
America is the largest, followed by the share to those in Europe. The share to affiliates in the Asian
region and China is relatively small. The share to affiliated companies has remained on an upward trend
in the all regions of Asia, North America, and Europe since 2011, although it decreased in Asia in 2016
(Figure II-3-2-20).
0
10
20
30
40
50
60
70
0
10
20
30
40
50
60
70
200
0
200
1
200
2
200
3
200
4
200
5
200
6
200
7
200
8
200
9
201
0
201
1
201
2
201
3
201
4
201
5
201
6
Export amount Among them, export to affiliates
Among them, export to non-affiliates Share (right axis)
(Trillion yen) (%)
Great East Japan
Earthquake (2011)
Global financial
crisis (2008)

348
Figure II-3-2-20 Ratio of exports to affiliated companies of domestic manufacturing companies
Source: Basic Survey of Japanese Business Structure and Activities (METI)
By industry type, the share to affiliated companies in the machinery-related sector, such as electronic
components, transportation equipment, electrical machinery, and information and communication
electronics equipment, is large, which suggests the possibility that an international division of work
within a company group is being carried out. On the contrary, the share to affiliated companies in the
materials-related sector, such as lumber/wooden products, metal products, plastics, ceramics/clay/stone,
non-ferrous metals, and leather, is small (Figure II-3-2-21).
30
40
50
60
70
80
2009 2010 2011 2012 2013 2014 2015 2016
Whole world Asia Among them, China Europe North America
(%)

349
Figure II-3-2-21 Exports to affiliated companies of domestic manufacturing companies
(FY2016)
Source: Basic Survey of Japanese Business Structure and Activities (METI)
Let’s take into consideration GVC of those Japanese manufacturing overseas affiliates. The
development of Japanese manufacturing overseas affiliates by region, their sales volume by location
region, procurement amount from Japan, etc. are displayed in Figure II-3-2-22. As we have already
examined, overseas affiliates of Japanese manufacturing are mostly developing in the Asian region and
the sales volume is also large in the region.
0
10
20
30
40
50
60
70
Ele
ctro
nic
co
mp
on
ents
Ru
bb
er p
rod
ucts
Tra
nsp
ort
atio
n e
qu
ipm
ent
Ele
ctri
cal
mac
hin
ery
Info
rmati
on a
nd c
om
munic
atio
n
elec
tro
nic
s eq
uip
men
t
Pro
duct
ion m
achin
ery
Pet
role
um
and c
oal
Bu
sin
ess
ori
ente
d m
ach
inery
Tex
tile
s
Iro
n a
nd
ste
el
Bev
erag
es a
nd
cig
aret
tes
Gen
eral
-purp
ose
mac
hin
ery
Chem
ical
s
Pulp
and p
aper
Lea
ther
No
n-f
erro
us
met
als
Cer
amic
, st
on
e, a
nd
cla
y p
rod
uct
s
Fo
od
Pla
stic
s
Met
al p
roduct
s
Furn
iture
Pri
nti
ng
Lu
mb
er,
wo
od
en p
rod
uct
s
(%)

350
Figure II-3-2-22 Sales/procurement of Japanese manufacturing overseas affiliates (FY2016)
Source: Basic Survey on Overseas Business Activities (METI)
It is considered that intermediate goods such as key components are supplied from parent companies
in Japan, which correspond to starting points of GVC, to overseas affiliates. For example, in the Figure,
Japanese manufacturing affiliates in China are procuring goods of 3.5 trillion yen from Japan. In that
case, Japanese affiliates are utilizing not only the intermediate goods procured from Japan but also
intermediate goods procured locally. The products are sold locally as well as exported to the same region,
Japan, Europe, and America. In the case in China, among total sales of around 27 trillion yen, around
15 trillion yen is sold locally in China, around 7 trillion yen to the Asian region, and around 5 trillion
yen to Japan. On this occasion, some overseas affiliates supply intermediate goods also to other overseas
affiliates. Such a series of flow of goods corresponds to GVC.
First, let’s think about the procurement from Japan. Japanese manufacturing overseas affiliates are
purchasing just over 20% of required materials for production activities from Japan, almost
independently of their location (Figure II-3-2-23). As other supply sources, local sources within the
country account for the greatest share, and sources in the same region (for example, if located in Asia,
sources in the Asian region) come in second place. Additionally, in Europe where economic integration
is advancing, procurement within the European region is reaching a scale comparable to local
procurement in the country. The share of procurement from Japan is showing a tendency to gradually
decrease annually (details about this point will be mentioned in the next section).

351
Figure II-3-2-23 Supply sources of Japanese manufacturing overseas affiliates (FY2016)
Source: Basic Survey on Overseas Business Activities (METI)
When we consider the region as a sales market, domestic sales in the location country are generally
the highest for affiliates in all regions of Asia, North America, and Europe, and sales to the same region
where the affiliates are located are the next. In case of Asia, exports to Japan are also large. In case of
North America and Europe, exports to Japan are limited. The supposed reason is that there are large
local markets in North America and Europe and significant transportation cost is required for export to
Japan because of the long distance. On the other hand, sales crossing over regional borders such as from
Asia to North America are unexpectedly small compared with the entire sales scale.
Looking at the details, we find that there is difference of composition of the sales market depending
on the region of their location. For example, domestic sales of Japanese manufacturing affiliates located
in the U.S. are overwhelmingly large, reflecting the large U.S. market (Figure II-3-2-24). However, after
the global financial crisis, both volume and share of domestic sales have declined drastically.
Nevertheless, most recently, domestic sales accounted for around 70%, and sales to other North
American countries (Canada) accounted for around 20%. Whereas, in the case of location in Europe,
domestic sales and sales to the European region are close to even, and the supposed reason is the
liberalization of cross-border movement of people, goods, and capital. Further, the share of the European
region has been gradually increasing in the 2010s. Shares of sales to North America, Asia, and Japan are
also increasing, although slightly.
0% 20% 40% 60% 80% 100%
Europe
U.S.
Among them, ASEAN
Among them, China
Asia
Japan Location country North America Asia Europe Others

352
Figure II-3-2-24 Changes in sales by market region of Japanese manufacturing overseas
affiliates
Japanese manufacturing affiliates located in Asia have been clearly showing an increasing trend of
sales in comparison with those in Europe and America; sales have been increasing with particularly local
domestic sales at the center. As a result, shares of sales to Japan, Asia, Europe, and America have
0
10
20
30
40
50
0
20
40
60
80
100
200
0
200
2
200
4
200
6
200
8
201
0
201
2
201
4
201
6
200
0
200
2
200
4
200
6
200
8
201
0
201
2
201
4
201
6
200
0
200
2
200
4
200
6
200
8
201
0
201
2
201
4
201
6
(Sales amount)
Sales amount Local, domestic (right axis) Japan (right axis)
Asia (right axis) North America (right axis) Europe (right axis)
(Trillion yen)
(U.S.)(Asia)
(Trillion yen)
(Europe)
0
20
40
60
80
100
0
20
40
60
80
100
200
0
200
2
200
4
200
6
200
8
201
0
201
2
201
4
201
6
200
0
200
2
200
4
200
6
200
8
201
0
201
2
201
4
201
6
200
0
200
2
200
4
200
6
200
8
201
0
201
2
201
4
201
6
(Share of sales amount)
Sales amount Local, domestic (right axis) Japan (right axis)
Asia (right axis) North America (right axis) Europe (right axis)
(U.S.)
(Trillion yen) (%)
(Asia) (Europe)

353
decreased and shares of domestic sales have been increasing. However, there is also a tendency of
increasing share of sales to the Asian region since 2012. Most recently, local domestic sales accounted
for around 50%, sales within Asia accounted for just over 20% and sales to Japan accounted for just
under 20%. Sales to North America and Europe from outside of the region were limited to 1-2%
respectively.
There are concerns that overseas affiliates could be affected by the U.S.’s trade restrictive measures
against China. Here, we survey Japanese companies located in China, focusing on manufacturing
industries. The number of manufacturing affiliates located in China is around 3,700, and their sales
volume is around 27.4 trillion yen (as of FY2016). Looking at sales destination, local sales accounted
for more than half and exports accounted for 44.9% (Table II-3-2-25). Among the exports, exports to
Asia (excluding Japan) accounted for 24.4%, exports to Japan accounted for 16.7%, and exports to North
America (U.S. and Canada) accounted for 1.1%. The volume of direct exports to North America is
limited, although it cannot be said definitely, because there may be also effects through supply chains
as in a case where some intermediate goods might be sold to other affiliates in China (a part of domestic
sales) and their finished goods might be exported.
Table II-3-2-25 Sales partners of Japanese manufacturing affiliates in China (FY2016)
(Unit: %)
Share
Local sales 55.1
Exports 44.9
Japan 16.7
North America 1.1
Asia 24.4
Europe 1.8
Others 0.9
Note: North America is composed of the U.S. and Canada.
Source: Basic Survey on Overseas Business Activities (METI)
Further, the degree of the impact by industry including the volume of procurement from Japan and
sales to North America is illustrated in Figure II-3-2-26. The vertical axis reflects share of exports to
North America against total sales, the horizontal axis reflects share of procurement from Japan against
total procurement volume, and the size of circle reflects the volume of exports to North America.
Industries located on the upper side of the vertical axis are more susceptible to the U.S.’s trade restrictive
measures against China, and industries located further to the right on the horizontal axis have a higher
possibility of having an impact on procurement from Japan (exports to China from Japan). Naturally,
the larger the circle, the larger the impact that could be caused. Looking at this Figure, by industries,
exports of transportation equipment to North America are the highest, followed by information and
communication electronics equipment and electrical machinery. Among them, export share of electrical
machinery to North America is relatively high. Information and communication electronics equipment
can be easily affected by procurement from Japan (export to China from Japan), as more than 40% of

354
materials are procured through import from Japan.
Figure II-3-2-26 Exports to North America by main industries of Japanese manufacturing
affiliates in China (FY2016)
Notes: 1. China indicates only the mainland. However, transportation equipment is indicated by substituted
data including Hong Kong. North America is composed of the U.S. and Canada.
2. The size of circle reflects export volume to North America.
Source: Basic Survey on Overseas Business Activities (METI)
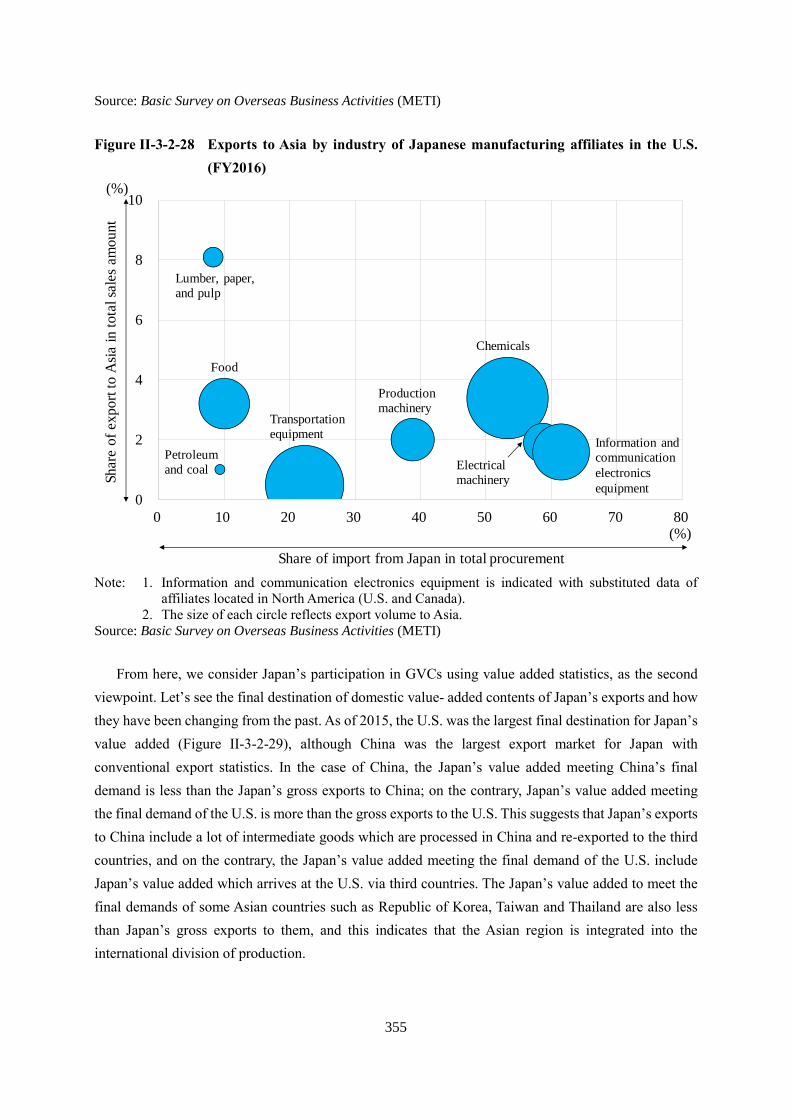
In the same way, Japanese manufacturing affiliates located in the U.S. are indicated in Table II-3-2-
27. The number of Japanese manufacturing affiliates is around 1,100, and their sales volume is around
30.3 trillion yen. Local sales accounted for around 70%, most exports are for Canada, and exports to
Asia accounted for 1.6%. By main industry, chemicals, transportation equipment, and information and
communication electronics equipment account for large shares (Figure II-3-2-28).
Table II-3-2-27 Sales partners of Japanese manufacturing affiliates in the U.S. (FY2016)
(Unit: %)
Share
Local sales 69.4
Exports 30.6
Japan 1.9
Canada 23.8
Asia 1.6
Europe 1.6
Others 1.8
0
1
2
3
4
5
0 10 20 30 40 50
Share
of
export
to U
.S.
in t
ota
l sa
les
am
ount
(%)
(%)
Share of import from Japan in total procurement
FoodTransportation
equipment
Textiles
Business
oriented
machinery
Non-ferrous
metals
General-purpose
machinery
Production
machinery
Metal products
Electrical
machinery
Information and
communication
electronics equipmentChemicals
Ceramic, stone,
and clay products
Iron and
steel
355
Source: Basic Survey on Overseas Business Activities (METI)
Figure II-3-2-28 Exports to Asia by industry of Japanese manufacturing affiliates in the U.S.
(FY2016)
Note: 1. Information and communication electronics equipment is indicated with substituted data of
affiliates located in North America (U.S. and Canada).
2. The size of each circle reflects export volume to Asia.
Source: Basic Survey on Overseas Business Activities (METI)
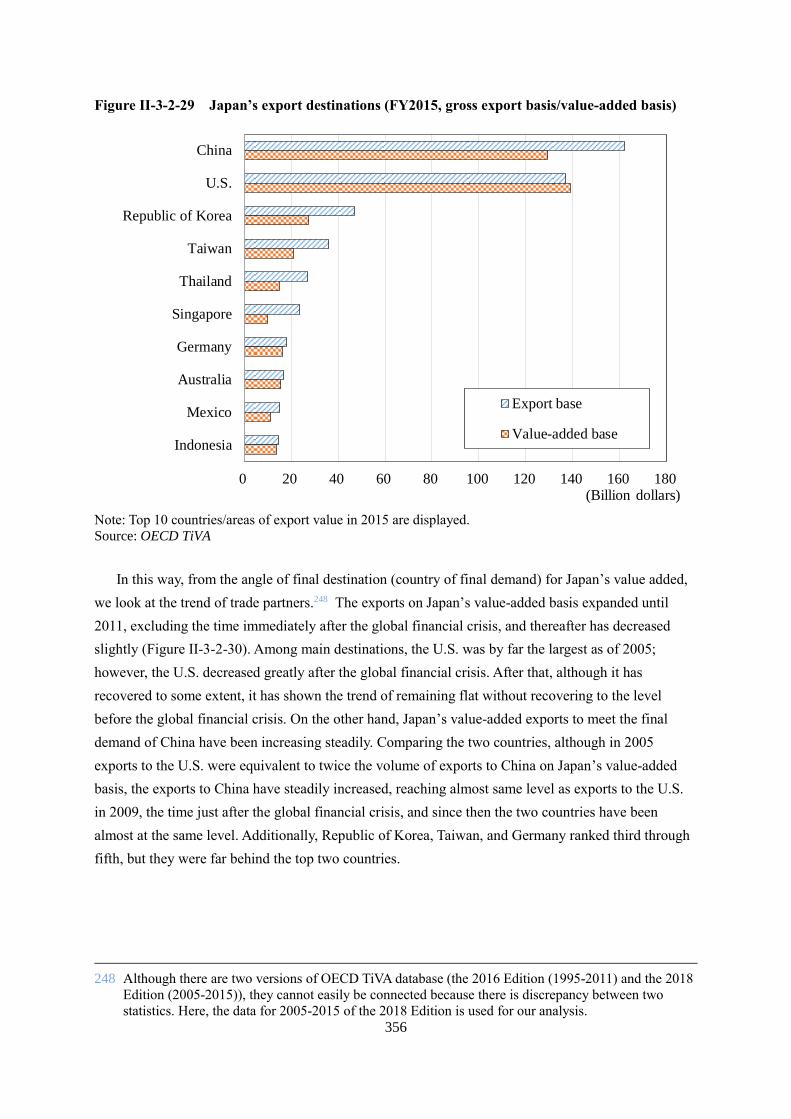
From here, we consider Japan’s participation in GVCs using value added statistics, as the second
viewpoint. Let’s see the final destination of domestic value- added contents of Japan’s exports and how
they have been changing from the past. As of 2015, the U.S. was the largest final destination for Japan’s
value added (Figure II-3-2-29), although China was the largest export market for Japan with
conventional export statistics. In the case of China, the Japan’s value added meeting China’s final
demand is less than the Japan’s gross exports to China; on the contrary, Japan’s value added meeting
the final demand of the U.S. is more than the gross exports to the U.S. This suggests that Japan’s exports
to China include a lot of intermediate goods which are processed in China and re-exported to the third
countries, and on the contrary, the Japan’s value added meeting the final demand of the U.S. include
Japan’s value added which arrives at the U.S. via third countries. The Japan’s value added to meet the
final demands of some Asian countries such as Republic of Korea, Taiwan and Thailand are also less
than Japan’s gross exports to them, and this indicates that the Asian region is integrated into the
international division of production.
0
2
4
6
8
10
0 10 20 30 40 50 60 70 80
Sh
are
of
ex
po
rt to
Asi
a i
n t
ota
l sa
les
am
ou
nt
(%)
(%)
Share of import from Japan in total procurement
Transportation
equipment
Petroleum
and coal
Food
Production
machinery
Lumber, paper,
and pulp
Electrical
machinery
Information and
communication
electronics
equipment
Chemicals
356
Figure II-3-2-29 Japan’s export destinations (FY2015, gross export basis/value-added basis)
Note: Top 10 countries/areas of export value in 2015 are displayed.
Source: OECD TiVA
In this way, from the angle of final destination (country of final demand) for Japan’s value added,
we look at the trend of trade partners.248 The exports on Japan’s value-added basis expanded until
2011, excluding the time immediately after the global financial crisis, and thereafter has decreased
slightly (Figure II-3-2-30). Among main destinations, the U.S. was by far the largest as of 2005;
however, the U.S. decreased greatly after the global financial crisis. After that, although it has
recovered to some extent, it has shown the trend of remaining flat without recovering to the level
before the global financial crisis. On the other hand, Japan’s value-added exports to meet the final
demand of China have been increasing steadily. Comparing the two countries, although in 2005
exports to the U.S. were equivalent to twice the volume of exports to China on Japan’s value-added
basis, the exports to China have steadily increased, reaching almost same level as exports to the U.S.
in 2009, the time just after the global financial crisis, and since then the two countries have been
almost at the same level. Additionally, Republic of Korea, Taiwan, and Germany ranked third through
fifth, but they were far behind the top two countries.
248 Although there are two versions of OECD TiVA database (the 2016 Edition (1995-2011) and the 2018
Edition (2005-2015)), they cannot easily be connected because there is discrepancy between two
statistics. Here, the data for 2005-2015 of the 2018 Edition is used for our analysis.
0 20 40 60 80 100 120 140 160 180
China
U.S.
Republic of Korea
Taiwan
Thailand
Singapore
Germany
Australia
Mexico
Indonesia
Export base
Value-added base
(Billion dollars)

357
Figure II-3-2-30 Changes in Japan’s value-added exports by final destination
Note: Top 5 countries/regions of Japan’s value-added exports in 2015 are displayed.
Source: OECD TiVA
Also, we look at the changes in the foreign value-added content of Japan’s exports and Japan’s value-
added content of the other countries’ exports. Looking at the share of value-added content of Japan’s
exports (in global total) by major source countries, although Japan’s share is the largest, it gradually
decreased during the period from 2005 through 2015 and the shares of foreign source countries such as
China have been increasing (Figure II-3-2-31).
0
40
80
120
160
200
0
200
400
600
800
1,000
2005 2006 2007 2008 2009 2010 2011 2012 2013 2014 2015
Whole world U.S. (right axis) China (right axis)
Republic of Korea (right axis) Taiwan (right axis) Germany (right axis)
(Billion dollars) (Billion dollars)
Global financial
crisis (2008)

358
Figure II-3-2-31 Shares of value-added content of Japan’s exports by major source
countries/regions
Source: OECD TiVA
On the other hand, we look at the example of China for the share of Japan’s value-added content in
the others countries’ exports. Concerning the exports from China (in global total), China’s value-added
share has been increasing and Japan’s share has been decreasing (Figure II-3-2-32). However, the shares
of the U.S. and other countries are also showing a similar declining tendency. There is a possibility that
China’s local companies have been growing and local procurement by major foreign affiliates is making
progress. In addition, China’s value added includes those produced by Japanese affiliates located in
China.
0
1
2
3
4
5
0
200
400
600
800
1,000
2005 2006 2007 2008 2009 2010 2011 2012 2013 2014 2015
Total value-added export China (right axis) U.S. (right axis)
Australia (right axis) Republic of Korea (right axis) Germany (right axis)
Indonesia (right axis) Russia (right axis) Taiwan (right axis)
U.K. (right axis) Japan (right axis; the scale of 20 times)
(Billion dollars) (%)
(100)
(20)
(40)
(60)
(80)
86.889.8
2.5
1.5
1.2
1.4

359
Figure II-3-2-32 Share of value-added content in China’s exports by major source
countries/regions
Note: Top 7 countries/regions of value added are displayed. Only for China, the tenfold scale is applied.
Source: OECD TiVA
Expanding the viewpoint further, the main movements of Japan’s value added around the world
are illustrated in Figure II-3-2-33. Arrows indicate Japan’s value added in the exports of each
country/region. In addition, the chart shows total volume of value added imported from Japan and, as a
part of it, final demand volume for final consumption/capital investment in the country/region. It is
considered that the Japan’s value added not demanded in the country/region is re-exported, in the form
of products which are processed/assembled with intermediate goods of Japan.249
249 It appears that increase/decrease of inventory in the country/region, errors, etc. are partly included.
0
2
4
6
8
10
0
500
1,000
1,500
2,000
2,500
2005 2006 2007 2008 2009 2010 2011 2012 2013 2014 2015
Export amount China (right axis; the scale of 10 times) Republic of Korea (right axis)
U.S. (right axis) Japan (right axis) Taiwan (right axis)
Australia (right axis) Germany (right axis)
(Billion dollars) (%)
(20)
(40)
(60)
(80)
(100)
83%

360
Figure II-3-2-33 Flow of Japan’s value added around the world
Source: OECD TiVA
As destinations of Japan’s exports on a value-added basis, the U.S. and China are remarkably large,
followed by Republic of Korea, Taiwan, and East Asian countries such as members of ASEAN. In the
case of East Asia, generally speaking, a large part of imported value added from Japan is re-exported in
the form of processed/assembled products, suggesting that international division of production is going
on in the background.250 In addition, naturally, Japan’s value-added share in the export volume from
Japan is large and Japan’s value-added share in the re-export volume from East Asian countries is small.
Looking at the movement of Japan’s value added being re-exported in this way, the flow of GVCs
from Japan through China reaching the U.S. can be seen as mentioned in the Section 2 of Chapter 1. In
addition, the flow from Japan through ASEAN or Mexico reaching the U.S./EU can also be seen. Within
the East Asia, Japan’s value added is moving around countries participated in GVCs.
We should also be careful for the Japan’s value added, which are demanded as final consumption or
gross capital formation in individual country. For example, in case of exports from Japan to China,
Japan’s value added used for gross capital formation within China is larger than Japan’s value added
included in the exports from China to the U.S. This is consistent with recent trends in Japan’s exports
to China, not only the exports of electronic components decreased, but also the exports of semiconductor
250 In the case of China, there is some discrepancy of numerical values between Japan-side’s value-added
exports to China (139.2 billion dollars) and China-side’s value-added imports from Japan (91.3 billion
dollars). Here, in order to display China’s imports from individual countries, China-side’s value-added
import data are used in a unified manner, although there is a possibility of underestimation.

361
manufacturing equipment and machine tools are influenced, as we have seen in Section 1 of this Chapter.

362
Column 9 Worldwide activities of US enterprise
(1) The number of U.S. companies operating overseas
In this section so far we analyze overseas development of Japanese companies; with that in mind,
here we survey the movement of overseas development of U.S. multinational companies.251
As with Japanese companies, U.S. multinational companies have also been actively developing
overseas, with about 34.9 thousand companies operating overseas as of 2016 (preliminary figures).
Compared with the situation as of 2001, the number of overseas affiliates has increased by nearly
13,000. Looking at recent trends, the number of about 34.3 thousand in 2014 steadily increased to about
34.5 thousand in 2015 (Figure Column 9-1). Also, U.S. direct overseas investment balance has been on
an increasing trend from the beginning of the 2000s, so it can be seen that U.S. companies have been
actively increasing overseas investment (Figure Column 9-1).
Figure Column 9-1 Changes in the number of U.S. overseas affiliates and in the balance of
overseas direct investment
Note: The banking business is excluded through 2008.
During the period from 2013 through 2014, the number of companies seems to have increased as the
capture rate increased. Preliminary values are used for 2016.
Source: U.S. Department of Commerce (BEA)
By the number of companies by industry type, manufacturing industries account for about 30% of
251 As of 2015, total assets of overseas affiliates of which more than 10% of voting rights are owned by
U.S. multinational companies were 3.3 trillion dollars, their sales were 3.0 trillion dollars, and the
number of their employees was 6.49 million. Among those, assets of MOFA (Majority Owned Foreign
Affiliates) of which more than half of voting rights are owned were 2.8 trillion dollars, their sales were
2.5 trillion dollars, and the number of their employees was 5.42 million, so each item accounts for
nearly 80% of the amount for all overseas affiliates. Here overseas affiliates of which more than half
of voting rights are owned are called “Overseas affiliates” or “Local affiliates.”
34.3 34.5
34.9
0
1,000
2,000
3,000
4,000
5,000
6,000
0
5
10
15
20
25
30
35
40
20
01
20
02
20
03
20
04
20
05
20
06
20
07
20
08
20
09
20
10
20
11
20
12
20
13
20
14
20
15
20
16
Whole world
Balance of direct investment (right axis)
(Thousand companies) (100 million dollars)

363
the total, and among manufacturing industries, companies of chemicals, computer/electronic
components-related, and machinery are actively developing overseas (Figure Column 9-2, Table
Column 9-3). Looking at non-manufacturing, the number of companies in the finance and insurance
industry is especially large, followed by wholesale trade and information and communications (Table
Column 9-3).
Figure Column 9-2 Share of the number of U.S. overseas affiliates by industry type (2016)
Note: Preliminary values are used for 2016.
Source: U.S. Department of Commerce (BEA)
Table Column 9-3 Number of U.S. overseas affiliates by industry type (2016)
(Unit: company)
Manufacturing industries 10,639
Chemicals 2,603
Computer/electronic components
1,560
Machinery 1,152
Transportation equipment 918
Others 4,406
Non-manufacturing industries 24,242
Mining 1,121
Wholesale trade 3,930
Retail trade 713
Information and communications
1,662
Finance/insurance 5,398
Professional skills 1,904
Others 9,514 Note: Preliminary values are used for 2016.
Source: U.S. Department of Commerce (BEA)
Mining
3%
Manufacturing
31%
Wholesale trade
11%
Retail trade
2%Information
5%
Finance and
insurance industry16%
Professional
skills5%
Others
27%

364
Looking at the changes of proportion of the number of companies in manufacturing industries and
non-manufacturing industries respectively, it can be seen that the proportion of manufacturing industries
accounting for almost 30% of the total has been remaining almost flat (Figure Column 9-4).252 From
the beginning of the 2000s the structure has been unchanged where non-manufacturing industries have
been accounting for nearly 70% of U.S. overseas affiliates (overseas affiliates).
Figure Column 9-4 Share of the number of U.S. overseas affiliates (Manufacturing/non-
manufacturing)
Note: The banking business is excluded through 2008.
During the period from 2013 through 2014, the number of companies seems to have increased as the
capture rate increased. Preliminary values are used for 2016.
Source: U.S. Department of Commerce (BEA)
Looking at the changes by industry type, among non-manufacturing industries, the number of
overseas affiliates in the information and communications industry has been increasing recently (1,480
companies in 2014 → 1,662 companies in 2016). On the other hand, the number of affiliates in
finance/insurance and wholesale trade, both of which account for large numbers of affiliates, has been
remaining almost flat from the previous year (Figure Column 9-5).
252 Compared with the data in 2008, the rate has slightly decreased, but it seems that this is largely due to
the change of released data. Specifically, the number of companies including banking business
(deposit business) which had not been included before has been indicated since 2009.
0%
10%
20%
30%
40%
50%
60%
70%
80%
90%
100%
20
01
20
02
20
03
20
04
20
05
20
06
20
07
20
08
20
09
20
10
20
11
20
12
20
13
20
14
20
15
20
16
Non-manufacturing Manufacturing
35%31%

365
Figure Column 9-5 Changes in the number of U.S. non-manufacturing overseas affiliates by
sector
Note: During the period from 2013 through 2014, the number of affiliates seems to have increased as the
capture rate increased.
According to alteration of data, finance/insurance data are displayed from 2010.
Preliminary values are used for 2016.
Source: U.S. Department of Commerce (BEA)
Looking by manufacturing sector, the number of affiliates in chemicals has been increasing (2,495
companies in 2014 2,603 companies in 2016); on the other hand, the number in other sectors has
been remaining almost flat (Figure Column 9-6).
0
1,000
2,000
3,000
4,000
5,000
6,000
Finance and
insurance
Wholesale trade Professional
skills
Information and
communications
Mining Retail trade
2002 2006 2010 2012
2014 2015 2016
(Companies)

366
Figure Column 9-6 Changes in the number of U.S. manufacturing overseas affiliates by sector
Note: During the period from 2013 through 2014, the number of affiliates seems to have increased as the
capture rate increased.
Preliminary values are used for 2016.
Source: U.S. Department of Commerce (BEA)
Further, looking by location region, nearly 17 thousand affiliates, almost 50% of total U.S. overseas
affiliates, are located in Europe. Following Europe, a large number of affiliates are located in the Asia
Pacific region, nearly twice the number of affiliates in Central and South America (Figure Column 9-7).
0
500
1,000
1,500
2,000
2,500
3,000
Chemicals General machinery Computer andelectronic components
Electrical machineryand home electric
appliances
Transportationequipment
2002 2006 2010 2012
2014 2015 2016
(Companies)

367
Figure Column 9-7 Changes in the number of U.S. overseas affiliates by location region
Note: The banking business is excluded through 2008.
During the period from 2013 through 2014, the number of affiliates seems to have sharply increased
as the capture rate increased owing the expansion of investigation scope. Preliminary values are used
for 2016.
Source: U.S. Department of Commerce (BEA)
Looking at the number of affiliates by country, as of 2001, the number in the U.K. was remarkably
large, followed by Canada, the Netherlands, and Germany. Among Asian countries, the number in Japan
was the most and the next was China (Figure Column 9-8). Looking at most recently (as of 2016),
although the number of affiliates in U.K. remained the highest, the difference from other countries is
being reduced. Focusing on Asia, the number of affiliates located in China increased to more than twice
that as of 2001 and became the highest among Asian countries (Figure Column 9-9).
0
5
10
15
20
25
30
35
40
2001 2002 2003 2004 2005 2006 2007 2008 2009 2010 2011 2012 2013 2014 2015 2016
Whole world Europe Central and South America
Africa Middle East Asia-Pacific region
China
(Thousand companies)
Global
financial crisis
IT
bubble

368
Figure Column 9-8 Development by location region of U.S. overseas affiliates (2001)
Note: Asian countries colored red.
Source: U.S. Department of Commerce (BEA)
Figure Column 9-9 Development by location region of U.S. overseas affiliates (2016)
Note: Asian countries colored red. Preliminary values are used for 2016.
Source: U.S. Department of Commerce (BEA)
0.0
0.5
1.0
1.5
2.0
2.5
3.0U
.K.
Canada
Germ
any
Neth
erl
and
s
Fra
nce
Mex
ico
Au
stra
lia
Italy
Japan
Bra
zil
Belg
ium
Sp
ain
Ch
ina
Sw
itzer
land
Sin
gapo
re
Irela
nd
Sw
eden
Berm
ud
a co
un
trie
s
Cari
bb
ean
co
untr
ies
Repu
bli
c o
f K
ore
a
India
Lu
xem
bo
urg
(Thousand companies)
0.0
0.5
1.0
1.5
2.0
2.5
3.0
3.5
4.0
4.5
U.K
.
Canada
Neth
erl
and
s
Germ
any
Ch
ina
Cari
bb
ean
co
untr
ies
Fra
nce
Lu
xem
bo
urg
Mex
ico
Au
stra
lia
Irela
nd
Bra
zil
Sin
gapo
re
Japan
Sw
itzer
land
Italy
Berm
ud
a co
un
trie
s
Sp
ain
Belg
ium
India
Sw
eden
Repu
bli
c o
f K
ore
a
(Thousand companies)

369
(2) Sales and sales destination
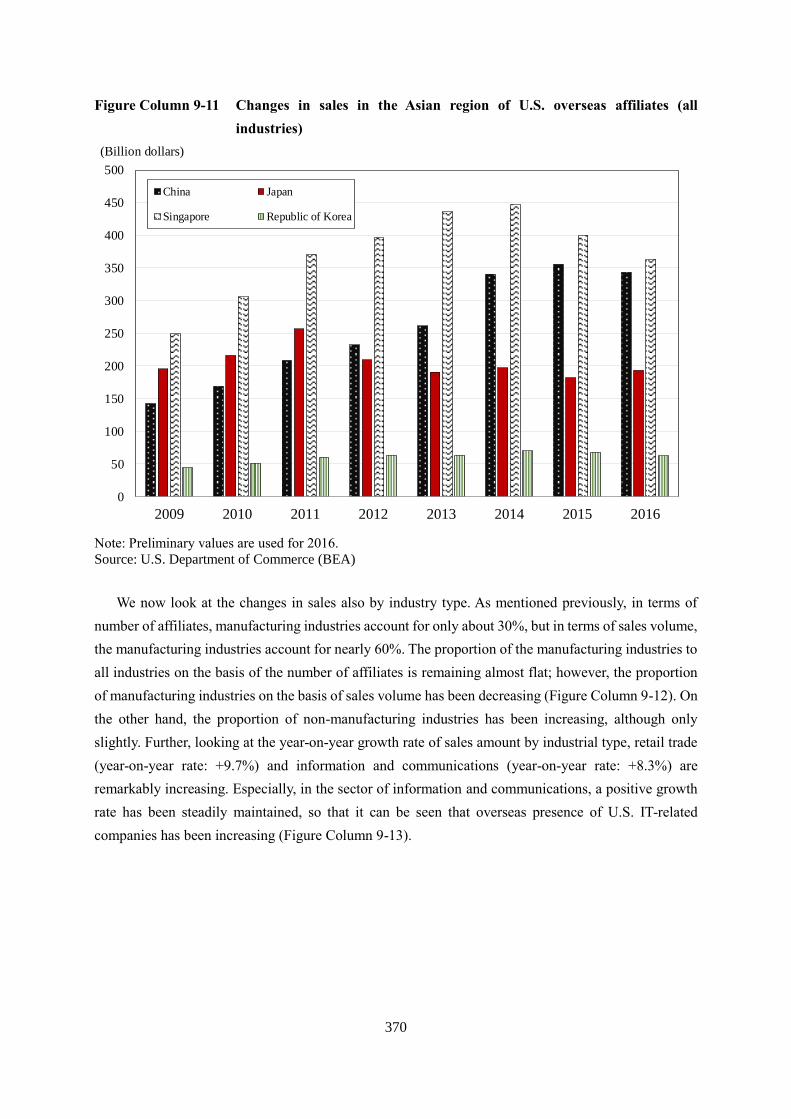
Next, looking at gross sales of affiliates (all industries), although it maintained an upward trend until
2014, it is seen to have been decreasing recently (Figure Column 9-10). Looking by country, Singapore,
which indicates the highest sales volume in Asia, has been showing a decrease since its peak in 2014,
and sales of affiliates located in our country hit its ceiling in 2011, when the Great East Japan Earthquake
occurred. On the other hand, although sales of affiliates located in China decreased recently, in the long
term it has been steadily increasing, and it can be said that the importance of affiliates located in China
is increasing (Figure Column 9-11).
Figure Column 9-10 Changes in sales by region of U.S. overseas affiliates (all industries)
Source: U.S. Department of Commerce (BEA)
0
1,000
2,000
3,000
4,000
5,000
6,000
7,000
2009 2010 2011 2012 2013 2014 2015 2016
Europe Latin America Africa
Middle East Asia-Pacific region Total sales amount
(Billion dollars)
370
Figure Column 9-11 Changes in sales in the Asian region of U.S. overseas affiliates (all
industries)
Note: Preliminary values are used for 2016.
Source: U.S. Department of Commerce (BEA)
We now look at the changes in sales also by industry type. As mentioned previously, in terms of
number of affiliates, manufacturing industries account for only about 30%, but in terms of sales volume,
the manufacturing industries account for nearly 60%. The proportion of the manufacturing industries to
all industries on the basis of the number of affiliates is remaining almost flat; however, the proportion
of manufacturing industries on the basis of sales volume has been decreasing (Figure Column 9-12). On
the other hand, the proportion of non-manufacturing industries has been increasing, although only
slightly. Further, looking at the year-on-year growth rate of sales amount by industrial type, retail trade
(year-on-year rate: +9.7%) and information and communications (year-on-year rate: +8.3%) are
remarkably increasing. Especially, in the sector of information and communications, a positive growth
rate has been steadily maintained, so that it can be seen that overseas presence of U.S. IT-related
companies has been increasing (Figure Column 9-13).
0
50
100
150
200
250
300
350
400
450
500
2009 2010 2011 2012 2013 2014 2015 2016
China Japan
Singapore Republic of Korea
(Billion dollars)

371
Figure Column 9-12 Sales share of U.S. overseas affiliates (by industry type of parent
company)253
Note: Preliminary values are used for 2016.
Because some items of data of affiliates by industry type were undisclosed, we used data by industry
type of the parent company, of which data were obtainable for main industries.
Source: U.S. Department of Commerce (BEA)
253 Because some items of sales data of affiliates in main industry types were undisclosed, we used data
by industry type of parent company, of which data were obtainable for main industry types.
0%
10%
20%
30%
40%
50%
60%
70%
80%
90%
100%
2010 2011 2012 2013 2014 2015 2016
Manufacturing Mining Wholesale trade Retail trade
Information Finance and insurance Professional skills Others
Manufacturing
Non-
manufacturing
69%62%

372
Figure Column 9-13 Sales growth rate of U.S. overseas affiliates (by industry type of parent
company)
Note: Preliminary values are used for 2016.
Source: U.S. Department of Commerce (BEA)
As stated earlier, although the proportion of sales of manufacturing industries to entire sales has been
gradually decreasing, the manufacturing industries retain great importance and as big an influence on
employment, etc. as ever, so we examine manufacturing industries in more detail in the following.
Looking at the changes in sales of manufacturing affiliates, while the sales of overseas affiliates located
in Europe has been showing ups and downs since 2009, overseas affiliates located in the Asia-Pacific
region have basically maintained the upward trend (Figure Column 9-14).
-30%
-20%
-10%
0%
10%
20%
30%
40%
50%
2011 2012 2013 2014 2015 2016
Manufacturing Mining Wholesale trade
Retail trade Information Finance and insurance
Professional skills Others

373
Figure Column 9-14 Changes in sales by location region of U.S. manufacturing overseas
affiliates
Note: Preliminary values are used for 2016.
Source: U.S. Department of Commerce (BEA)
Looking at the sales destination, domestic sales within the location country of overseas affiliates in
Europe are on nearly the same scale as their sales to third countries, and their sales to the U.S. are
relatively small. Also, in case of the sales of affiliates in the Asia-Pacific region, total sales of which are
large following Europe, it can be seen that sales to the U.S. account for nearly 10% and domestic sales
within the location country account for a large share.
On the other hand, the sales to the U.S. maintain relatively large share in total sales volume of
affiliates in countries in the NAFTA region, Central and South America, etc., which are geographically
close to the U.S. (Figure Column 9-15).
0
2,000
4,000
6,000
8,000
10,000
12,000
14,0002
00
1
200
2
200
3
200
4
200
5
200
6
200
7
200
8
200
9
201
0
201
1
201
2
201
3
201
4
201
5
201
6
Europe Latin America Africa Middle East Asia-Pacific region
(100 million dollars)

374
Figure Column 9-15 Sales of U.S. manufacturing overseas affiliates (2016)
Note: NAFTA means Mexico and Canada. Preliminary values are used for 2016.
Source: Bureau of Economic Analysis
Additionally, the changes in the proportion to total sale of sales within the location country, sales to
third countries, and sales to the U.S. are displayed in Figure Column 9-16, Figure Column 9-17, Figure
Column 9-18, and Figure Column 9-19. First, we look at the sales destination of affiliates in Europe
whose total sales are the most. As stated above, the proportion of sales within the location country and
the proportion of sales to the third countries are in balance with each other, and from a long-term view,
the share of sales to the location country has been declining (Figure Column 9-16).

375
Figure Column 9-16 Changes in share of sales destination of U.S. manufacturing affiliates (in
Europe)
Note: Preliminary values are used for 2016.
Source: U.S. Department of Commerce (BEA)
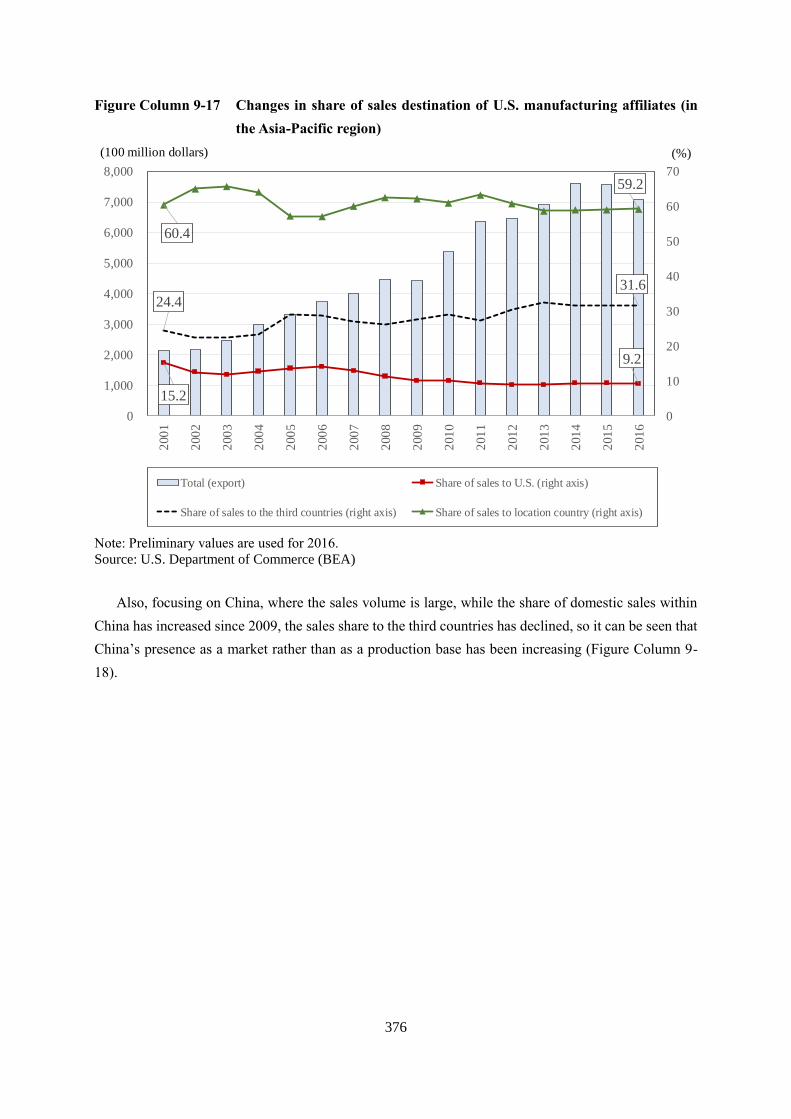
In the case of shares of sales destination of affiliates located in the Asia-Pacific region, while the
proportion of sales to the location country is remaining almost flat, the proportion of sales to third
countries has been increasing. The proportion of sales to the U.S. can be said to be on a decreasing trend
(Figure Column 9-17).
7.1 8.7
41.5
45.7 51.4
45.7
0
10
20
30
40
50
60
0
2,000
4,000
6,000
8,000
10,000
12,000
14,0002
00
1
200
2
200
3
200
4
200
5
200
6
200
7
200
8
200
9
201
0
201
1
201
2
201
3
201
4
201
5
201
6
Total (export) Share of sales to U.S. (right axis)
Share of sales to the third countries (right axis) Share of sales to location country (right axis)
(100 million dollars) (%)
376
Figure Column 9-17 Changes in share of sales destination of U.S. manufacturing affiliates (in
the Asia-Pacific region)
Note: Preliminary values are used for 2016.
Source: U.S. Department of Commerce (BEA)
Also, focusing on China, where the sales volume is large, while the share of domestic sales within
China has increased since 2009, the sales share to the third countries has declined, so it can be seen that
China’s presence as a market rather than as a production base has been increasing (Figure Column 9-
18).
15.2
9.2
24.4
31.6
60.4
59.2
0
10
20
30
40
50
60
70
0
1,000
2,000
3,000
4,000
5,000
6,000
7,000
8,0002
00
1
200
2
200
3
200
4
200
5
200
6
200
7
200
8
200
9
201
0
201
1
201
2
201
3
201
4
201
5
201
6
Total (export) Share of sales to U.S. (right axis)
Share of sales to the third countries (right axis) Share of sales to location country (right axis)
(100 million dollars) (%)

377
Figure Column 9-18 Changes in share of sales destination of U.S. manufacturing affiliates (in
China)
Note: Preliminary values are used for 2016.
Source: U.S. Department of Commerce (BEA)
On the other hand, in case of affiliates located in the Central and South America region, which is
geographically close to the U.S., the sales share to the U.S., the sales share to the location country, and
the sales share to the third countries have been remaining almost flat, and the composition of sales
destination has remained unchanged. However, the proportion of exports to the U.S. is relatively large
because of lower transportation cost compared with other regions (Figure Column 9-19).
63.2
78.7
12.7 6.7
24.1
14.5
0
10
20
30
40
50
60
70
80
90
0
500
1,000
1,500
2,000
2,5002
00
1
200
2
200
3
200
4
200
5
200
6
200
7
200
8
200
9
201
0
201
1
201
2
201
3
201
4
201
5
201
6
Total (export) Share of sales to location country (right axis)
Share of sales to U.S. (right axis) Share of sales to the third countries (right axis)
(100 million dollars) (%)

378
Figure Column 9-19 Changes in share of sales destination of U.S. manufacturing affiliates (in
Central and South America)
Note: Preliminary values are used for 2016.
Source: U.S. Department of Commerce (BEA)
Further, we focus on affiliates located in China, where the number and sales of affiliates have been
growing. The horizontal axis indicates the proportion of export volume to the U.S. to total sales amount
of overseas affiliates located in China, the vertical axis indicates the proportion of procurement from the
U.S., and the size of a circle indicates the total sales volume in Figure Column 9-20. First, focusing on
sales scale, it can be seen that sales of computer/electronic components, chemicals, transportation
equipment, etc. are large. The industry types of large proportion of export to the U.S. are electrical
machinery, computer/electronic components, etc. Further, in the case of the proportion of imports from
the U.S. to total sales (procurement rate from U.S.), the proportion of transportation equipment is large.
23.0 21.1
62.3 62.1
14.6 16.8
0
10
20
30
40
50
60
70
80
0
5
10
15
20
25
30
35
40
200
1
200
2
200
3
200
4
200
5
200
6
200
7
200
8
200
9
201
0
201
1
201
2
201
3
201
4
201
5
201
6
Total (export) Share of sales to U.S. (right axis)
Share of sales to location country (right axis) Share of sales to the third countries (right axis)
(100 million dollars) (%)

379
Figure Column 9-20 Exports to U.S. of U.S. manufacturing affiliates in China (2016)
Note: The size reflects total sales amount in China. Preliminary values are used for 2016.
Source: U.S. Department of Commerce (BEA)
Looking at the long-term transition, the proportion of exports to the U.S. to total sales amount has
continued to be on a declining trend since 2008 (Figure Column 9-21). Since the global financial crisis,
there is possibility that the presence of the U.S. market for U.S. manufacturing affiliates located in China
has been weakening. Also, the proportion of the procurement amount from the U.S. to total sales has
continued to be on a downward trend although it increased temporarily in 2010, so it can be said that
the ability to procure within the located country without importing from the U.S. has increased from
before.
Chemicals
Metal products
Machinery
Computer and electronic
components
Electrical
machinery
Transportation
equipment
0%
1%
2%
3%
4%
5%
6%
7%
8%
9%
0% 2% 4% 6% 8% 10% 12% 14% 16%
Pro
po
rtio
n o
f im
po
rt f
rom
U.S
. ag
ainst
to
tal
sale
s am
ou
nt
Proportion of export to U.S. against total sales amount

380
Figure Column 9-21 The proportions of procurement amount from U.S. and export volume to
U.S., to total sales volume (U.S. manufacturing affiliates in China)
Note: Preliminary values are used for 2016.
Source: U.S. Department of Commerce (BEA)
7.9%
3.7%
12.7%
6.7%
0.0%
2.0%
4.0%
6.0%
8.0%
10.0%
12.0%
14.0%2
00
1
200
2
200
3
200
4
200
5
200
6
200
7
200
8
200
9
201
0
201
1
201
2
201
3
201
4
201
5
201
6
Proportion of procurement amount against total sales
Proportion of export to U.S. against total sales
Global
financial crisis