Embed Size (px)
Citation preview
9/22/2017
1
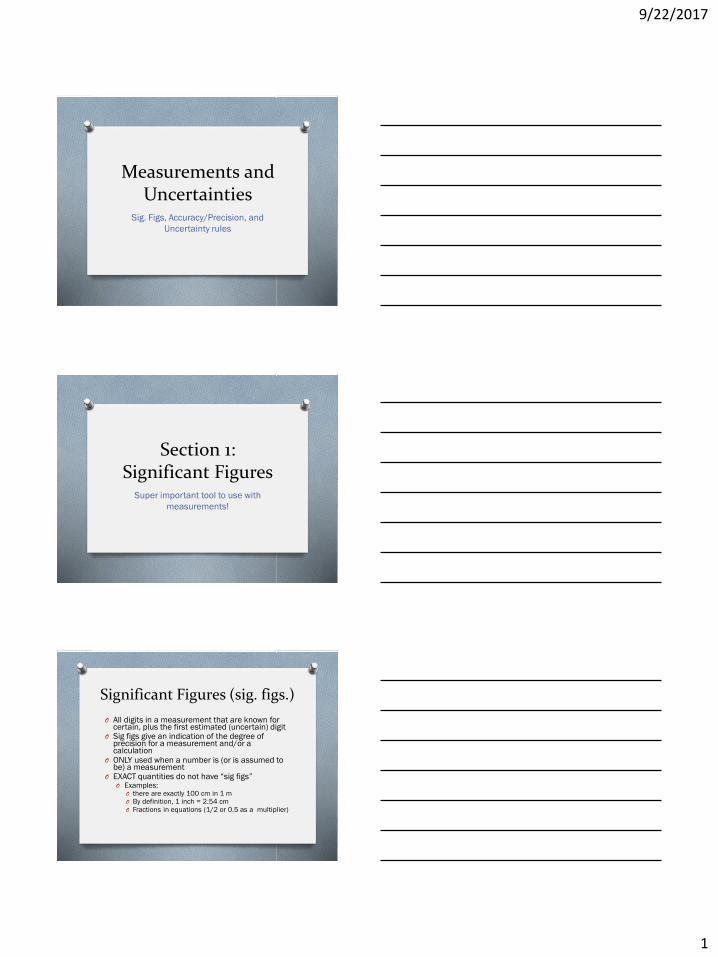
Measurements and Uncertainties
Sig. Figs, Accuracy/Precision, and
Uncertainty rules
Section 1: Significant Figures
Super important tool to use with
measurements!
Significant Figures (sig. figs.)
O All digits in a measurement that are known for certain, plus the first estimated (uncertain) digit
O Sig figs give an indication of the degree of precision for a measurement and/or a calculation
O ONLY used when a number is (or is assumed to be) a measurement
O EXACT quantities do not have “sig figs”O Examples:
O there are exactly 100 cm in 1 mO By definition, 1 inch = 2.54 cmO Fractions in equations (1/2 or 0.5 as a multiplier)
9/22/2017
2
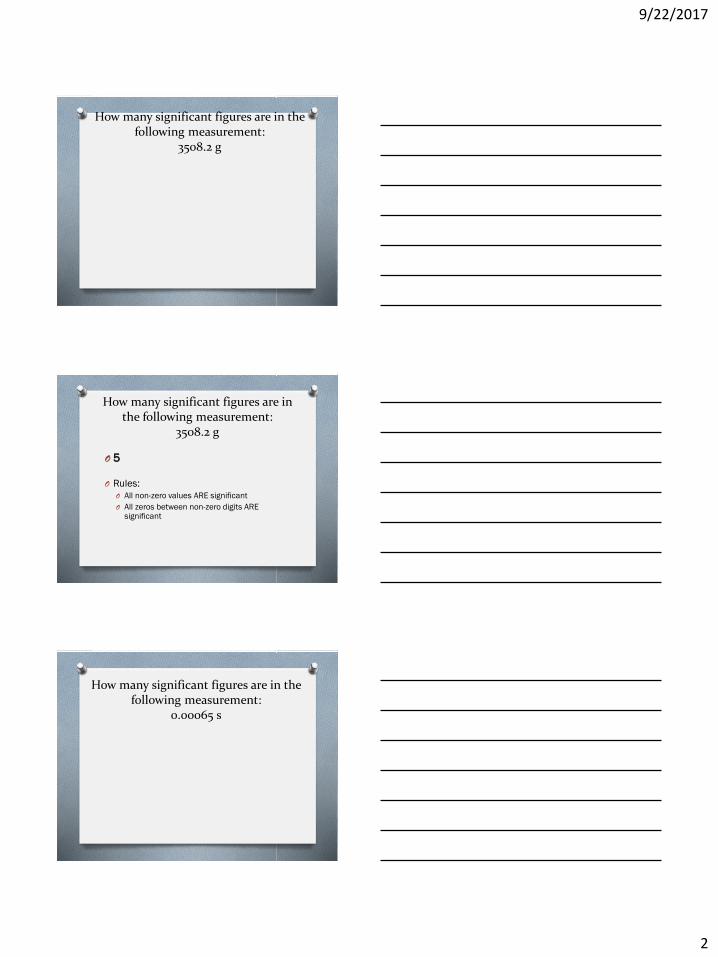
How many significant figures are in the following measurement:
3508.2 g
How many significant figures are in the following measurement:
3508.2 g
O 5
O Rules:
O All non-zero values ARE significant
O All zeros between non-zero digits ARE significant
How many significant figures are in the following measurement:
0.00065 s
9/22/2017
3
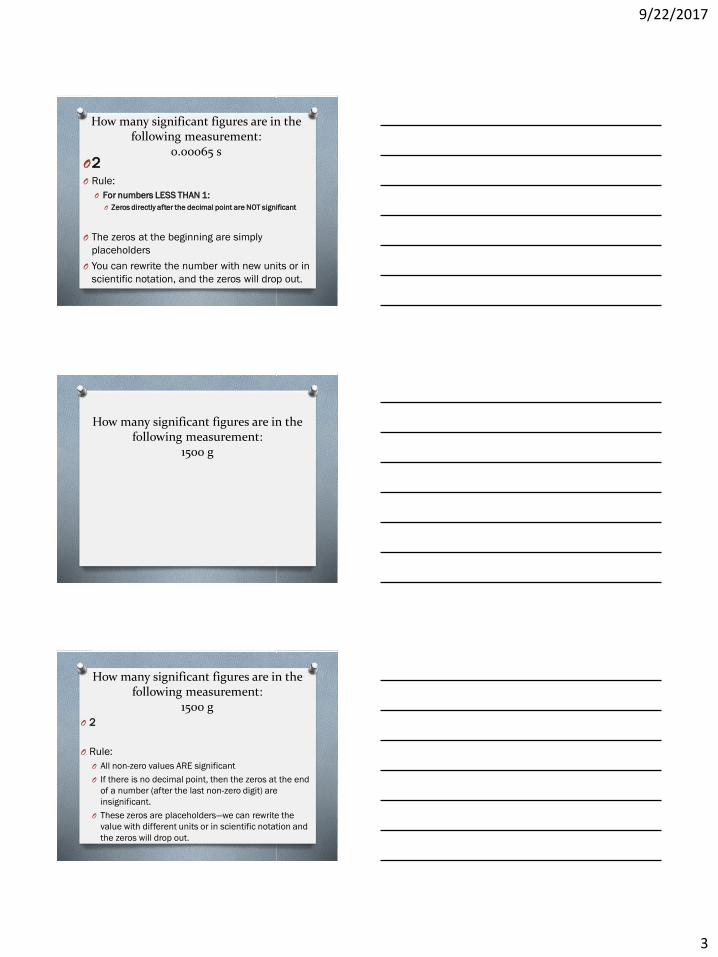
How many significant figures are in the following measurement:
0.00065 sO2O Rule:
O For numbers LESS THAN 1:
O Zeros directly after the decimal point are NOT significant
O The zeros at the beginning are simply
placeholders
O You can rewrite the number with new units or in
scientific notation, and the zeros will drop out.
How many significant figures are in the following measurement:
1500 g
How many significant figures are in the following measurement:
1500 gO 2
O Rule:
O All non-zero values ARE significant
O If there is no decimal point, then the zeros at the end
of a number (after the last non-zero digit) are
insignificant.
O These zeros are placeholders—we can rewrite the
value with different units or in scientific notation and
the zeros will drop out.
9/22/2017
4
How many significant figures are in the following measurement:
0.007250 W
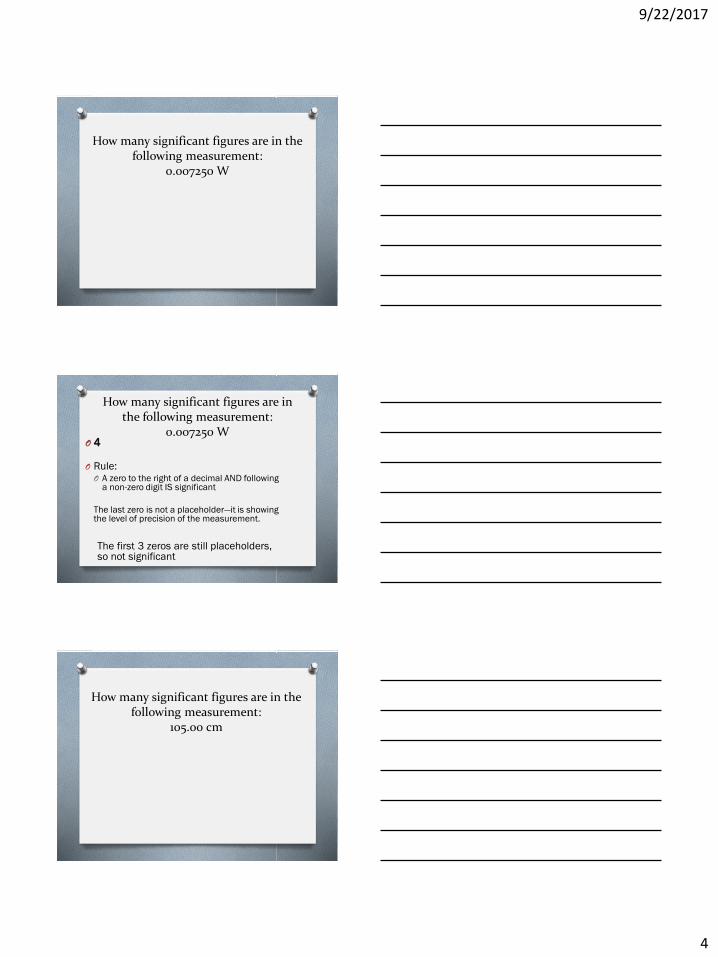
How many significant figures are in the following measurement:
0.007250 WO 4
O Rule:O A zero to the right of a decimal AND following
a non-zero digit IS significant
The last zero is not a placeholder—it is showing the level of precision of the measurement.
The first 3 zeros are still placeholders, so not significant
How many significant figures are in the following measurement:
105.00 cm
9/22/2017
5
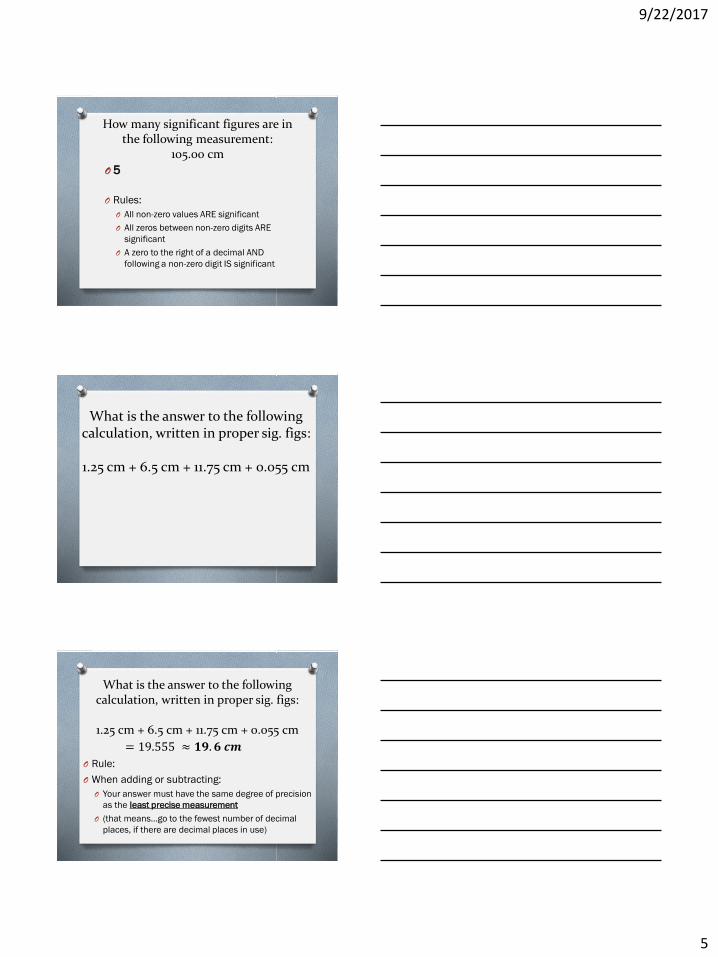
How many significant figures are in the following measurement:
105.00 cm
O 5
O Rules:
O All non-zero values ARE significant
O All zeros between non-zero digits ARE
significant
O A zero to the right of a decimal AND
following a non-zero digit IS significant
What is the answer to the following calculation, written in proper sig. figs:
1.25 cm + 6.5 cm + 11.75 cm + 0.055 cm
What is the answer to the following calculation, written in proper sig. figs:
1.25 cm + 6.5 cm + 11.75 cm + 0.055 cm
O Rule:
O When adding or subtracting:
O Your answer must have the same degree of precision
as the least precise measurement
O (that means…go to the fewest number of decimal
places, if there are decimal places in use)
= 19.555 ≈ 𝟏𝟗. 𝟔 𝒄𝒎
9/22/2017
6
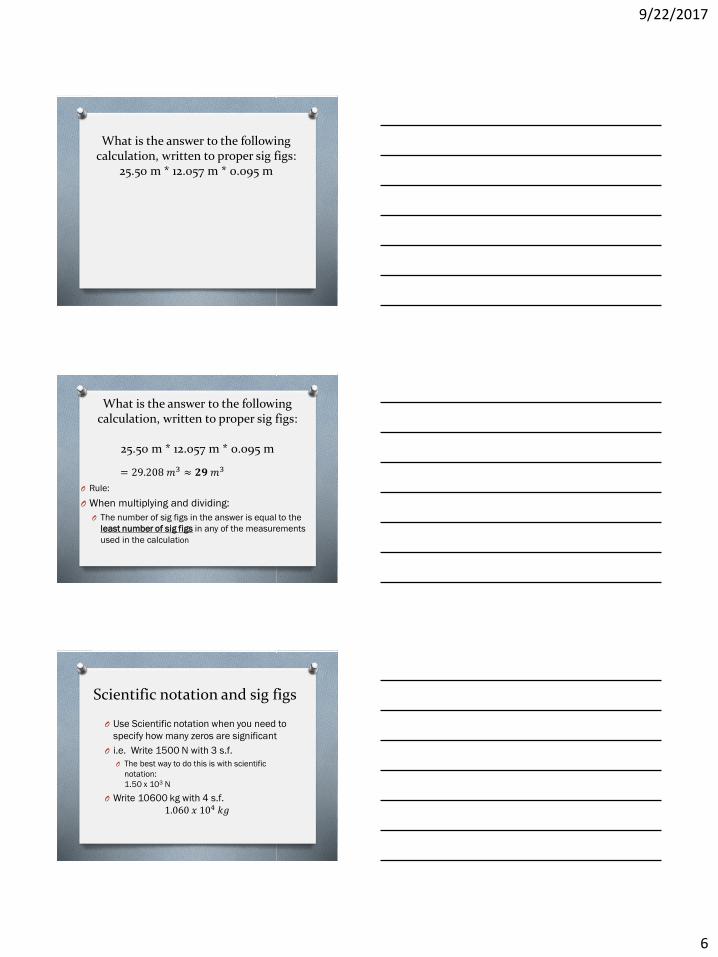
What is the answer to the following calculation, written to proper sig figs:
25.50 m * 12.057 m * 0.095 m
What is the answer to the following calculation, written to proper sig figs:
25.50 m * 12.057 m * 0.095 m
O Rule:
O When multiplying and dividing:
O The number of sig figs in the answer is equal to the
least number of sig figs in any of the measurements
used in the calculation
= 29.208 𝑚3 ≈ 𝟐𝟗 𝑚3
Scientific notation and sig figs
O Use Scientific notation when you need to
specify how many zeros are significant
O i.e. Write 1500 N with 3 s.f.
O The best way to do this is with scientific
notation:
1.50 x 10³ N
O Write 10600 kg with 4 s.f.
1.060 𝑥 104 𝑘𝑔
9/22/2017
7
Note on book problems:O Most of the problems in your book will have values which
look like they only have 1 s.f.
O Assume that all digits in book problems are significant
O i.e. if a problem says that an object has a mass of 100 kg,
please treat that as 3 s.f.
O As long as you don’t go overboard, don’t worry about sig figs
in your WebAssign problems—wait until the very end for any
rounding!
O We’ll be a lot pickier in your labs and quizzes/tests!
Section 2:Accuracy vs. Precision
Accuracy
Precision of a Measurement
Precision of a Data Set
O Accuracy of a measurement:
O An indication of how close the measurement is to the accepted value
O Percentage difference can be calculated to give a quantitative indication of a measurement’s accuracy—the smaller the percentage difference, the greater the accuracy
O Good accuracy is an indication of low systematic error.
Accuracy
9/22/2017
8
O An indication of how “exactly” you can measure a piece of data
O More precise measurements are those that are measured to a smaller increment of a unit of measure (i.e. more decimal places)
O Example: a thickness of wire measured with a meter stick will be precise to 0.01 cm; using a micrometer can increase the precision to 0.0001 cm
O ALWAYS use a measuring tool that will give you the most appropriate precision.
O Absolute uncertainty can be used to indicate the precision of your measurement
Precision of a Measurement
O an indication of the agreement among a
number of measurements made in the
same way (i.e. with the same measuring tool
and procedure)
O The more consistent your results are, the
higher the precision is
O High precision implies small amount of
random error
Precision of a Data Set
Journal—Mini-Lab
O Measurements to the correct precision using
an appropriate tool.
O Worksheet for this lab should be inserted in
your journal.
9/22/2017
9
Section 3:Types of Experimental
ErrorsRandom Errors
Systematic Errors
T&T: Which of these are “experimental errors”? Explain.
1. Misreading the scale on a triple-beam balance
2. Incorrectly transferring data from your rough data table to the final, typed, version in your report
3. Miscalculating results because you did not convert to the correct fundamental units
4. Miscalculations because you use the wrong equation
Are these “errors”?
O NONE of these are experimental errors
O They are MISTAKES
O What’s the difference?
O You need to check your work to make sure
these mistakes don’t occur…ask questions if
you need to (of your lab partner, me, etc.)
O Do NOT put mistakes in your error discussion
in the conclusion
9/22/2017
10
Types of Experimental Errors:O Random Errors:
O A result of variations in the performance of the instrument and/or the operator
O Do NOT consistently occur throughout a lab
O Some examples:
O Vibrations or air currents when measuring mass
O Inconsistent temperature (i.e. of the air) throughout a lab
O Irregularities in object being measured (i.e. the wire is not the same thickness at all points along its length)
O Reaction time when using a stopwatch
Types of Experimental Errors:
O So what can be done about random errors?
O Don’t rush through your measurements! Be
careful!
O Take as many trials as possible—the more
trials you do, the less likely one odd result will
impact your overall lab results
Types of Experimental Errors:O Systematic Errors:
O Errors that are inherent to the system or the measuring instrument
O Results in a set of data to be centered around a value that is different than the accepted value
O Some Examples:
O Non-calibrated (or poorly calibrated) measuring tools
O A “zero offset” on a measuring tool, requiring a “zero correction”
O A warped ruler—results in non-symmetrical divisions
9/22/2017
11
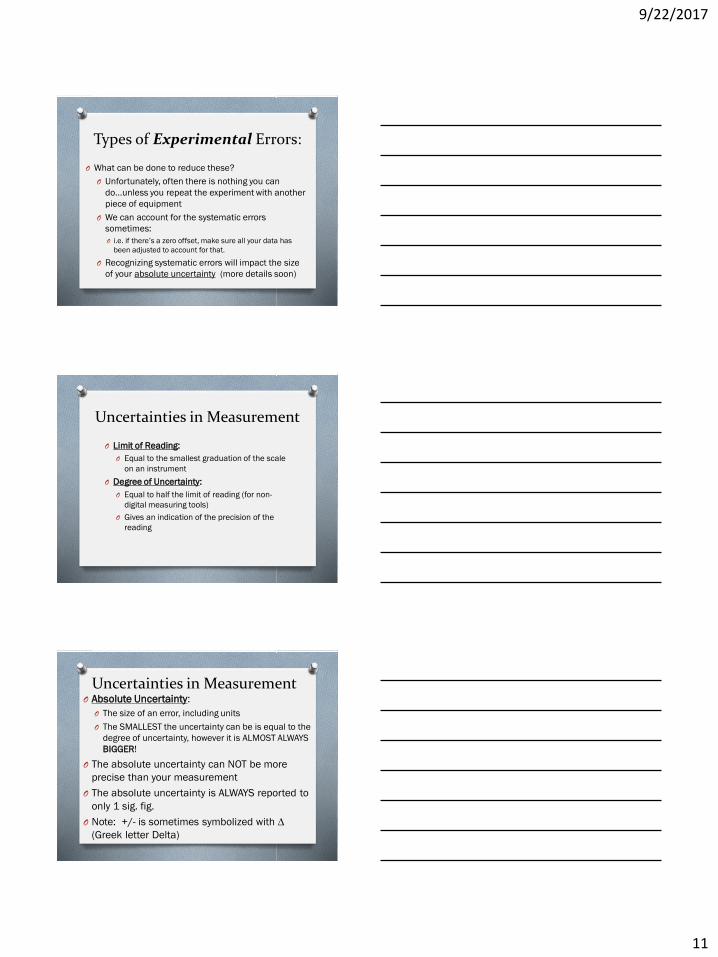
Types of Experimental Errors:
O What can be done to reduce these?
O Unfortunately, often there is nothing you can
do…unless you repeat the experiment with another
piece of equipment
O We can account for the systematic errors
sometimes:
O i.e. if there’s a zero offset, make sure all your data has
been adjusted to account for that.
O Recognizing systematic errors will impact the size
of your absolute uncertainty (more details soon)
Uncertainties in Measurement
O Limit of Reading:
O Equal to the smallest graduation of the scale
on an instrument
O Degree of Uncertainty:
O Equal to half the limit of reading (for non-
digital measuring tools)
O Gives an indication of the precision of the
reading
Uncertainties in MeasurementO Absolute Uncertainty:
O The size of an error, including units
O The SMALLEST the uncertainty can be is equal to the
degree of uncertainty, however it is ALMOST ALWAYS
BIGGER!
O The absolute uncertainty can NOT be more
precise than your measurement
O The absolute uncertainty is ALWAYS reported to
only 1 sig. fig.
O Note: +/- is sometimes symbolized with D
(Greek letter Delta)
9/22/2017
12
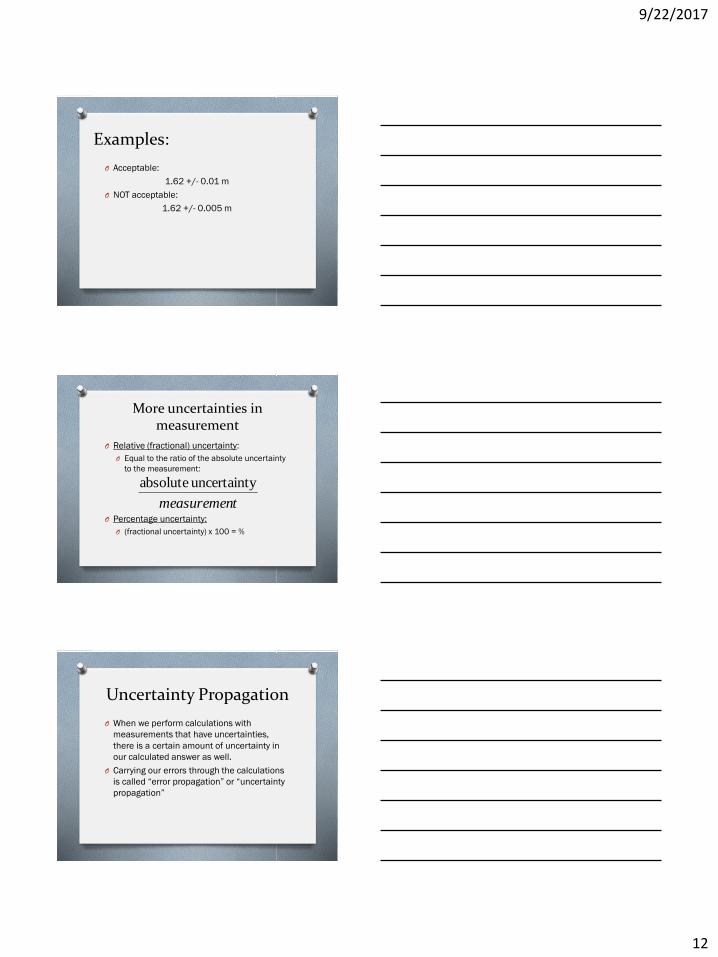
Examples:
O Acceptable:
1.62 +/- 0.01 m
O NOT acceptable:
1.62 +/- 0.005 m
More uncertainties in measurement
O Relative (fractional) uncertainty:
O Equal to the ratio of the absolute uncertainty
to the measurement:
O Percentage uncertainty:
O (fractional uncertainty) x 100 = %
tmeasuremen
yuncertaint absolute
Uncertainty Propagation
O When we perform calculations with
measurements that have uncertainties,
there is a certain amount of uncertainty in
our calculated answer as well.
O Carrying our errors through the calculations
is called “error propagation” or “uncertainty
propagation”
9/22/2017
13
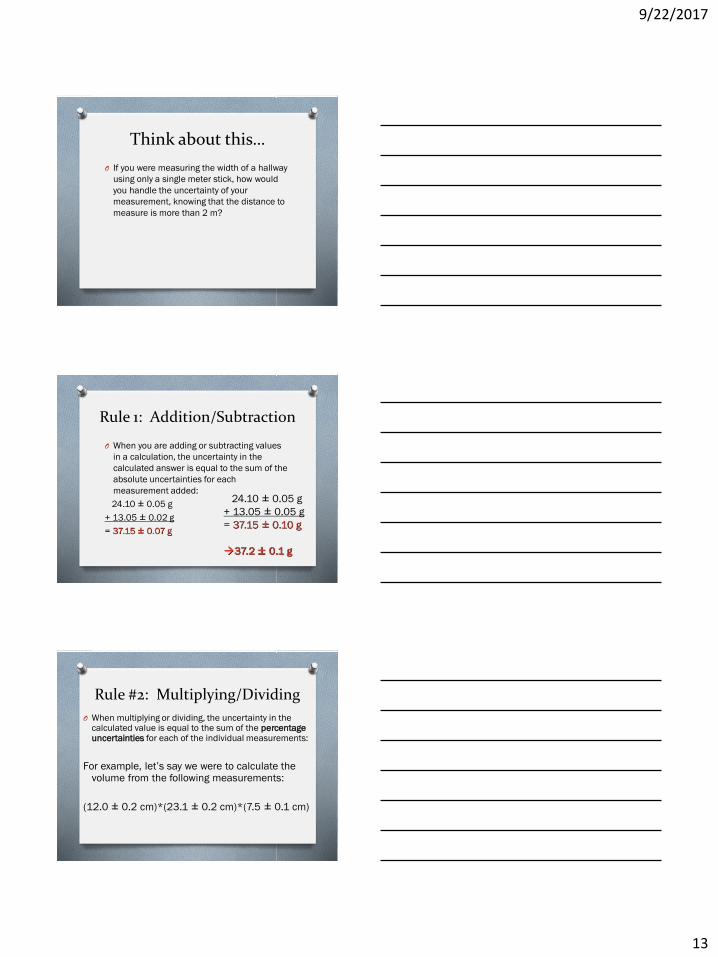
Think about this…
O If you were measuring the width of a hallway
using only a single meter stick, how would
you handle the uncertainty of your
measurement, knowing that the distance to
measure is more than 2 m?
Rule 1: Addition/Subtraction
O When you are adding or subtracting values
in a calculation, the uncertainty in the
calculated answer is equal to the sum of the
absolute uncertainties for each
measurement added:
24.10 ± 0.05 g
+ 13.05 ± 0.02 g
= 37.15 ± 0.07 g
24.10 ± 0.05 g
+ 13.05 ± 0.05 g
= 37.15 ± 0.10 g
37.2 ± 0.1 g
Rule #2: Multiplying/Dividing
O When multiplying or dividing, the uncertainty in the calculated value is equal to the sum of the percentage uncertainties for each of the individual measurements:
For example, let’s say we were to calculate the volume from the following measurements:
(12.0 ± 0.2 cm)*(23.1 ± 0.2 cm)*(7.5 ± 0.1 cm)
9/22/2017
14
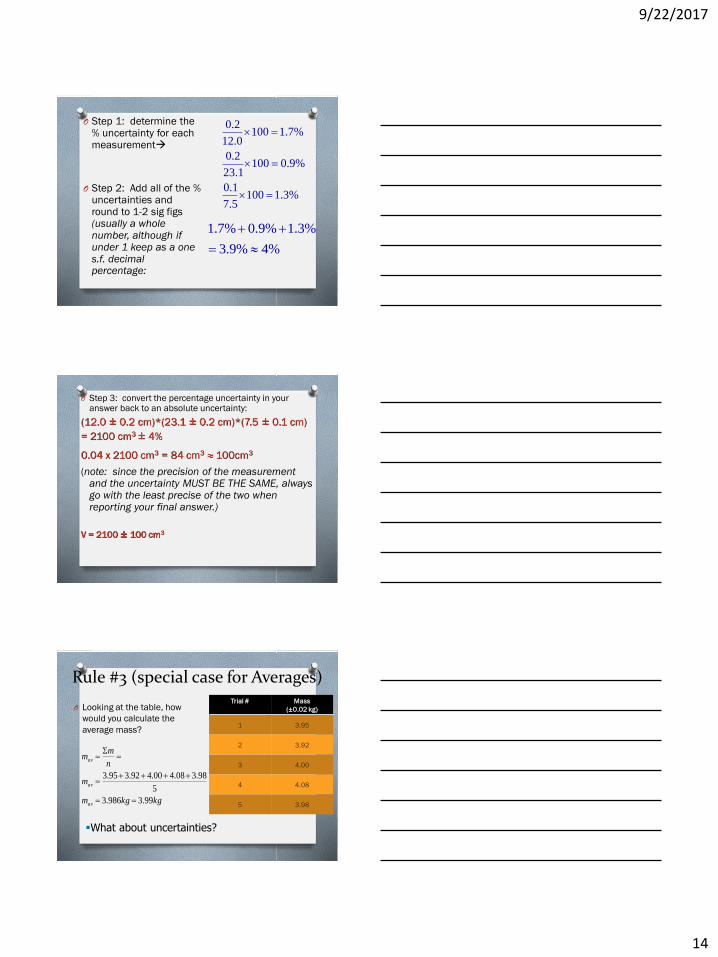
O Step 1: determine the % uncertainty for each measurement
O Step 2: Add all of the % uncertainties and round to 1-2 sig figs (usually a whole number, although if under 1 keep as a one s.f. decimal percentage:
0.2100 1.7%
12.0
0.2100 0.9%
23.1
0.1100 1.3%
7.5
1.7% 0.9% 1.3%
3.9% 4%
O Step 3: convert the percentage uncertainty in your answer back to an absolute uncertainty:
(12.0 ± 0.2 cm)*(23.1 ± 0.2 cm)*(7.5 ± 0.1 cm)
= 2100 cm3 ± 4%
0.04 x 2100 cm3 = 84 cm3 ≈ 100cm3
(note: since the precision of the measurement and the uncertainty MUST BE THE SAME, always go with the least precise of the two when reporting your final answer.)
V = 2100 ± 100 cm3
Rule #3 (special case for Averages)
O Looking at the table, how
would you calculate the
average mass?
Trial # Mass
(±0.02 kg)
1 3.95
2 3.92
3 4.00
4 4.08
5 3.98kgkgm
m
n
mm
av
av
av
99.3986.3
5
98.308.400.492.395.3
What about uncertainties?
9/22/2017
15
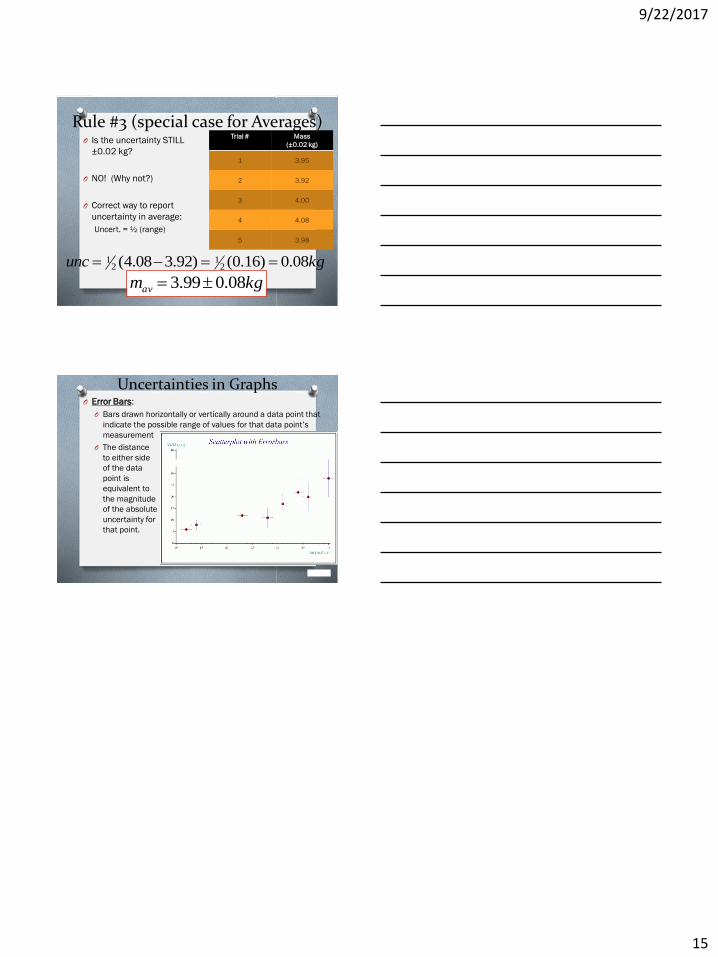
O Is the uncertainty STILL
±0.02 kg?
O NO! (Why not?)
O Correct way to report
uncertainty in average:
Uncert. = ½ (range)
Trial # Mass
(±0.02 kg)
1 3.95
2 3.92
3 4.00
4 4.08
5 3.98
Rule #3 (special case for Averages)
kgunc 08.0)16.0()92.308.4( 21
21
kgmav 08.099.3
Uncertainties in GraphsO Error Bars:
O Bars drawn horizontally or vertically around a data point that
indicate the possible range of values for that data point’s
measurement
O The distance
to either side
of the data
point is
equivalent to
the magnitude
of the absolute
uncertainty for
that point.